Article

Applying Circuit Theory and Risk Assessment Models to Evaluate High-Temperature Risks for Vulnerable Groups and Identify Control Zones

1
College of Landscape Architecture, Nanjing Forestry University, Nanjing 210037, China
2
Shanghai Academy Landscape Architecture Science and Planning, Shanghai 200232, China
3
College of Architecture and Urban Planning, Tongji University, Shanghai 200092, China
4
Landscaping Committee of the Science, Technology Commission of the Ministry of Housing and Urban-Rural Development, Beijing 100835, China
*
Authors to whom correspondence should be addressed.
Land 2025, 14(7), 1378; https://doi.org/10.3390/land14071378
Submission received: 28 April 2025 / Revised: 28 May 2025 / Accepted: 7 June 2025 / Published: 30 June 2025
(This article belongs to the Topic Ecological Protection and Modern Agricultural Development)

Abstract

Rapid urban development has exacerbated heat events. Vulnerable groups, due to deficiencies in physical functions and social support, often face higher health risks and survival pressures during heat events. Effectively identifying and assessing the heat risks they face and developing effective management strategies still pose many challenges. This study develops a heat risk assessment model based on the “hazard–accessibility–vulnerability” framework, incorporating circuit theory modeling to assess the health benefits of ventilation corridors for vulnerable populations and identifying high-temperature risk areas to better support science-based planning. The results show the following: (1) The urban heat island levels in the study area were classified based on the mean-standard deviation method, identifying that high-level heat islands account for 14.2% of the total area, with surface temperatures in urban built-up areas being significantly higher than in rural areas. (2) Based on the circuit theory model, 54 ventilation corridors were identified and 12 major corridors and 42 minor corridors were determined. (3) Based on the thermal risk assessment model, five residential areas covering 1.45 km2 were identified as having the highest thermal risk, and 5.68 km2 of residential areas had an imbalance between the ventilation demand and ventilation supply for vulnerable populations. This study innovatively assesses the health benefits of urban ventilation corridors from a social equity perspective and proposes urban renewal strategies such as introducing ventilation corridors, adjusting building layouts, enhancing green infrastructure, and promoting cooling technologies, offering new insights for future research.

1. Introduction

Humanism, as an ideology centered on human beings, emphasizes the relationship between humans and nature as well as the relationships among humans themselves [1]. This ideology has been deeply embedded in the historical trajectory of urban development. In the current stage of urban planning and development, humanism plays a guiding role, prioritizing high-quality growth, equal opportunities for development, comprehensive planning, and the sharing of its outcomes. The focus of urban planning should therefore be on serving all social groups, including disadvantaged populations [2].
Today, high-density and large-scale construction in cities has significantly increased the presence of heat-retaining materials and impermeable surfaces [3], which severely impact the regional climate by forming inversion layers, obstructing air circulation, hindering pollutant dispersion [4], triggering urban heat waves, and exacerbating the heat island effect. These developments have heightened the health risks posed by high temperatures to urban residents [5]. Vulnerable groups such as the elderly (age ≥ 65), children (age ≤ 5), those with chronic illnesses, and the physically frail face a heightened risk in high-temperature environments [6,7]. Their weaker physiological capacity makes it more difficult for them to cope with or recover from heat-related harm [8,9,10]. Mitigating the urban heat island effect, reducing high-temperature risks for vulnerable populations, improving residents’ well-being [11], and shaping a healthier, more pleasant urban environment have become key topics for scholars globally in addressing urban issues [12,13,14].
Both domestic and international studies, along with practical applications, have demonstrated that constructing urban ventilation corridors is an effective strategy for mitigating the urban heat island effect [15]. At the city-wide scale, commonly used methods for constructing ventilation corridors include boundary layer wind tunnel experiments, computer-based numerical simulations, such as the Weather Research and Forecasting model (WRF) [16,17,18] and Computational Fluid Dynamics (CFD) [19,20], and simulations based on Geographic Information Systems (GISs) [21,22,23]. GIS-based ventilation corridor identification, typically using the least-cost path (LCP) model [24], has become the mainstream method due to its efficiency and accuracy [25]. However, airflow does not always follow the path with the lowest cumulative wind resistance as assumed by the LCP model. When encountering “branch nodes”, airflow may still pass through paths with higher resistance, meaning the LCP model has yet to provide a quantitative analysis of the entire “airflow” domain [26].
Recent studies have shown that circuit theory can overcome the limitations of the LCP method by modeling air pressure, flow, and resistance analogously to voltage, current, and electrical resistance. Circuit theory from physics was first introduced into landscape ecology to simulate potential functional connectivity corridors within eco-systems [27]. Since then, numerous scholars both in China and abroad have applied circuit theory to various fields, including species migration corridors [28,29] and urban ecological network construction [30,31,32]. The use of this method has significantly enhanced the scientific basis and applicability of ecological corridor identification. Xie et al. [33] were the first to apply circuit theory to the identification of urban ventilation corridors in Wuhan. Although this theory cannot directly generate the specific forms of ventilation corridors, it can identify areas with high current intensity, allowing the prediction of potential spatial distribution patterns of urban ventilation corridors. The distribution of current density reveals the possibility of multiple pathways, better reflecting the randomness and redundancy of airflow migration [34,35].
While significant progress has been made in the technical construction of ventilation corridors, evaluating their health benefits is a challenge, particularly for vulnerable urban populations such as the elderly and children. The Fifth Assessment Report of the United Nations Intergovernmental Panel on Climate Change (IPCC) proposed a climate change risk assessment framework based on “hazard, exposure, and vulnerability” [36]. Within this framework, many scholars have conducted vulnerability assessments related to heatwaves and high temperatures [37,38,39], but most focus on the macro level of cities and regions [40]. There is relatively little research on health risk assessments for individuals, and few studies incorporate the fairness of vulnerable groups’ access to fresh, cool air as a research indicator. This study takes the framework of the IPCC as a reference; introduces the accessibility indicator, which is commonly used to assess whether the supply of urban green spaces is equitable and just for different urban populations in the field of landscape ecology [41,42,43,44,45,46], while in this study it specifically refers to the ease or difficulty with which vulnerable groups can access fresh, clean cold air through ventilation corridors; and identifies areas with a heat risk with the help of the GIS spatial analysis tool. It will help governments and social organizations more effectively implement heat health protection and emergency response measures, thereby significantly reducing the socio-economic losses and health hazards caused by high temperatures.
Using Minhang District in Shanghai as a case study, this research focuses on three key aspects: (1) using Landsat data to analyze surface temperature and identify heat-endangered urban spaces; (2) applying circuit theory and ventilation resistance coefficients to construct urban canopy ventilation corridors in Minhang and analyzing their characteristics; (3) using neighborhood data and population profiles to identify the distribution of vulnerable groups prone to heat-related risks and assessing their accessibility to fresh air through ventilation corridors. This study contributes a novel hazard–accessibility–vulnerability framework to evaluate the health benefits of urban ventilation corridors for vulnerable populations, integrating circuit theory with spatial analysis to support equitable and climate-resilient urban planning.

2. Materials and Methods
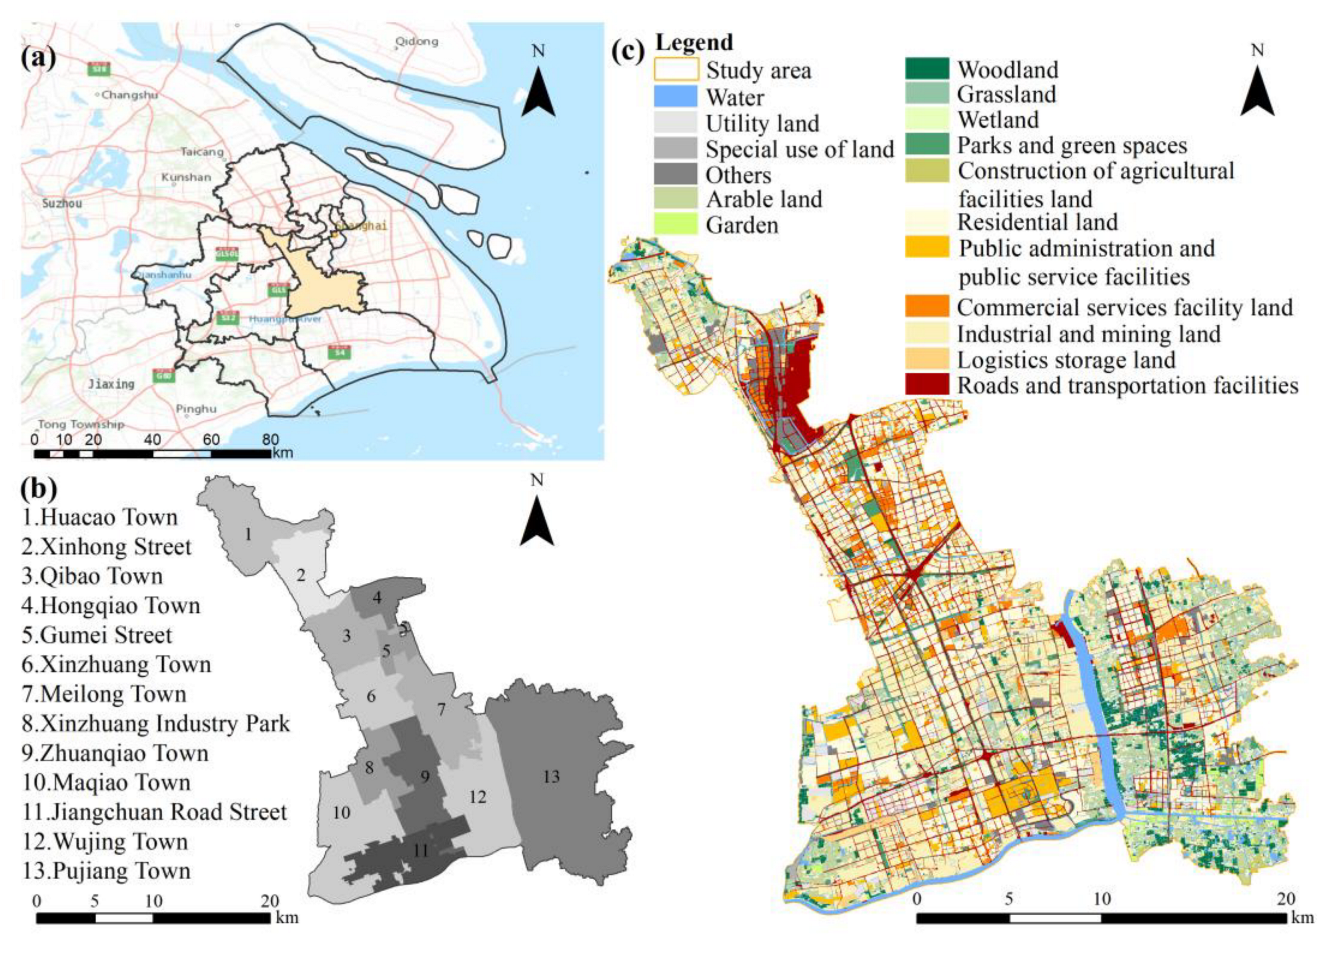
2.1. Study Area

Shanghai (120°52′ E–122°12′ E, 30°40′ N–31°53′ N) is situated on the eastern edge of the Asian continent, at the forefront of the alluvial plain of the Yangtze River Delta, with an average elevation of about 2.19 m. The city experiences a subtropical monsoon climate, characterized by hot, humid summers and cold, damp winters, along with significant annual precipitation. There is a rainy season during late spring and early summer, with frequent cloudy and rainy weather. The city is classified within the “III hot summer and cold winter” climatic zone. Between 2000 and 2020, Shanghai’s urbanized land area expanded from 1310.53 km2 to 2738.88 km2, while the urbanization rate of the population surged to 88.1%, well above the national average of 59.6% [47]. By the end of 2022, Shanghai’s population reached 24.75 million, with a total built-up area of 6340.5 km2. However, rapid urbanization and irrational land use have contributed to an increase in high-temperature heatwave events. Between 2013 and 2023, Shanghai experienced 25 heatwave events (defined as periods with daily maximum temperatures ≥ 35 °C for no less than three days), resulting in 792.6 excess cases of heat stroke. During such heatwaves, the risk of heat stroke among Shanghai residents is significantly elevated [48].
In this study, we focus on Minhang District, a typical high-density development zone with a total area of about 373 km2 (Figure 1). The district is highly urbanized and characterized by extensive man-made surfaces [49]. Geographically, Minhang District occupies a transitional zone between Shanghai’s urban core and the suburban periphery [50], making it a representative case study for analyzing urban ventilation corridors. Firstly, Minhang’s position as a transitional zone allows for a unique juxtaposition of urban, ecological, and agricultural spaces. This diversity of land use provides a dynamic setting to study how different spatial types interact and influence each other in terms of ventilation and heat regulation. Secondly, Minhang is experiencing rapid urbanization, with extensive infrastructure development, but still retains significant ecological and agricultural areas. This ongoing transformation offers valuable insights into how ventilation corridors can be integrated into both urban and peri-urban spaces to facilitate better air circulation and mitigate heat risks. Additionally, the district’s demographic profile, which includes both long-time rural residents and an increasing population of urban dwellers, highlights the need for equitable access to environmental benefits, such as improved air quality and temperature regulation. By focusing on Minhang, this study can offer targeted strategies for managing urban–rural dynamics and provide guidance for regional planning in similar transitional areas.

2.2. Data Sources and Pre-Processing

The datasets employed in this study, along with their sources and corresponding product descriptions, are summarized in Table 1. The Landsat 8 Collection 2 Level 2 (LC08/C02/T1_L2) dataset, used for land surface temperature retrieval, is developed based on the single-channel algorithm. With 30 m resolution and geometric, radiometric, and atmospheric corrections already applied, only basic pre-processing such as clipping, mosaicking, and image enhancement is required. The images were obtained via the Google Earth Engine (GEE), which efficiently handles large-scale, long-term remote-sensing data [51]. Four high-quality summer images (June 1–August 31, 2019–2022) with cloud cover below 15% were selected for urban heat island detection and the heat risk assessment of vulnerable groups.
Meteorological data from the Shanghai Meteorological Service, including parameters such as wind speed and direction at this site, are used to identify the dominant wind direction in summer. Building data were sourced from Open Street Map (OSM), specifically the building footprint dataset from 2022. This dataset provides a 3D building database with georeferenced building locations and floor height information. Using ArcGIS 10.8, the data were projected and processed to calculate various building morphology parameters, including building density, height, sky view factor, roughness length, and frontal area density. These parameters were then used to compute the city’s ventilation resistance coefficient.
The population portrait data of the district is derived from mobile operators and is used to identify the distribution of vulnerable groups (age ≤ 5 and ≥65) in Minhang District, which is subsequently combined with surface temperature data to analyze the spatial distribution of the high-temperature risk of vulnerable groups.

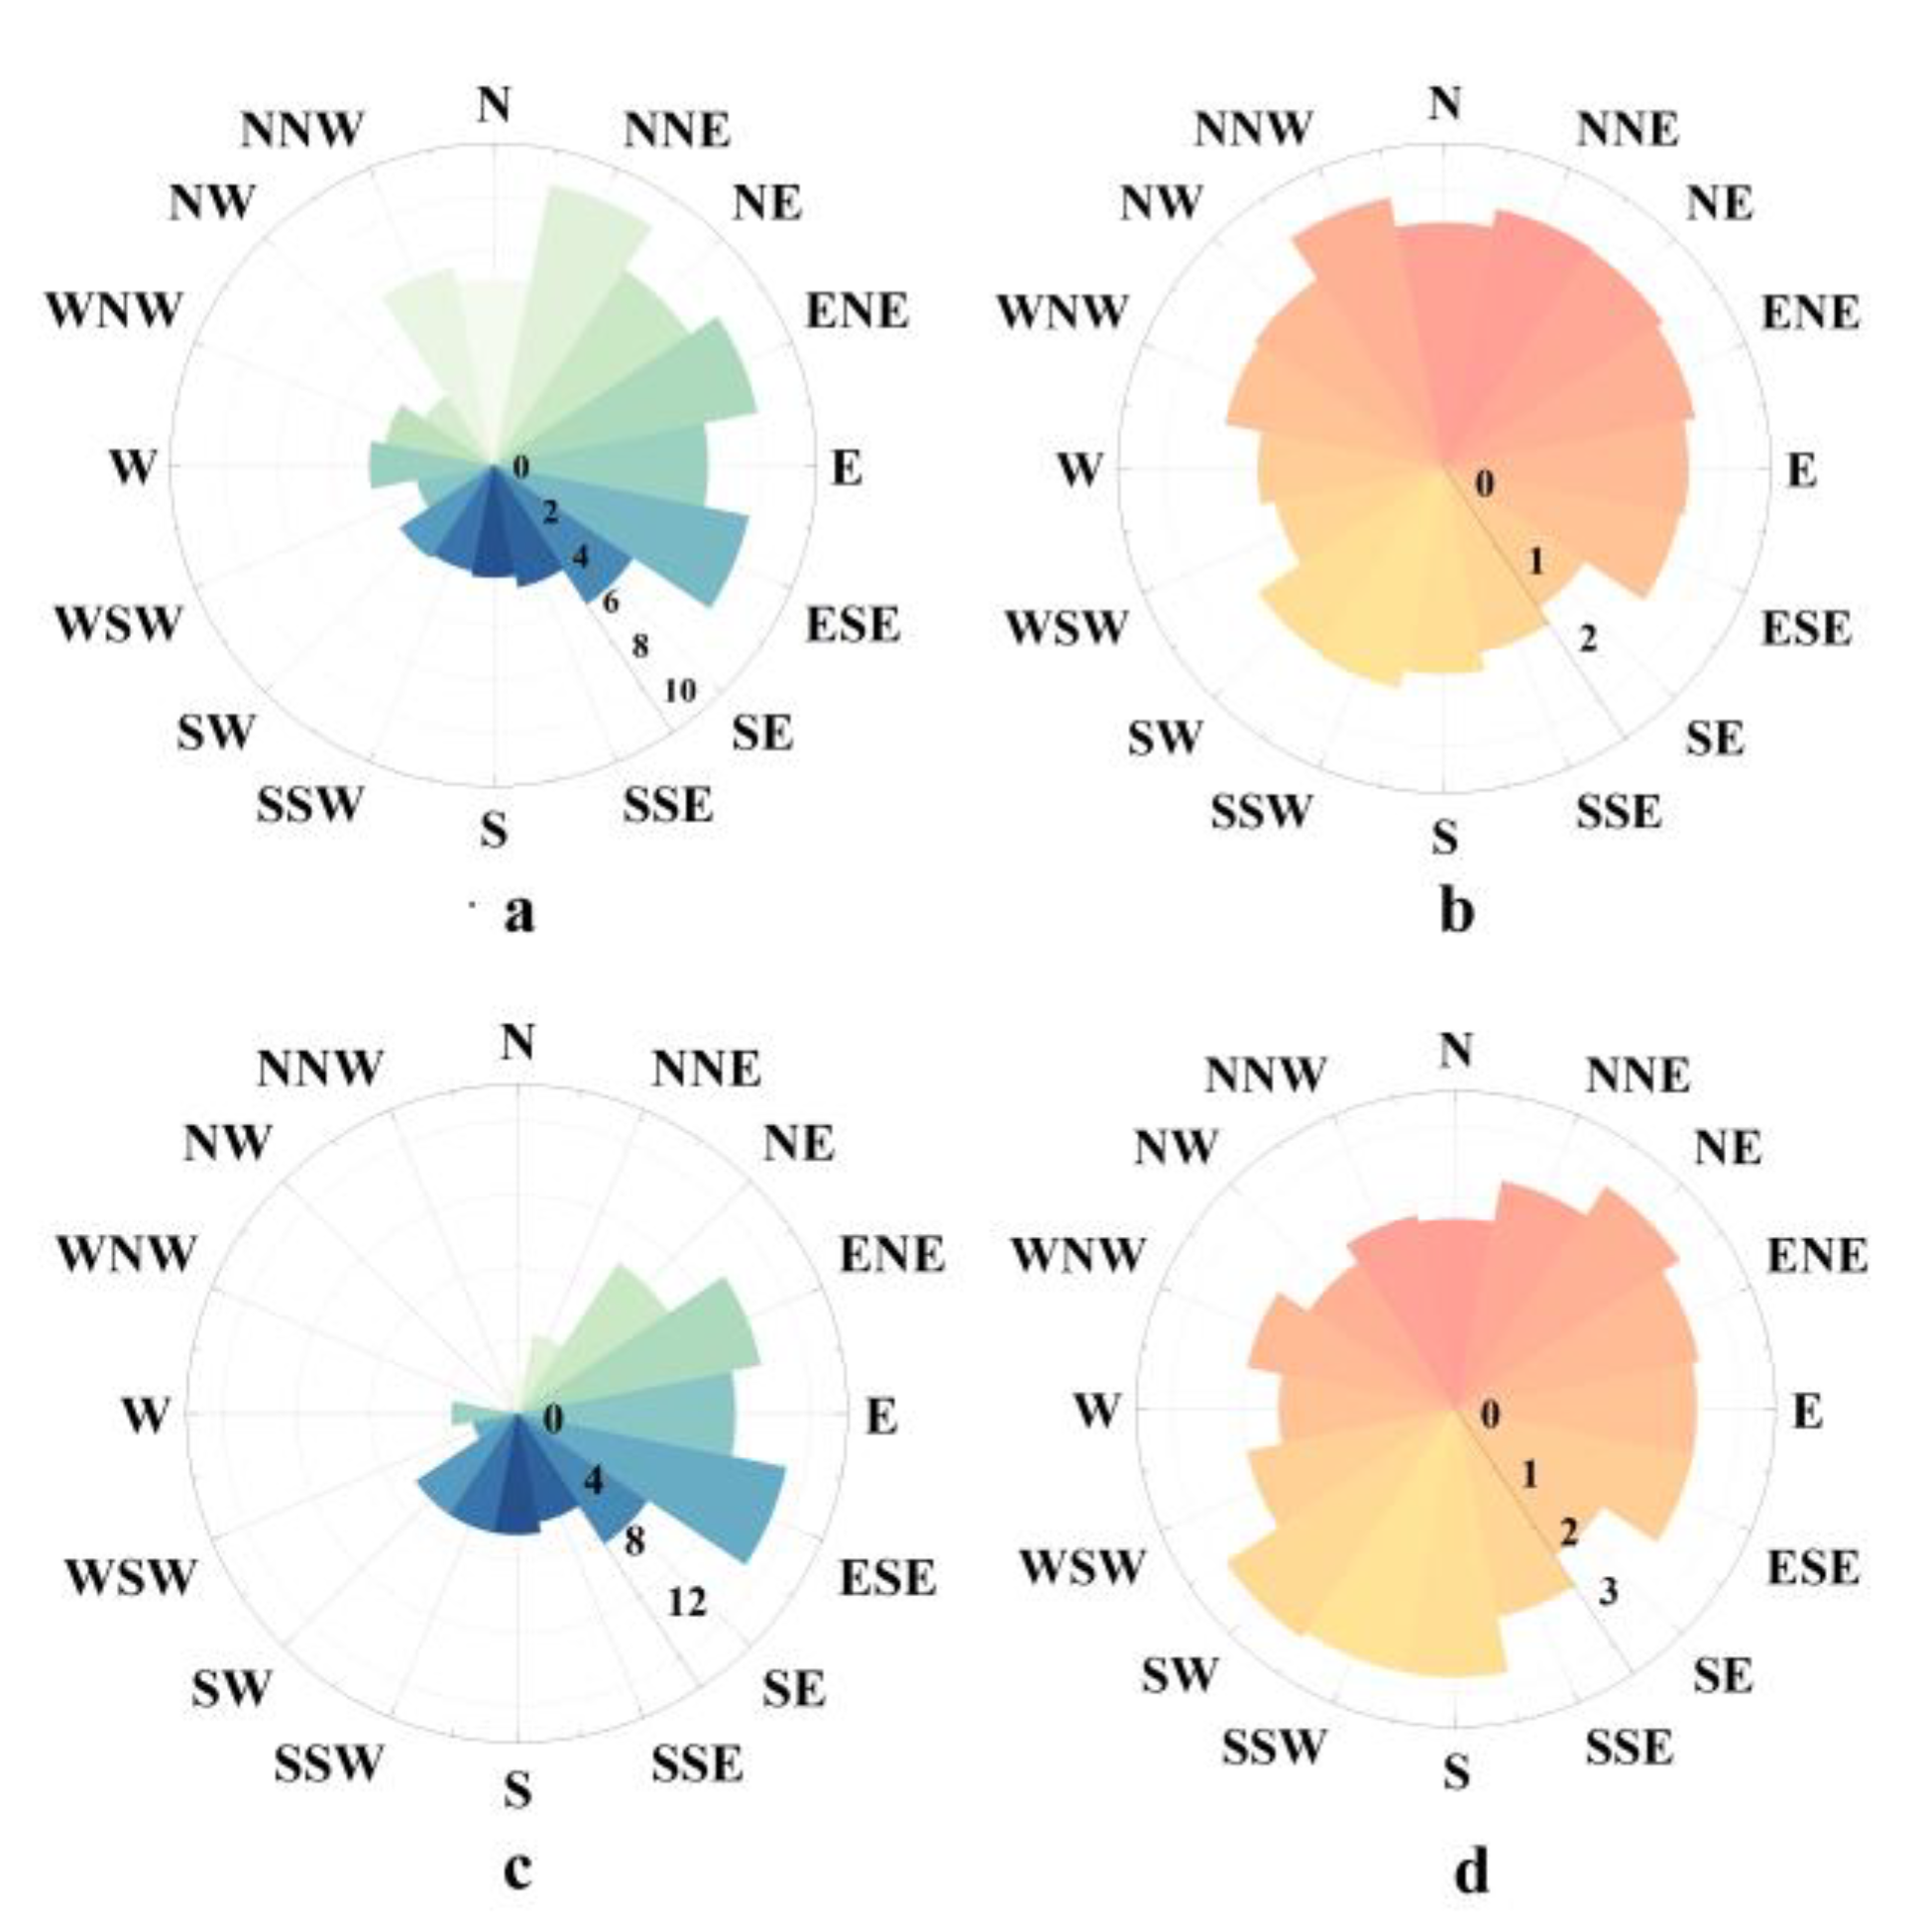
2.3. Wind Environment Characteristics

The construction of ventilation corridors is related to the wind direction and wind speed of the city, and the range of wind angles that maximizes the sum of wind frequencies can be called the dominant wind direction. In this study, we analyze and count the basic characteristics of the wind environment throughout the year and in each season based on the hour-by-hour wind data from 2012 to 2022 in Shanghai. Figure 2a,b show that the dominant wind direction in Shanghai throughout the year is the north–northwest wind (NNW, wind frequency 10.695%, mean wind speed 2.85 m/s), accompanied by the east–northeast wind (ENE, wind frequency 10.02%, mean wind speed 2.75 m/s) and the east–southeast wind (ESE, wind frequency 9.69%, mean wind speed 2.575 m/s), and the west–southwest wind (WSW) has the lowest frequency of 2.915%, with a mean wind speed of 1.85 m/s.
In summer (Figure 2c,d), the dominant wind direction is ESE, with a wind frequency of 14.96% and an average wind speed of 3.4 m/s, respectively; the wind frequency of the west–northwest wind (WNW) and the northwesterly wind (NW) is the smallest, with both having wind frequencies of 0.55% and average wind speeds of 3 m/s and 2.5 m/s, respectively.

3. Research Methodology

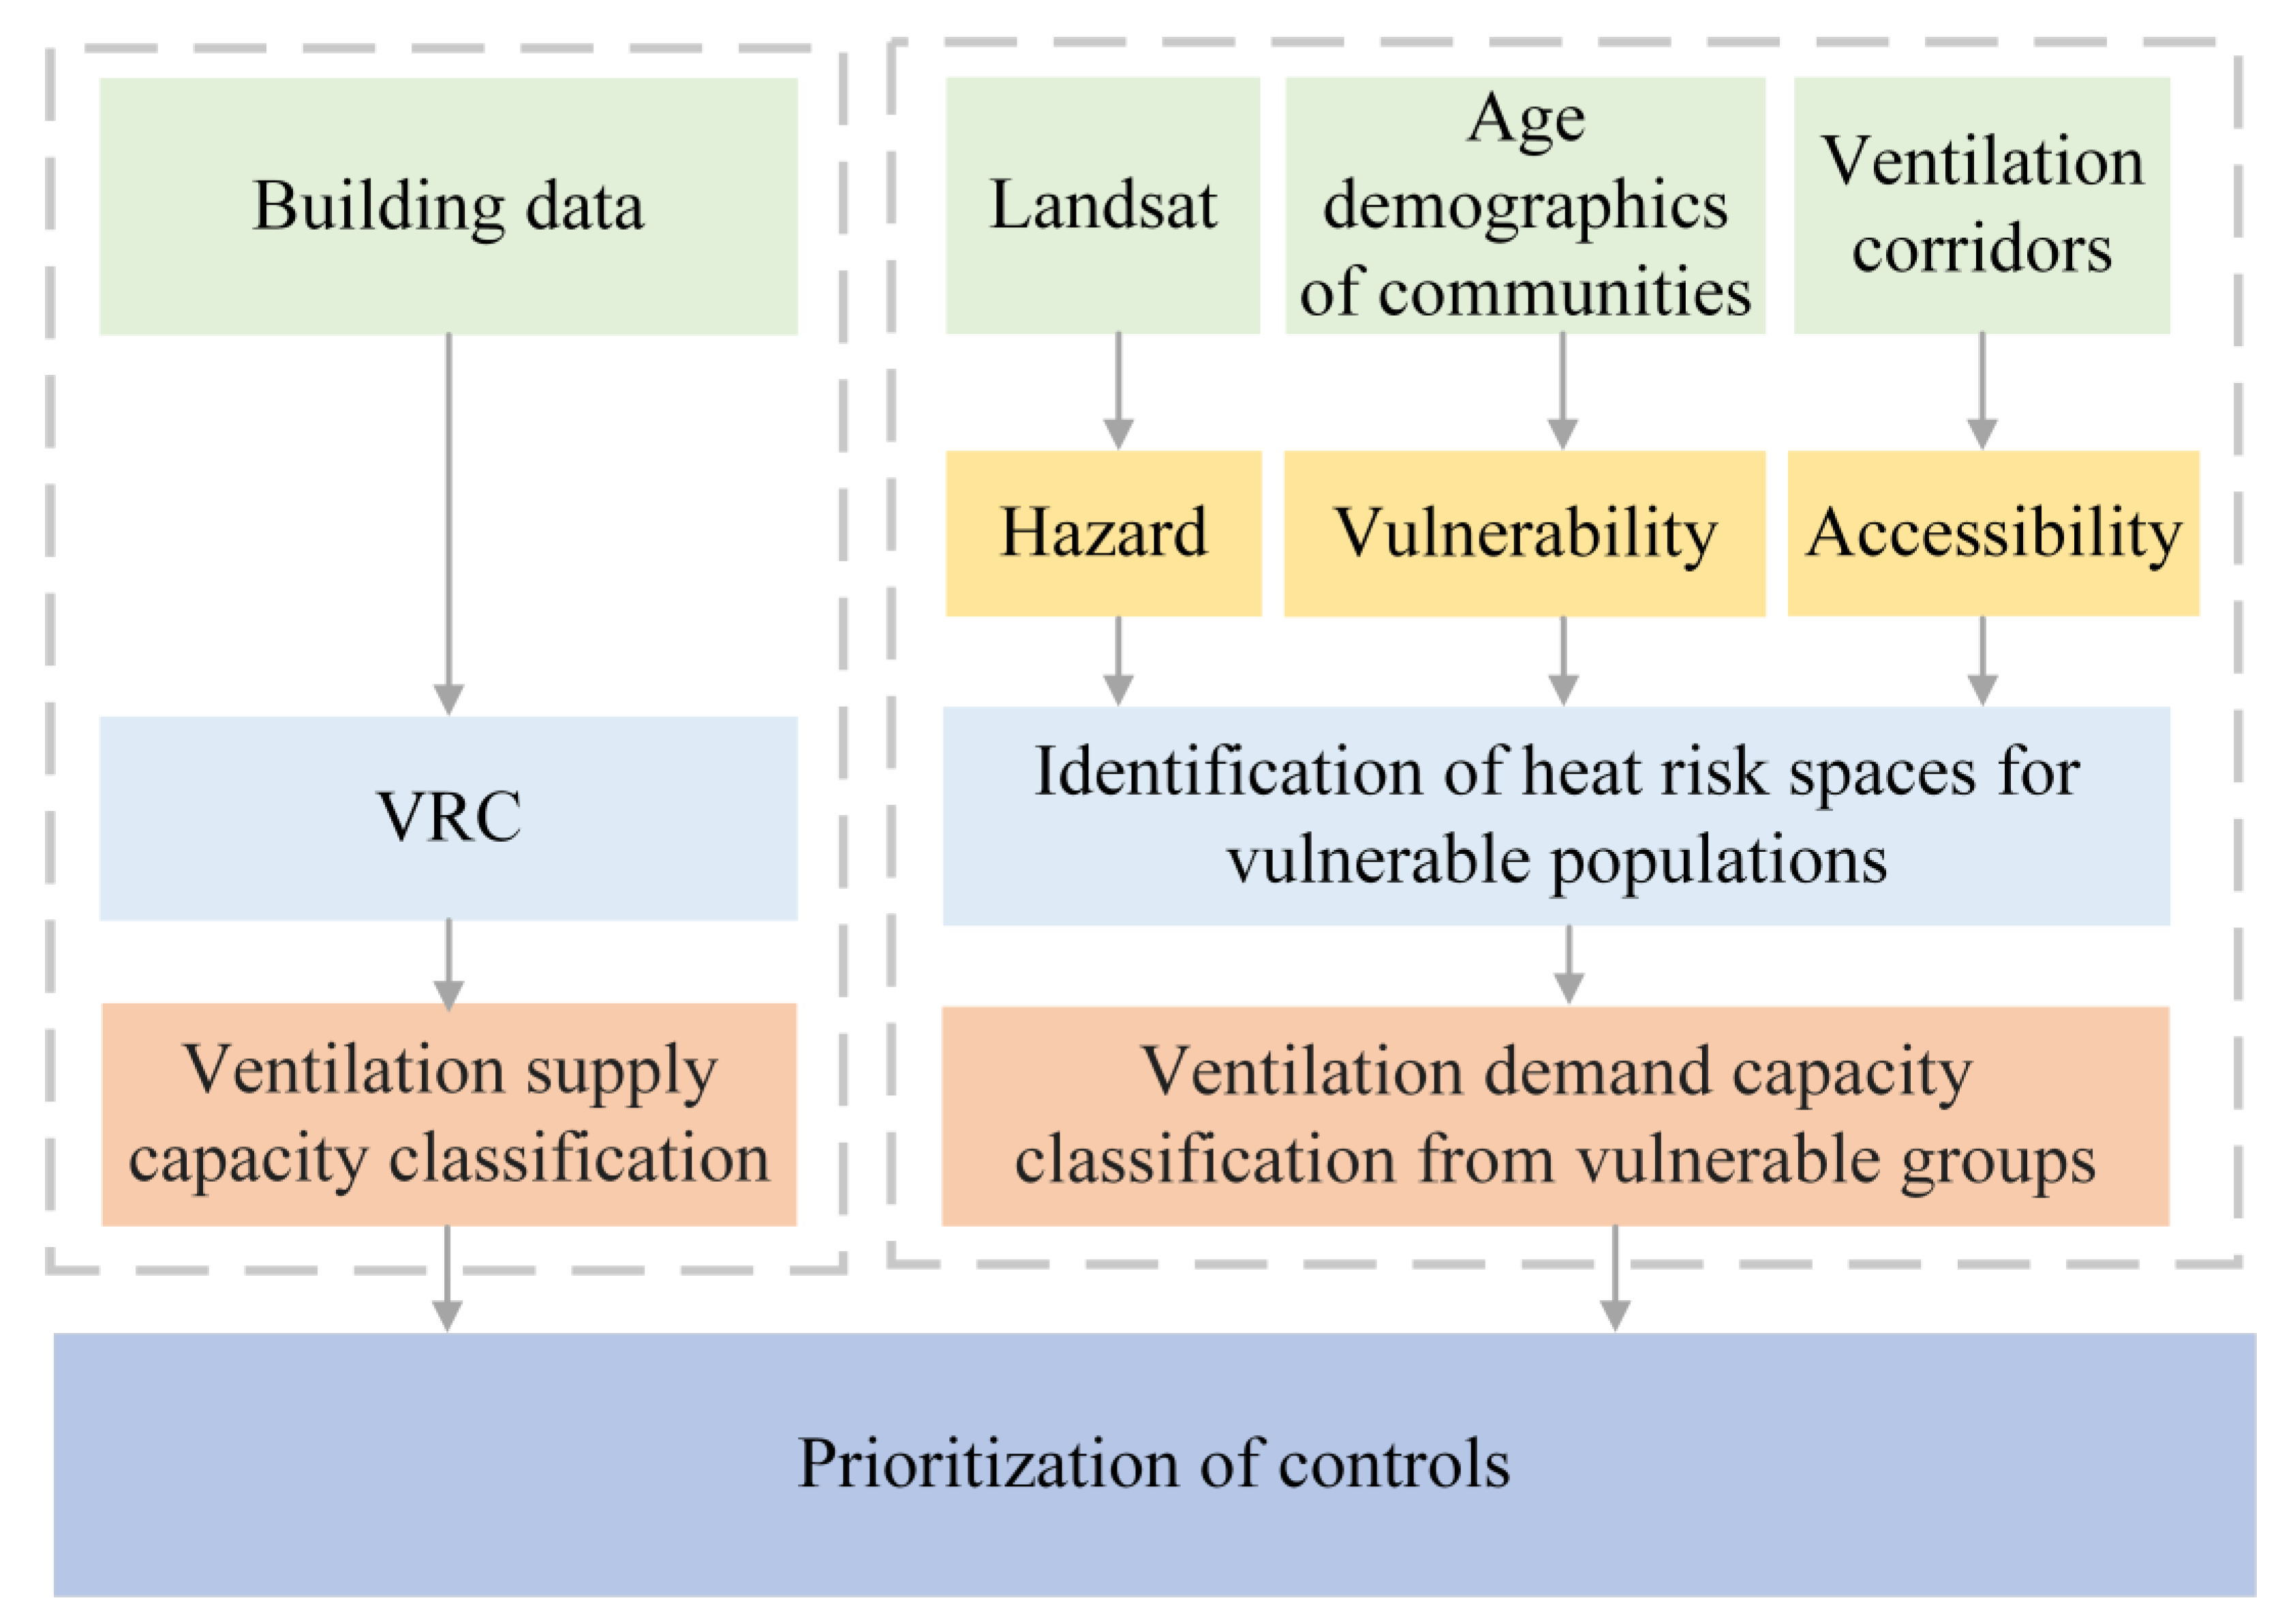
3.1. Research Framework

Firstly, following the thematic framework of “source screening–construction of resistance surface–extraction of ventilation corridor”, the primary and secondary ventilation corridors were constructed using circuit theory. This process involved determining the inlet and outlet points based on the dominant summer wind direction and the city’s cold and heat islands, combined with the ventilation resistance coefficient derived from urban morphology parameters. Secondly, population data from the district was utilized to develop an “hazard–accessibility–vulnerability” model, which helped to identify high-temperature risk areas for vulnerable groups. Finally, targeted control measures were proposed for different regions to ensure the creation of a well-ventilated urban environment. The technical approach of this paper is as follows (Figure 3).

3.2. The Setup of Air Inlets and Outlets

This study aims to construct urban canopy ventilation corridors in a hierarchical manner. First, the multi-level ventilation network allows for complementary functions: the primary ventilation corridor serves as the main channel to improve overall city ventilation efficiency, while the secondary corridor acts as a supporting system. The secondary corridors guide the flow of cold air, enhance local ventilation, connect to cold air sources, and improve the wind environment in specific areas. Together, the primary and secondary corridors can better meet the diverse ventilation needs across different urban zones.
Secondly, the hierarchical design of ventilation corridors enhances adaptability to wind direction and climate. Primary ventilation corridors are aligned with the dominant summer wind direction, maximizing the use of natural wind to boost ventilation and reduce urban heat load. In contrast, secondary corridors regulate and supplement air flow, helping to alleviate the urban heat island effect and establish a more effective microclimate control. Moreover, the hierarchical structure allows for adjustment and optimization based on the unique characteristics and needs of different areas, making the city more adaptable and flexible in response to varying climatic conditions and environmental changes.
Therefore, in this study, the primary ventilation corridors are constructed in alignment with the dominant summer wind direction, while the secondary corridors are designed to mitigate the heat island effect. As a result, the air inlets and outlets of the primary and secondary corridors differ.

3.2.1. Primary Inlets and Outlets Site Identification Based on Dominant Summer Wind Direction

Combining the dominant wind direction and the land use around Minhang District, the high-pressure node is set up in the ecological space and the low-pressure node is set up in the northwest direction corresponding to it, which are used as the inlet (source point, 1 V) and outlet (destination point, 0 V) of the ventilation corridor gallery, respectively; this can improve the ventilation efficiency of the ventilation corridor and capture the maximum atmospheric pressure difference, and at the same time, in order to make the ventilation corridor cover the whole Minhang District, as many as possible will be inlets, and outlets will be installed to realize atmospheric circulation.

3.2.2. Secondary Inlets and Outlets Identification Based on Function Space and Compensation Space

The secondary ventilation corridor is an air-convection channel formed based on the density difference between hot and cold air, and air inlets and air outlets are set in positions of the functional space and compensation space, respectively. The functional space refers to the built or to-be-built areas where the wind environment needs to be improved urgently [52]; in this study, it is specifically the heat island area which is intended to cause the heat risk in the city. The compensation space includes the source area of fresh air, the area of cold air generation, and the area of thermal compensation or air-conditioning which can stimulate the circulation of air; in this study, it is specifically the area of the city’s cold island which can provide fresh and cold air. An air-guided channel is used to connect the cold air from the compensation space to the functional space, aiming to mitigate the urban heat island effect and reduce the urban heat risk.
In this paper, the mean-standard deviation method is used to identify the functional space and compensation space, which takes the degree of variation in the feature temperature to the average temperature as the basis for classifying different temperature zones, and it can characterize the concentration and fluctuation of LST well [53]. Referring to the existing literature, using 0.5 standard deviation and 1 standard deviation as the splitting point [54], the inverted LST data were divided into five thermodynamic classes including low temperature, sub-low temperature, medium temperature, sub-high temperature, and high temperature (Table 2). Considering that areas with higher-than-average temperatures are more likely to become heat island areas, the sub-high-temperature and high-temperature zones were extracted to be the range of the urban heat island, i.e., the role of the space; and the sub-low- and low-temperature zones as the cold island range, i.e., the compensation space.

3.3. GIS-Based Ventilation Resistance Surface Construction

Ventilation resistance surface can describe the obstacles or barriers encountered by airflow in different geographic environments, and these obstacles can be buildings, vegetation, topography, etc. By quantifying the degree of influence of these elements on wind flow and calculating and obtaining ventilation resistance coefficients, it is possible to efficiently construct ventilation corridors and optimize the sources of resistance to reduce the interference to the windway in subsequent planning. In this study, based on the studies of Fang [24] and Liu [21], and taking into account the characteristics of the urban texture, spatial redundancy and density, horizontal layout of buildings, and vertical height of Minhang District, the sky-view factor and roughness length are applied to calculate the ventilation resistance coefficient (VRC), and the index will be used to represent the resistance in the ventilation corridor.
The sky-view factor (SVF) is the maximum angle at which the sky can be seen between two buildings, and it is often used in urban planning to assess the degree of street openness and to characterize the three-dimensional urban form (Figure 4a). Methods for calculating SVF mainly include the vector computation model, raster computation model, and fisheye camera. Gal pointed out that the raster computation model is more suitable for the fast calculation of urban surface openness at large scale and large data volumes [55]. Therefore, the raster calculation model proposed by Zakšek [56] was used in this study to estimate the SVF in Minhang District, with the results obtained through GIS calculations.
SVF can be expressed by the following equation:
Ω = 2 π · 1 i = 1 n s i n γ i n
S V F = 1 i = 1 n s i n γ i n
where Ω denotes the sky visible stereo angle (°); γi denotes the affected terrain height angle (°) at the i azimuth; and n denotes the number of azimuths calculated. SVF is the sky openness, which ranges between 0 and 1. A value of 1 for SVF indicates that the sky is fully visible, whereas a value of 0 for SVF indicates that the space is completely obscured.
Due to the obstruction of airflow movement by rough elements on the surface and topographic relief, the location of zero wind speed on the wind speed contour is not at the surface but at a certain height from the surface, which is defined as the aerodynamic roughness length (RL) [57], and the RL is related to the aerodynamic roughness. RL and urban spatial morphology have a very close connection, a large number of research results show that RL can reflect the ventilation capacity of different areas of the subsurface [58], and many foreign cases of urban planning have taken RL as an important indicator for the selection of urban breezeways [55]. Currently, the commonly used calculation methods of RL are divided into two categories, one is the meteorological observation method, i.e., using the flux tower or the actual measured wind speed information from the weather station to calculate, which needs to set up enough observation points and is time-consuming and labor-intensive, and the other is the morphology method, which is based on the building morphology parameters such as the building density and the building coverage rate. In this study, the morphological model developed by Grimmond [59] was used to estimate the urban RL:
Z d Z h = 1.0 1.0 e x p [ ( 7.5 × 2 × λ F ) 0.5 ] ( 7.5 × 2 × λ F ) 0.5
Z 0 Z h = 1.0 Z d Z h e x p 0.4 × U h u + 0.193
u U h = m i n [ 0.003 + 0.3 × λ F 0.5 , 0.3 ]
where Zd is the zero plane displacement height (m), Z0 is the roughness length (m), Zh is the roughness height (m), Zd/Zh is the normalized zero plane displacement height, Z0/Zh is the normalized roughness length, Uh is the wind speed (m/s), u is the friction velocity (or shear velocity) (m/s). λ F is the urban building Frontal Area Index (FAI) per unit of surface area, which refers to the ratio of the projected area of the windward side of a building to the area of a unit plot at a certain height increment [60] (Figure 4b), and was proposed by Raupach in the 1990s [61]. Its meaning is that the larger the area of the windward side of a building in a certain area, the greater the obstruction of the building to the flowing wind in that area, and the lower the ventilation capacity; λ F can be calculated by the following formula:
λ F ( z , θ ) = A ( θ ) p r o j ( z ) A T
λ F ( z ) = i = 1 n λ F ( z , θ ) P ( θ , i )
where θ is the direction of the specific wind; z is the height increment; λ F ( z , θ ) is the FAI of the wind direction of θ ; A ( θ ) p r o j ( z ) is the projected area of the building in the direction of the specific wind in the vertical residual (m2); A T is the area of the parcel of land on which the building is located (m2); P ( θ , i ) denotes the annual frequency of the wind in the i direction (%); and n denotes the number of wind directions in the statistics of the weather station.
Considering that the study area of Minhang District is 373 km2, a unit grid of 100 m × 100 m is selected for building height, SVF, FAI, and RL calculations from the viewpoint of computer operation capability and image visibility on the basis of ensuring the reliability of the calculation results.
Since the urban ventilation resistance is mainly related to the surface roughness of the urban subsurface and the degree of the surrounding open area, this study uses SVF and RL to construct the ventilation resistance coefficient (VRC) to quantitatively estimate the ventilation resistance, and the calculation equations are as follows:
V R C = Z 0 S V F
where VRC is the ventilation resistance coefficient (m), and the larger the value, the lower the ventilation potential of the urban surface; Z 0 is the roughness length (m); and SVF is the sky-view factor.
Referring to the study of Liu [57] and based on the actual situation in Minhang, the upper limit value of RL with ventilation potential within the 100 m scale is specified as 1.0 m; 0.5 m and 0.1 m are taken as the lower limit values of low and lower ventilation resistance, respectively; and no heat loads are defined when SVF is greater than 0.65 [62]. The study determined VRC = 0.1/1.0 = 0.1 m, VRC = 0.5/1.0 = 0.5 m, VRC = 1.0/1.0 = 1.0 m, and VRC = 1.0/0.65 ≈ 1.5 m as the thresholds for the different levels of ventilation resistance and graded the VRC (Table 3).

3.4. Construction of Urban Ventilation Corridor Based on Circuit Theory

Circuit theory compares the ecological flow within the landscape to an electric current, regards the landscape surface as a conductive surface, and embodies the possibility and difficulty of migration of representative species through the current value magnitude and distribution table, which combines the characteristic of random wandering of electric charge [63] with Ohm’s law of physics, where the current between two points is proportional to the voltage, as shown in the following equation:
I = V / R e f f
where I is the current through the conductor; V is the voltage measured across the conductor; and Reff is the effective resistance of the conductor (or wire).
An area with a high current value represents an area that is favorable for the flow of ecological elements, which can be regarded as the main path for species migration, i.e., an important ecological corridor.
In this study, analogous to the construction of ecological corridors, we apply circuit theory to the identification of ventilation corridors; analogize the air pressure, airflow, and morphology parameters to voltage, current, and resistance; and analyze the migration and diffusion process of airflow in the pathway (including airflow encountering branch nodes). The migration and diffusion process of “airflow” in the path (including the splitting process when “airflow” encounters “branch nodes”) is simulated, in which the higher the current density, the stronger the ventilation capacity of the corridor. The optimal paths from one or more points to one or more target points are identified using the LCP method.
In this study, the Linkage Mapper tool plug-in based on the ArcGIS platform was used to simulate the generation of LCP, and the Pinchpoint Mapper tool of the Circuitscape program was invoked, and in the “Pairwise” mode, Circuitscape grounded one node (the ecological source) and connected all the remaining nodes to a 1 A current source, then repeated the process for each focal node. The final result characterizes the migration probability of ventilation in urban landscape patches in terms of current values. During the simulation, when the airflow encounters a “branch node”, it migrates and spreads along different branches, rather than following only the path with the lowest cumulative wind resistance as assumed by the LCP model. The value of airflow at a branch is inversely proportional to the value of ventilation resistance, meaning that if there are two branches, the lower the value of ventilation resistance at a branch, the higher the value of airflow through that path.
The parameter settings of the circuit theory affect the number of corridors and path selection. The model consists of multiple parameters. Based on previous studies [64,65,66], the specific parameter settings for identifying corridor paths are as follows: the Maximum Number of Connected Nearest Neighbors is 4; the Nearest Neighbor Measurement Unit is cost-weighted; the Truncate Cost-Weighted Distance Threshold is 200,000, and the core parameter of Pinchpoint Mapper for constructing functional connectivity is a CWD cutoff distance of 3000.

3.5. Heat Risk Assessment Model

The Fifth Assessment Report of the IPCC proposed a climate change risk assessment framework based on “hazard, exposure, and vulnerability” [36]. This study takes this as a reference, introduces the accessibility indicator, and constructs the “hazard–accessibility–vulnerability” framework for assessing the heat health risk of vulnerable groups (Figure 5), and identifies areas under heat risk with the help of the GIS spatial analysis tool.
Hazard is the likelihood of a high-temperature heat wave hazard [67], and LST is used as an indicator in this study. Accessibility [68] refers to the ease of spatial resistance that needs to be overcome to reach the target location; in this study it specifically refers to the ease with which vulnerable groups can access fresh, clean cold air through ventilation corridors, with larger values representing poorer accessibility. Vulnerability refers to the degree to which societies and populations are susceptible to or incapable of coping with the adverse impacts of a heat wave [69], such as age, gender, health status, etc. and the vulnerable groups selected for this study include the elderly (≥65 years old), as well as children (≤5 years old). The methods of integrating the values of indicators with different scales into one unified scale include addition and subtraction, as well as multiplication and division, and compared with addition and subtraction, multiplication and division can better reflect the interaction relationship between indicators, so this study constructs a heat risk assessment model based on multiplication and division, and the calculation formula is as follows:
R j = H j ×   E j ×   V j
In the formula, R j denotes the heat risk index of cell j, which is used to indicate the degree of risk to the health of vulnerable groups, and the larger the value, the greater the degree of risk; H j , E j , and V j , respectively, denote the hazard, accessibility, and vulnerability of cell j after the denotation of the normalization.

4. Results

4.1. Results of Air Inlet and Outlet Settings

The spatial distribution of surface temperature classes after the mean-standard deviation method is shown in Figure 6. Combined with the spatial distribution (Figure 6a–d) and the percentage of each temperature zone in 2019–2022 (Figure 6f), the area of the action space and the compensation space in Minhang District fluctuates little during the four years, and the area of the heat island is the largest in 2021, accounting for 31.6% of the total area of Minhang, and the area of the cold island is the smallest, accounting for 29.4%. In this study, based on the four-year average surface temperature (Figure 6e), the overall spatial distribution of the action space and compensation space is characterized by high temperature on the west side of the Huangpu River and low temperature on the east side of the river. Combined with the land-use data, the action space in Minhang District is mainly concentrated in the vicinity of transportation hub areas, large commercial activity areas, and industrial zones, such as Hongqiao Hub, Zhongchun Road, Wujing Industrial Zone, Xinzhuang Industrial Zone, and Minhang Economic and Technological Development Zone, and the main land-use type is construction land, which indicates that the nature of the subsurface and the socio-economic activities together have a certain effect on the formation of heat islands. The compensation space is most concentrated on the east side of Huangpu River, which is because there are large areas of cultivated land, forested land, and blue–green spaces such as rivers, and blue–green spaces such as the Outer Ring Green Belt, Dianpu River, and Chunshen Ponds in the central built-up area, which also have a small area of cold island effect.
Based on the prevailing wind direction of east–southeast (ESE) orientation during the spring and summer seasons in Shanghai, as well as considering the ecological spaces situated on the edges of Minhang District, we identified 12 inlets and 12 outlets for the primary ventilation corridors (Figure 7a). These inlets and outlets were strategically located to maximize the natural airflow, allowing the primary corridors to facilitate the movement of cool air through the district while enhancing overall urban ventilation. The sources’ identification also took into account the topography and urban morphology of Minhang to optimize ventilation efficiency. Based on the grading results of the mean-standard deviation method, the action space and the compensation space are taken as the source locations, air inlets are set at the geometric centers of the seven compensation spaces, and air outlets are set at the geometric centers of the six action spaces (Figure 7b).

4.2. Resistance Surface Construction of Ventilation Corridor Based on ArcGIS Platform

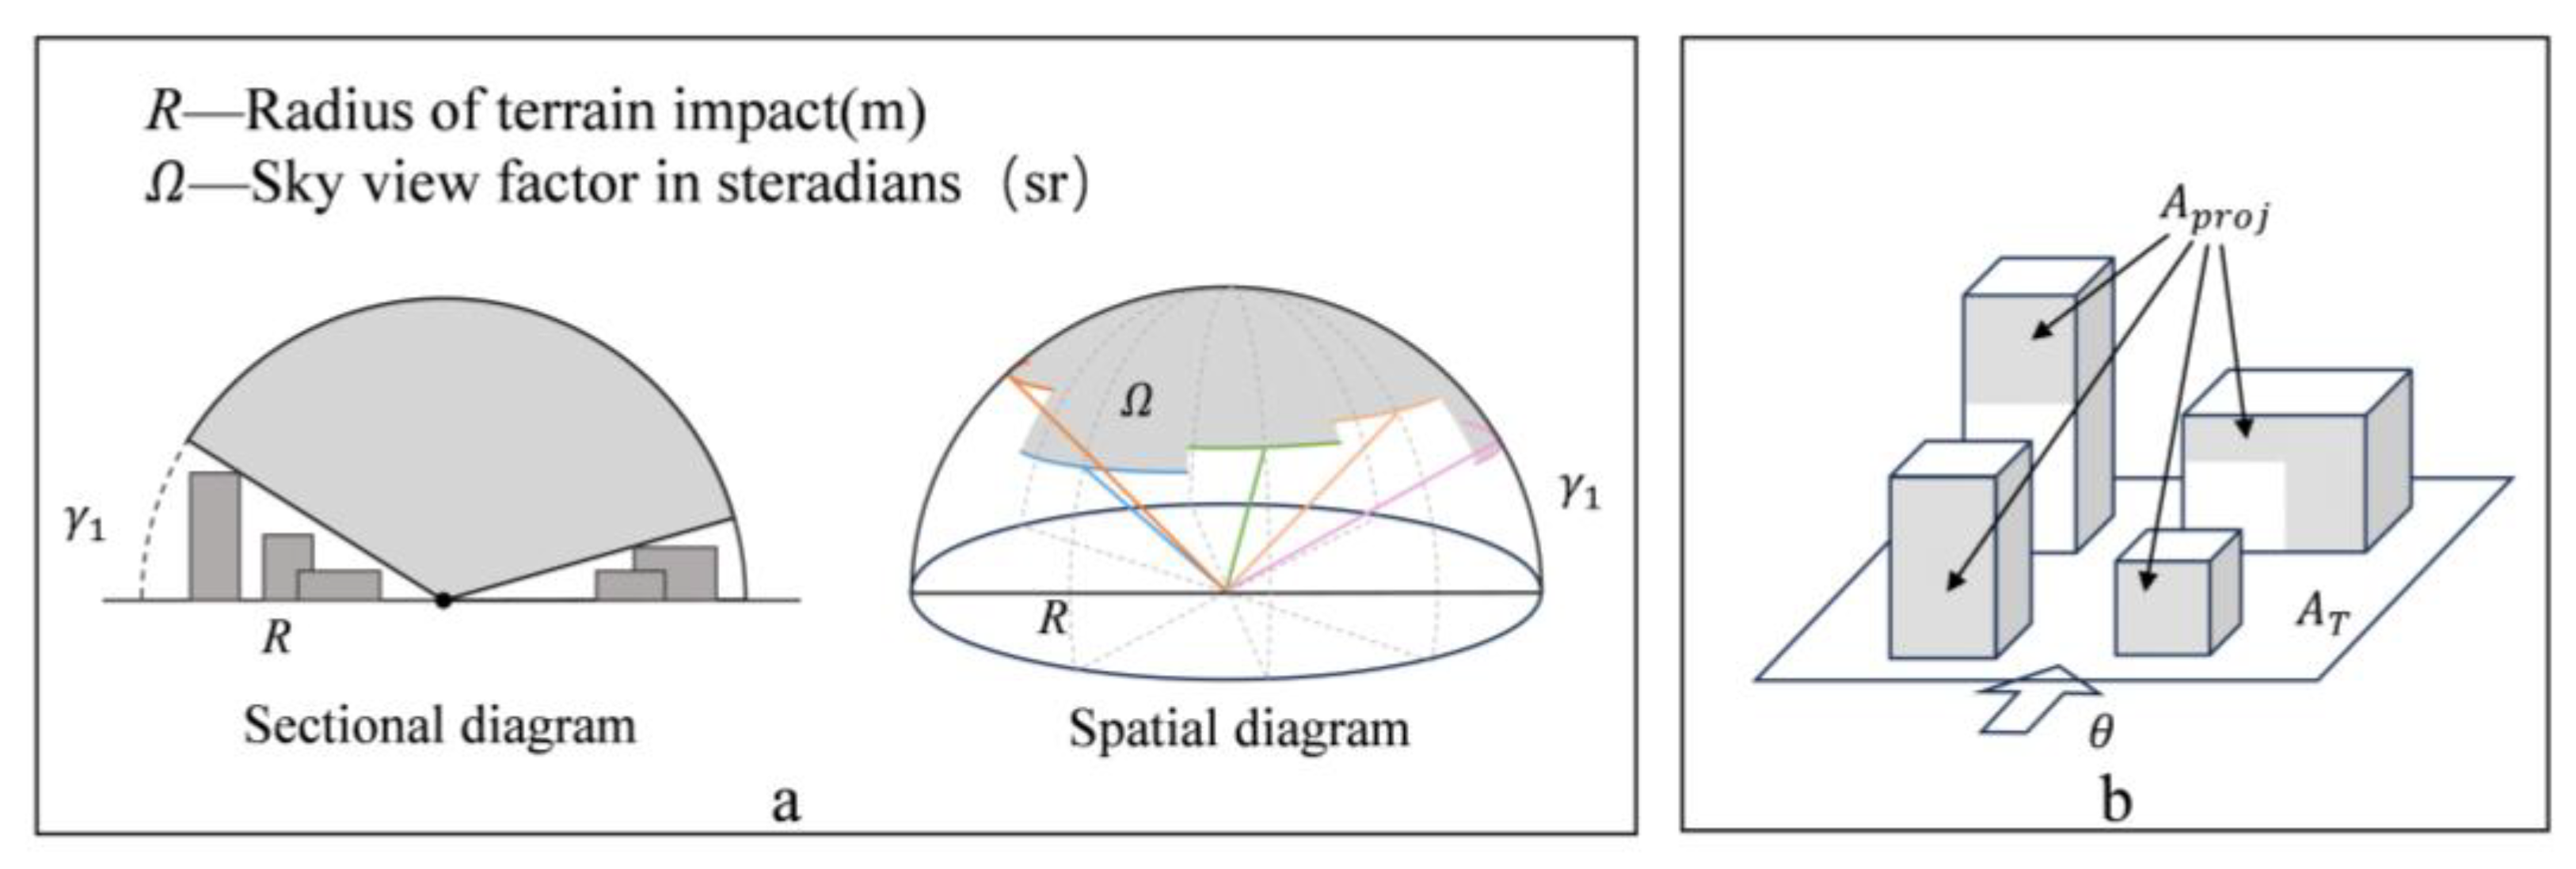
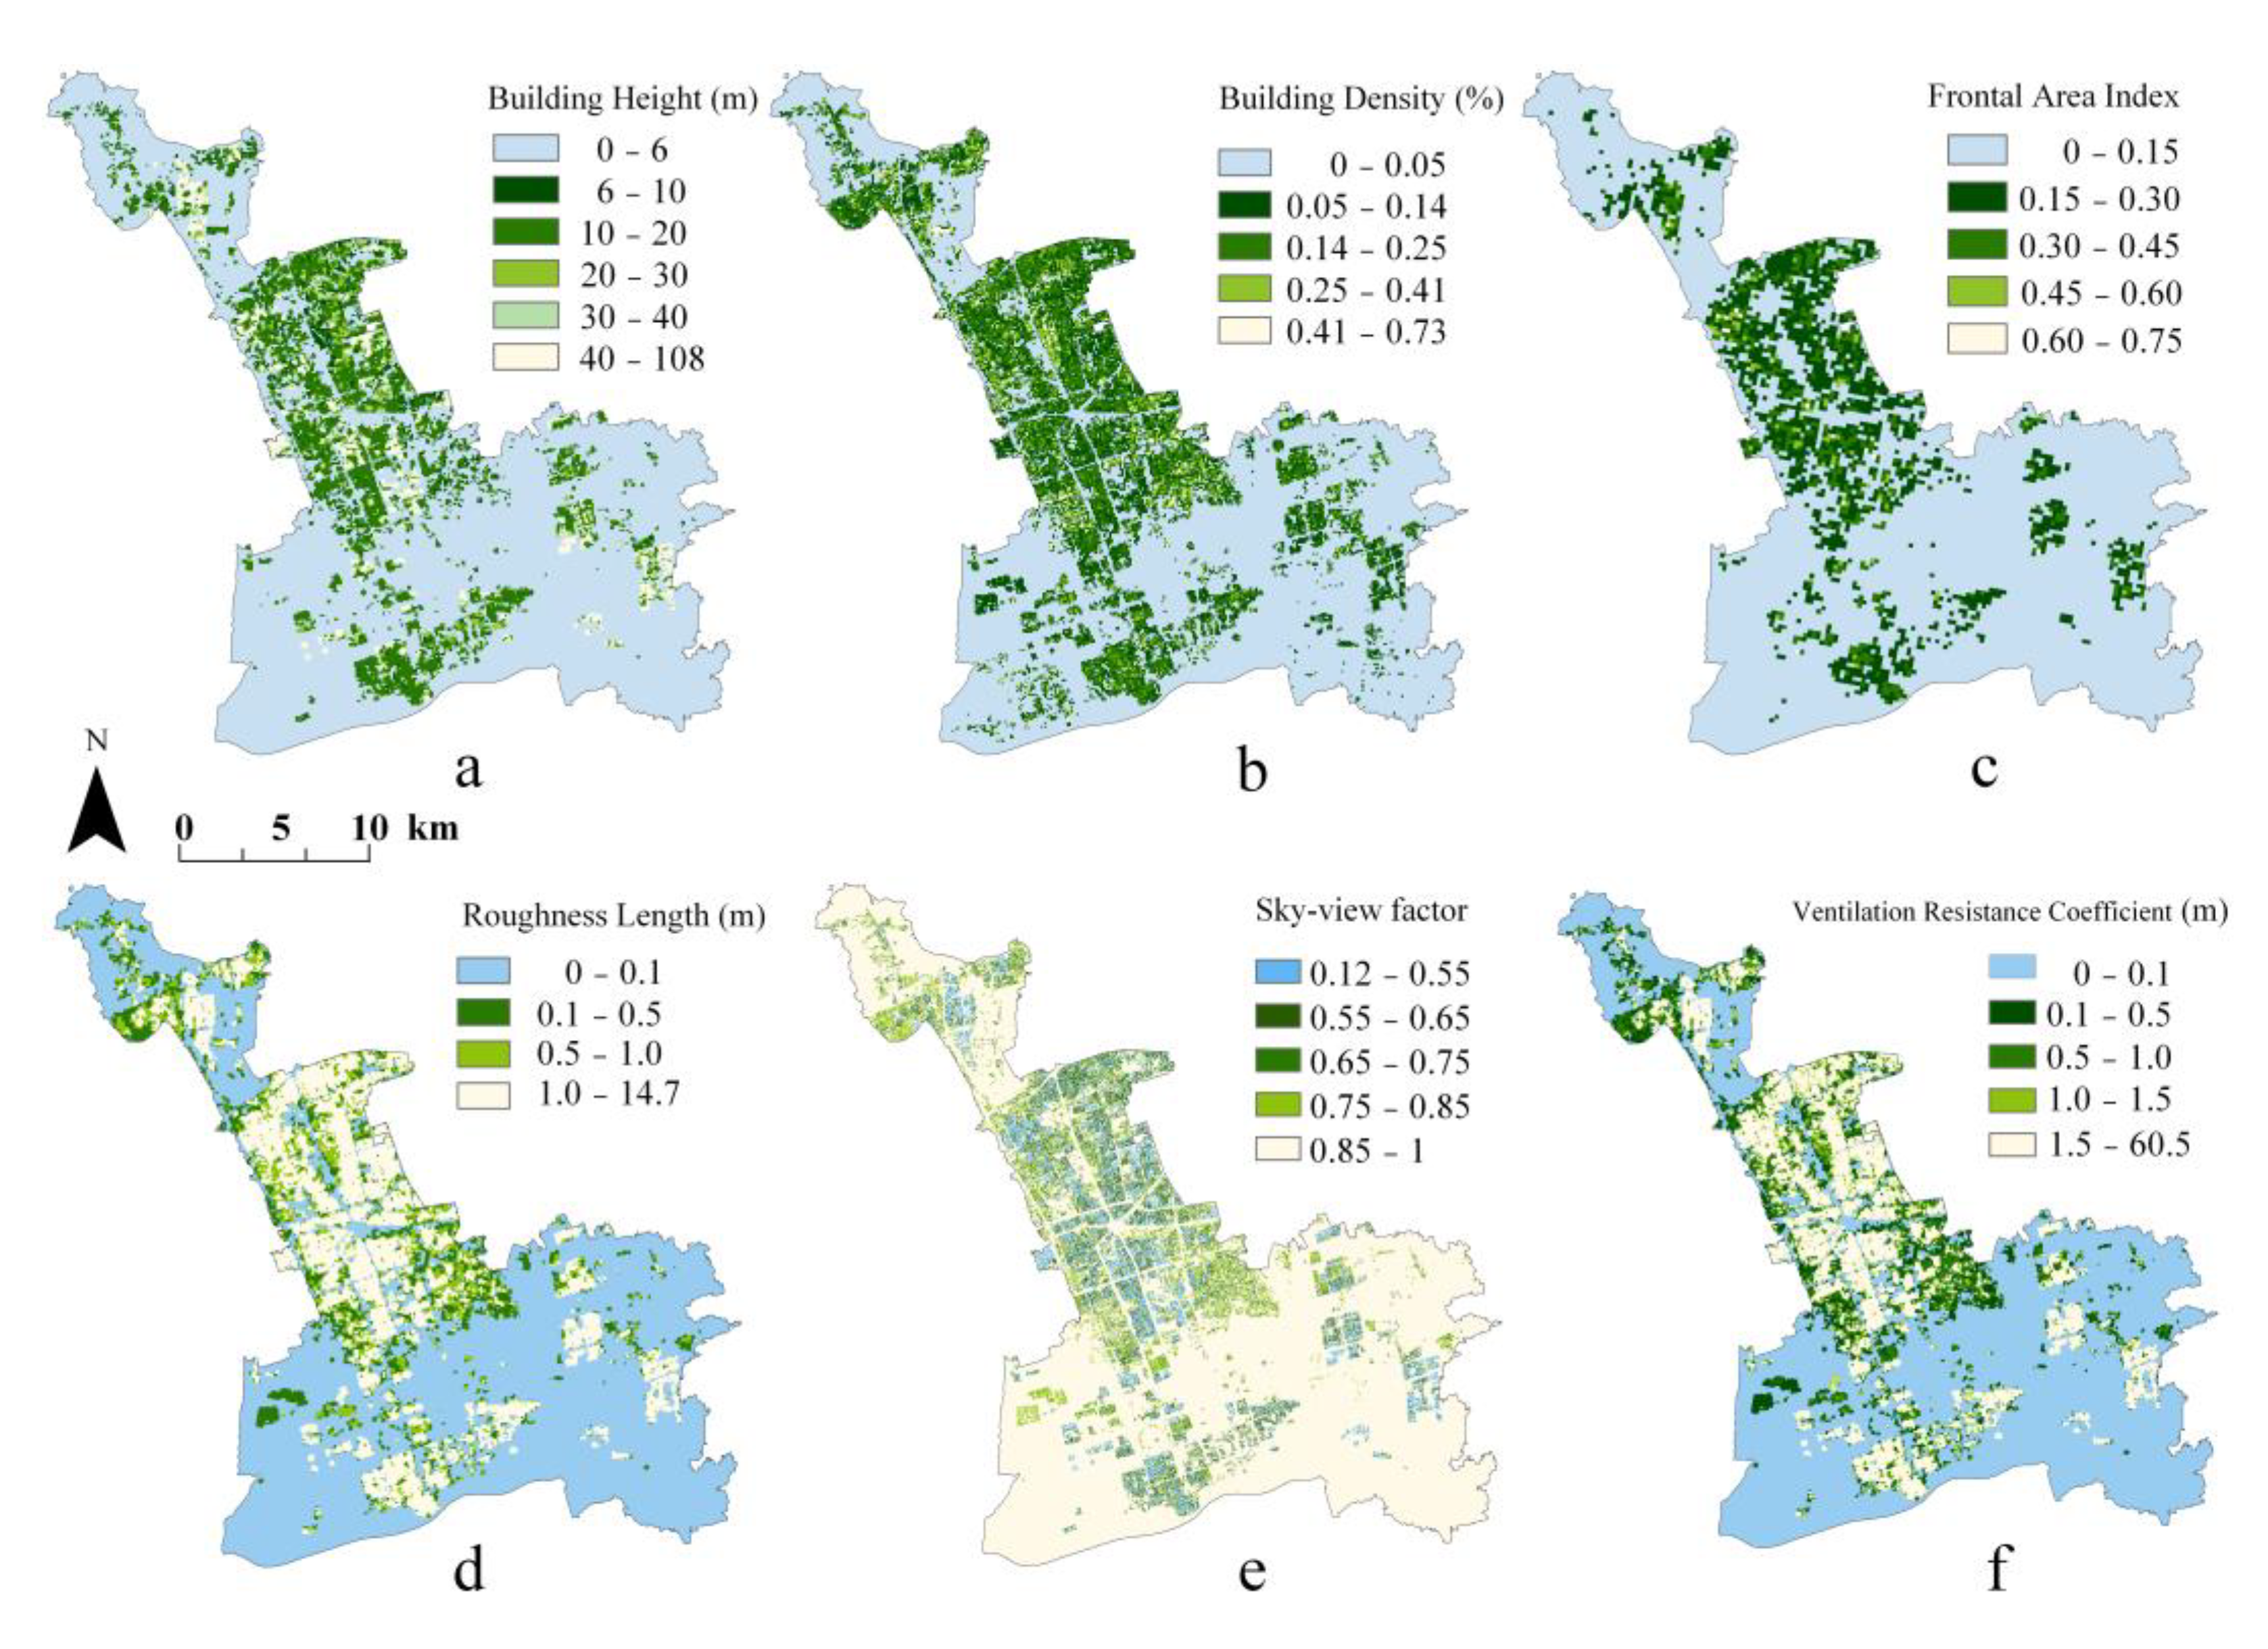
4.2.1. Analysis of Building Form Parameters

From the calculation of building height (BH) (Figure 8a), it can be seen that the five towns in the central part of the city—Hongqiao Town, Gumei Street, Xinzhuang Town, Qibao Street, and Meilong Town—have large buildings and generally high building densities (Figure 8b) (BH ≥ 10 m), and this area is the most mature and densely populated area of Minhang District; Huacao Town, Xinhong Street, Xinzhuang Industrial Zone, Xinhongqiao Street, Zhuanqiao Town, Jiangchuan Road Street, and Wujing Town, Maqiao Town and Pujiang Town show a small-scale aggregation of buildings, which are concentrated in only a small part of the area and have relatively low heights (BH ≤ 6 m).
The FAI (Figure 8c) mainly reflects the blocking effect of buildings on the wind, and the larger the FAI, the greater the blocking effect of buildings on the wind. The calculation results of FAI show that most of the five towns in the central part of the region have an FAI ≥ 0.2, and the FAI of a small part of the region even reaches more than 0.6, which is an obstacle to the wind circulation because of the large number of buildings in the region with a high density. Most of the other towns have lower FAI values (FAI ≤ 0.2). The overall spatial distribution of RL (Figure 8d) also shows a trend of being high in the center and low around it. Even the RL values of most areas in the central plate are greater than 1, indicating the existence of a large urban ventilation barrier area in this region. The RL values of the eight towns in the north, south, and west show a polarized situation, with the areas with a low building density having RL values below 0.1, but the areas with small aggregations of buildings having RL values almost greater than 1, indicating that a small portion of the area can be an obstacle to the wind.
The calculation results of SVF (Figure 8e) have a high similarity with building density and building height in spatial distribution. SVF ≥ 0.65 in most areas of Huacao Town, Xinhong Street, Xinzhuang Industrial Zone, Zhuanqiao Town, Jiangchuan Road Street, Wujing Town, Maqiao Town, and Pujiang Town, which have a large number of blue and green spaces such as rivers, cultivated land, forest land, grassland, wetlands, and parks, and more low-rise buildings, with lower building densities and smaller heat loads. The overall SVF of the five central towns is less than 0.65, and in combination with the building height and density distribution, this area is much more sheltered by buildings, and the built-up area is more confined. However, it is worth noting that there is a significant zone of low SVF values along the S20 Outer Ring Road-S4 Hu Jin Expressway including the surrounding Outer Ring Green Belt area.

4.2.2. Ventilation Resistance Analysis

Combining the distribution of SVF and RL in Minhang District, the calculation of VRC (Figure 8f) shows that the ventilation resistance in the central part of Minhang District has a high value (VRC ≥ 1.5), having the highest degree of urbanization, a large number of buildings, a high density, and a poor ventilation potential. However, there are linear areas with low ventilation resistance in the central area, mainly along the Outer Ring Highway, Humin Elevated Road, and other major transportation roads, rivers such as Dianpu River and Chunshen Tang, and the Outer Ring Green Belt Qibao-Xinzhuang and Meilong sections, which may be potential carriers of ventilation corridors. The central part of Minhang District, from the north to the south, gradually transitions from the city to a combination of urban and rural appearance, and the areas with high values of VRC are distributed in a point-like manner, but most of the areas have low ventilation resistance (VRC ≤ 0.1) and the ventilation potential is high.

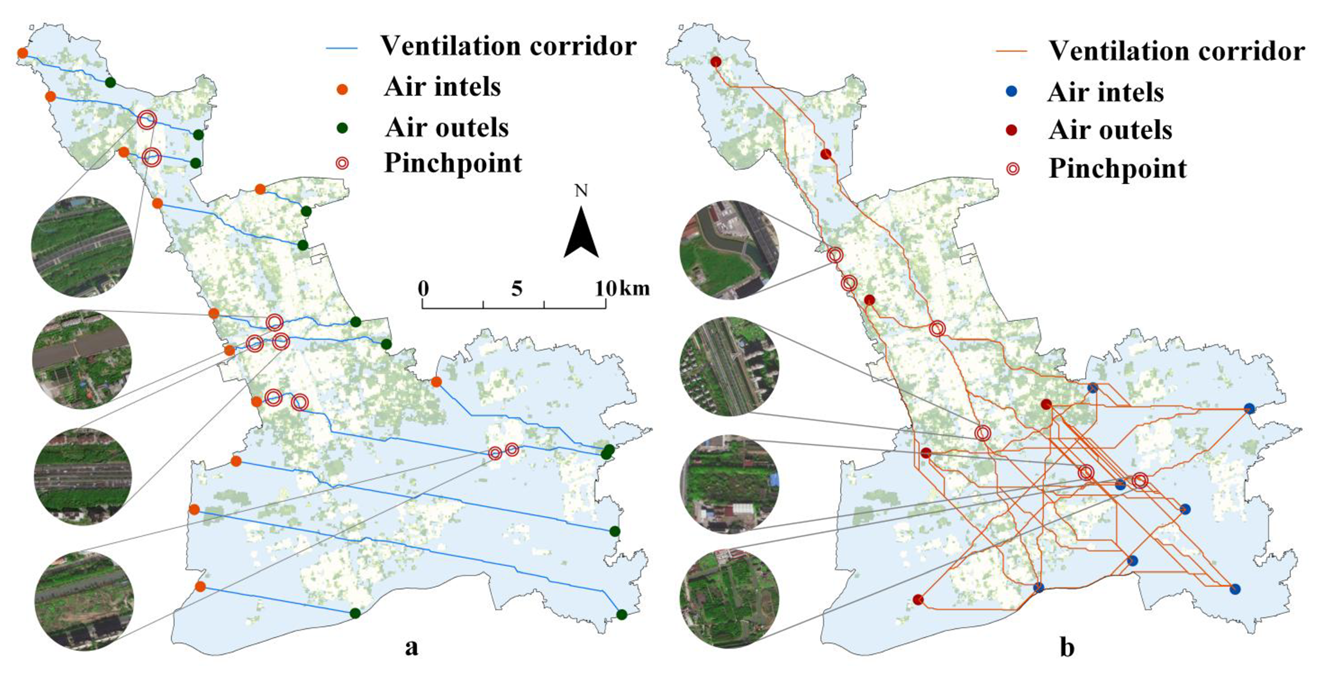
4.3. Ventilation Corridor Construction

Based on the circuit theory, 12 primary ventilation corridors (Figure 9a) and 42 secondary ventilation corridors (Figure 9b) under the dominant summer wind direction (ESE) were determined using the inlet, outlet, and VRC, respectively.
The paths of the ventilation corridors constructed in both cases are smoother in the northern, southern, and eastern parts of the region where the ventilation potential is high. In the central region, the paths of the primary ventilation corridors are more tortuous because the airflow in the corridors is blocked by the dense buildings in the central region and therefore deviates from the prevailing wind direction; while the secondary ventilation corridors in the central region are concentrated in two corridors, which, when combined with the satellite imagery maps, are almost entirely along the two urban highways/expressways—the Jia Min viaduct and the S20 outer viaduct. Jia Min Elevated Road and the S20 Outer Ring Road-S4 Hu Jin Expressway (and the surrounding green belt), the two backbone roads of Minhang District, are the key corridors for the construction of ventilation corridors, and the key corridors for mitigating the heat island effect in the central and northern parts of Minhang District.
In addition, this study utilizes Pinchpoint Mapper to obtain the corridor current density distribution map, which is divided into five levels according to the natural breakpoint method, and extracts the highest level area as the ecological pinchpoints that need to be protected; nine ecological pinchpoints totaling 0.43 km2 are identified in the first-level ventilation corridor, and six ecological pinchpoints totaling 0.49 km2 are identified in the second-level ventilation corridor; the pinchpoint areas are superimposed on the resistance surfaces; and the results show that the resistance values of the pinchpoint areas are all low. Overlaying the ecological pinchpoints with the land cover of the study area, it is recognized that the land in the pinchpoint areas is mainly streets and rivers, which proves that it is advantageous to construct ventilation corridors based on the linear structure of streets and rivers.

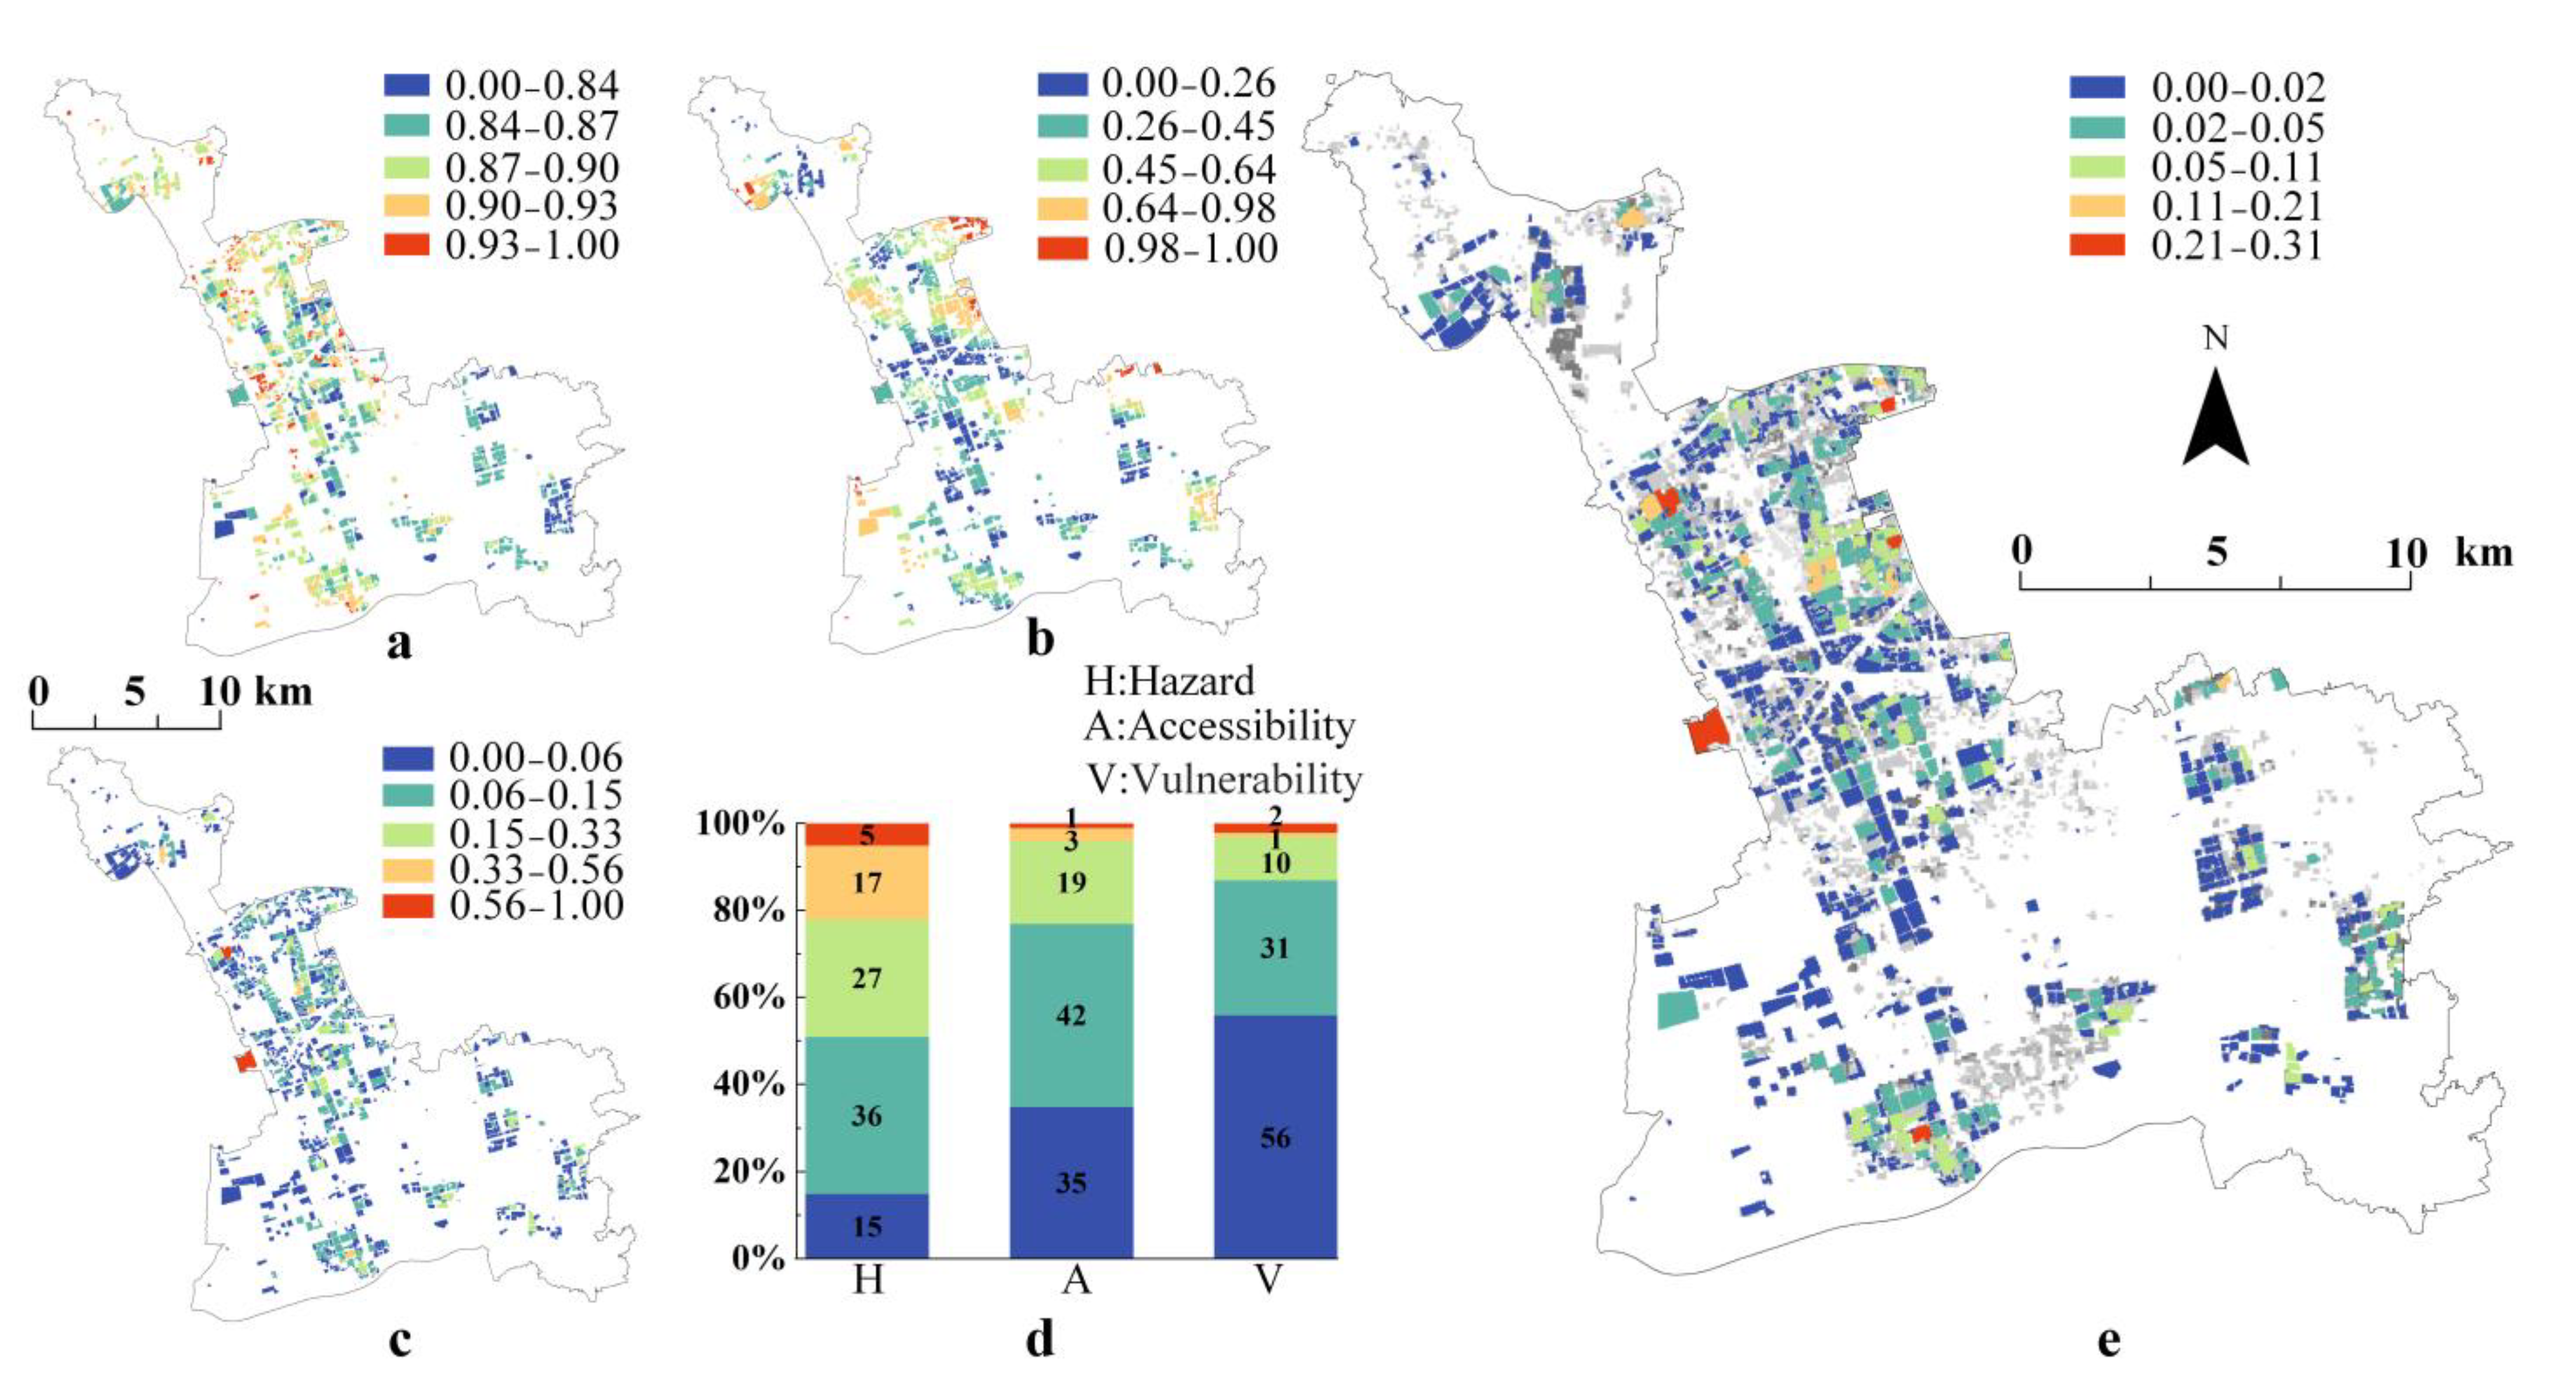
4.4. Spatial Identification of Heat Risk for Vulnerable Groups

The neighborhoods in Minhang District show a dense layout in the central built-up area and are scattered in the surrounding suburbs. Neighborhoods at high risk, i.e., vulnerable to heat wave disasters, account for 5% of the overall number (Figure 10d) and are mainly concentrated in the central built-up area of Minhang District Figure 10a), which is highly urbanized and has a large number of densely built-up buildings; due to a large amount of blue–green space in the eastern suburbs, the risk in this part of the neighborhood is generally lower. The neighborhoods with the worst accessibility account for only 1% of the total (Figure 10d) and are located at the eastern edge of Hongqiao Town and the northern edge of Pujiang Town (Figure 10b), which are far away from the ventilation corridors and have a low probability of getting fresh, clean, and cold air; although the central area has a large number of buildings with high densities, this part of the neighborhoods has generally good accessibility. From the figure, it can be seen that the neighborhoods with the highest vulnerability account for 2% of the overall number (Figure 10d), mainly Shanghai Kangcheng, Vanke City Garden, Dongyuan Peninsula Garden, and Aibo Ercun (Figure 10c), which were mostly built around 2000, and are old enough to have a high percentage of the number of vulnerable people; and the area with the lowest vulnerability accounts for 56% of the overall number.
Combining the above three indicators to obtain the heat risk index of vulnerable people in Minhang District, the distribution map (Figure 10e) shows that the potential heat risk of Gumei Street is higher than that of other towns and streets, and there are five resident districts, 1.45 km2 in total, with the highest heat risk, which are distributed in the fringe area of Minhang District, namely Gubei New Town, Vanke City Garden, Azure City Garden, Shanghai Kangcheng, and Hepei Xincun No. 2 Neighborhood.

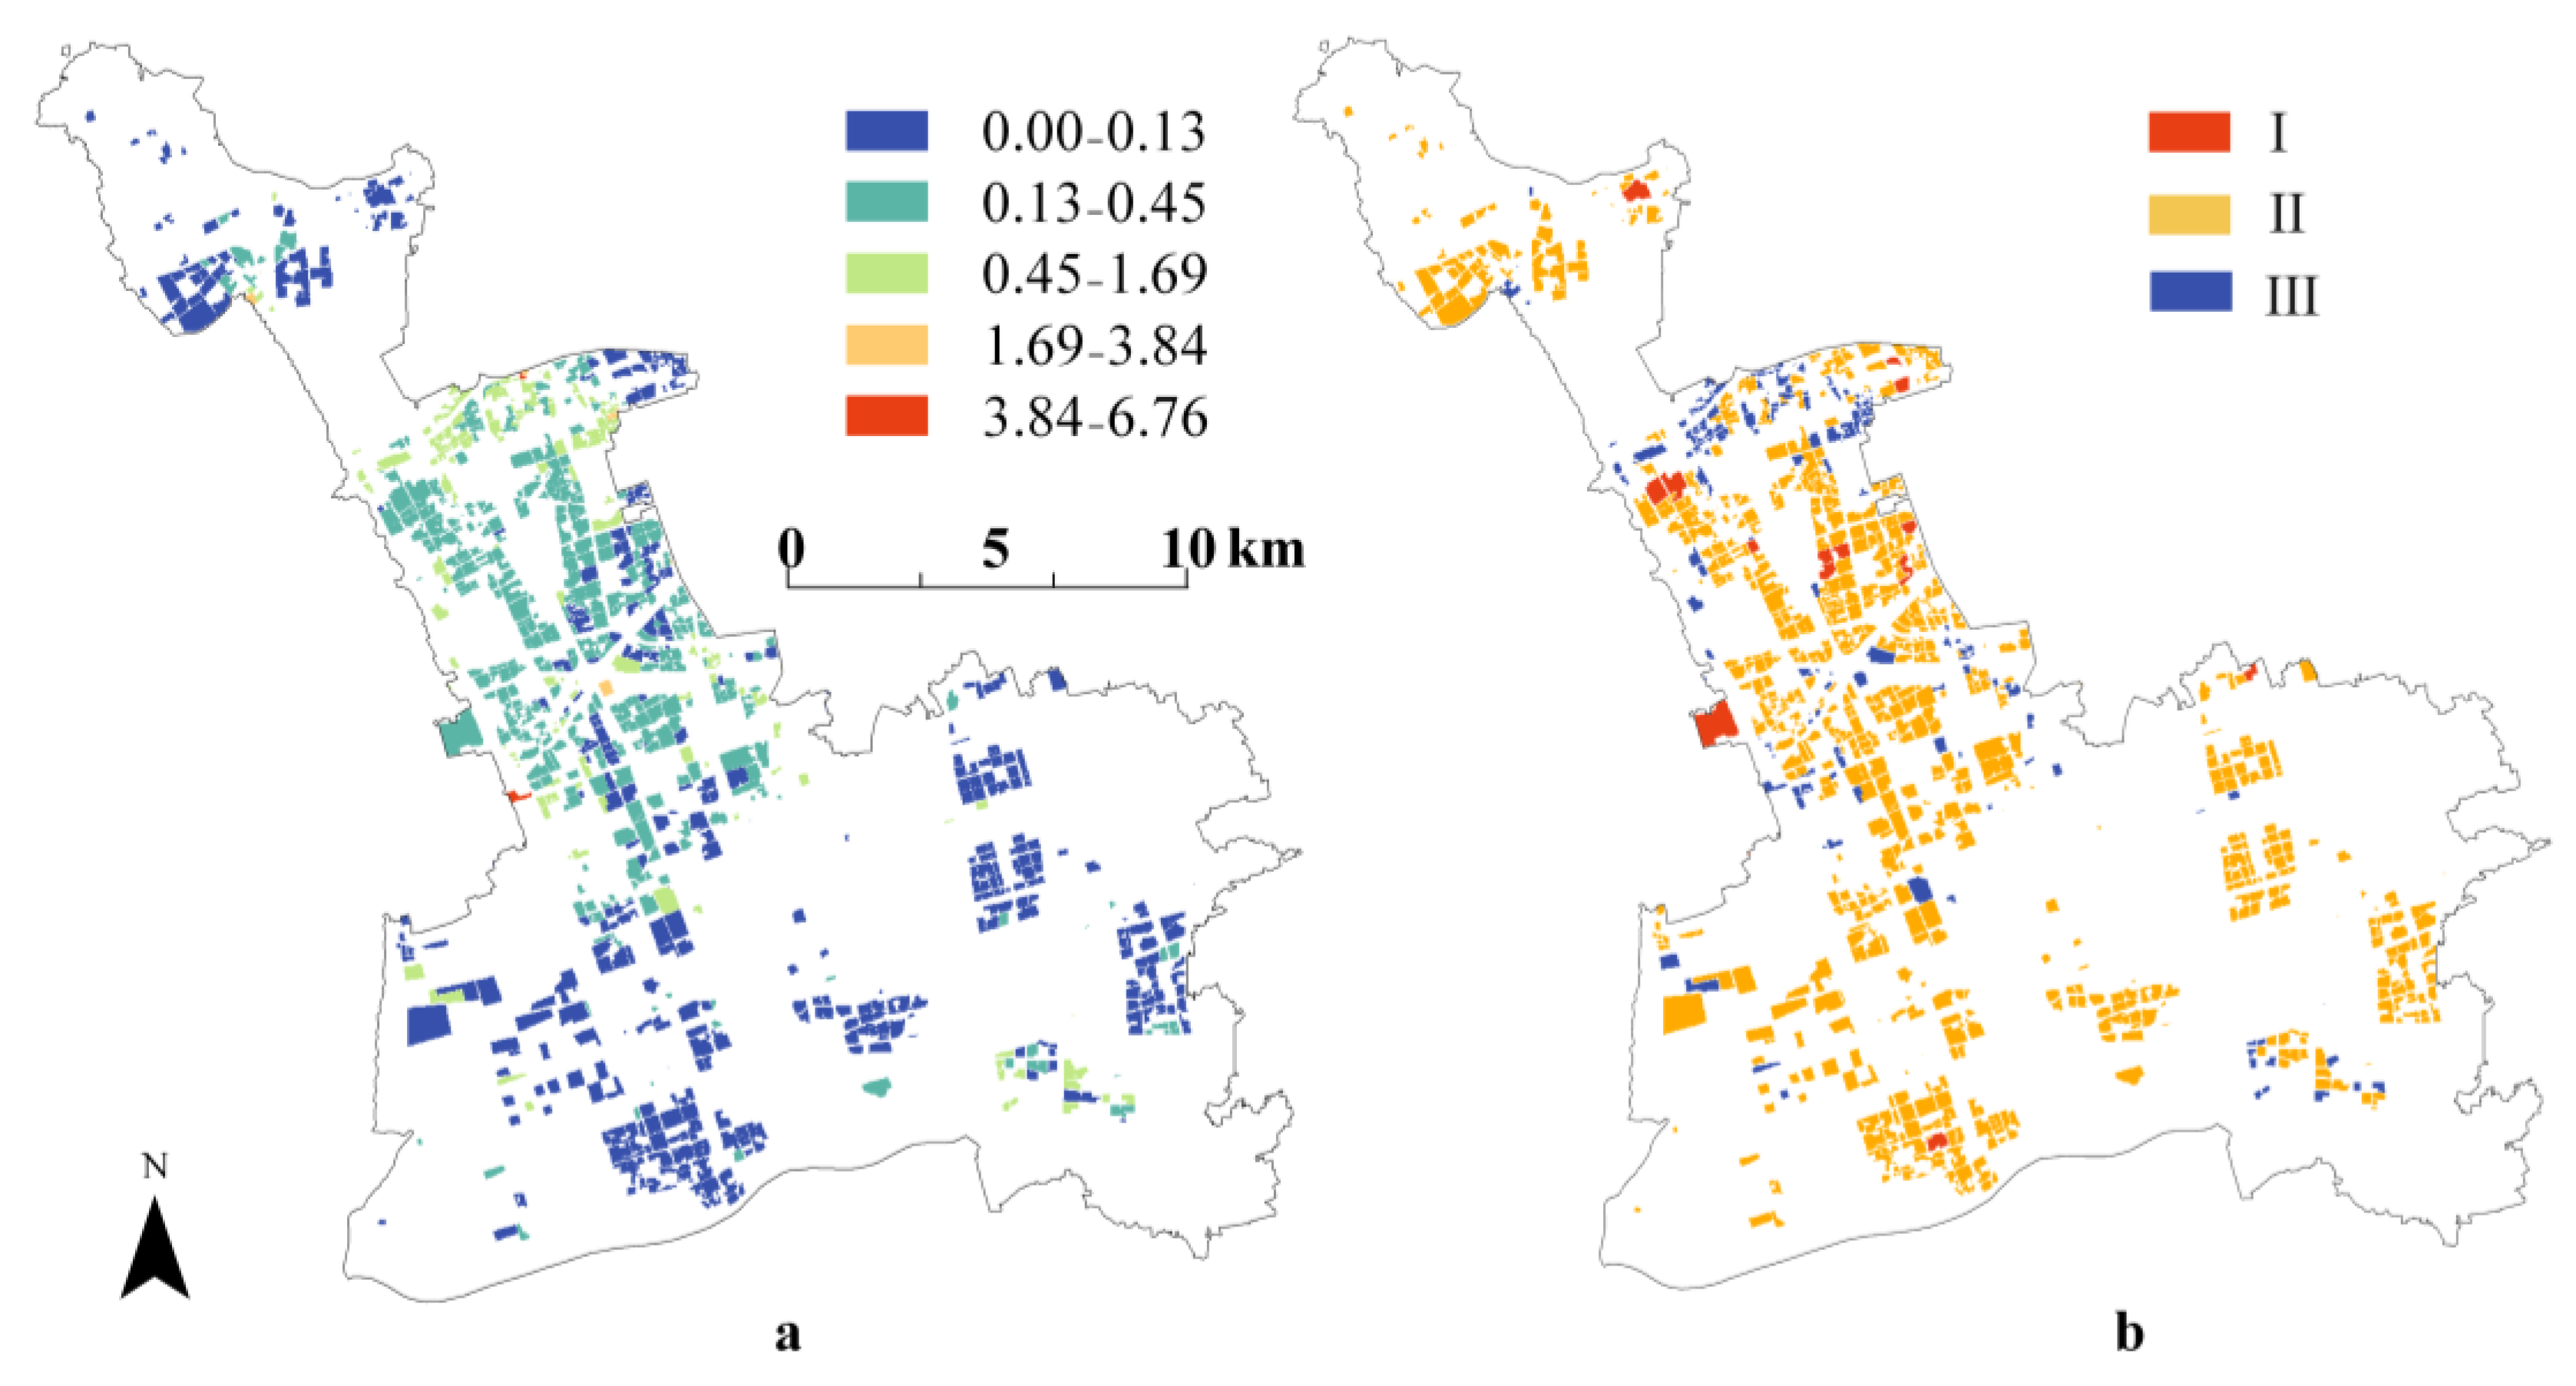
4.5. Prioritizing the Control of Heat Risk Zones for Vulnerable Groups Based on a Supply–Demand Perspective

Currently, urban renewal is shifting from being supply-oriented to being more demand-oriented [70], focusing on improving urban quality and optimizing the urban functional structure [71]. Therefore, the heat risk spaces for vulnerable groups should be a focus of future urban renewal efforts. However, urban renewal is not an overnight task; it requires balancing multiple goals, including economic, social, and environmental objectives [72]. Only through this approach can the high-quality, high-efficiency, and sustainable renewal and development of cities be effectively promoted [73]. Therefore, this study, from the perspective of supply and demand, divides the heat risk spaces for vulnerable groups and prioritizes control measures, while also proposing specific management strategies.
The neighborhood heat risk index was classified into five categories using the natural breaks method and reclassified according to Table 4, in which the demand from vulnerable groups to mitigate the heat risk ranges from low to high. The current residential density in Minhang District (Figure 11a) was also divided into five categories and assigned values as shown in Table 5, in which the ventilation supply capacity ranges from low to high. By overlaying these two classifications, the relationship between the demand for mitigating heat risks among vulnerable groups and the ventilation supply capacity in Minhang District is divided into three categories (Figure 11b). The relevant control strategies are detailed in Table 6.
The primary focus of the ventilation corridor renovation is Zone I, 5.68 km2 in total. This area faces a significant heat risk but has a weak ventilation supply capacity, and residents urgently need improved airflow and cooling conditions. The top priority is to enhance ventilation capacity. Ventilation corridors should be introduced, and enclosed streets or squares should be opened to increase air circulation. From the perspective of building adjustments, a “low windward side” approach can be implemented in the arrangement of building heights [74], where building heights gradually increase in the direction of the prevailing summer winds. This effectively guides cool summer breezes into residential areas. For building density control, the spacing between buildings should be increased to ensure proper air circulation [75]. To maintain a certain floor area ratio while reducing building density, the building heights can be increased [76]. Additionally, the orientation of building boundaries should follow the strategy of having the short sides face the wind and the long sides run parallel to the summer wind direction [77], reducing wind blockage on the windward side of the district. To enhance ecological benefits, the greening rate [78] in the area should be increased, and water bodies [79] and parks should be used as sources of cool air, providing residents with natural cooling mechanisms. In addition, energy-saving cooling technologies can be promoted, such as rooftop greening [80] and the use of insulated exterior wall materials to lower temperatures both inside and outside buildings, reducing residents’ reliance on air conditioning.
In Zone II, the heat risk is relatively lower than in Zone I, and the ventilation capacity is also weak. However, since the demand is not high, a relatively stable environment can be maintained. Modest improvements to ventilation capacity can be considered to prevent potential heat risks, such as by adding small-scale green spaces or open areas to improve local airflow [81], enhancing residents’ quality of life without the need for large-scale structural adjustments. Future development in this area should be carefully controlled to avoid increasing building density and height, ensuring environmental sustainability.
Zone III faces a low heat risk but has a strong ventilation supply capacity, providing good air circulation. When planning new buildings, the existing ventilation advantages should be leveraged for low-density development, maintaining the existing green spaces and open areas as much as possible to preserve the integrity of the urban ventilation system. Increasing the greening area or improving water body construction can further optimize the ecological environment and ensure resilience against future climate change.
In summary, different control recommendations have been proposed for the three zones. Of course, the construction of ventilation corridors must be supported by a systematic framework. Planning and design should align with the planning and management system, as well as wind corridor assessment systems. It is essential to enforce mandatory wind environment control requirements issued by planning departments. Construction units must adhere to design conditions and relevant standards and norms, such as the “Technical Guidelines for Urban Ventilation Corridor Planning” and the “Norms for Climate Feasibility Demonstration of Urban Ventilation Corridors” issued at the national level. These units should conduct their own wind environment simulation assessments and submit the results as part of their design proposals for review by relevant departments to ensure compliance with control requirements.

5. Discussion

5.1. Overall Pattern Delineation and Control Strategy of Urban Ventilation Corridor

In this study, the overall ventilation corridor pattern in Minhang District was constructed using circuit theory and ventilation resistance coefficients, following the natural landscape and leveraging the existing urban structure [21]. The design fully utilizes ecological cold sources such as urban parks, cultivated land, and forested areas, along with linear spaces like roads and rivers (Figure 12). The primary ventilation corridors follow the dominant wind direction, dispersing heat from transportation hubs, large-scale commercial zones, and industrial areas in Minhang. The secondary ventilation corridors guide fresh, cool air from compensatory spaces such as rivers and cultivated land in the suburbs into the central built-up areas. These corridors introduce high-quality airflow into the city, expel hot air trapped in heat island zones, and improve the overall urban wind environment.
After determining the ventilation corridor layout, establishing control strategies becomes crucial. Strategies can be developed based on different levels of land development intensity [82]. Ecological land within the corridor, such as parks, green spaces, cultivated land, and forested areas, should be designated as ecological control zones. The large tracts of cultivated land in the eastern suburbs of Minhang District and the Huangpu River act as compensatory spaces, providing fresh air for the ventilation corridors. To ensure these areas continue delivering high-quality ecological services to the city, it is crucial to protect them from encroachment by development and construction. For park green spaces that serve as compensatory areas, a planting strategy that maximizes tree cover in depressions can be adopted [83]. Additionally, arranging more wedge-shaped green spaces can enhance their ecological function. The wind-guiding role of linear ecological spaces such as greenways, blueways, and streets within the ventilation corridor should also be strengthened. This can be achieved by opening up urban space interfaces near rivers, guiding prevailing winds from large-scale ecological spaces into river areas, and considering the alignment between the main wind direction on water surfaces and open spaces, streets, and alleys. Increasing strips of green space parallel to the prevailing wind direction [84] will further ensure efficient airflow within the ventilation corridor.
Industrial sites located upstream of the ventilation corridor, which contribute to heat and air pollution, are designated as pollution prevention and control zones. For instance, the southern part of Meilong Township and the northern area of Wujing Township are identified as high-ventilation zones based on their ventilation resistance coefficients. However, land-use data reveals that these areas include significant amounts of industrial and mining land. Therefore, it is critical to strictly prohibit the development of restricted and obsolete types of enterprises, as delineated in the “Guidance Catalog for Industrial Structure Adjustment (2011 Edition) (Amended)” released by the Environmental Protection Department in 2013. Gradual withdrawal of existing polluting industrial land should also be guided, with strict control over development intensity to avoid creating pollution sources upstream of the ventilation corridor.
The zoning strategies proposed in this study, such as ecological control zones and pollution prevention zones, offer higher spatial resolution and evaluation accuracy compared to the macro-level principles emphasized in The Specifications for Climatic Feasibility Demonstration—Urban Ventilation Corridor (QX/T 437-2018) [85]. While the specifications provide general guidance for urban planning, our approach focuses on fine-scale spatial analysis. This difference highlights the potential of our method to complement and refine the existing guidelines by offering a more practical and technically operable path to support future policy-making and implementation.

5.2. Advancing Ventilation Corridor Identification and Equity-Oriented Function Evaluation

This study employs circuit theory to identify urban ventilation corridors, which not only enables the simulation of airflow migration and diffusion along potential pathways [35], but also facilitates the detection of vulnerable nodes and obstructed areas. In addition, this method addresses key limitations of traditional ventilation corridor construction approaches, such as time-consuming processes, restricted applicability, and insufficient accuracy. For instance, boundary layer wind tunnel experiments are costly and demand high precision in physical models [86,87]; the WRF model is suitable for macro-scale airflow simulations [17,88], but their spatial resolution is typically over 1 km, which lacks sufficient detail; CFD tools are more appropriate for micro-scale high-resolution modeling [89], but require simplification of urban building models when applied at the city scale [90].
Most existing research on the functions of urban ventilation corridors, both domestically and internationally, has focused on mitigating the urban heat island effect and reducing air pollution. However, few studies have explored the impacts of ventilation corridors on the health of vulnerable populations from a perspective of social equity. Drawing upon the risk assessment framework based on “hazard, exposure, and vulnerability” proposed in the Fifth Assessment Report of the IPCC, this study introduces the concept of accessibility—a commonly used metric in spatial equity analysis—to construct a “hazard–accessibility–vulnerability” framework for assessing high-temperature health risks. This expands the functional evaluation of urban ventilation corridors to incorporate considerations of social fairness.
By adopting a human-centered perspective, the study promotes the public interest of socially vulnerable groups. The proposed risk model aims to identify high-temperature risk zones for the elderly (aged ≥ 65) and young children (aged ≤ 5) and prioritizes the transformation of aging neighborhoods based on the cooling needs of vulnerable populations. Thus, the research contributes to the extension of urban ventilation corridor studies into the social dimension and provides a new framework for integrating environmental planning with public health equity.

5.3. Shortcomings and Prospects

This study also has certain limitations that should be addressed in future research.
This study primarily focuses on constructing macro-level urban ventilation corridors. Future work could strengthen the integration of both macro and micro scales. For instance, combining GIS with CFD numerical simulation methods [91] could help to identify ventilation paths based on spatial morphology indexes at the macro level while implementing control over spatial morphology at the micro level within specific parcels. This approach would enable dynamic, real-time data processing and visualization, making the study of ventilation corridors more systematic and scientific.
The selection of indicators for evaluating ventilation potential in this study mainly references existing urban studies. It remains to be tested whether these indicators are fully applicable to the study area. Additionally, blue–green spaces, such as water bodies and vegetation, have been proven to mitigate localized urban thermal environments. Models of ventilation corridors incorporating water and vegetation often demonstrate higher wind speeds, allowing heat to dissipate faster. However, this study primarily selected indicators related to building forms. Future research should incorporate additional factors, such as NDVI and water bodies, to test their reliability, combining building form indicators with multi-source indicators [65] to develop a more comprehensive evaluation system for ventilation potential. In addition, although the classification criteria for ventilation resistance coefficient (VRC) levels were based on the previous literature, this study did not fully account for the spatial heterogeneity between high-rise building clusters and low-rise residential areas in Minhang District. The adjustment coefficients lack systematic calibration grounded in local morphological characteristics. Future research could improve the model’s local applicability and accuracy by refining parameter settings based on spatial distributions of building height and density.
Lastly, this study mainly evaluates the unidimensional benefits of ventilation corridors in reducing high-temperature risks for vulnerable groups, such as the elderly and children, during the summer. However, ventilation corridors also offer other advantages. For instance, combining air pollution data could help to assess their impact on reducing haze. There is sufficient evidence to show a strong correlation between the urban heat island effect and the haze island effect, and this interaction may exacerbate the threat of climate change for cities. Therefore, future research should move beyond a single-dimensional analysis and evaluate the comprehensive, multidimensional benefits of ventilation corridors.

6. Conclusions

This paper uses Minhang District, Shanghai, as a case study to construct urban ventilation corridors based on circuit theory and ventilation resistance coefficients, aiming to mitigate the urban heat island effect. The main conclusions are as follows:
(1)
The surface temperature in Minhang District exhibits a pattern of being higher on the west side and lower on the east side of the Huangpu River. The urban heat island effect shows localized aggregation, primarily concentrated around transportation hubs, large commercial areas, and industrial zones. The distribution of urban cold islands is uneven, with most located in the east. In contrast, cold islands in the western region are small and scattered. The cold island areas are predominantly composed of blue–green spaces such as cultivated land, woodlands, parks, and rivers. The ventilation resistance in Minhang District decreases from the central area toward the north and south. The central built-up area has taller, denser buildings, creating greater wind obstruction. In comparison, the northern and southern suburbs have a higher green space coverage and lower building density, giving these areas a higher overall ventilation potential.
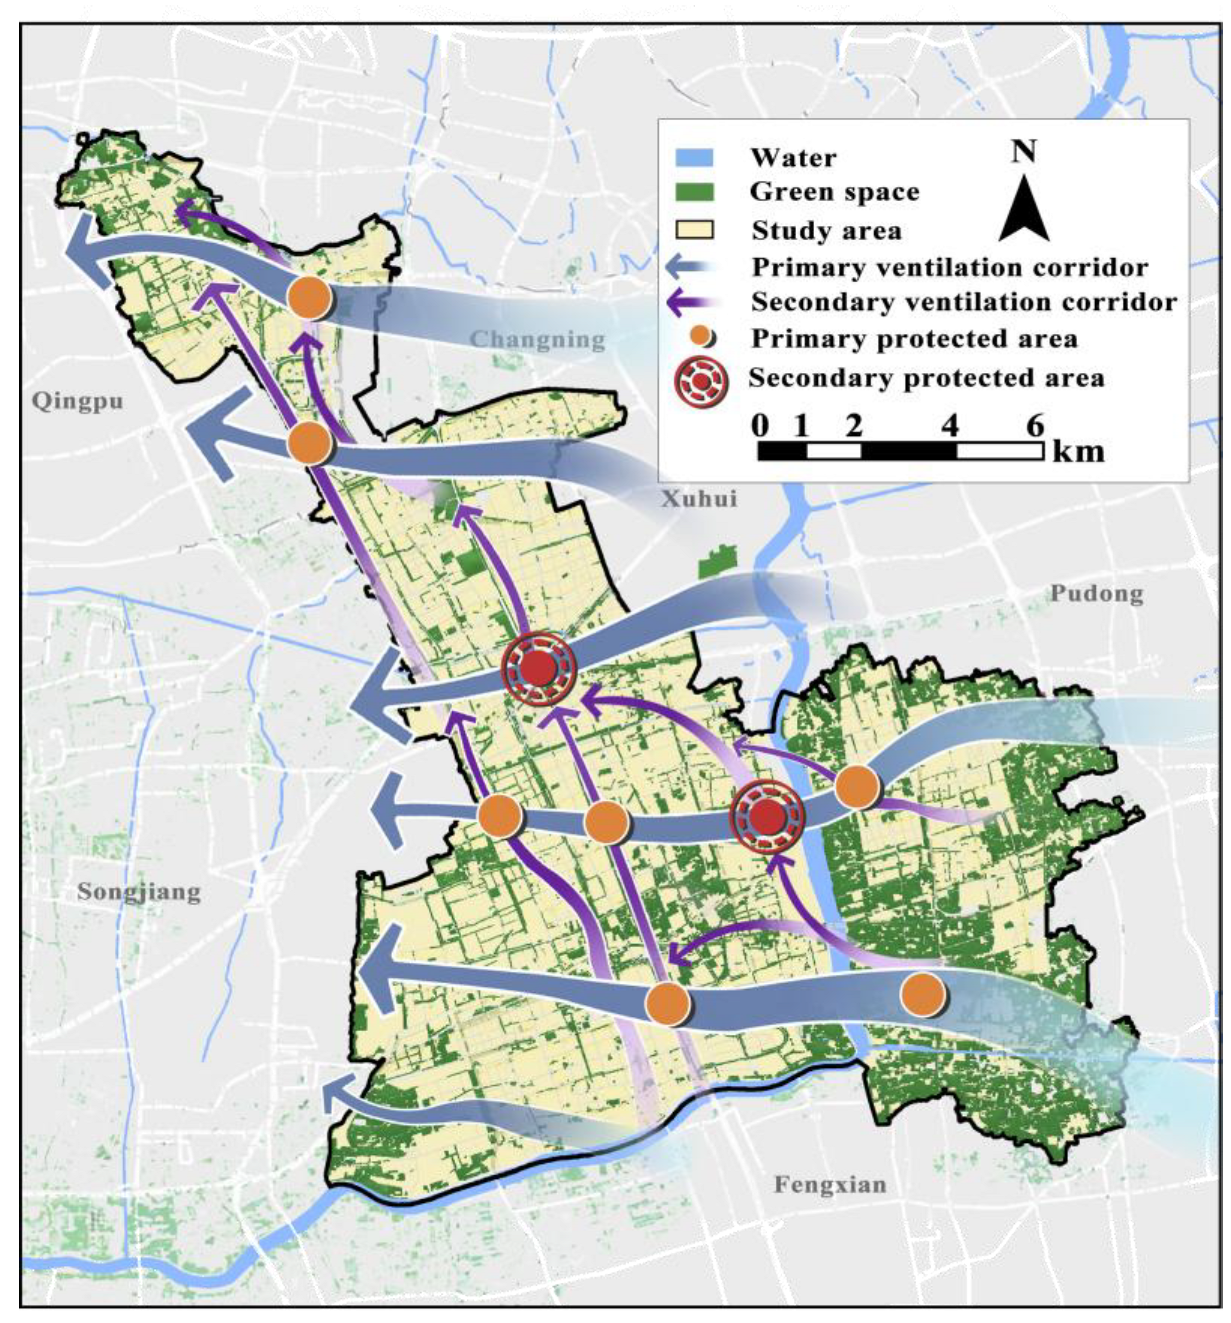
(2)
We set 12 inlets and 12 outlets for the primary ventilation corridor; 7 air inlets and 6 outlets are separately set at the geometric centers of the compensation spaces and the action spaces. Based on circuit theory, 12 primary ventilation corridors aligned with the prevailing summer winds and 9 ecological pinchpoints totaling 0.43 km2 were identified. In total, 42 secondary corridors were constructed using the ventilation resistance coefficient to alleviate the heat island effect, connect urban cold islands, and promote internal air circulation within Minhang District and 6 ecological pinchpoints totaling 0.49 km2 were identified.
(3)
A health risk assessment framework for heat, based on the “hazard–accessibility–vulnerability” model, identified five resident districts totaling 1.45 km2 in Minhang District with the highest heat risk. From a supply–demand perspective, a 5.68 km2 area exhibited imbalances. Renewal and renovation strategies were proposed to address these challenges, focusing on the need to introduce ventilation corridors, adjust buildings, enhance ecological benefits, promote energy-efficient cooling, and moderate development. At the urban scale, the land within the ventilation corridors was divided into three zones: ecological control zone, pollution industry prevention and control zone, and built land control zone. Targeted control strategies were developed for each zone. The implementation of these plans requires strong policy support, and it is recommended that local laws and regulations be enacted to protect and regulate the development and use of ventilation corridors. Additionally, integrating the planning management system with a wind corridor assessment system and involving multiple departments in the planning review process will strengthen the enforcement of wind environment control measures.

Author Contributions

Conceptualization, L.Z. and Q.Z. (Qingping Zhang); Methodology, X.C.; Software, X.C.; Validation, X.C., Q.Z. (Qicheng Zhong), G.Z. and Y.Y.; Formal analysis, X.C. and D.W.; Investigation, X.C., Q.Z. (Qicheng Zhong), G.Z., Y.Y. and D.W.; Resources, L.Z. and Q.Z. (Qingping Zhang); Data curation, X.C.; Writing—original draft, X.C.; Writing—review & editing, X.C.; Visualization, X.C., D.W. and Y.Y.; Project administration, L.Z., Q.Z. (Qicheng Zhong), G.Z. and Q.Z. (Qingping Zhang); Funding acquisition, L.Z., Q.Z. (Qingping Zhang) and Y.Y. All authors have read and agreed to the published version of the manuscript.

Funding

This research was supported by the National Key Research and Development Program of China, grant number No. 2022YFC3802604 (funder: L.Z.); the National Natural Science Foundation of China, grant number No. 32171569 (funder: L.Z.); Shanghai Committee of Science and Technology, grant number No. 23DZ1204400 (funder: L.Z.); Jiangsu Province Key R&D Program Social Development Project, grant number No. BE2023822 (funder: Qingping Zhang); Priority Academic Program Development of Jiangsu Higher Education Institutions, grant number: PAPD (funder: Qingping Zhang); the Natural Science Foundation of Shanghai, grant number No. 23ZR1459700 (funder: Y.Y.); and the Yangfan Special Project of the Shanghai Qimingxing Program, grant number No. 22YF1444000 (funder: Y.Y.).

Data Availability Statement

The raw data supporting the conclusions of this article will be made available by the authors on request.

Conflicts of Interest

The authors declare no conflicts of interest.

References

  1. Yang, Z. The Concept, Goal and Path of High-Quality Urban Development from the Perspective of Humanism. Mod. Urban Res. 2023, 3, 52–59+67. (In Chinese) [Google Scholar]
  2. Kang, Y.; Zhang, J. Reflections on Humanistic Urban Planning. Urban Plan. Forum 2006, 1, 56–59. (In Chinese) [Google Scholar]
  3. Hsieh, C.M.; Aramaki, T.; Hanaki, K. Managing Heat Rejected from Air Conditioning Systems to Save Energy and Improve the Microclimates of Residential Buildings. Comput. Environ. Urban Syst. 2011, 35, 358–367. [Google Scholar] [CrossRef]
  4. Emmanuel, R. An Urban Approach to Climate Sensitive Design: Strategies for the Tropics; Taylor & Francis: London, UK, 2005; ISBN 978-0-203-41464-4. [Google Scholar]
  5. Santamouris, M. Cooling the Cities—A Review of Reflective and Green Roof Mitigation Technologies to Fight Heat Island and Improve Comfort in Urban Environments. Sol. Energy 2014, 103, 682–703. [Google Scholar] [CrossRef]
  6. Luan, G.; Zhou, M. Review of the effect of ambient temperature on population health. All Health 2015, 9, 14–16. (In Chinese) [Google Scholar]
  7. Zheng, Y. Progress and responses in the global response to climate change disaster risk. People’s Trib. 2022, 14, 24–27. (In Chinese) [Google Scholar]
  8. Hsieh, C.-M.; Huang, H.-C. Mitigating Urban Heat Islands: A Method to Identify Potential Wind Corridor for Cooling and Ventilation. Comput. Environ. Urban Syst. 2016, 57, 130–143. [Google Scholar] [CrossRef]
  9. Bolte, G.; Tamburlini, G.; Kohlhuber, M. Environmental Inequalities among Children in Europe—Evaluation of Scientific Evidence and Policy Implications. Eur. J. Public Health 2010, 20, 14–20. [Google Scholar] [CrossRef]
  10. Zhao, Z.-Q.; He, B.-J.; Li, L.-G.; Wang, H.-B.; Darko, A. Profile and Concentric Zonal Analysis of Relationships between Land Use/Land Cover and Land Surface Temperature: Case Study of Shenyang, China. Energy Build. 2017, 155, 282–295. [Google Scholar] [CrossRef]
  11. Yu, Z.; Chen, T.; Yang, G.; Sun, R.; Xie, W.; Vejre, H. Quantifying Seasonal and Diurnal Contributions of Urban Landscapes to Heat Energy Dynamics. Appl. Energy 2020, 264, 114724. [Google Scholar] [CrossRef]
  12. Zhou, X.; Wang, Y.-C. Spatial–Temporal Dynamics of Urban Green Space in Response to Rapid Urbanization and Greening Policies. Landsc. Urban Plan. 2011, 100, 268–277. [Google Scholar] [CrossRef]
  13. Zhang, X.; Estoque, R.C.; Murayama, Y. An Urban Heat Island Study in Nanchang City, China Based on Land Surface Temperature and Social-Ecological Variables. Sustain. Cities Soc. 2017, 32, 557–568. [Google Scholar] [CrossRef]
  14. Gartland, L.M. Heat Islands: Understanding and Mitigating Heat in Urban Areas; Routledge: London, UK, 2008; ISBN 978-1-84977-155-9. [Google Scholar]
  15. He, B.-J.; Ding, L.; Prasad, D. Relationships among Local-Scale Urban Morphology, Urban Ventilation, Urban Heat Island and Outdoor Thermal Comfort under Sea Breeze Influence. Sustain. Cities Soc. 2020, 60, 102289. [Google Scholar] [CrossRef]
  16. Zheng, Z.; Ren, G.; Gao, H.; Yang, Y. Urban Ventilation Planning and Its Associated Benefits Based on Numerical Experiments: A Case Study in Beijing, China. Build. Environ. 2022, 222, 109383. [Google Scholar] [CrossRef]
  17. Li, X.; Lin, K.; Shu, Y.; Lin, X. Comparison of the Influences of Different Ventilation Corridor Forms on the Thermal Environment in Wuhan City in Summer. Sci. Rep. 2023, 13, 13416. [Google Scholar] [CrossRef]
  18. Jiang, L.; Liu, C.; Shu, Q. A WRF-UCM Modeling Approach of Assessing the Impacts of Green Corridors on Urban Heat Island Effects Alleviation: A Case Study of Shanghai. Build. Energy Effic. 2019, 47, 89–96. (In Chinese) [Google Scholar]
  19. Mirzaei, P.A. CFD Modeling of Micro and Urban Climates: Problems to Be Solved in the New Decade. Sustain. Cities Soc. 2021, 69, 102839. [Google Scholar] [CrossRef]
  20. Chang, S.; Jiang, Q.; Zhao, Y. Integrating CFD and GIS into the Development of Urban Ventilation Corridors: A Case Study in Changchun City, China. Sustainability 2018, 10, 1814. [Google Scholar] [CrossRef]
  21. Liu, Y.; Cheng, P.; Chen, P.; Zhang, S. Detection of Wind Corridors Based on “Climatopes”: A Study in Central Ji’nan. Theor. Appl. Clim. 2020, 142, 869–884. [Google Scholar] [CrossRef]
  22. Luo, Y.; He, J.; Ni, Y. Analysis of Urban Ventilation Potential Using Rule-Based Modeling. Comput. Environ. Urban Syst. 2017, 66, 13–22. [Google Scholar] [CrossRef]
  23. Liu, X.; Huang, B.; Li, R.; Zhang, J.; Gou, Q.; Zhou, T.; Huang, Z. Wind Environment Assessment and Planning of Urban Natural Ventilation Corridors Using GIS: Shenzhen as a Case Study. Urban Clim. 2022, 42, 101091. [Google Scholar] [CrossRef]
  24. Fang, Y.; Zhao, L. Assessing the Environmental Benefits of Urban Ventilation Corridors: A Case Study in Hefei, China. Build. Environ. 2022, 212, 108810. [Google Scholar] [CrossRef]
  25. Lan, H.; Lau, K.K.-L.; Shi, Y.; Ren, C. Improved Urban Heat Island Mitigation Using Bioclimatic Redevelopment along an Urban Waterfront at Victoria Dockside, Hong Kong. Sustain. Cities Soc. 2021, 74, 103172. [Google Scholar] [CrossRef]
  26. Grafius, D.R.; Corstanje, R.; Siriwardena, G.M.; Plummer, K.E.; Harris, J.A. A Bird’s Eye View: Using Circuit Theory to Study Urban Landscape Connectivity for Birds. Landsc. Ecol. 2017, 32, 1771–1787. [Google Scholar] [CrossRef]
  27. McRae, B.H.; Dickson, B.G.; Keitt, T.H.; Shah, V.B. Using Circuit Theory to Model Connectivity in Ecology, Evolution, and Conservation. Ecology 2008, 89, 2712–2724. [Google Scholar] [CrossRef]
  28. LaPoint, S.; Gallery, P.; Wikelski, M.; Kays, R. Animal Behavior, Cost-Based Corridor Models, and Real Corridors. Landsc. Ecol. 2013, 28, 1615–1630. [Google Scholar] [CrossRef]
  29. Koen, E.L.; Bowman, J.; Sadowski, C.; Walpole, A.A. Landscape Connectivity for Wildlife: Development and Validation of Multispecies Linkage Maps. Methods Ecol. Evol. 2014, 5, 626–633. [Google Scholar] [CrossRef]
  30. Peng, J.; Yang, Y.; Liu, Y.; Hu, Y.; Du, Y.; Meersmans, J.; Qiu, S. Linking Ecosystem Services and Circuit Theory to Identify Ecological Security Patterns. Sci. Total Environ. 2018, 644, 781–790. [Google Scholar] [CrossRef]
  31. Wang, C.; Yu, C.; Chen, T.; Feng, Z.; Hu, Y.; Wu, K. Can the Establishment of Ecological Security Patterns Improve Ecological Protection? An Example of Nanchang, China. Sci. Total Environ. 2020, 740, 140051. [Google Scholar] [CrossRef]
  32. Li, Y.; Liu, W.; Feng, Q.; Zhu, M.; Yang, L.; Zhang, J.; Yin, X. The Role of Land Use Change in Affecting Ecosystem Services and the Ecological Security Pattern of the Hexi Regions, Northwest China. Sci. Total Environ. 2023, 855, 158940. [Google Scholar] [CrossRef]
  33. Xie, P.; Yang, J.; Wang, H.; Liu, Y.; Liu, Y. A New Method of Simulating Urban Ventilation Corridors Using Circuit Theory. Sustain. Cities Soc. 2020, 59, 102162. [Google Scholar] [CrossRef]
  34. Pelletier, D.; Clark, M.; Anderson, M.G.; Rayfield, B.; Wulder, M.A.; Cardille, J.A. Applying Circuit Theory for Corridor Expansion and Management at Regional Scales: Tiling, Pinch Points, and Omnidirectional Connectivity. PLoS ONE 2014, 9, e84135. [Google Scholar] [CrossRef] [PubMed]
  35. Fang, Y.; Gu, K. A Review of Urban Ventilation Corridors: Characteristics and Progress. Acta Ecol. Sin. 2024, 13, 5444–5458. (In Chinese) [Google Scholar]
  36. O’Neill, B.C.; Oppenheimer, M.; Warren, R.; Hallegatte, S.; Kopp, R.E.; Pörtner, H.O.; Scholes, R.; Birkmann, J.; Foden, W.; Licker, R.; et al. IPCC Reasons for Concern Regarding Climate Change Risks. Nat. Clim. Change 2017, 7, 28–37. [Google Scholar] [CrossRef]
  37. Oven, K.J.; Curtis, S.E.; Reaney, S.; Riva, M.; Stewart, M.G.; Ohlemueller, R.; Dunn, C.E.; Nodwell, S.; Dominelli, L.; Holden, R. Climate Change and Health and Social Care: Defining Future Hazard, Vulnerability and Risk for Infrastructure Systems Supporting Older People’s Health Care in England. Appl. Geogr. 2012, 33, 16–24. [Google Scholar] [CrossRef]
  38. Bennett, J.E.; Blangiardo, M.; Fecht, D.; Elliott, P.; Ezzati, M. Vulnerability to the Mortality Effects of Warm Temperature in the Districts of England and Wales. Nat. Clim. Change 2014, 4, 269–273. [Google Scholar] [CrossRef]
  39. Uejio, C.K.; Wilhelmi, O.V.; Golden, J.S.; Mills, D.M.; Gulino, S.P.; Samenow, J.P. Intra-Urban Societal Vulnerability to Extreme Heat: The Role of Heat Exposure and the Built Environment, Socioeconomics, and Neighborhood Stability. Health Place 2011, 17, 498–507. [Google Scholar] [CrossRef]
  40. Xie, P.; Wang, Y.L.; Liu, Y.X.; Peng, J. Incorporating social vulnerability to assess population health risk due to heat stress in China. Acta Geogr. Sin. 2015, 70, 1041–1051. (In Chinese) [Google Scholar]
  41. Jennings, V.; Johnson Gaither, C.; Gragg, R.S. Promoting Environmental Justice Through Urban Green Space Access: A Synopsis. Environ. Justice 2012, 5, 1–7. [Google Scholar] [CrossRef]
  42. Zhang, J.; Yu, Z.; Cheng, Y.; Chen, C.; Wan, Y.; Zhao, B.; Vejre, H. Evaluating the Disparities in Urban Green Space Provision in Communities with Diverse Built Environments: The Case of a Rapidly Urbanizing Chinese City. Build. Environ. 2020, 183, 107170. [Google Scholar] [CrossRef]
  43. Yang, H.; Chen, T.; Zeng, Z.; Mi, F. Does Urban Green Space Justly Improve Public Health and Well-Being? A Case Study of Tianjin, a Megacity in China. J. Clean. Prod. 2022, 380, 134920. [Google Scholar] [CrossRef]
  44. Sun, Y.; Tian, D.; Zhang, M.; Hou, Y. Spatial Green Space Accessibility in Hongkou District of Shanghai Based on Gaussian Two-Step Floating Catchment Area Method. Buildings 2023, 13, 2477. [Google Scholar] [CrossRef]
  45. Tian, D.; Wang, J.; Xia, C.; Zhang, J.; Zhou, J.; Tian, Z.; Zhao, J.; Li, B.; Zhou, C. The Relationship between Green Space Accessibility by Multiple Travel Modes and Housing Prices: A Case Study of Beijing. Cities 2024, 145, 104694. [Google Scholar] [CrossRef]
  46. Chen, Y.; Yue, W.; Rosa, D.L. Which Communities Have Better Accessibility to Green Space? An Investigation into Environmental Inequality Using Big Data. Landsc. Urban Plan. 2020, 204, 103919. [Google Scholar] [CrossRef]
  47. Zhao, C.; Zhang, S.; Zhu, H.; Gu, X.; Liu, M. Differences in the evolution of urban and rural surface thermal environment and their responses to urban renewal in Shanghai, China. Chin. J. Appl. Ecol. 2023, 34, 1923–1931. (In Chinese) [Google Scholar] [CrossRef]
  48. Chen, F.; Dong, C.; Zhang, J.; Qian, H.; Wu, Z.; Shi, Y.; Sun, X. Effects of heat waves on heat stroke in Shanghai, 2013–2023. J. Environ. Occup. Med. 2024, 41, 610–616. (In Chinese) [Google Scholar]
  49. Zhang, R.; Zhang, Q.; Zhang, L.; Zhong, Q.; Liu, J.; Wang, Z. Identification and Extraction of a Current Urban Ecological Network in Minhang District of Shanghai Based on an Optimization Method. Ecol. Indic. 2022, 136, 108647. [Google Scholar] [CrossRef]
  50. Zhang, R.; Zhang, L.; Zhong, Q.; Zhang, Q.; Ji, Y.; Song, P.; Wang, Q. An Optimized Evaluation Method of an Urban Ecological Network: The Case of the Minhang District of Shanghai. Urban For. Urban Green. 2021, 62, 127158. [Google Scholar] [CrossRef]
  51. Wang, Y.; Xu, Y.; Yang, J.; Chen, Y.; Wei, J.; Zhou, J.; Zhang, W.; Cheng, W. Dynamic monitoring and spatio-temporal pattern evolution analysis of eco-environmental quality in Chongqing based on remote sensing. Acta Ecol. Sin. 2023, 43, 6278–6292. [Google Scholar]
  52. Kress, R. (Ed.) Regionale Luftaustauschprozesse Und Ihre Bedeutung Für Die Räumliche Planung; Bundesminister für Raumordnung, Bauwesen und Städtebau: Bad Godesberg, Germany, 1979. [Google Scholar]
  53. Liang, H.; Kasimu, A.; Zhang, X.; Zhao, Y.; Reheman, R. Spatio-temporal change and influencing factors of land surface temperature in oasis urban agglomeration in arid region: A case study in the urban agglomeration on the northern slope of Tianshan Mountains. Acta Ecol. Sin. 2023, 43, 3650–3664. (In Chinese) [Google Scholar]
  54. Chen, S.; Wang, T. A Comparative Study of the Equal Interval Method and the Mean-Standard Deviation Method for Defining Urban Heat Islands. J. Geo-Inf. Sci. 2009, 11, 145–150. (In Chinese) [Google Scholar]
  55. Gál, T.; Unger, J. Detection of Ventilation Paths Using High-Resolution Roughness Parameter Mapping in a Large Urban Area. Build. Environ. 2009, 44, 198–206. [Google Scholar] [CrossRef]
  56. Zakšek, K.; Oštir, K.; Kokalj, Ž. Sky-View Factor as a Relief Visualization Technique. Remote Sens. 2011, 3, 398–415. [Google Scholar] [CrossRef]
  57. Liu, Y.; Xu, Y.; Zhang, F.; Cheng, C. Research and Application of Urban Surface Ventilation Potential: Cases of Beijing and Guangzhou. Planners 2019, 35, 32–40. (In Chinese) [Google Scholar]
  58. Shen, C.; Shen, A.; Cui, Y.; Chen, X.; Liu, Y.; Fan, Q.; Chan, P.; Tian, C.; Wang, C.; Lan, J.; et al. Spatializing the Roughness Length of Heterogeneous Urban Underlying Surfaces to Improve the WRF Simulation-Part 1: A Review of Morphological Methods and Model Evaluation. Atmos. Environ. 2022, 270, 118874. [Google Scholar] [CrossRef]
  59. Grimmond, S.; Oke, T. Aerodynamic Properties of Urban Areas Derived from Analysis of Surface Form. J. Appl. Meteorol. 1999, 38, 1262–1292. [Google Scholar] [CrossRef]
  60. Ng, E.; Yuan, C.; Chen, L.; Ren, C.; Fung, J.C.H. Improving the Wind Environment in High-Density Cities by Understanding Urban Morphology and Surface Roughness: A Study in Hong Kong. Landsc. Urban Plan. 2011, 101, 59–74. [Google Scholar] [CrossRef]
  61. Raupach, M.R. Drag and Drag Partition on Rough Surfaces. Bound.-Layer Meteorol. 1992, 60, 375–395. [Google Scholar] [CrossRef]
  62. Chen, L.; Ng, E.; An, X.; Ren, C.; Lee, M.; Wang, U.; He, Z. Sky View Factor Analysis of Street Canyons and Its Implications for Daytime Intra-Urban Air Temperature Differentials in High-Rise, High-Density Urban Areas of Hong Kong: A GIS-Based Simulation Approach. Int. J. Climatol. 2012, 32, 121–136. [Google Scholar] [CrossRef]
  63. Zhou, G.; Huan, Y.; Wang, L.; Lan, Y.; Liang, T.; Shi, B.; Zhang, Q. Linking Ecosystem Services and Circuit Theory to Identify Priority Conservation and Restoration Areas from an Ecological Network Perspective. Sci. Total Environ. 2023, 873, 162261. [Google Scholar] [CrossRef]
  64. Dickson, B.G.; Albano, C.M.; Anantharaman, R.; Beier, P.; Fargione, J.; Graves, T.A.; Gray, M.E.; Hall, K.R.; Lawler, J.J.; Leonard, P.B.; et al. Circuit-Theory Applications to Connectivity Science and Conservation. Conserv. Biol. 2019, 33, 239–249. [Google Scholar] [CrossRef] [PubMed]
  65. Yu, H.; Xiao, H.; Gu, X. Integrating Species Distribution and Piecewise Linear Regression Model to Identify Functional Connectivity Thresholds to Delimit Urban Ecological Corridors. Comput. Environ. Urban Syst. 2024, 113, 102177. [Google Scholar] [CrossRef]
  66. Wang, Y.; Qu, Z.; Zhong, Q.; Zhang, Q.; Zhang, L.; Zhang, R.; Yi, Y.; Zhang, G.; Li, X.; Liu, J. Delimitation of Ecological Corridors in a Highly Urbanizing Region Based on Circuit Theory and MSPA. Ecol. Indic. 2022, 142, 109258. [Google Scholar] [CrossRef]
  67. Heaton, M.J.; Sain, S.R.; Greasby, T.A.; Uejio, C.K.; Hayden, M.H.; Monaghan, A.J.; Boehnert, J.; Sampson, K.; Banerjee, D.; Nepal, V.; et al. Characterizing Urban Vulnerability to Heat Stress Using a Spatially Varying Coefficient Model. Spat. Spatio-Temporal Epidemiol. 2014, 8, 23–33. [Google Scholar] [CrossRef]
  68. Wang, M.; Chen, Z.J.; Zhou, C. Accessibility of urban green open space based on weighted two-step floating catchment area method: A case study of the central district of Nanjing City. Acta Ecol. Sin. 2023, 43, 5347–5356. (In Chinese) [Google Scholar]
  69. Cutter, S.L.; Boruff, B.J.; Shirley, W.L. Social Vulnerability to Environmental Hazards. Soc. Sci. Q. 2003, 84, 242–261. [Google Scholar] [CrossRef]
  70. Gong, C.; Wu, X.; Hu, C. The Systematic planning method of transforming urban vacant land to green infrastructure: A case study of Richmond in USA. Chin. Landsc. Archit. 2017, 33, 74–79. (In Chinese) [Google Scholar]
  71. Xiao, H.; Xu, Y.; Wang, Z.; Zhang, X.; Li, J. Spatial and Temporal Distribution Characteristics of Atmospheric PM10 and PM2.5 and Correlation Analysis with Urban Block Morphology in Jinan City. Landsc. Archit. Acad. J. 2024, 41, 121–130. (In Chinese) [Google Scholar]
  72. Zhang, J.; Chen, H. Research on western urban space renewal from the perspective of space re-production. Hum. Geogr. 2012, 27, 1–5. (In Chinese) [Google Scholar]
  73. Cao, K.; Deng, Y. Spatio-temporal evolution path and driving mechanisms of sustainable urban renewal: Prog ress and perspective. Prog. Geogr. 2021, 40, 1942–1955. (In Chinese) [Google Scholar] [CrossRef]
  74. Song, D.; Lu, M.; Xing, J. Impact of Spatial Layout on Vertical Wind Conditions and Comfort Levels in High-Rise Residential Buildings in Shenzhen. Urban CLim. 2024, 55, 101949. [Google Scholar] [CrossRef]
  75. Abdallah, A.S.H.; Mahmoud, R.M.A. Urban Morphology as an Adaptation Strategy to Improve Outdoor Thermal Comfort in Urban Residential Community of New Assiut City, Egypt. Sustain. Cities Soc. 2022, 78, 103648. [Google Scholar] [CrossRef]
  76. Hachem, C.; Athienitis, A.; Fazio, P. Energy Performance Enhancement in Multistory Residential Buildings. Appl. Energy 2014, 116, 9–19. [Google Scholar] [CrossRef]
  77. Mittal, H.; Sharma, A.; Gairola, A. Numerical Simulation of Pedestrian Level Wind Flow around Buildings: Effect of Corner Modification and Orientation. J. Build. Eng. 2019, 22, 314–326. [Google Scholar] [CrossRef]
  78. Yan, H.; Wu, F.; Dong, L. Influence of a Large Urban Park on the Local Urban Thermal Environment. Sci. Total Environ. 2018, 622, 882–891. [Google Scholar] [CrossRef]
  79. Jacobs, C.; Klok, L.; Bruse, M.; Cortesão, J.; Lenzholzer, S.; Kluck, J. Are Urban Water Bodies Really Cooling? Urban Clim. 2020, 32, 100607. [Google Scholar] [CrossRef]
  80. Rahman, M.S.; MacPherson, S.; Lefsrud, M. A Study on Evaporative Cooling Capacity of a Novel Green Wall to Control Ventilating Air Temperature. J. Build. Eng. 2023, 77, 107466. [Google Scholar] [CrossRef]
  81. Razzaghi Asl, S.; Pearsall, H. How Do Different Modes of Governance Support Ecosystem Services/Disservices in Small-Scale Urban Green Infrastructure? A Systematic Review. Land 2022, 11, 1247. [Google Scholar] [CrossRef]
  82. Huang, C.; Wei, Z.; Cao, J.; Deng, H. Construction and Management of Urban Ventilation Corridor Systems: A Case Study of Hefei. Shanghai Urban Plan. Rev. 2020, 4, 120–125. (In Chinese) [Google Scholar]
  83. Zhang, Y.; Yin, S.; Xiao, Y. Evaluation and Strategy of Urban River Space Design from a Climate Adaptation Perspective: A Case Study of the First Phase of Litchi Bay Creek Renovation in Guangzhou. J. Hum. Settl. West China 2018, 33, 73–79. (In Chinese) [Google Scholar]
  84. Liu, Y.; Guo, J.; Wei, Q. Analysis of the Thermal Environment Effect of Urban Green Space Patterns Based on CFD. Acta Ecol. Sin. 2012, 32, 1951–1959. (In Chinese) [Google Scholar]
  85. QX/T 437-2018; Specifications for Climatic Feasibility Demonstration—Urban Ventilation Corridor. China Meteorological Administration: Beijing, China, 2018.
  86. Tutar, M.; Oguz, G. Large Eddy Simulation of Wind Flow around Parallel Buildings with Varying Configurations. Fluid Dyn. Res. 2002, 31, 289–315. [Google Scholar] [CrossRef]
  87. Dabberdt, W.F.; Hoydysh, W.G. Street Canyon Dispersion: Sensitivity to Block Shape and Entrainment. Atmospheric Environment. Part A. Gen. Top. 1991, 25, 1143–1153. [Google Scholar] [CrossRef]
  88. Meng, W.; Zhang, Y.; Li, J.; Lin, W.; Da, I.G.; Li, H. Application of WRF/UCM in the simulation of a heat wave event and urban heat island around Guangzhou city. J. Trop. Meteorol. 2010, 26, 273–282. (In Chinese) [Google Scholar]
  89. Toparlar, Y.; Blocken, B.; Maiheu, B.; van Heijst, G.J.F. A Review on the CFD Analysis of Urban Microclimate. Renew. Sustain. Energy Rev. 2017, 80, 1613–1640. [Google Scholar] [CrossRef]
  90. Wu, Z.; Yan, T.; Fu, X. CFD Simulation Technology Based Analysis on Urban Wind Environment of Shenzhen. Constr. Qual. 2009, 27, 49–53. (In Chinese) [Google Scholar]
  91. Yin, J.; Zhan, Q. Study on Urban Street Ventilation Corridors Based on GIS and CFD: A Case Study of Wuhan. Chin. Landsc. Archit. 2019, 35, 84–88. (In Chinese) [Google Scholar]
Figure 1. Land use and geomorphology of the study area.
Land 14 01378 g001
Figure 2. Perennial wind rose diagram of Shanghai ((a) annual wind frequency; (b) annual wind speed; (c) summer wind frequency; (d) summer wind speed).
Land 14 01378 g002
Figure 3. Research technical route.
Land 14 01378 g003
Figure 4. Schematic calculation of urban form indicators((a) schematic calculation of SVF; (b) schematic calculation of FAI).
Land 14 01378 g004
Figure 5. Conceptual framework for heat health risk assessment.
Land 14 01378 g005
Figure 6. Classification of temperature zones in Minnesota ((a) 2019; (b) 2020; (c) 2021; (d) 2022; (e) mean; (f) percentage of temperature zones of different classes).
Land 14 01378 g006
Figure 7. The setup of air inlets and outlets ((a) primary air inlets and outlets; (b) secondary air inlets and outlets).
Land 14 01378 g007
Figure 8. Building form parameters. ((a) building height; (b) building density; (c) frontal area index; (d) roughness length; (e) sky-view factor; (f) ventilation resistance coefficient).
Land 14 01378 g008
Figure 9. Results of ventilation corridors in Minhang District ((a) primary ventilation corridors; (b) secondary ventilation corridors).
Land 14 01378 g009
Figure 10. Spatial identification of heat risk for vulnerable groups ((a) hazard; (b) accessibility; (c) vulnerability; (d) percentage of three indicators; (e) vulnerable group heat risk space).
Land 14 01378 g010
Figure 11. Results of spatial identification based on supply–demand classification. ((a) spatial distribution of current density; (b) supply–demand classification).
Land 14 01378 g011
Figure 12. General pattern of urban ventilation corridors in Minhang District.
Land 14 01378 g012
Table 1. Data sources and descriptions.
DataResolutionTimeData SourceIndicator
LANDSAT/LC08/C02/T1_LR30 m1 June–31 August for four consecutive years, 2019–2022https://earthengine.google.com/ (accessed on 26 March 2024)Land surface temperature, LST
Meteorological data/2012–2022 http://sh.cma.gov.cn/ (accessed on 5 April 2024)Dominant summer winds in Shanghai
Building data/2020https://www.openstreetmap.org/ (accessed on 17 March 2024)Building footprints, including information on location and number of floors
Neighborhood demographic data/2023Mobile operators (accessed on 28 June 2024)Age (≤5 and ≥65)
Table 2. The standard for dividing temperature levels using mean-standard deviation.
LST GradeGrading Criteria
Low temperatureTi < Tmean − 1 std
Sub-low temperatureTmean − 1 std ≤ Ti < Tmean − 0.5 std
Medium temperatureTmean − 0.5 std ≤ Ti < Tmean+0.5 std
Sub-high temperatureTmean + 0.5 std ≤ Ti < Tmean + 1 std
High TemperatureTmean + 1 std ≤ Ti
Ti denotes the image element LST value, Tmean denotes the mean surface temperature value in the study area, and std denotes the standard deviation.
Table 3. Classification and meaning of surface ventilation resistance levels.
LevelVRCImportance
1VRC > 1.5High
21.5 ≥ VRC ≥ 1.0Relatively High
31.0 > VRC ≥ 0.5General
40.5 > VRC ≥ 0.1Relatively Poor
5VRC < 0.1None or Poor
Table 4. The demand from vulnerable groups for mitigating heat risk ranges.
ValueSignificance
10Low demand (LD)
20Slightly low demand (SLD)
30Medium demand (MD)
40Slightly high demand (SHD)
50High demand (HD)
Table 5. The ventilation supply capacity.
ValueSignificance
1Low supply (LS)
2Slightly low supply (SLS)
3Medium supply (MS)
4Slightly high supply (SHS)
5High supply (HS)
Table 6. Different control zones and their renewal and redevelopment recommendations.
Control PrioritySupply–Demand CombinationsValueRedevelopment Recommendations
Introduce ventilation corridorsAdjust buildingsEnhance ecological benefitsPromote energy-efficient coolingModerate development
IHD-LS, HD-SLS, HD-MS, SHD-LS, SHD-SLS, SHD-MS, MD-MS,51, 52, 53, 41, 42, 43
IIMD-MS, MD-LS, MD-SLSLD-LS, LD-SLS, LD-MS, SLD-LS, SLD-SLS, SLD-MS31, 32, 33, 21, 22, 23, 11, 12, 13
IIISHD-SHS, SHD-HS14, 15
Disclaimer/Publisher’s Note: The statements, opinions and data contained in all publications are solely those of the individual author(s) and contributor(s) and not of MDPI and/or the editor(s). MDPI and/or the editor(s) disclaim responsibility for any injury to people or property resulting from any ideas, methods, instructions or products referred to in the content.

