1. Introduction
The prevalence of extreme environmental conditions, particularly urban heat and excessive moisture, is increasing in metropolitan areas due to climate change, rapid urbanization, and landscape degradation [
1]. The consequences of these conditions are acutely felt by vulnerable populations, particularly those experiencing homelessness, as they are subjected to these conditions without the benefit of adequate shelter, cooling infrastructure, or protection from precipitation and high humidity. In cities such as Athens, where the urban density, heat-retaining surfaces, and limited green cover intensify thermal stress, the risks to public health and safety are substantially increased [
2,
3].
The main question to be addressed in this study is the lack of geographically specific information and risk assessment concerning areas of extreme heat and moisture, which pose a heightened risk to vulnerable populations. Despite the availability of environmental and remote sensing data, municipalities often lack the tools and methodologies to translate this information into actionable geospatial insights that can inform urban planning, public health strategies, and social welfare interventions [
4,
5].
This research aims to develop an integrated geospatial analysis approach for mapping and evaluating heat and moisture vulnerability zones. The approach integrates satellite-derived indexes, including LST (Land Surface Temperature), NDVI (Normalized Difference Vegetation Index), NDBI (Normalized Difference Built-Up Index), TWI (Topographic Wetness Index), slope, and curvature. These indexes are combined to generate thematic maps that identify high-risk areas. The maps are designed to support targeted mitigation strategies, emergency response planning, and long-term resilience-building policies, particularly for the most vulnerable populations [
6,
7,
8,
9,
10].
1.1. Homelessness in Greece: Demographics and Vulnerability
In Greece, homelessness persists as a significant social and public health concern, particularly in urban centers such as Athens, Thessaloniki, Piraeus, Herakleion (Crete Island), Ioannina, Trikala, and Nea Ionia (suburb of Athens), where the majority of the country’s homeless population is concentrated. According to a nationwide survey conducted in May 2018 under the auspices of the Ministry of Labor, Social Security, and Social Solidarity, the total number of homeless individuals was recorded at 1645, with 691 living on the streets and 954 residing in temporary housing structures or supported apartments [
11,
12,
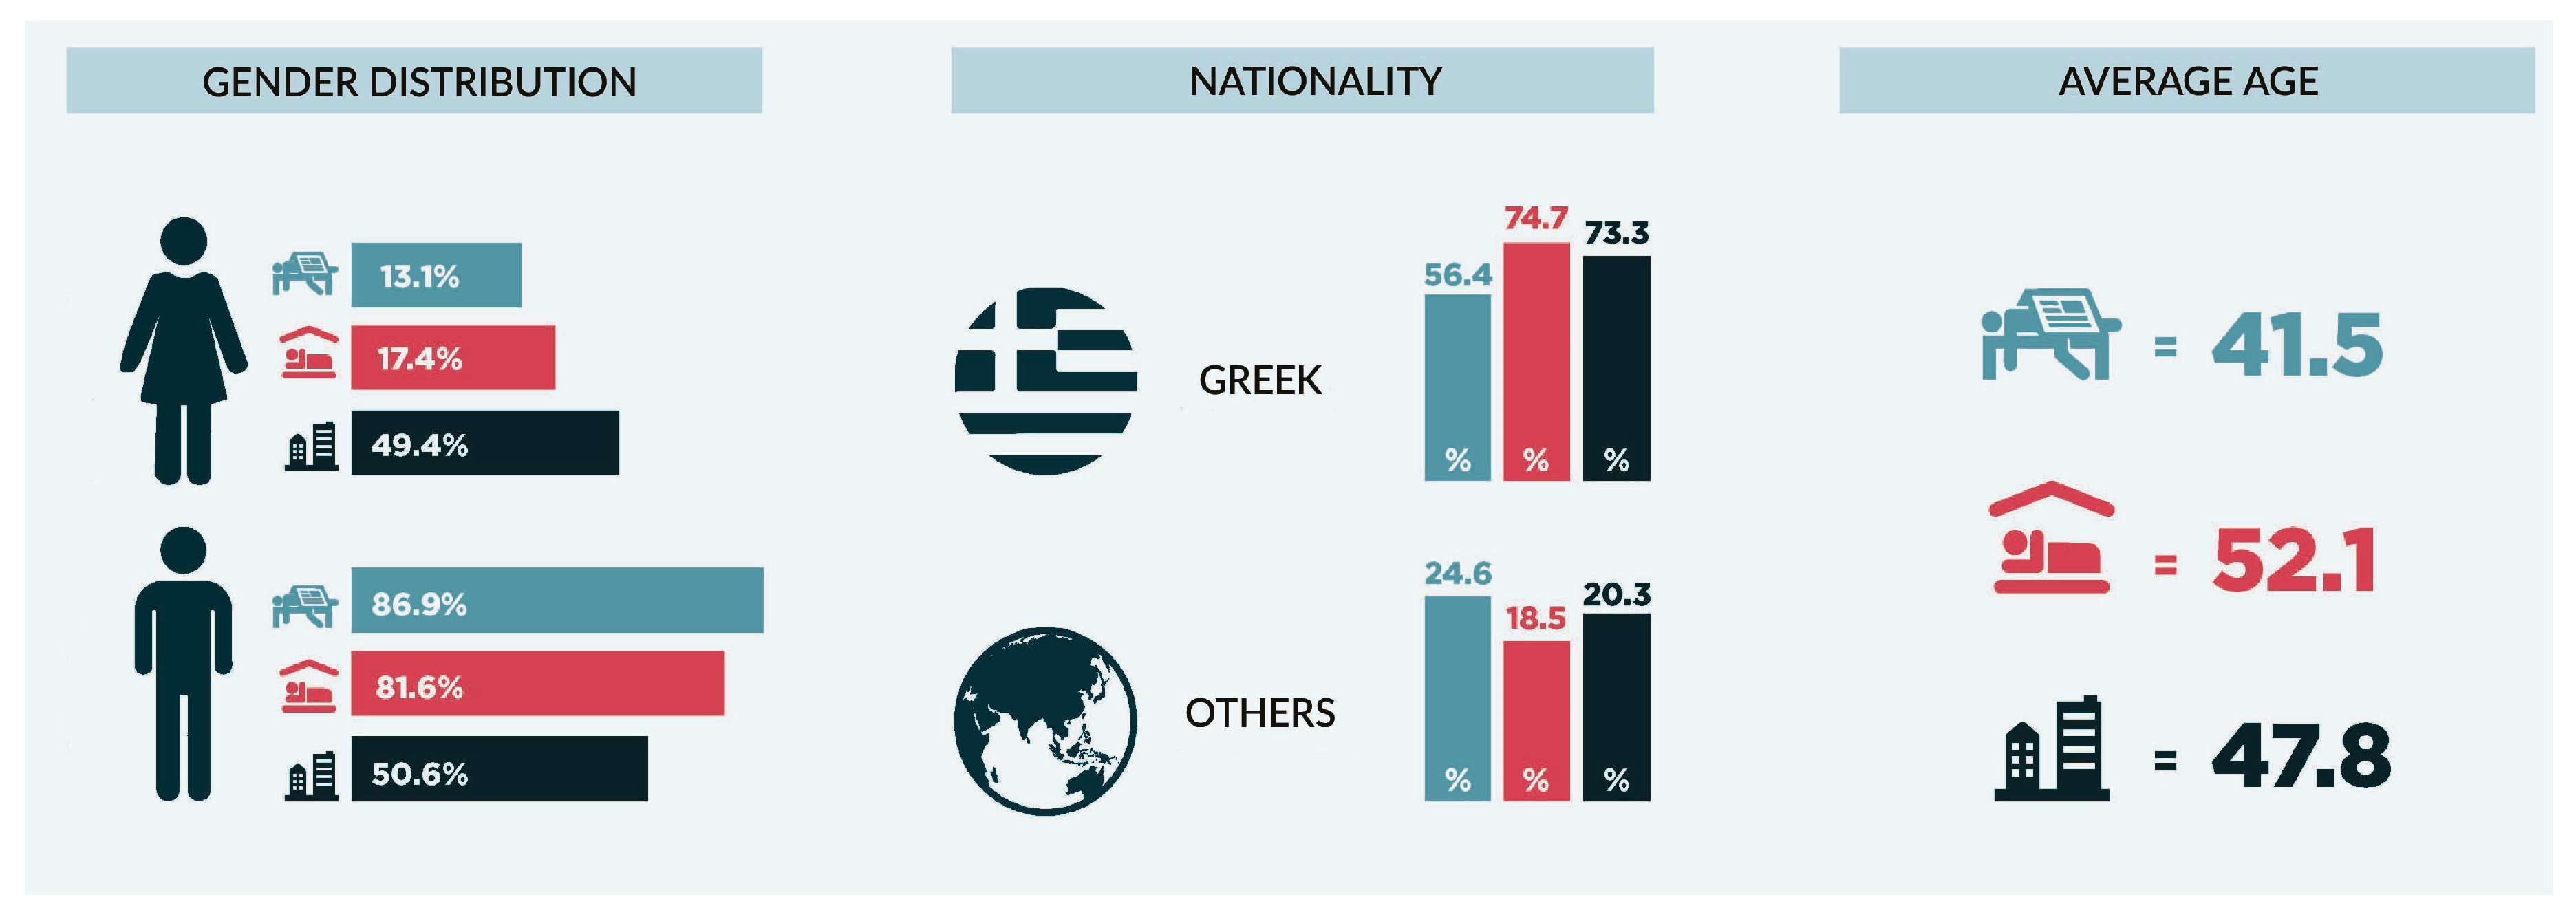
13]. The distribution of homelessness in Greece is presented in
Figure 1.
A closer look at the data reveals significant disparities based on gender and nationality. The male population constitutes an overwhelming majority, comprising 86.9% of individuals experiencing homelessness on the streets and 81.6% of those residing in temporary housing structures. In contrast, female individuals comprise 13.1% of street-dwellers and 17.4% of those in shelters. A notable exception to this pattern is observed in supported apartments, where the gender balance is almost equal, with 49.4% of residents identifying as female and 50.6% as male. In terms of nationality, the data show that Greek nationals constitute 56.4% of the street homeless population and approximately 74% of those in both housing structures and supported living programs. In contrast, foreign nationals comprise 24.6% of the street homeless population, exhibiting a reduced presence in formal housing programs [
11,
12,
13].
Furthermore, age is found to be a crucial factor in the vulnerability of this population. The average age of individuals experiencing homelessness is 41.5 years, increasing to 52.1 years in sheltered accommodations and 47.8 years in supported apartments. The duration of homelessness is also of concern, with 58% of individuals having experienced homelessness for 1–12 months, 20% for 1–3 years, and an additional 20% for over four years. This pattern of chronic homelessness hinders efforts at reintegration [
11,
12,
13].
Figure 2 presents the gender, nationality, and average age distribution.
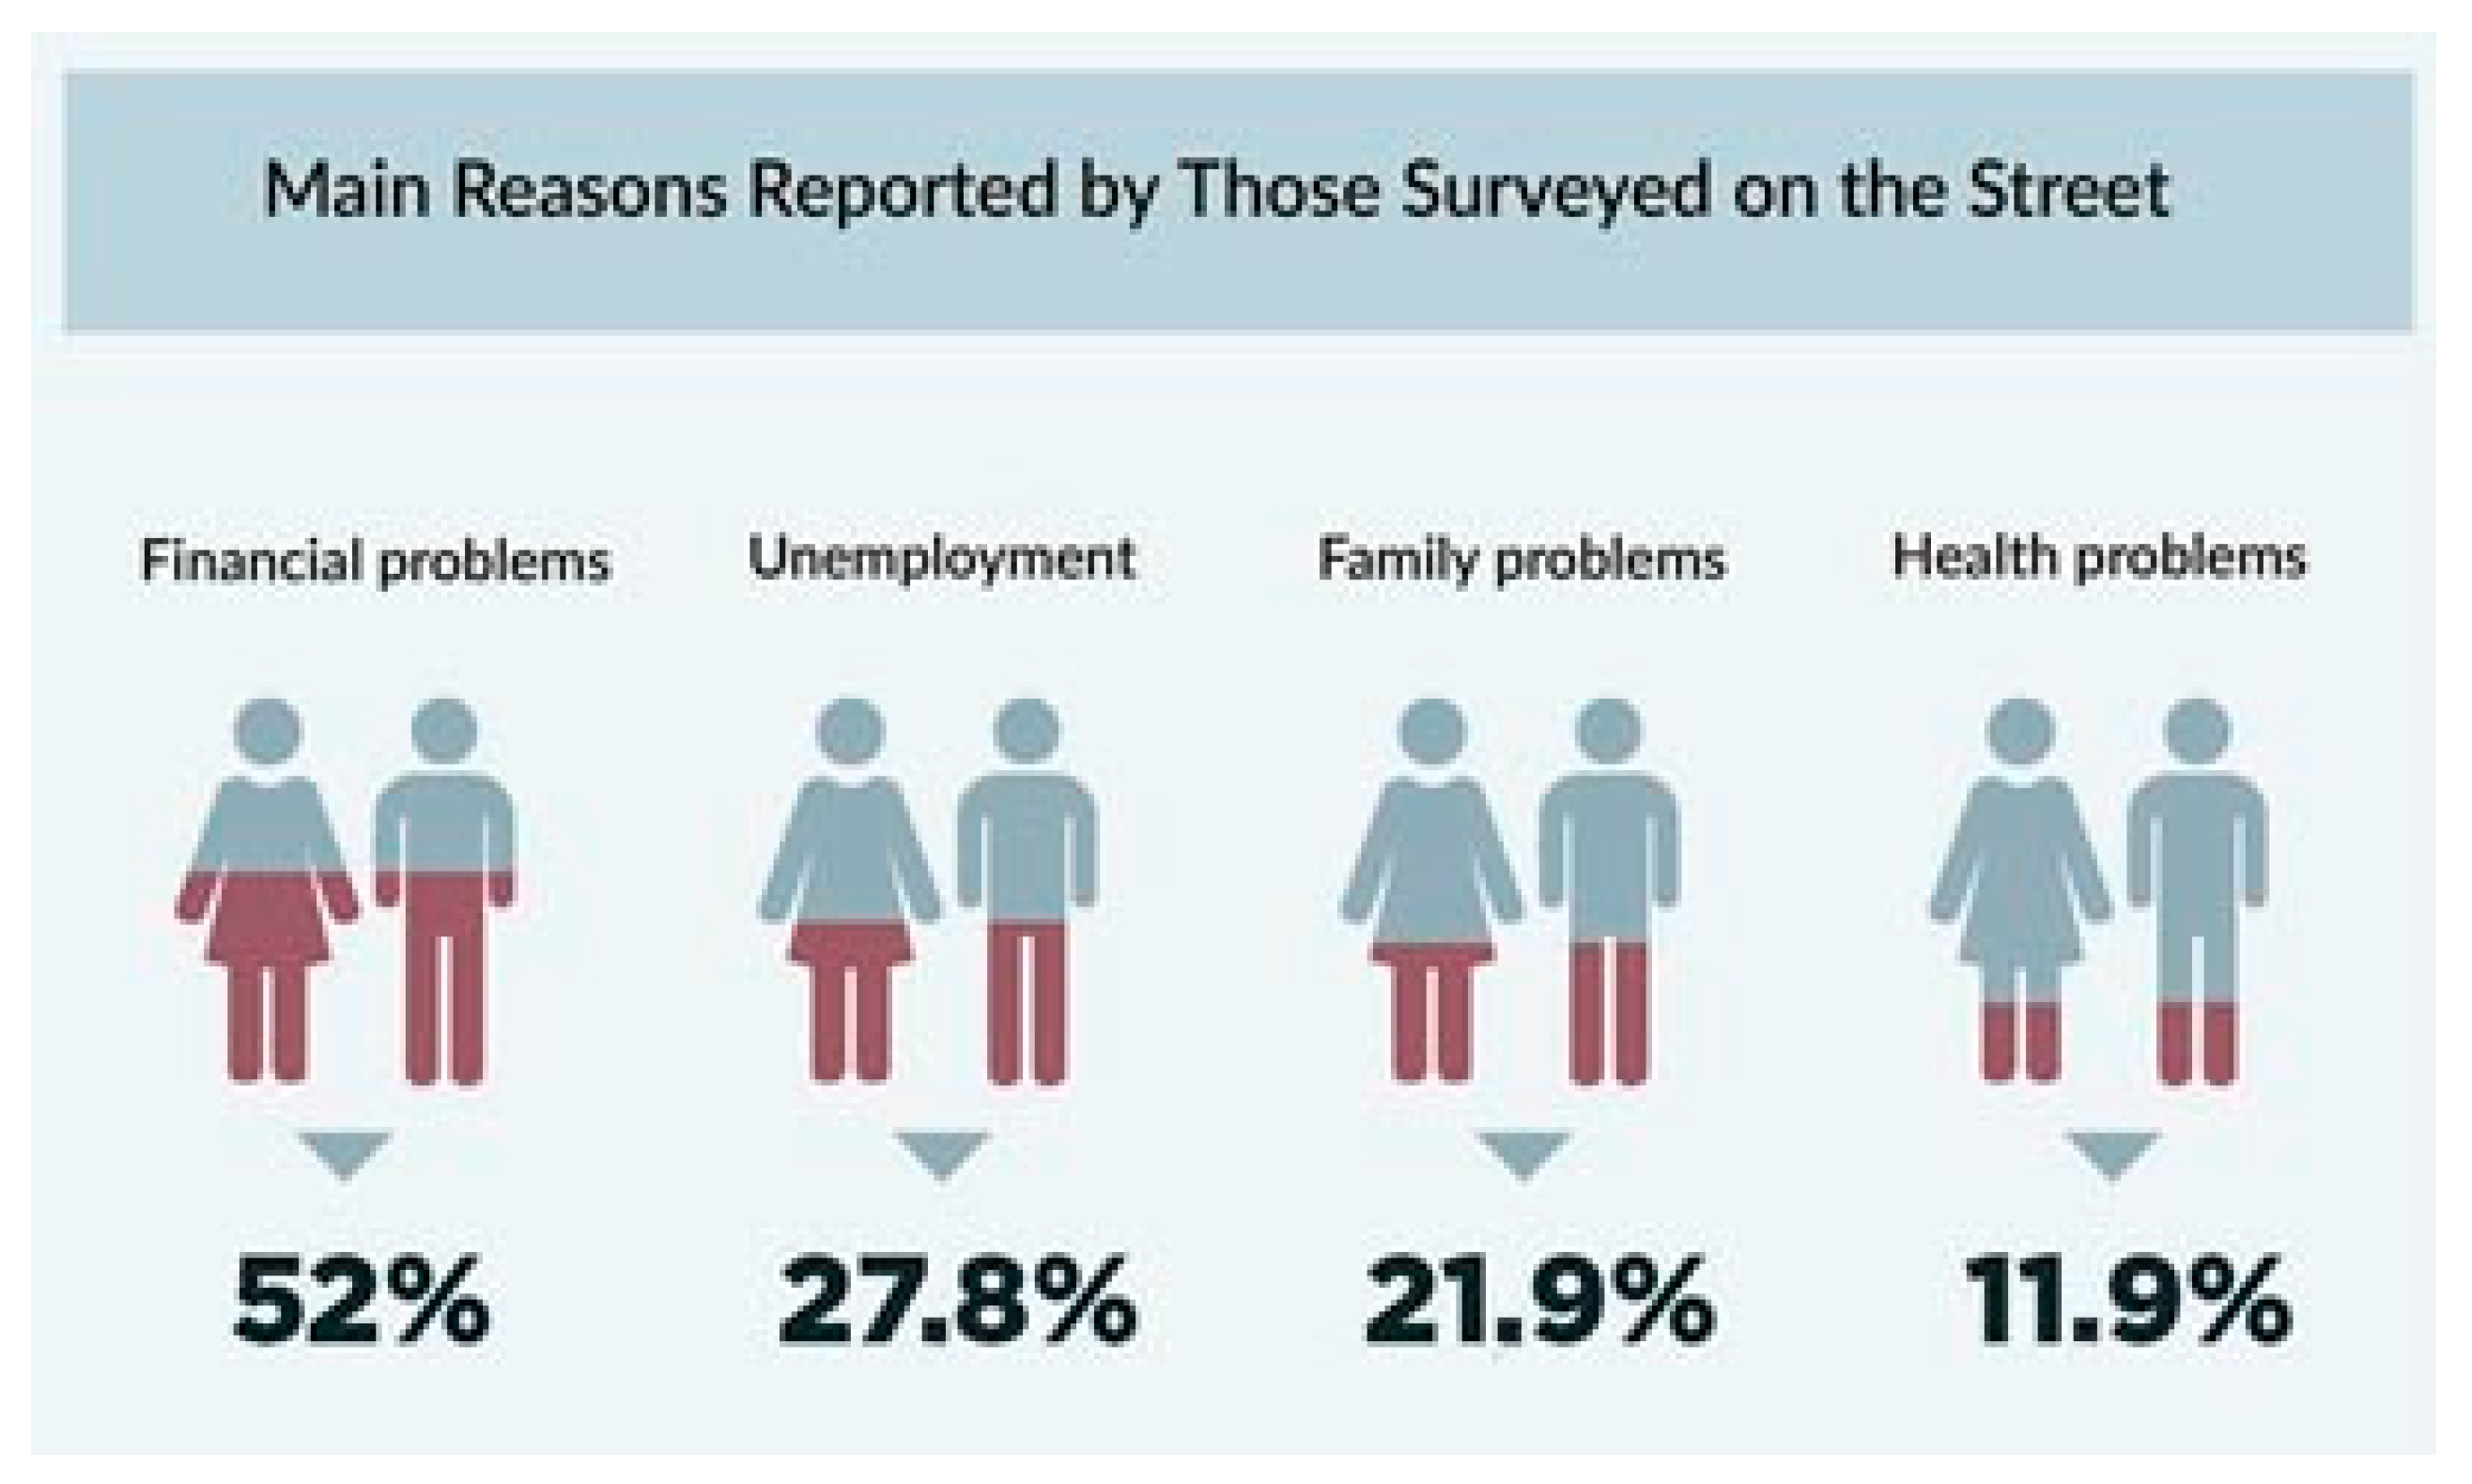
Figure 3 presents the main reasons for homelessness.
The main reasons reported by those surveyed on the street were 52% financial problems, 27.8% unemployment, 21.9% family problems, and 11.9% health problems [
11,
12,
13].
These findings highlight the complex vulnerabilities faced by the homeless population in Greece, particularly in relation to exposure to extreme heat and moisture. A significant portion of this population lacks consistent shelter and access to infrastructure that could mitigate the effects of climatic extremes.
Comparative data from other European cities provide further context for Rome [
14], Madrid [
15], Budapest [
16], and Lisbon [
17]. As illustrated in
Table 1, a comparative analysis of homelessness data from major European cities with socio-cultural and climatic similarities to Athens is presented. For Lisbon, data were obtained from the national survey, which reported over 13,000 individuals experiencing homelessness in Portugal in 2023, bringing the national total to approximately 140,600. This significant increase reflects the country’s ongoing challenges in addressing homelessness, particularly within its continental urban regions.
For Madrid, data were retrieved from the Organisation for Economic Co-operation and Development (OECD), which provides national statistics and trends regarding homelessness in Spain (OECD Homelessness Country Notes—Spain). Finally, in Budapest, the Shelter Foundation (Menhely Alapítvány) has estimated that between 1000 and 1500 individuals sleep rough each night, highlighting the persistent issue of unsheltered homelessness in the Hungarian capital.
1.2. Athens Metropolitan Area: Geography and Climate Characteristics
1.2.1. Geography
The Athens metropolitan area, also known as Lekanopedio, is located in Attica and includes the city of Athens and its surrounding urban and suburban regions. Attica is centered on the Attica peninsula, which extends to the western part of the Aegean Sea. It has an area of 3808 km
2 and covers 2.9% of the total area of Greece [
18,
19].
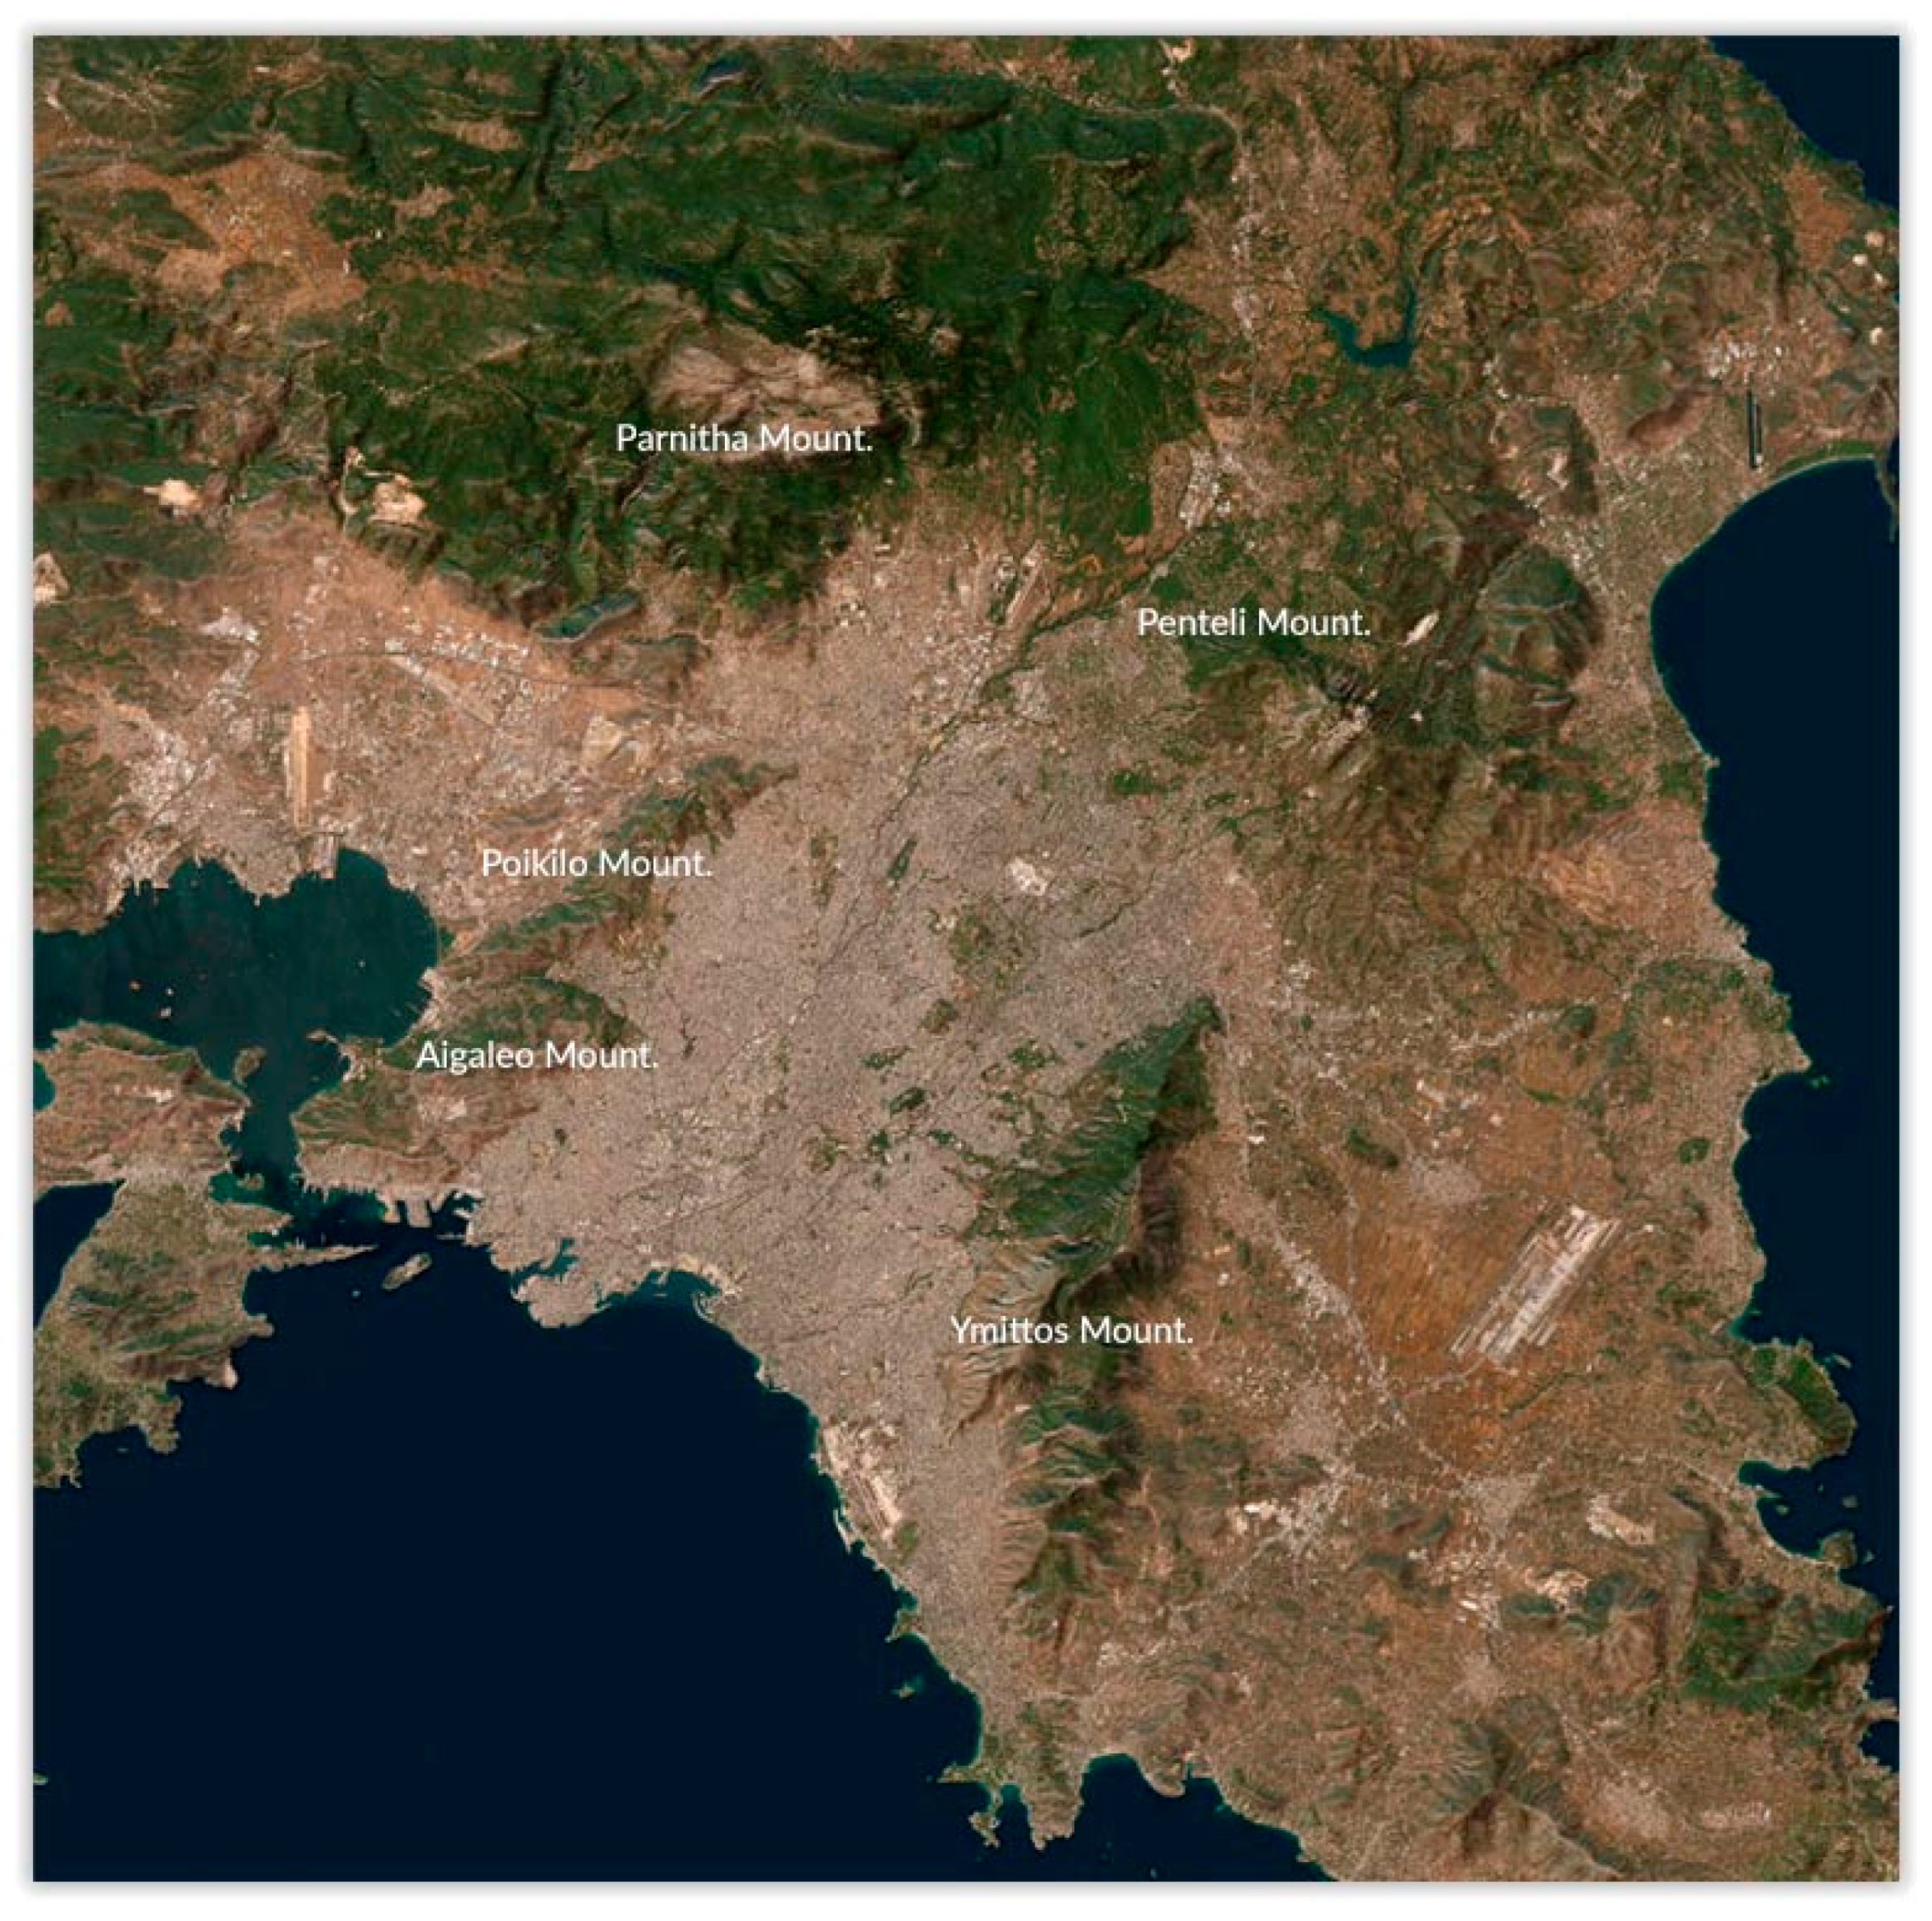
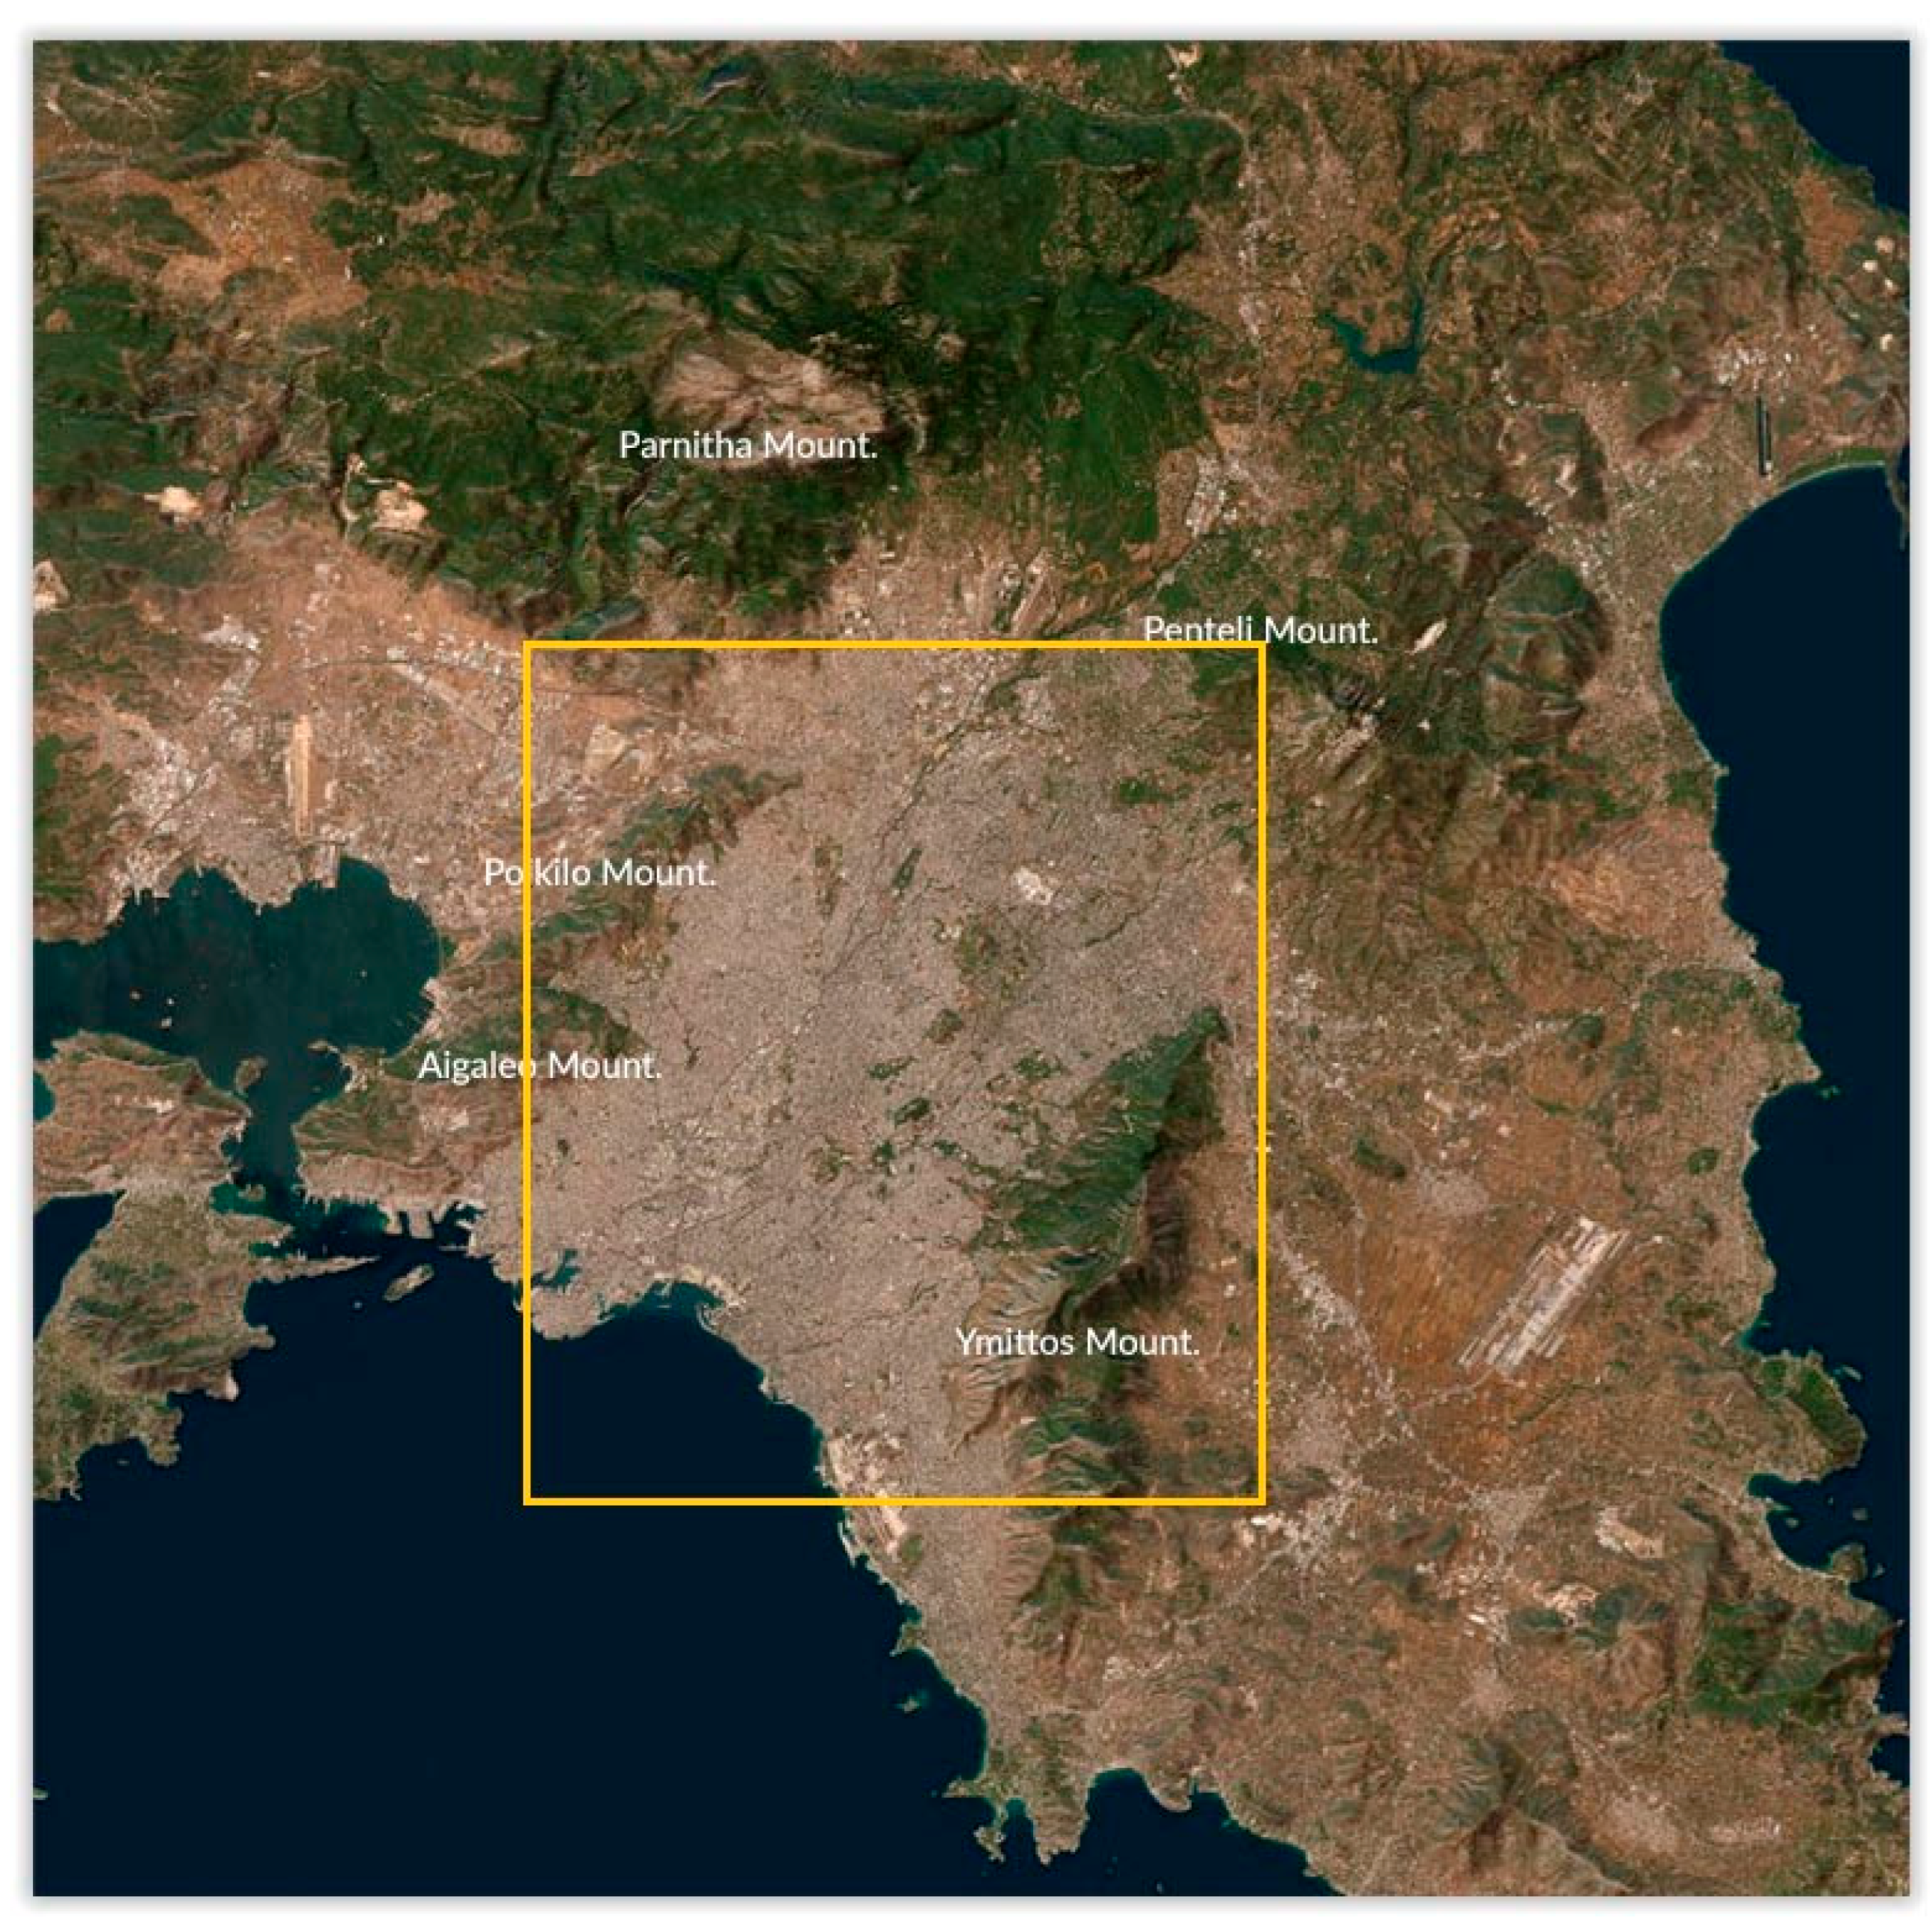
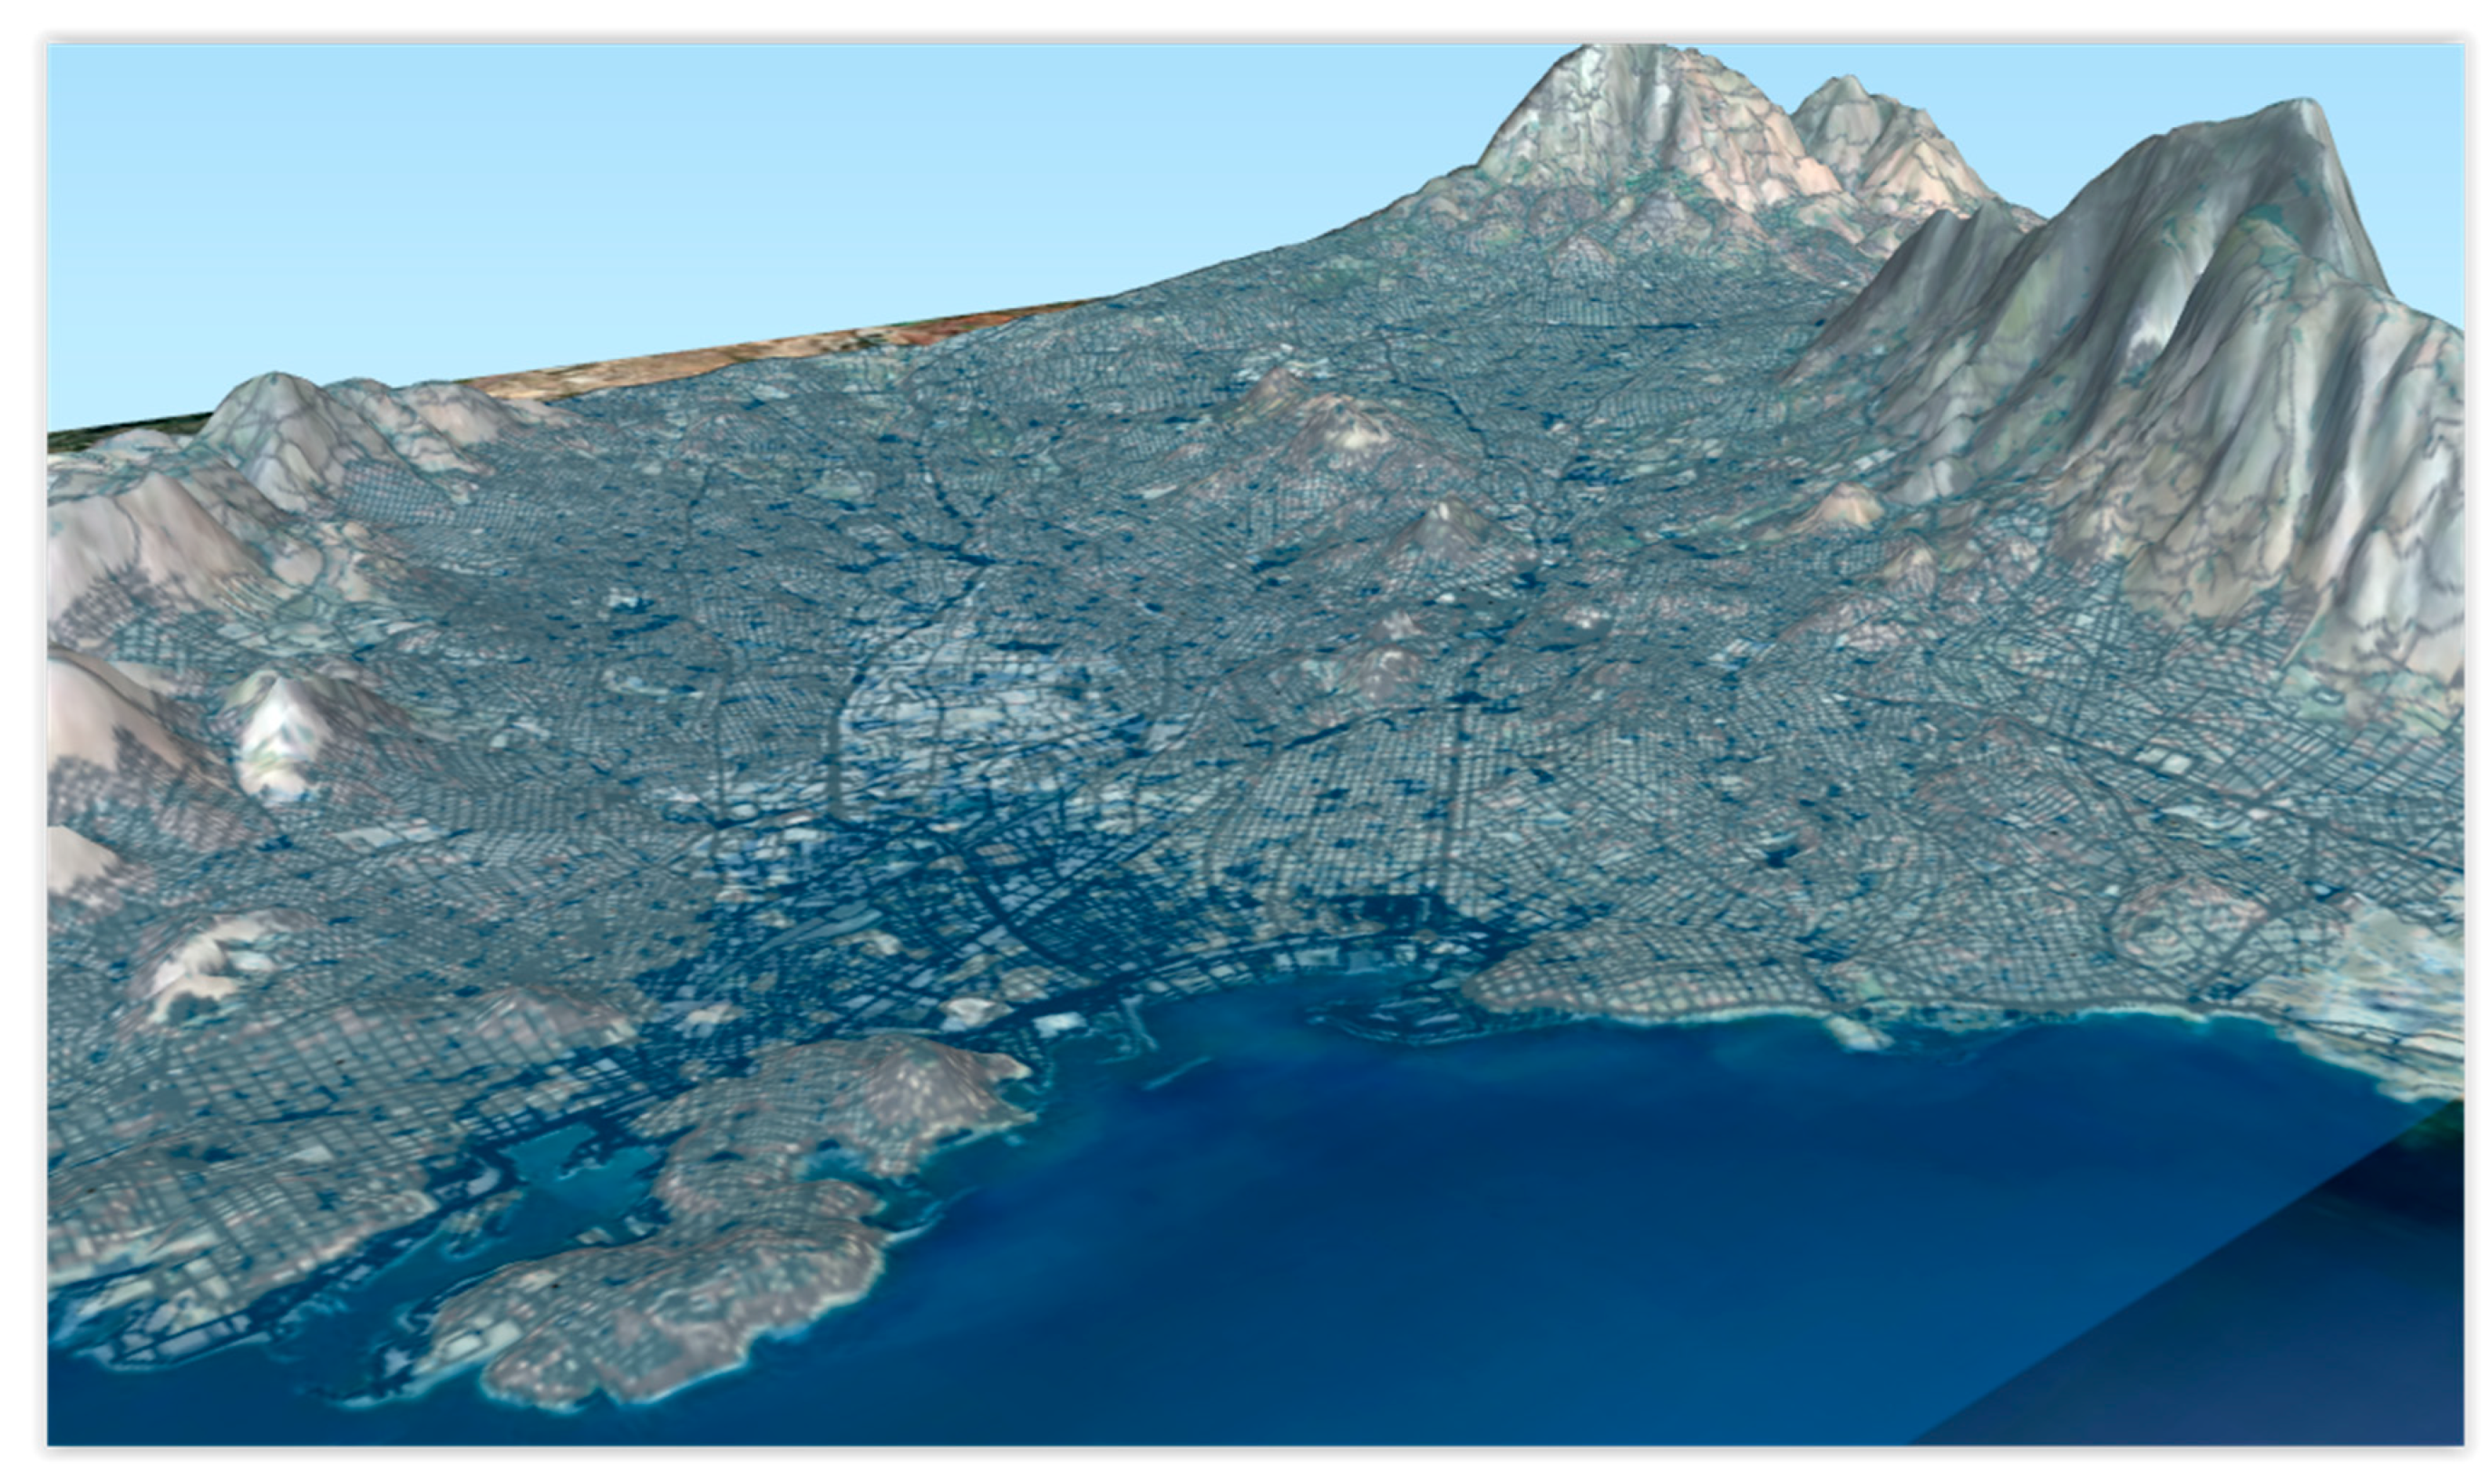
The city of Athens is the center of the Metropolitan Area and is located in the Municipality of Athens, which is the largest municipality in Greece in terms of population. This expansive region is delineated by a succession of mountain ranges, including Aigaleo Mount, Poikilo Mount, Parnitha Mount, Penteli Mount, and Ymittos Mount, which collectively establish a natural border around the city (
Figure 4). While these mountains offer scenic views and abundant biodiversity, they also pose certain climatic and environmental constraints [
20,
21].
The Attica basin, within which the metropolitan area is situated, is a low-lying plain formed between these mountainous ranges. The geographical characteristics of the region are marked by the presence of a compact, urbanized core, namely Athens, surrounded by expanding suburban developments. This urbanization pattern gives rise to a highly urbanized region, characterized by densely built areas interspersed with pockets of green spaces, parks, and small forested zones, most notably around the Kaisariani Forest at the foot of Mount Ymittos [
20,
21,
22].
The region is characterized by a diverse topography, encompassing both coastal and inland areas. The Saronic Gulf to the south exerts a notable maritime influence. However, due to its topography, Athens is somewhat prone to air stagnation, which exacerbates the effects of pollution and increases the intensity of the urban heat island (UHI) effect [
23].
The surrounding mountains can act as a trap for pollutants and heat, exacerbating air quality issues within the city.
1.2.2. Climatic Characteristics
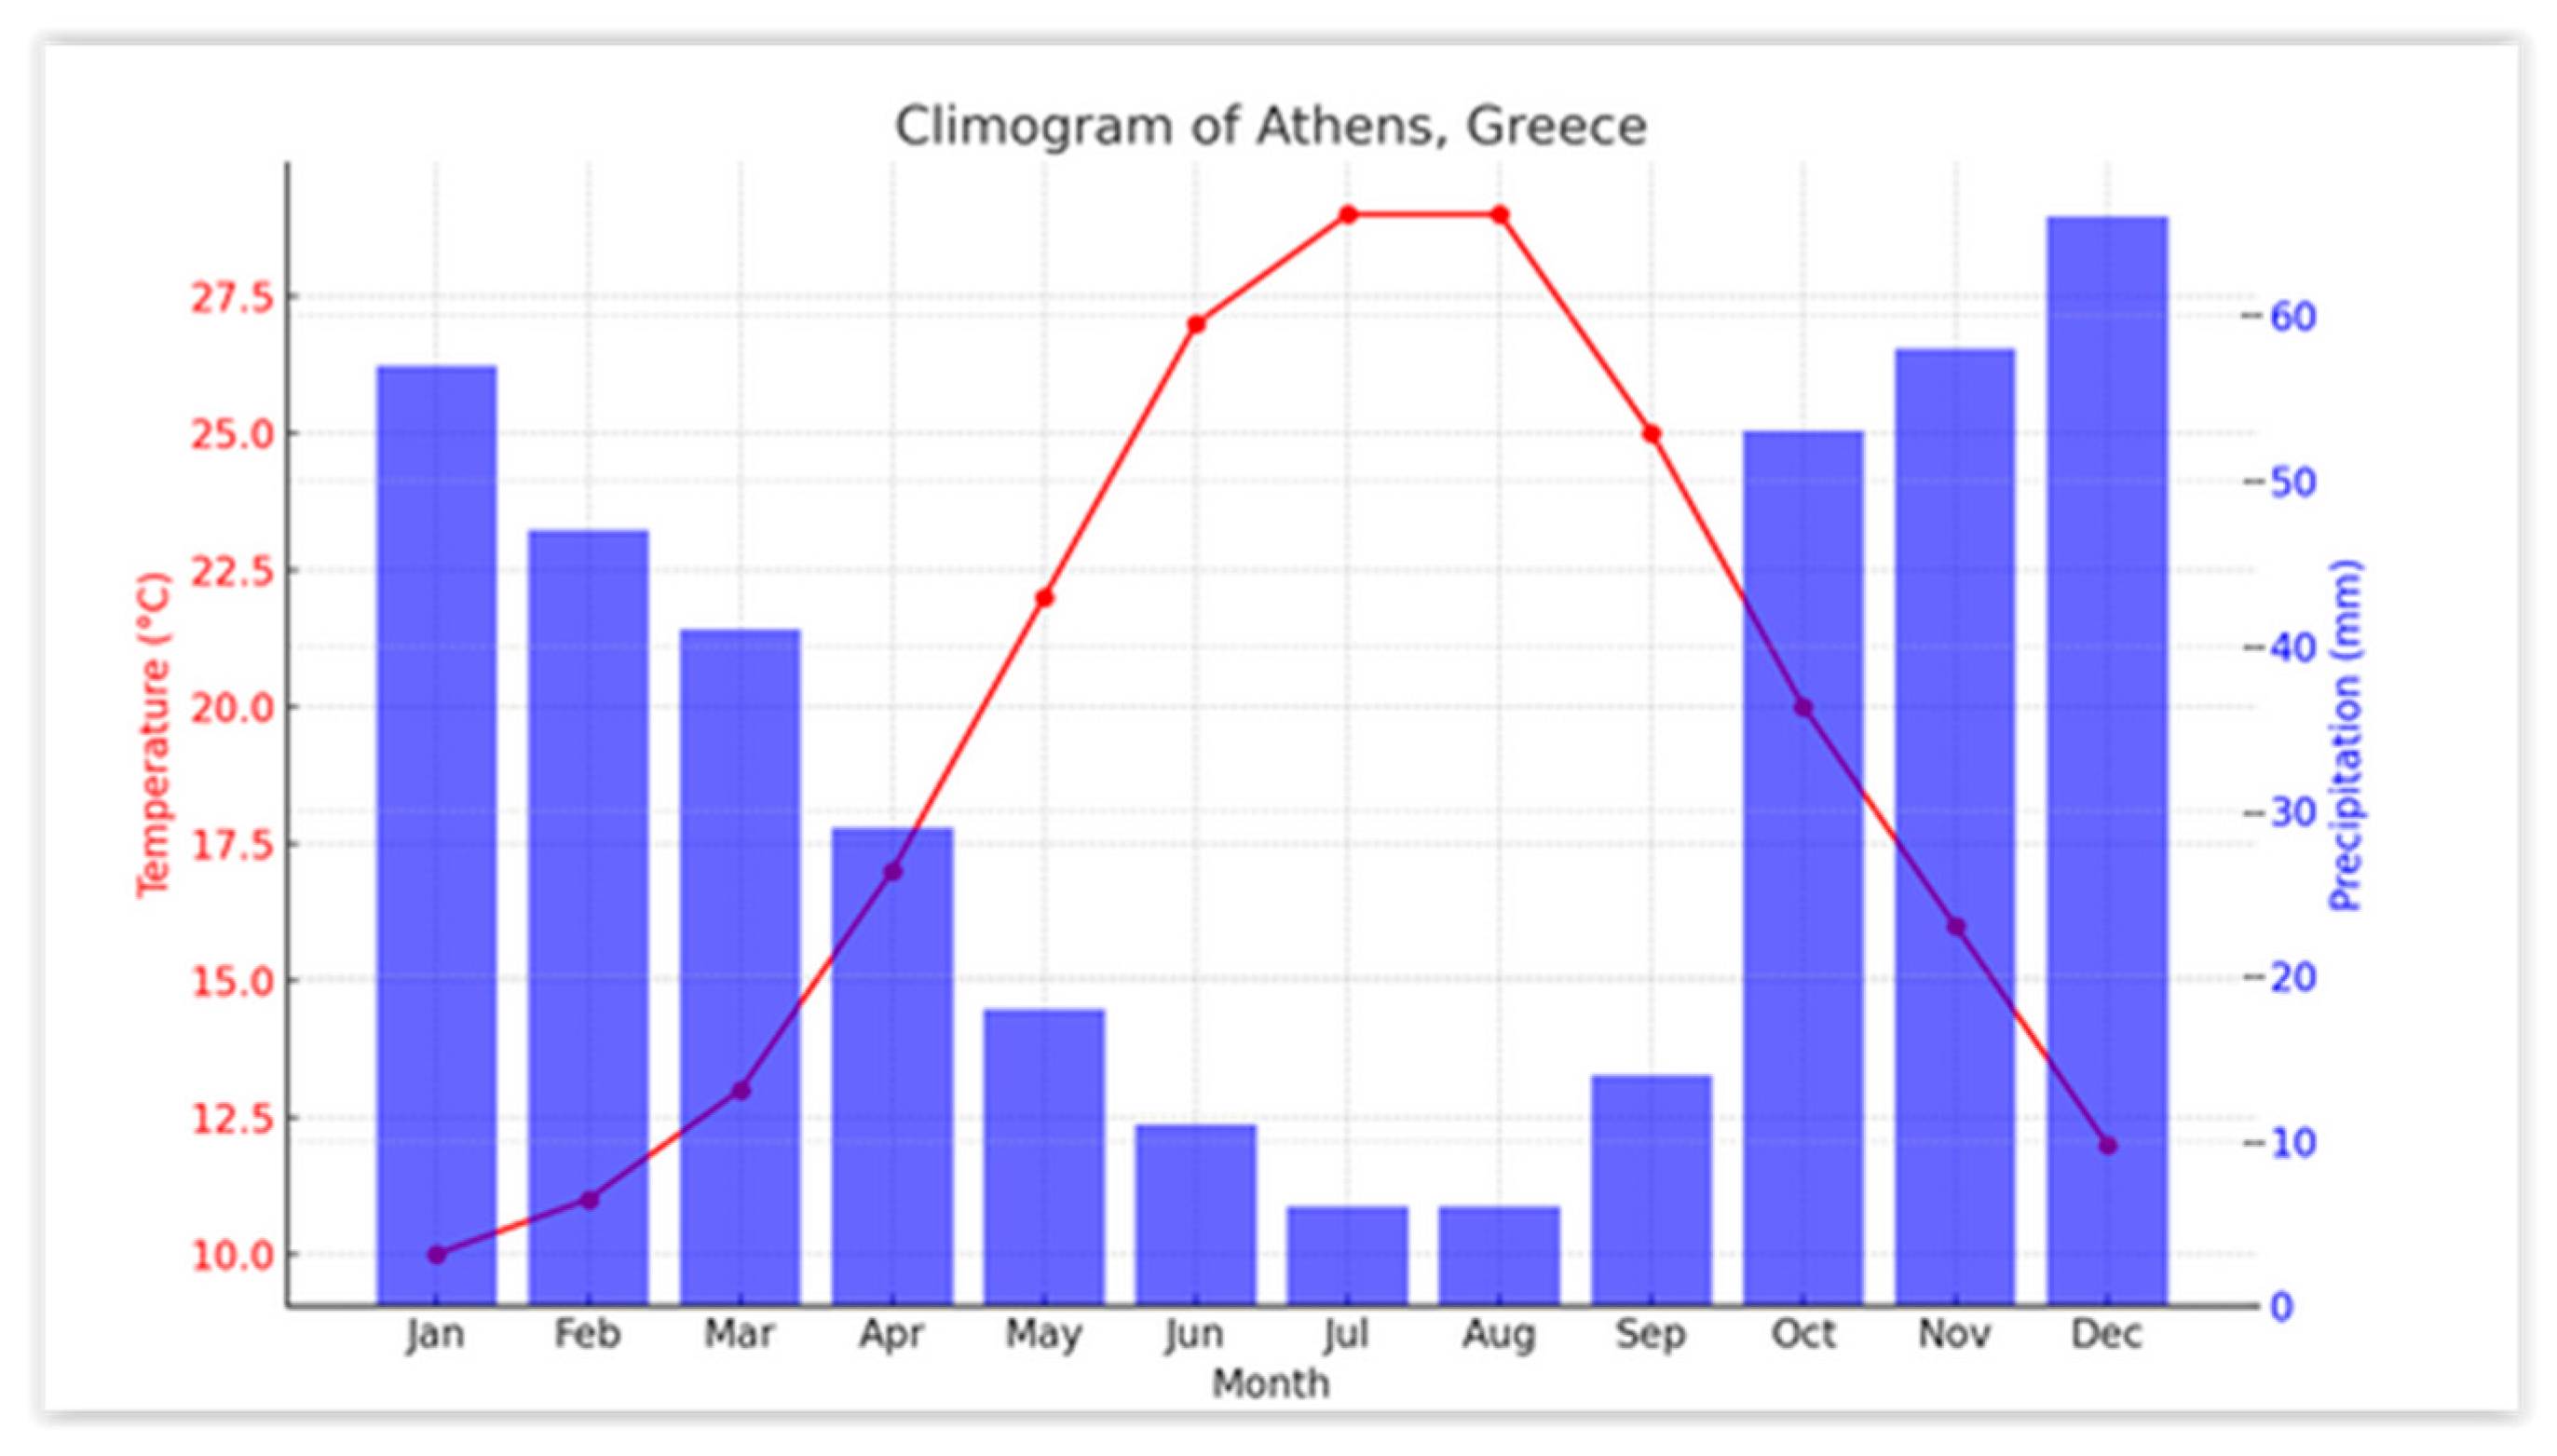
The climate of the Athens metropolitan area is classified as Mediterranean, with hot, dry summers and mild, wet winters. The region is marked by substantial seasonal temperature variability, with summer temperatures frequently surpassing 35 °C during heatwaves and winter temperatures seldom dipping below 10 °C [
23]. The temperature peaks in July and August. Precipitation is highest in the winter months (November to January) and lowest in summer, especially July and August. A climogram of Athens follows based on long-term climate averages from the Hellenic National Meteorological Service [
24].
The highest humidity levels are recorded during the winter months, ranging from 75% to 80%, while the lowest levels are observed in the summer, ranging from 40% to 50%. The city of Athens experiences an annual mean of over 2800 h of sunshine. During summer months, north winds predominate, trying to offer respite from the prevailing heat. Snowfall is an infrequent occurrence in general, but it is a possibility in January or February, with increased frequency in northern or elevated suburban regions (
Figure 5).
Notably, the urban heat island (UHI) effect is a salient feature of Athens’ climate, exacerbating the impacts of summer heat. The combination of rapid urbanization and the extensive use of impervious surfaces, such as concrete and asphalt, along with limited green space, contributes to the absorption and retention of heat within the city. Consequently, the city center and densely populated urban areas experience significantly higher temperatures compared to the surrounding mountainous zones [
25].
In terms of moisture, the city experiences moderate rainfall, typically from late fall to early spring. However, due to urbanization and geographical constraints, areas of the Athens metropolitan area, especially those with inadequate drainage infrastructure, are susceptible to flooding during heavy rains. The exacerbation of such extreme weather events is further compounded by climate change, which has led to increasingly erratic rainfall patterns and more intense storm activity [
26].
Furthermore, the five mountains exert an influence on the microclimates within the metropolitan area. Specifically, the Kaisariani Forest, located in Ymittos, exhibits a cooler temperature and more moderate conditions due to its substantial forest cover, which serves to mitigate the extreme heat experienced in more urbanized regions [
27]. Conversely, the surrounding mountains, have been profoundly impacted by wildfires in recent years. This has led to alterations in the natural microclimates and a reduction in the cooling effect of these green spaces. The recurrent fires that have led to the loss of these natural cooling areas have further intensified the challenges posed by climate change, particularly with regard to temperature extremes [
28]. Massive fires have swept through Parnitha, Penteli, Aigaleo, and large sections of Ymittos, diminishing the natural buffers that once regulated temperature and humidity variations across the metropolitan area. These forests played a critical role in maintaining local microclimates by providing shade, reducing surface temperatures, and retaining moisture. Their loss has led to a homogenization of extreme conditions across neighborhoods, where heat accumulates unchecked and rainfall rapidly converts into runoff rather than being absorbed by vegetation. One exception to this trend is the western to north slopes of Ymittos, which has largely remained intact [
28,
29,
30].
Athens, a vast urban environment surrounded by five mountains’ faces, is now experiencing increasing challenges due to extreme heat and moisture conditions. The rapid expansion of impervious surfaces—concrete, asphalt, and densely packed buildings—has significantly altered the region’s microclimate, exacerbating the urban heat island (UHI) effect. Coupled with shifting climatic patterns, these changes lead to prolonged heatwaves, reduced nighttime cooling, and severe moisture imbalances, ranging from drought conditions to intense, localized rainfall events.
In conclusion, Lekanopedio is a geographically diverse area with varied climatic challenges. The confluence of urbanization, surrounding mountains, and climate change has rendered the area increasingly vulnerable to extreme heat and moisture conditions, with specific implications for urban resilience, particularly among vulnerable populations such as the homeless. The combination of these climatic factors, in conjunction with the region’s complex topography, highlights the necessity for targeted interventions aimed at mitigating heat and moisture extremes.
1.3. The Importance of Heat and Moisture Maps for Homeless Populations
Extreme heat and moisture conditions pose significant threats to individuals experiencing homelessness, who often lack the means to escape harsh environmental conditions.
Heat and moisture maps constitute a set of geospatial data that, when utilized effectively, can play a critical role in protecting and supporting homeless populations, especially in urban environments where extreme weather and changing climate conditions pose serious health risks.
Individuals experiencing homelessness are particularly vulnerable to the adverse effects of heat and humidity. Exposure to elevated temperatures has been demonstrated to result in a range of health complications, including but not limited to heat exhaustion, heatstroke, dehydration, and potentially fatal outcomes. Prolonged exposure to consistently moist environments can lead to a number of adverse effects, including hypothermia, respiratory distress, and the proliferation of noxious mold in encampments or improvised shelters. The real-time mapping of these risk zones enables proactive responses [
31,
32].
Municipalities can employ detailed heat and moisture maps to predict which areas are most susceptible to hazardous conditions during extreme weather events. This initiative has the potential to enhance the efficacy of planning processes for emergency cooling centers, water distribution systems, shelter facilities, and mobile medical outreach. The aforementioned factors facilitate the identification of areas conducive to the distribution of supplies to withstand inclement weather conditions.
These maps can inform urban planning by highlighting environmental risk “hot spots” that may disproportionately affect unsheltered populations. Urban designers can then advocate for the installation of additional shaded spaces, public water fountains, improved drainage systems, and designated safe zones that mitigate exposure. In circumstances characterized by extreme heat or substantial precipitation, heat and moisture mapping emerges as a pivotal instrument for civil protection authorities. By providing accurate information about the location of encampments or known gathering spots, they can respond effectively before conditions deteriorate to a point where they pose a threat to life. Automated alerts, derived from these maps, have the potential to expedite responses during weather emergencies [
30,
31].
In Athens, the convergence of rising temperatures, increasing urbanization, and environmental degradation—such as the loss of forested areas due to wildfires—has exacerbated these risks. Individuals experiencing homelessness are among the most vulnerable populations in this context, as they are continuously exposed to outdoor conditions without adequate shelter, cooling, or protection from excessive moisture.
1.4. Heat-Related Risks
The city of Athens has recently been experiencing a marked increase in severe heat events, a phenomenon that has been further exacerbated by the urban heat island (UHI) effect. This effect is characterized by the trapping of heat on densely constructed surfaces, thereby impeding the process of nighttime cooling. Prolonged exposure to elevated temperatures can result in a range of health complications, including heat exhaustion, dehydration, and even heatstroke, particularly among individuals with underlying health conditions. Furthermore, areas characterized by high Land Surface Temperature (LST), limited vegetation (NDVI), and high impervious surface coverage (NDBI) have been identified as hotspots, posing a heightened risk to unhoused individuals. The identification of these extreme heat zones enables the implementation of targeted interventions, such as the establishment of cooling stations, water distribution points, and shaded rest areas [
32,
33,
34,
35].
1.5. Moisture-Related Risks
Conversely, extreme moisture conditions have also been demonstrated to pose significant health risks. In areas susceptible to flooding, inadequate drainage, and elevated humidity levels, there is an increased probability of exposure to hypothermia, waterborne diseases, and respiratory infections, particularly during the colder months. Therefore, the mapping of areas with high Topographic Wetness Index (TWI), low-lying terrain, and inadequate runoff management is imperative for the identification of locations where shelter placement, drainage improvements, and emergency response efforts should be prioritized [
35,
36,
37].
The integration of heat and moisture mapping into urban planning and public health strategies by authorities and NGOs can facilitate proactive protection of vulnerable populations, ensure emergency preparedness, and optimize resource allocation. These spatial analyses serve as a vital tool in mitigating environmental risks and improving the safety, health, and well-being of Athens’ homeless community.
It is imperative to recognize that environmental shifts have a disproportionate impact on vulnerable populations, particularly the homeless, who are exposed to prolonged heat stress and moisture extremes without adequate shelter or resources. The identification and mapping of these high-risk areas is imperative for the implementation of targeted interventions by emergency services, urban planners, and policymakers. Such interventions include the implementation of effective cooling strategies, the efficient allocation of resources, and the enhancement of the resilience of at-risk communities in the face of accelerating climate change [
34,
35].
While several studies have assessed urban heat vulnerability using satellite-derived indices such as LST, NDVI, and NDBI, and others have used terrain variables like slope or TWI to assess flood risks, few have proposed a unified framework that addresses both heat and moisture hazards concurrently [
36,
37,
38]. Furthermore, prior approaches often overlook vulnerable social groups, such as the homeless, and rarely incorporate curvature into topographic modeling.
This study addresses these gaps by proposing a novel geospatial methodology that integrates both surface heat and terrain-driven moisture accumulation using multi-criteria decision analysis (MCDA) through the Analytic Hierarchy Process (AHP). This combined approach, applied to Athens, enhances urban environmental risk assessment in Mediterranean settings where compact urban forms and social inequalities intersect.
2. Methodological Steps for Heat and Moisture Mapping
The satellite data used in this study were derived from Landsat 8 Operational Land Imager (OLI) and Thermal Infrared Sensor (TIRS) imagery, accessed via the USGS Earth Explorer platform. The Normalized Difference Vegetation Index (NDVI) was calculated using Bands 5 (Near Infrared, NIR) and 4 (Red) as in Equation (1):
The Normalized Difference Built-up Index (NDBI) was derived using Bands 6 (Shortwave Infrared 1, SWIR1) and 5 (NIR) as in Equation (2):
The Land Surface Temperature (LST) was calculated from Band 10 of the TIRS sensor using the single-channel algorithm, incorporating radiance calibration constants and emissivity values derived from NDVI-based land cover classification. The imagery, acquired in August, was selected to represent peak summer thermal conditions relevant to heat stress assessments.
The terrain-derived variables—Topographic Wetness Index (TWI), slope, and curvature—were calculated using a 30 m resolution Digital Elevation Model (DEM) obtained from the Advanced Spaceborne Thermal Emission and Reflection Radiometer (ASTER) Global Digital Elevation Model (GDEM). The DEM was pre-processed to remove spurious sinks and anomalies using a hydrologically corrected flow direction model.
Slope was computed as the first derivative of elevation, indicating the steepness of terrain, which influences both water runoff and heat accumulation. Curvature was calculated as the second derivative of the elevation surface and helps identify concave (valley) and convex (ridge) landforms, relevant for moisture convergence.
Topographic Wetness Index (TWI) was derived as in Equation (3):
where a is the upslope contributing area per unit contour length (calculated using flow accumulation tools) and β is the local slope angle in radians. This index reflects the potential for water accumulation and soil moisture saturation, especially relevant for low-lying or concave terrain within urban settings.
All continuous raster datasets (LST, NDVI, NDBI, TWI, slope, and curvature) were reclassified into five vulnerability classes prior to integration into the Analytic Hierarchy Process (AHP). A quantile classification scheme was applied to most indices (e.g., LST, NDVI, NDBI, and TWI), dividing their values into five equal-sized groups representing relative vulnerability levels, from very low (Class 1) to very high (Class 5). This approach ensures comparability across the study area and has been widely used in similar urban heat and moisture studies [
39,
40,
41].
However, for slope and curvature, classification was based on thematic thresholds rather than pure quantiles, to reflect hydrological and thermal behavior more accurately. In particular, flatter slopes—which are more prone to water accumulation and heat entrapment—were assigned higher vulnerability scores (Class 5), while steeper slopes, which promote runoff and ventilation, were classified as lower vulnerability (Class 1). This hybrid classification strategy combines statistical consistency with environmental reasoning, ensuring that both urban morphology and terrain response are appropriately captured in the vulnerability mapping framework.
This method ensured an even distribution of values across the study area and allowed for relative comparison between zones. The use of quantile classification follows precedent in urban heat and moisture mapping studies and is appropriate for datasets with non-normal distributions, such as temperature and vegetation indices [
39].
2.1. Data Collection & Preparation
LST (Land Surface Temperature): Represents temperature variations across the landscape.
NDVI (Normalized Difference Vegetation Index): Reflects vegetation density and health, with higher values indicating more greenery and potential cooling effects.
NDBI (Normalized Difference Built-Up Index): Identifies urban areas, where higher values suggest more built-up surfaces that absorb heat.
TWI (Topographic Wetness Index): Indicates moisture levels, where higher values suggest areas with more accumulated moisture.
Slope: Steep areas may contribute to different heat and moisture conditions due to their reduced ability to retain water and increased exposure to the sun.
Curvature Upslope: Refers to the concavity or convexity of the terrain. Upslope curvature helps identify whether water tends to diverge (on convex slopes) or accumulate (on concave slopes) as it flows downhill. Concave areas often retain more moisture and can be cooler due to shade and water pooling, while convex areas drain quickly and are more exposed to solar radiation.
In
Figure 6, the region of interest is denoted by the colored square, and it is further delineated in the subsequent series of images.
2.2. Layer Reclassification
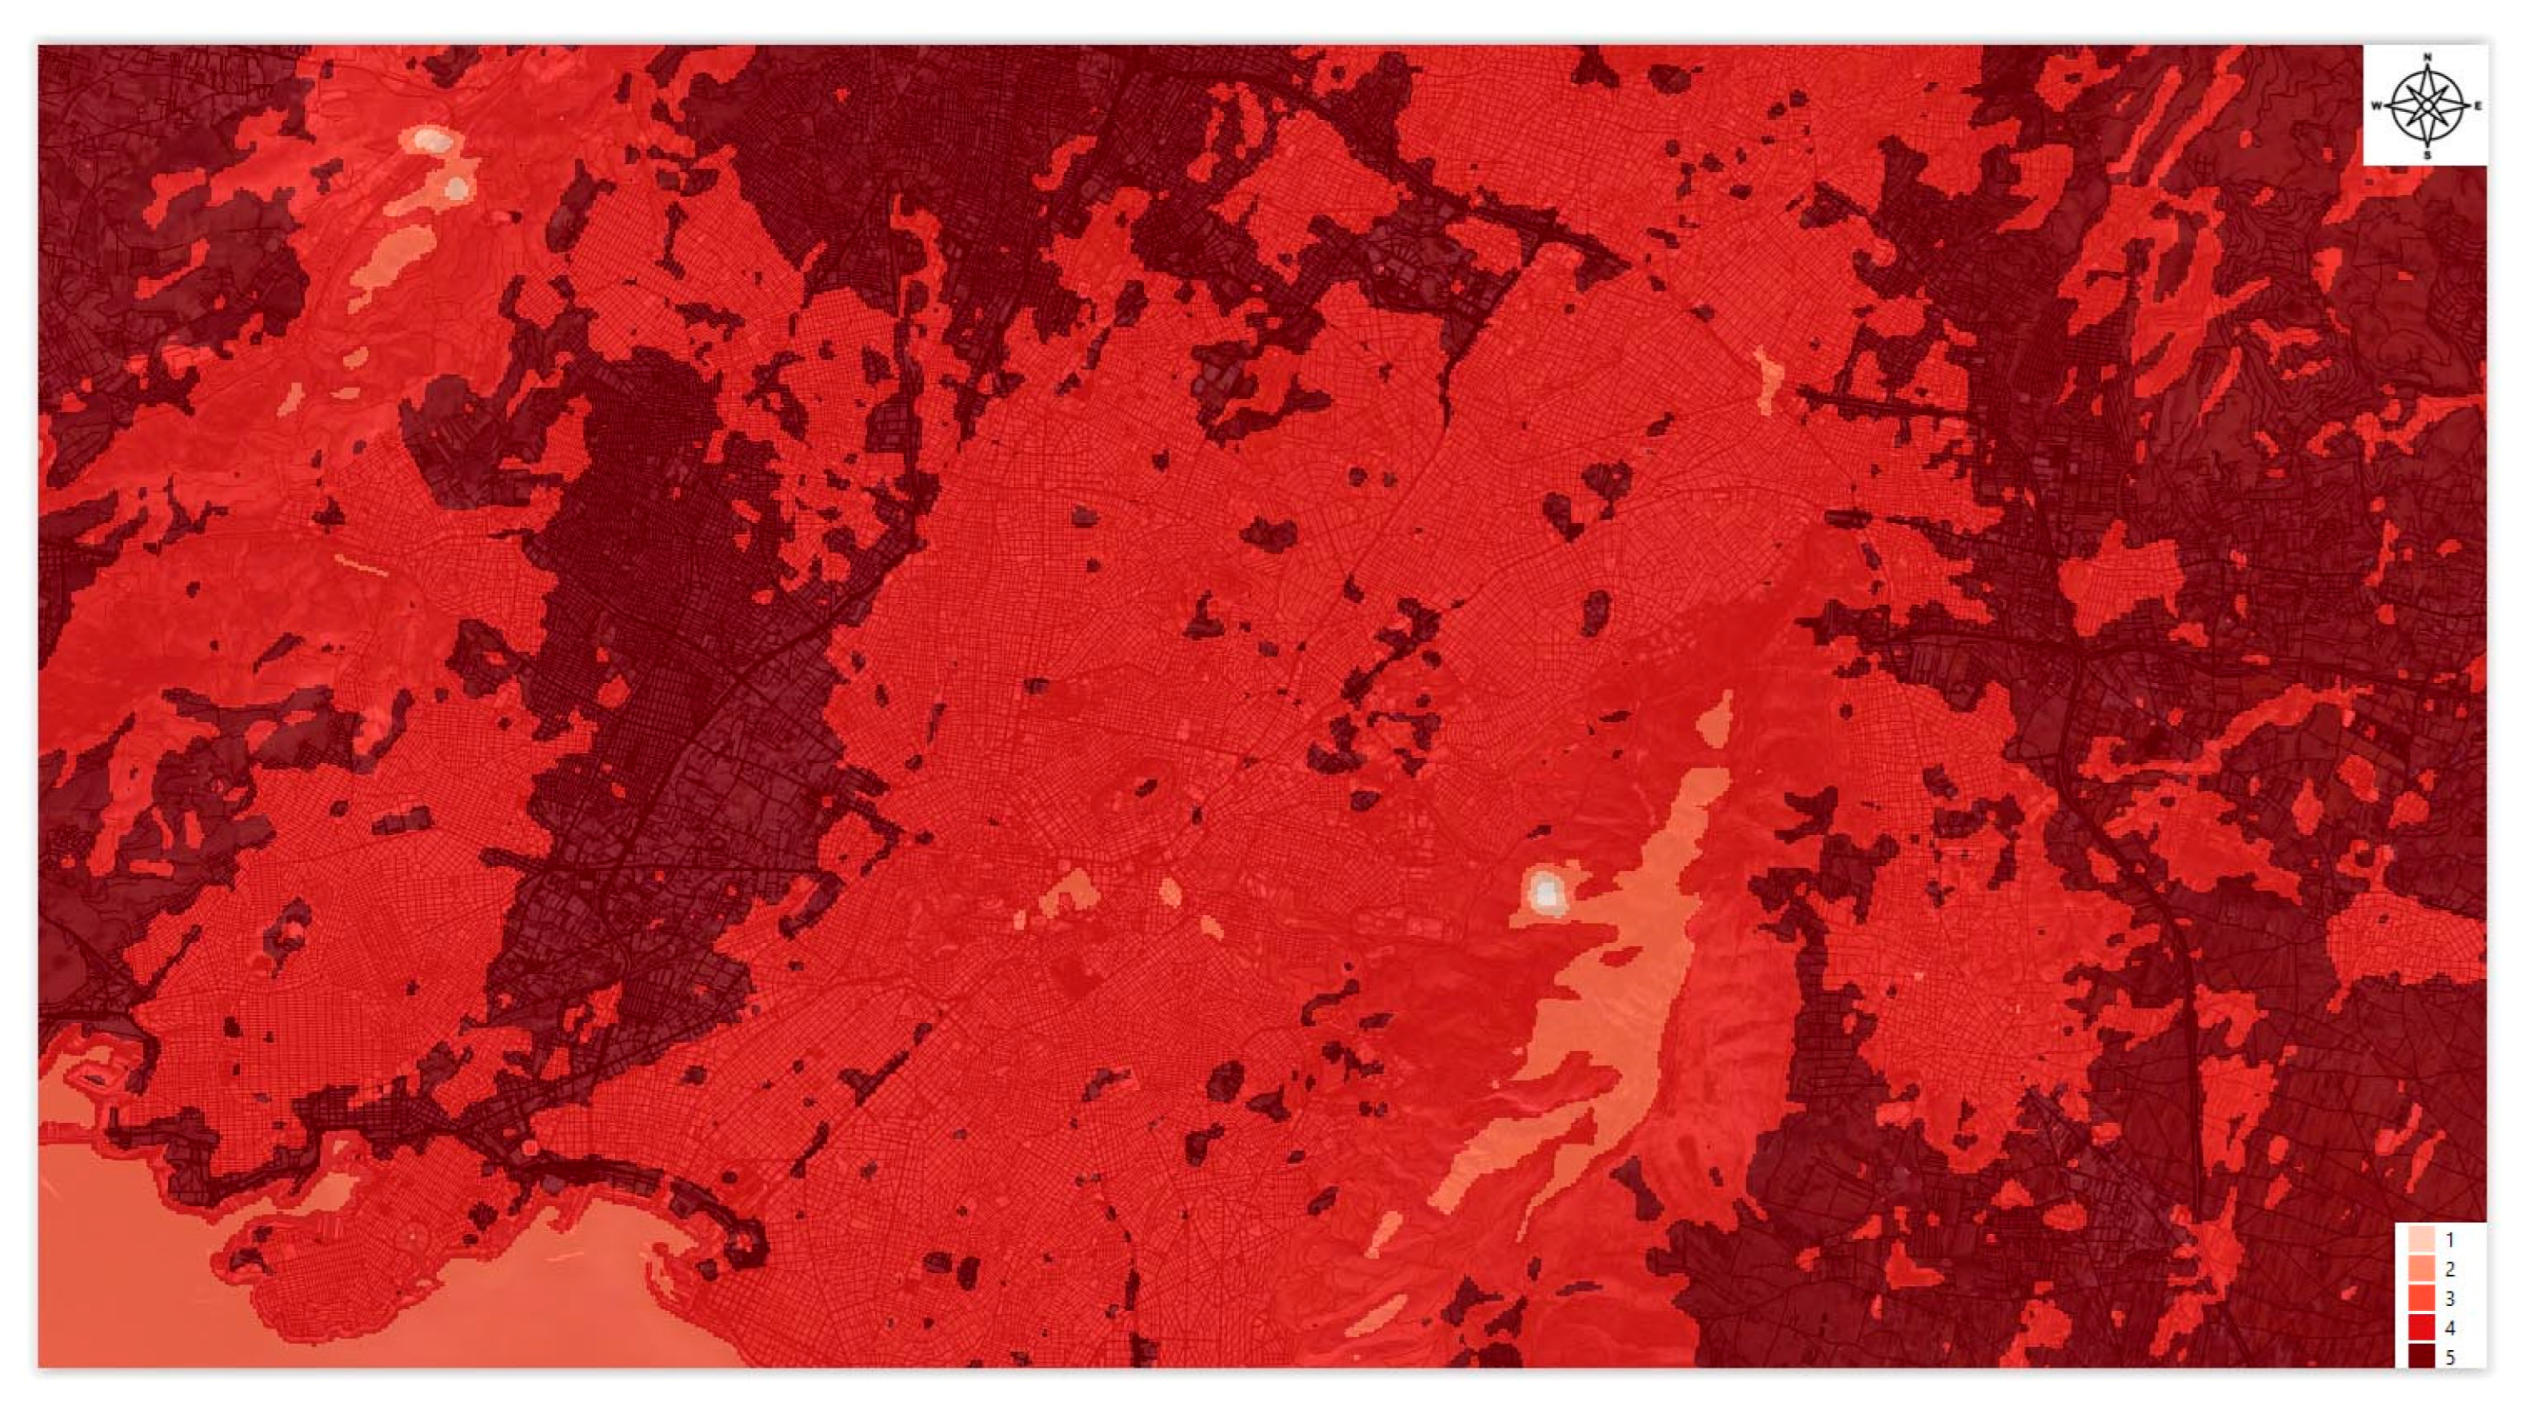
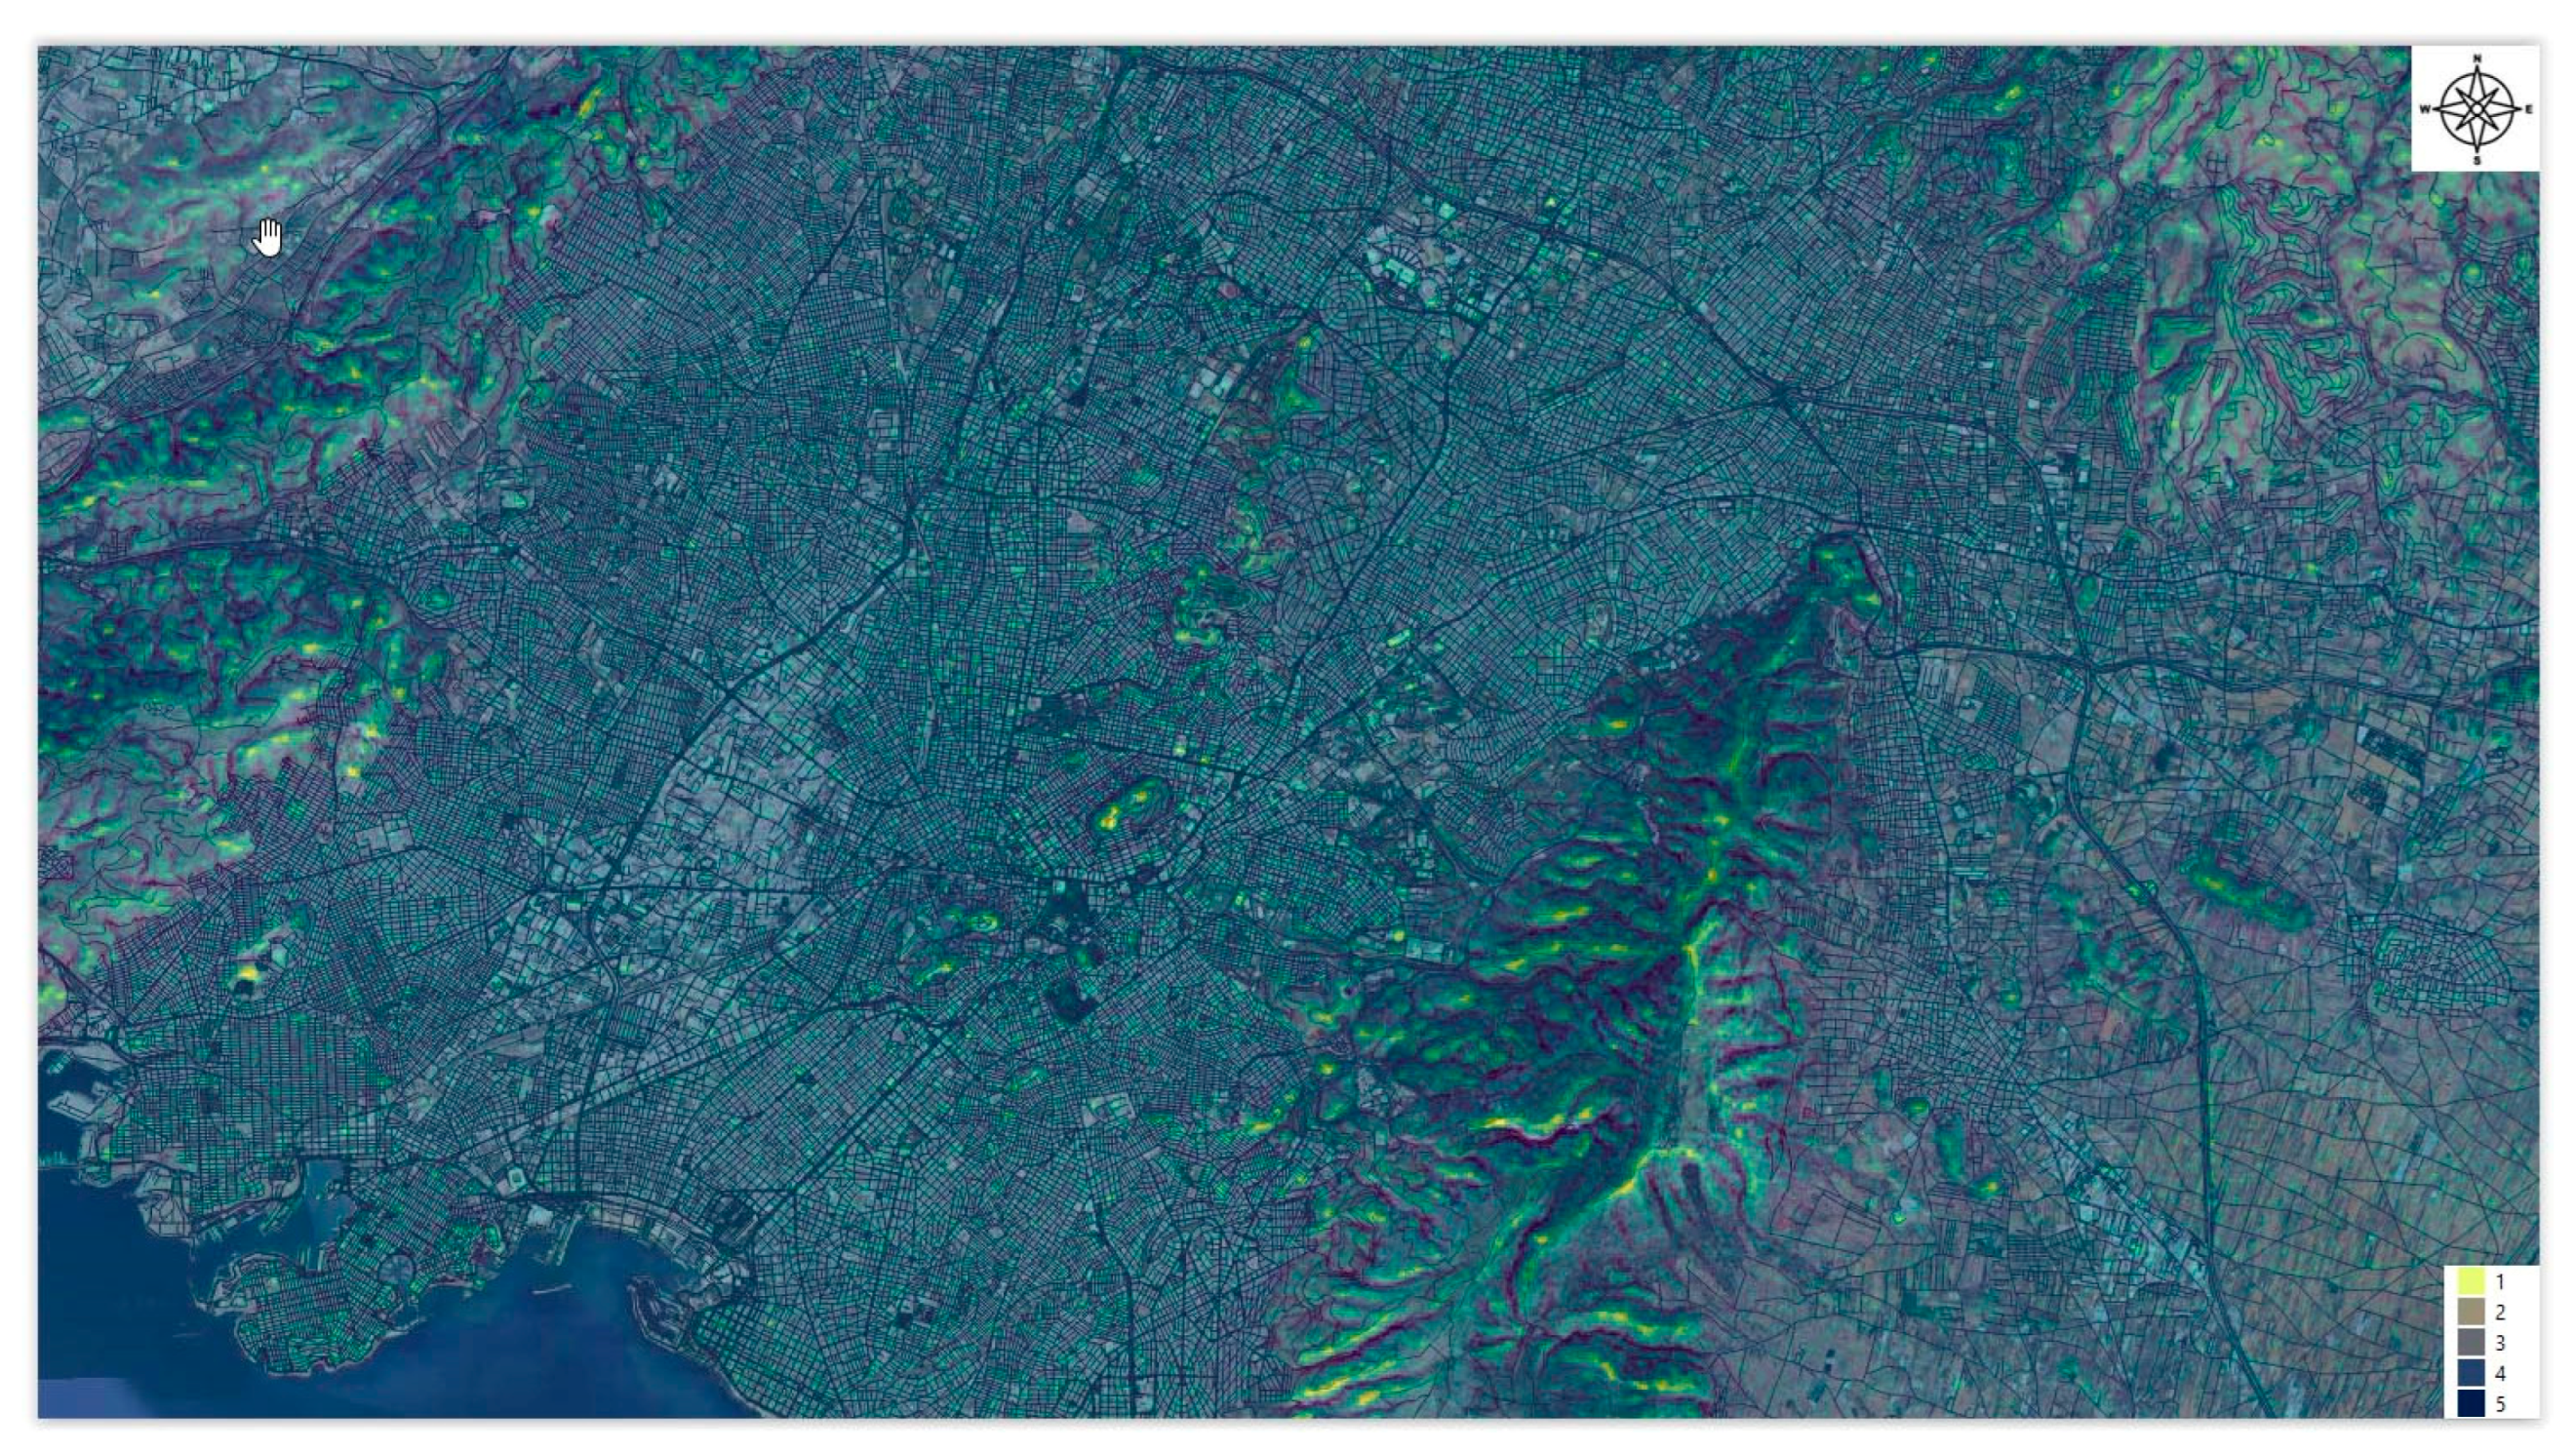
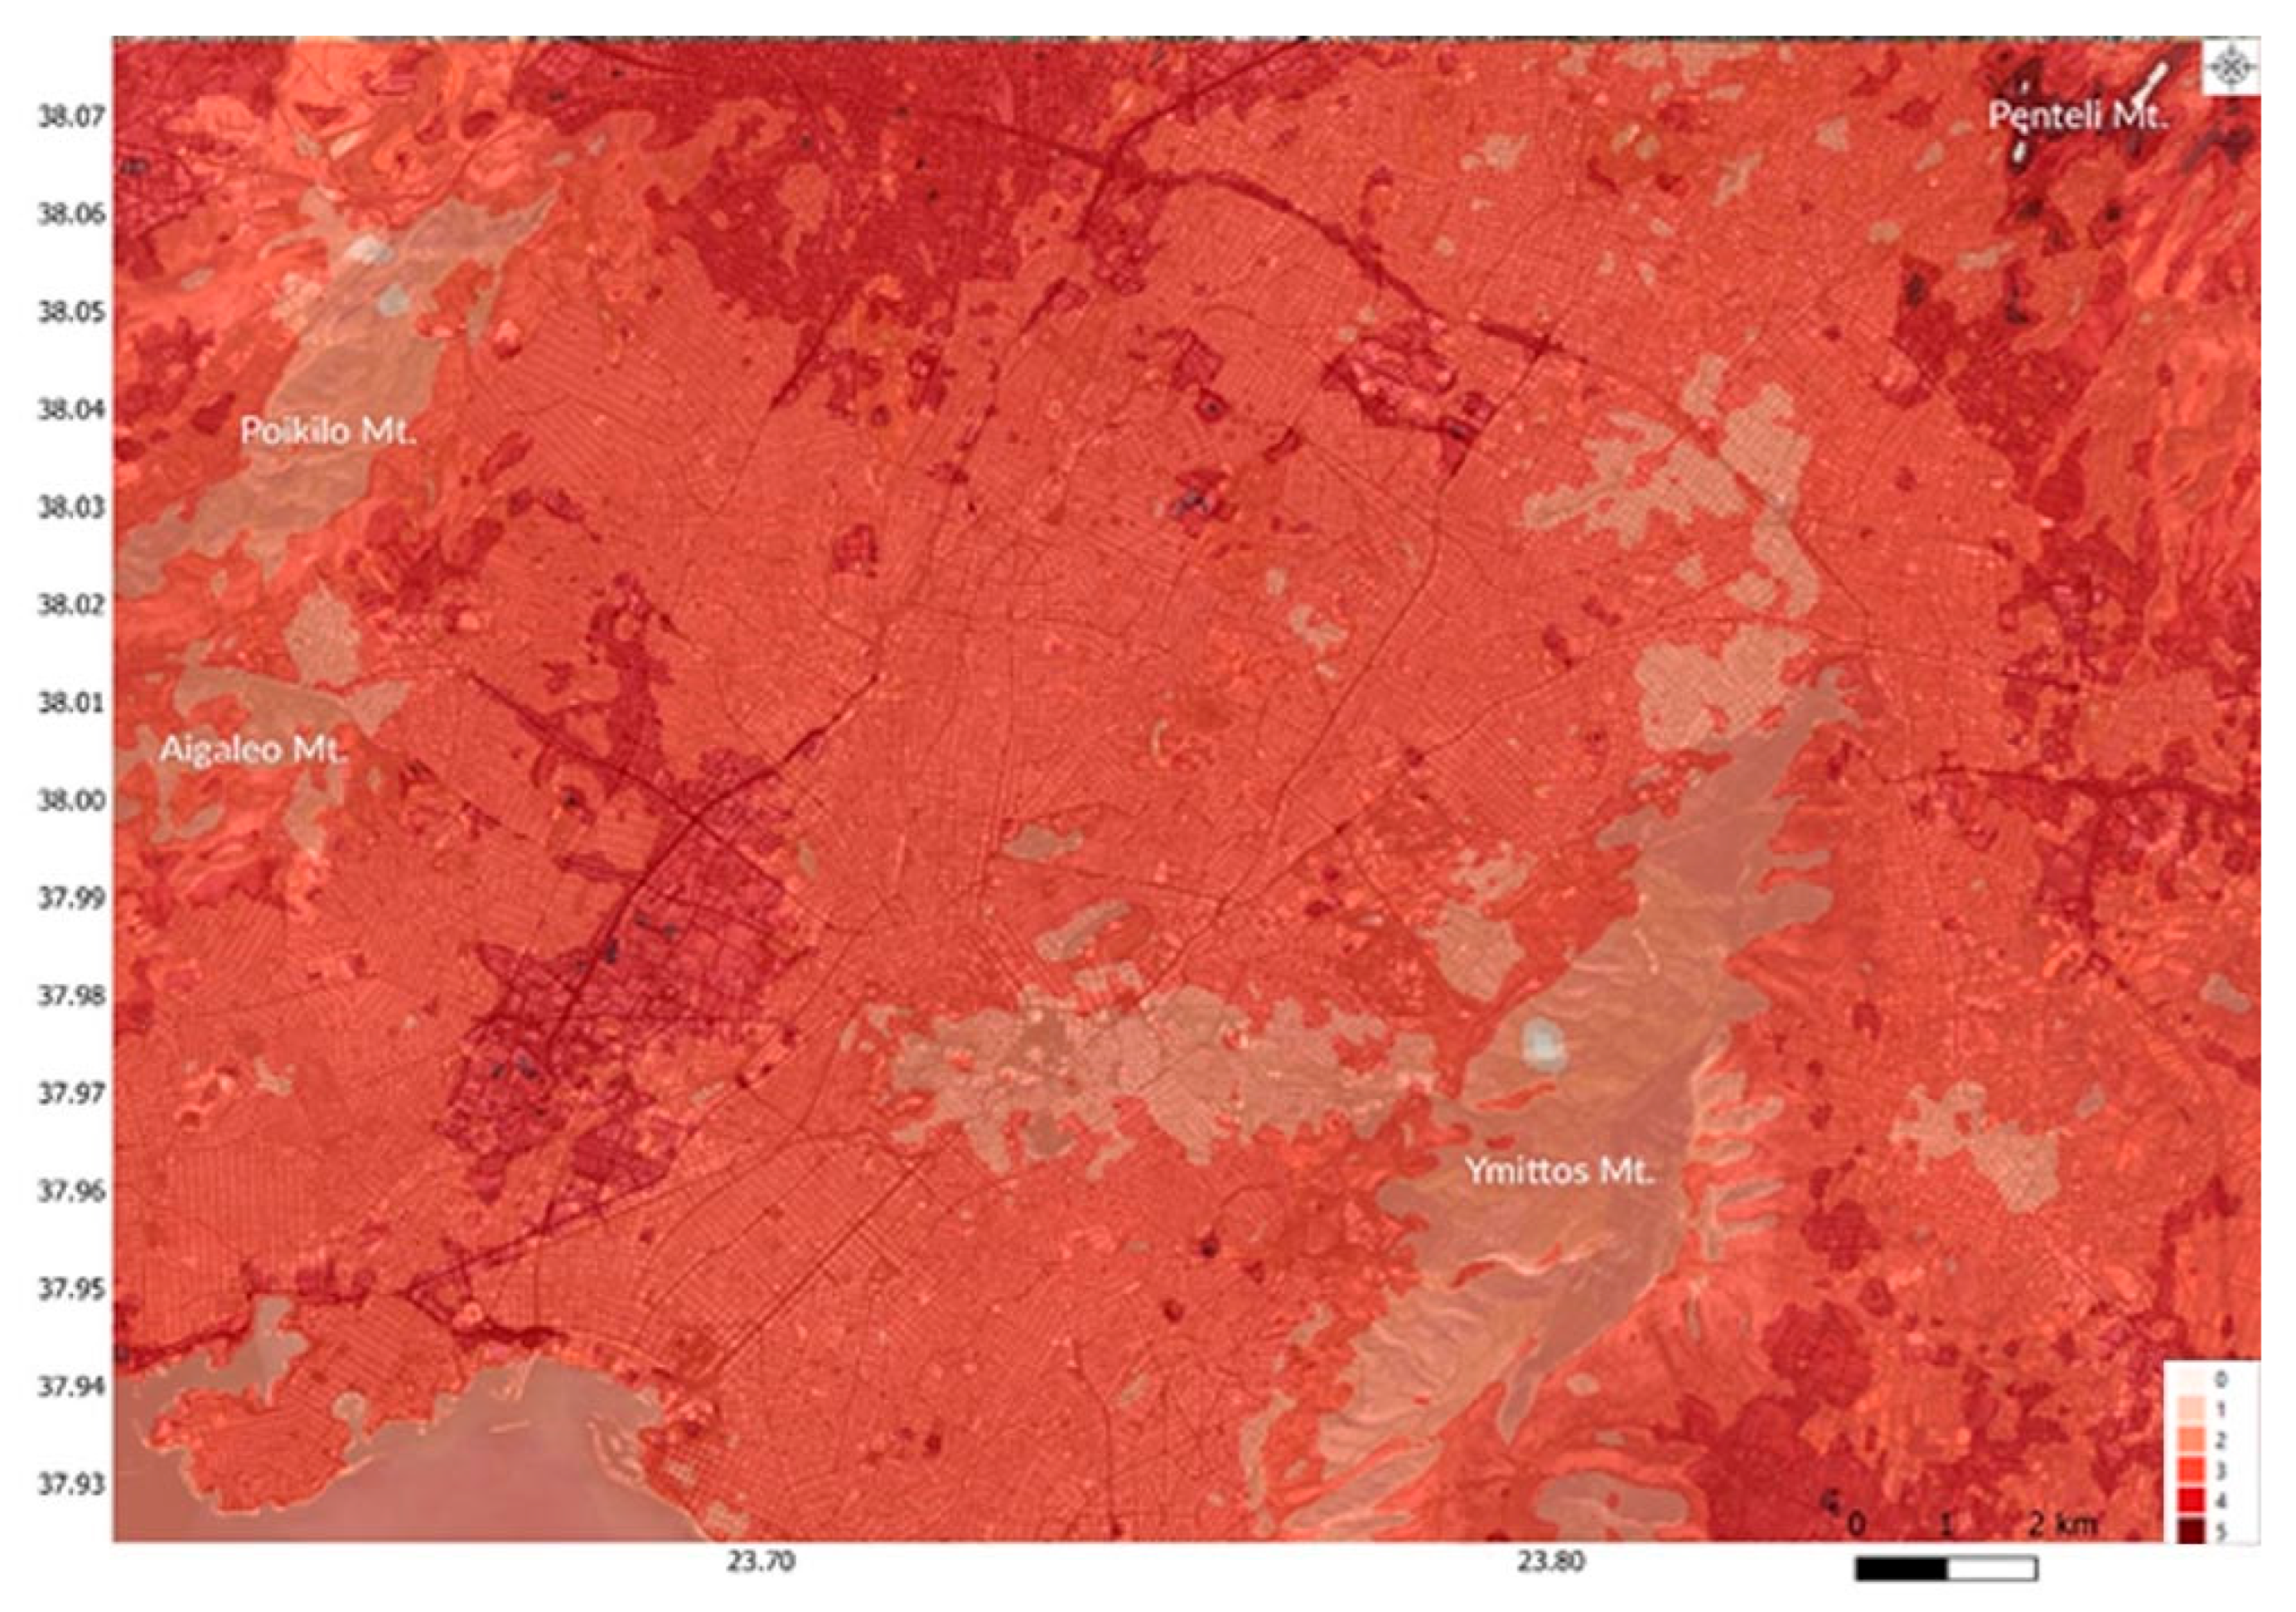
2.2.1. LST Reclassification (Figure 7): Classify LST into Five Temperature Ranges (e.g., Low, Moderate, High, and Extreme Heat Zones) [34]
Class 1—Very Cool Surfaces: 4.55 °C to 11.02 °C.
Typically shaded areas, water bodies, or dense green zones.
Class 3—Warm Surfaces: 17.51 °C to 23.98 °C.
Mixed land cover zones—suburbs, sparse tree cover, and low-rise built-up areas.
Class 5—Very Hot/Heat Stress Zones: 30.47 °C to 36.92 °C.
Impervious surfaces, asphalt, and industrial zones—indicative of urban heat island (UHI) core zones.
Figure 7.
LST hazard zone map.
Figure 7.
LST hazard zone map.
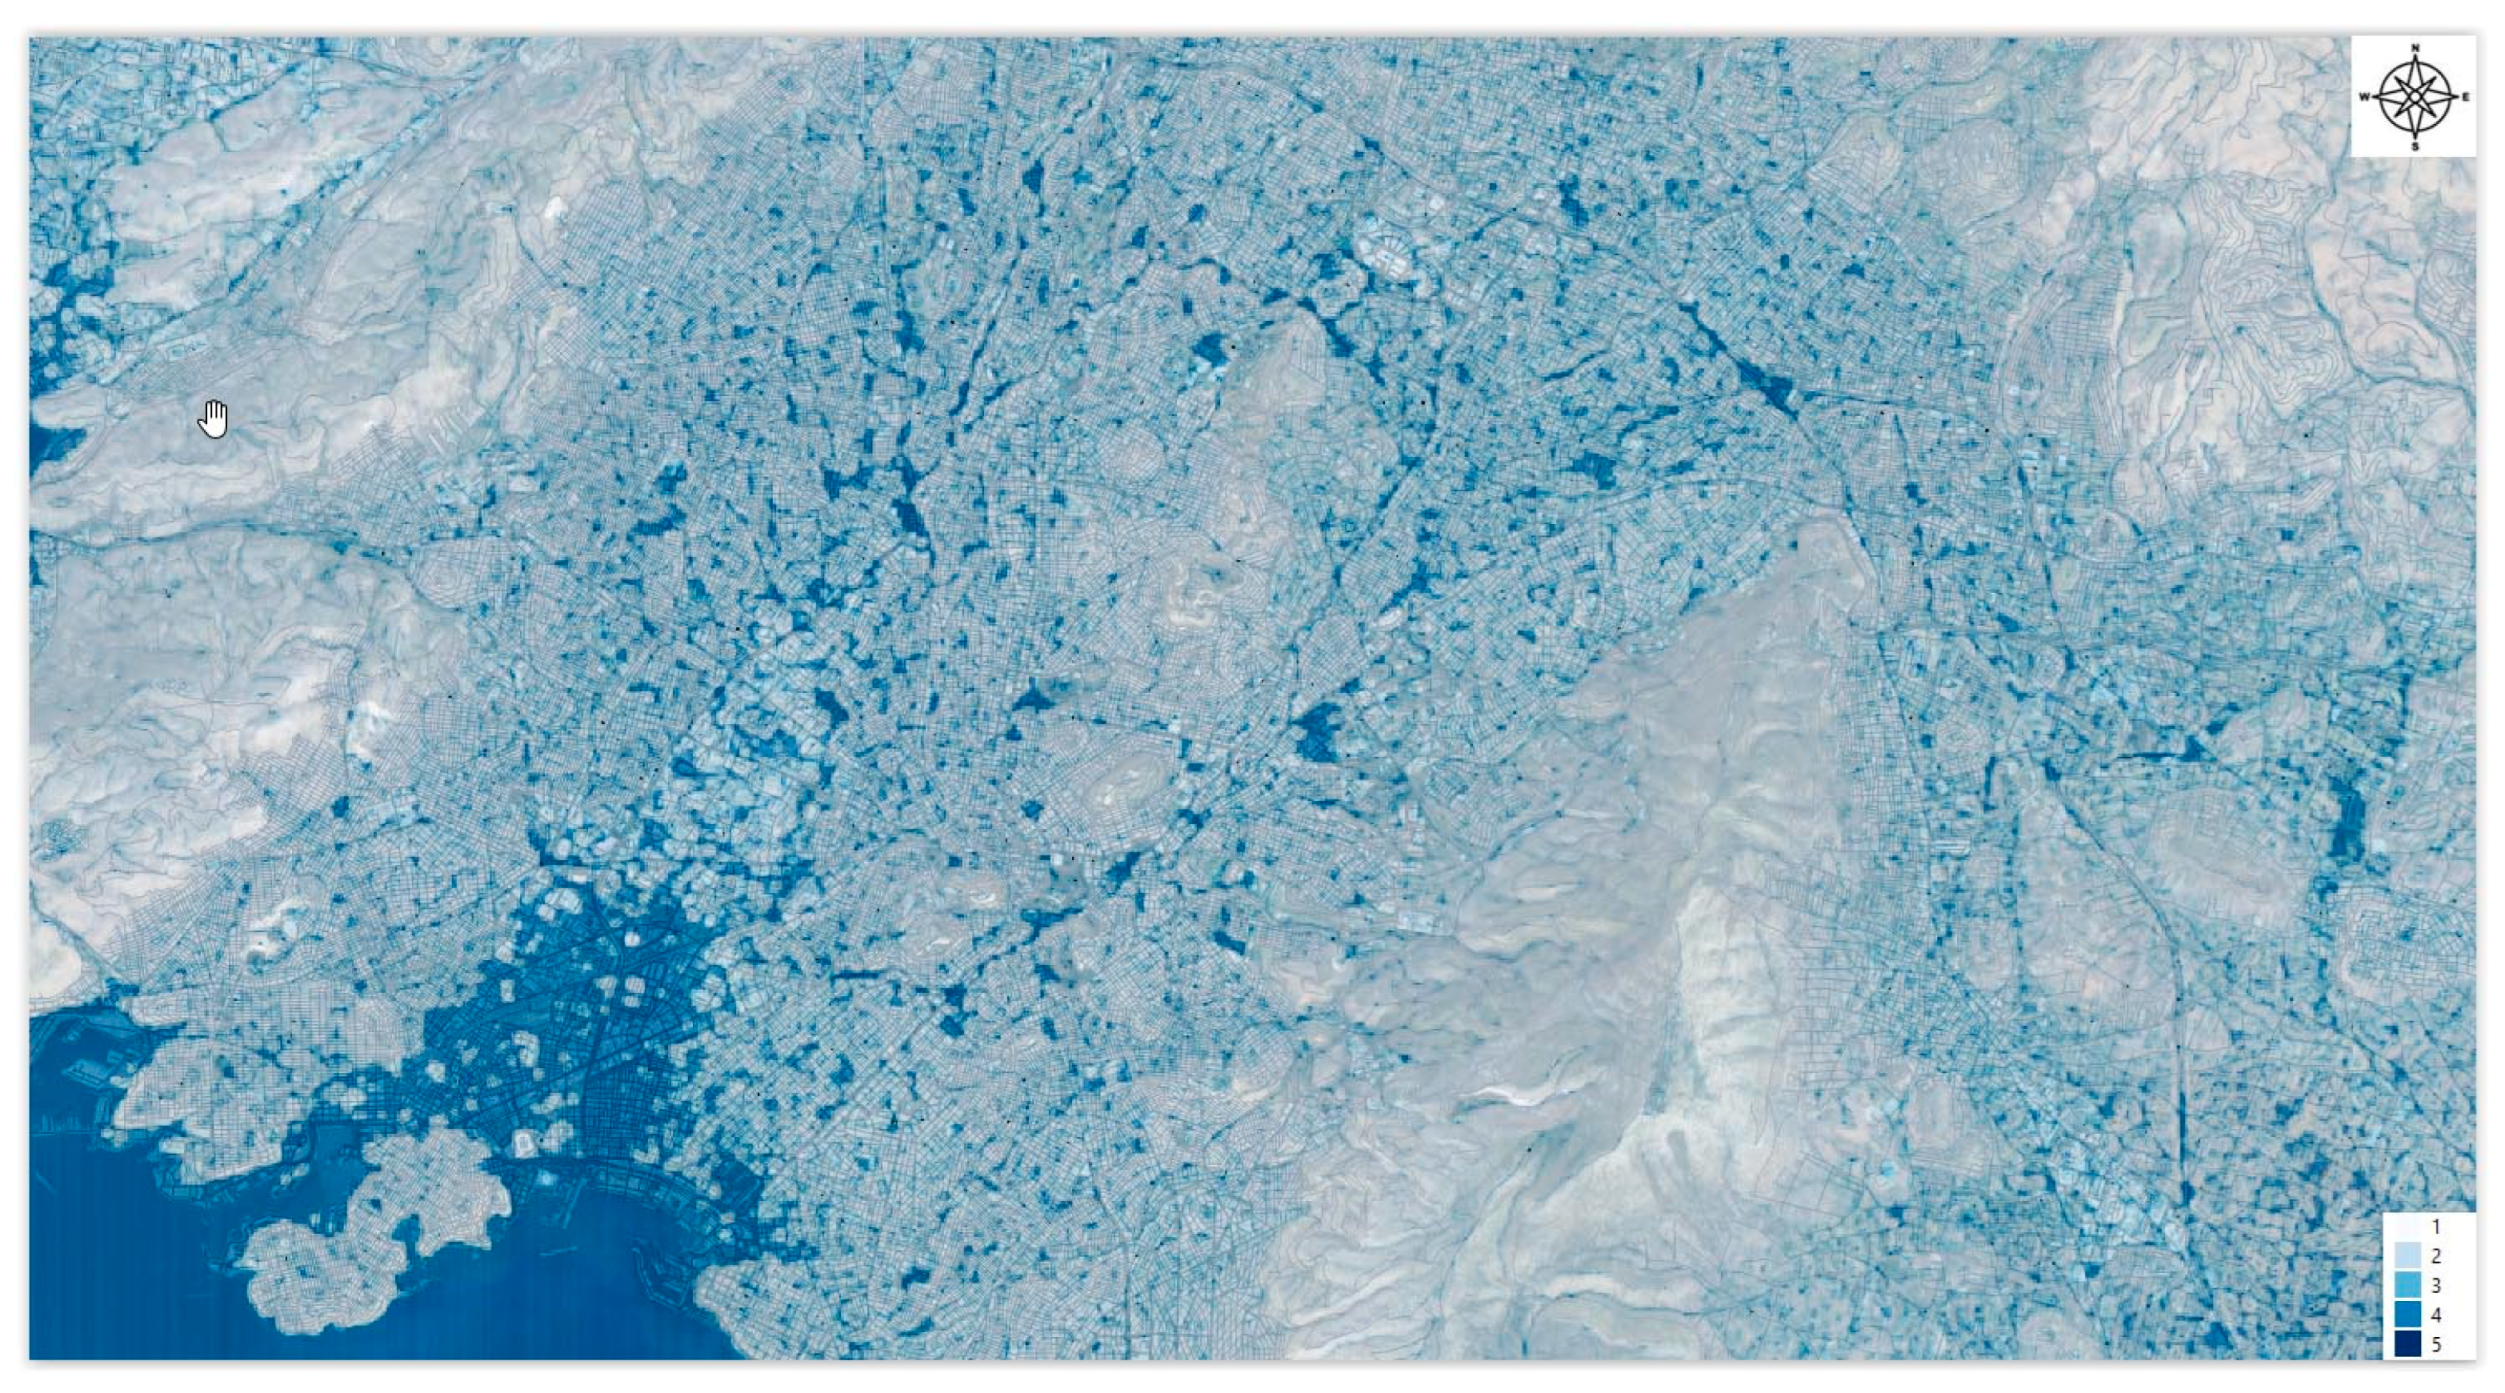
2.2.2. TWI Reclassification (Figure 8): Classify TWI into Moisture Zones (e.g., High, Moderate, and Low Moisture)
Class 1—Lowest Moisture: 0.00 to 3.39.
Very dry areas, ridges, and steep slopes—minimal water retention.
Dry slopes and elevated terrain with limited moisture.
Class 3—Moderate Moisture: 6.80 to 10.19.
Balanced moisture conditions, common in flat or rolling terrain.
Class 4—High Moisture: 10.20 to 13.59.
Moist zones, often found near streams or in gently concave areas.
Class 5—Highest Moisture: 13.60 to 16.95.
Wettest areas—valleys, wetlands, and zones of strong water convergence.
Figure 8.
TWI hazard zone map.
Figure 8.
TWI hazard zone map.
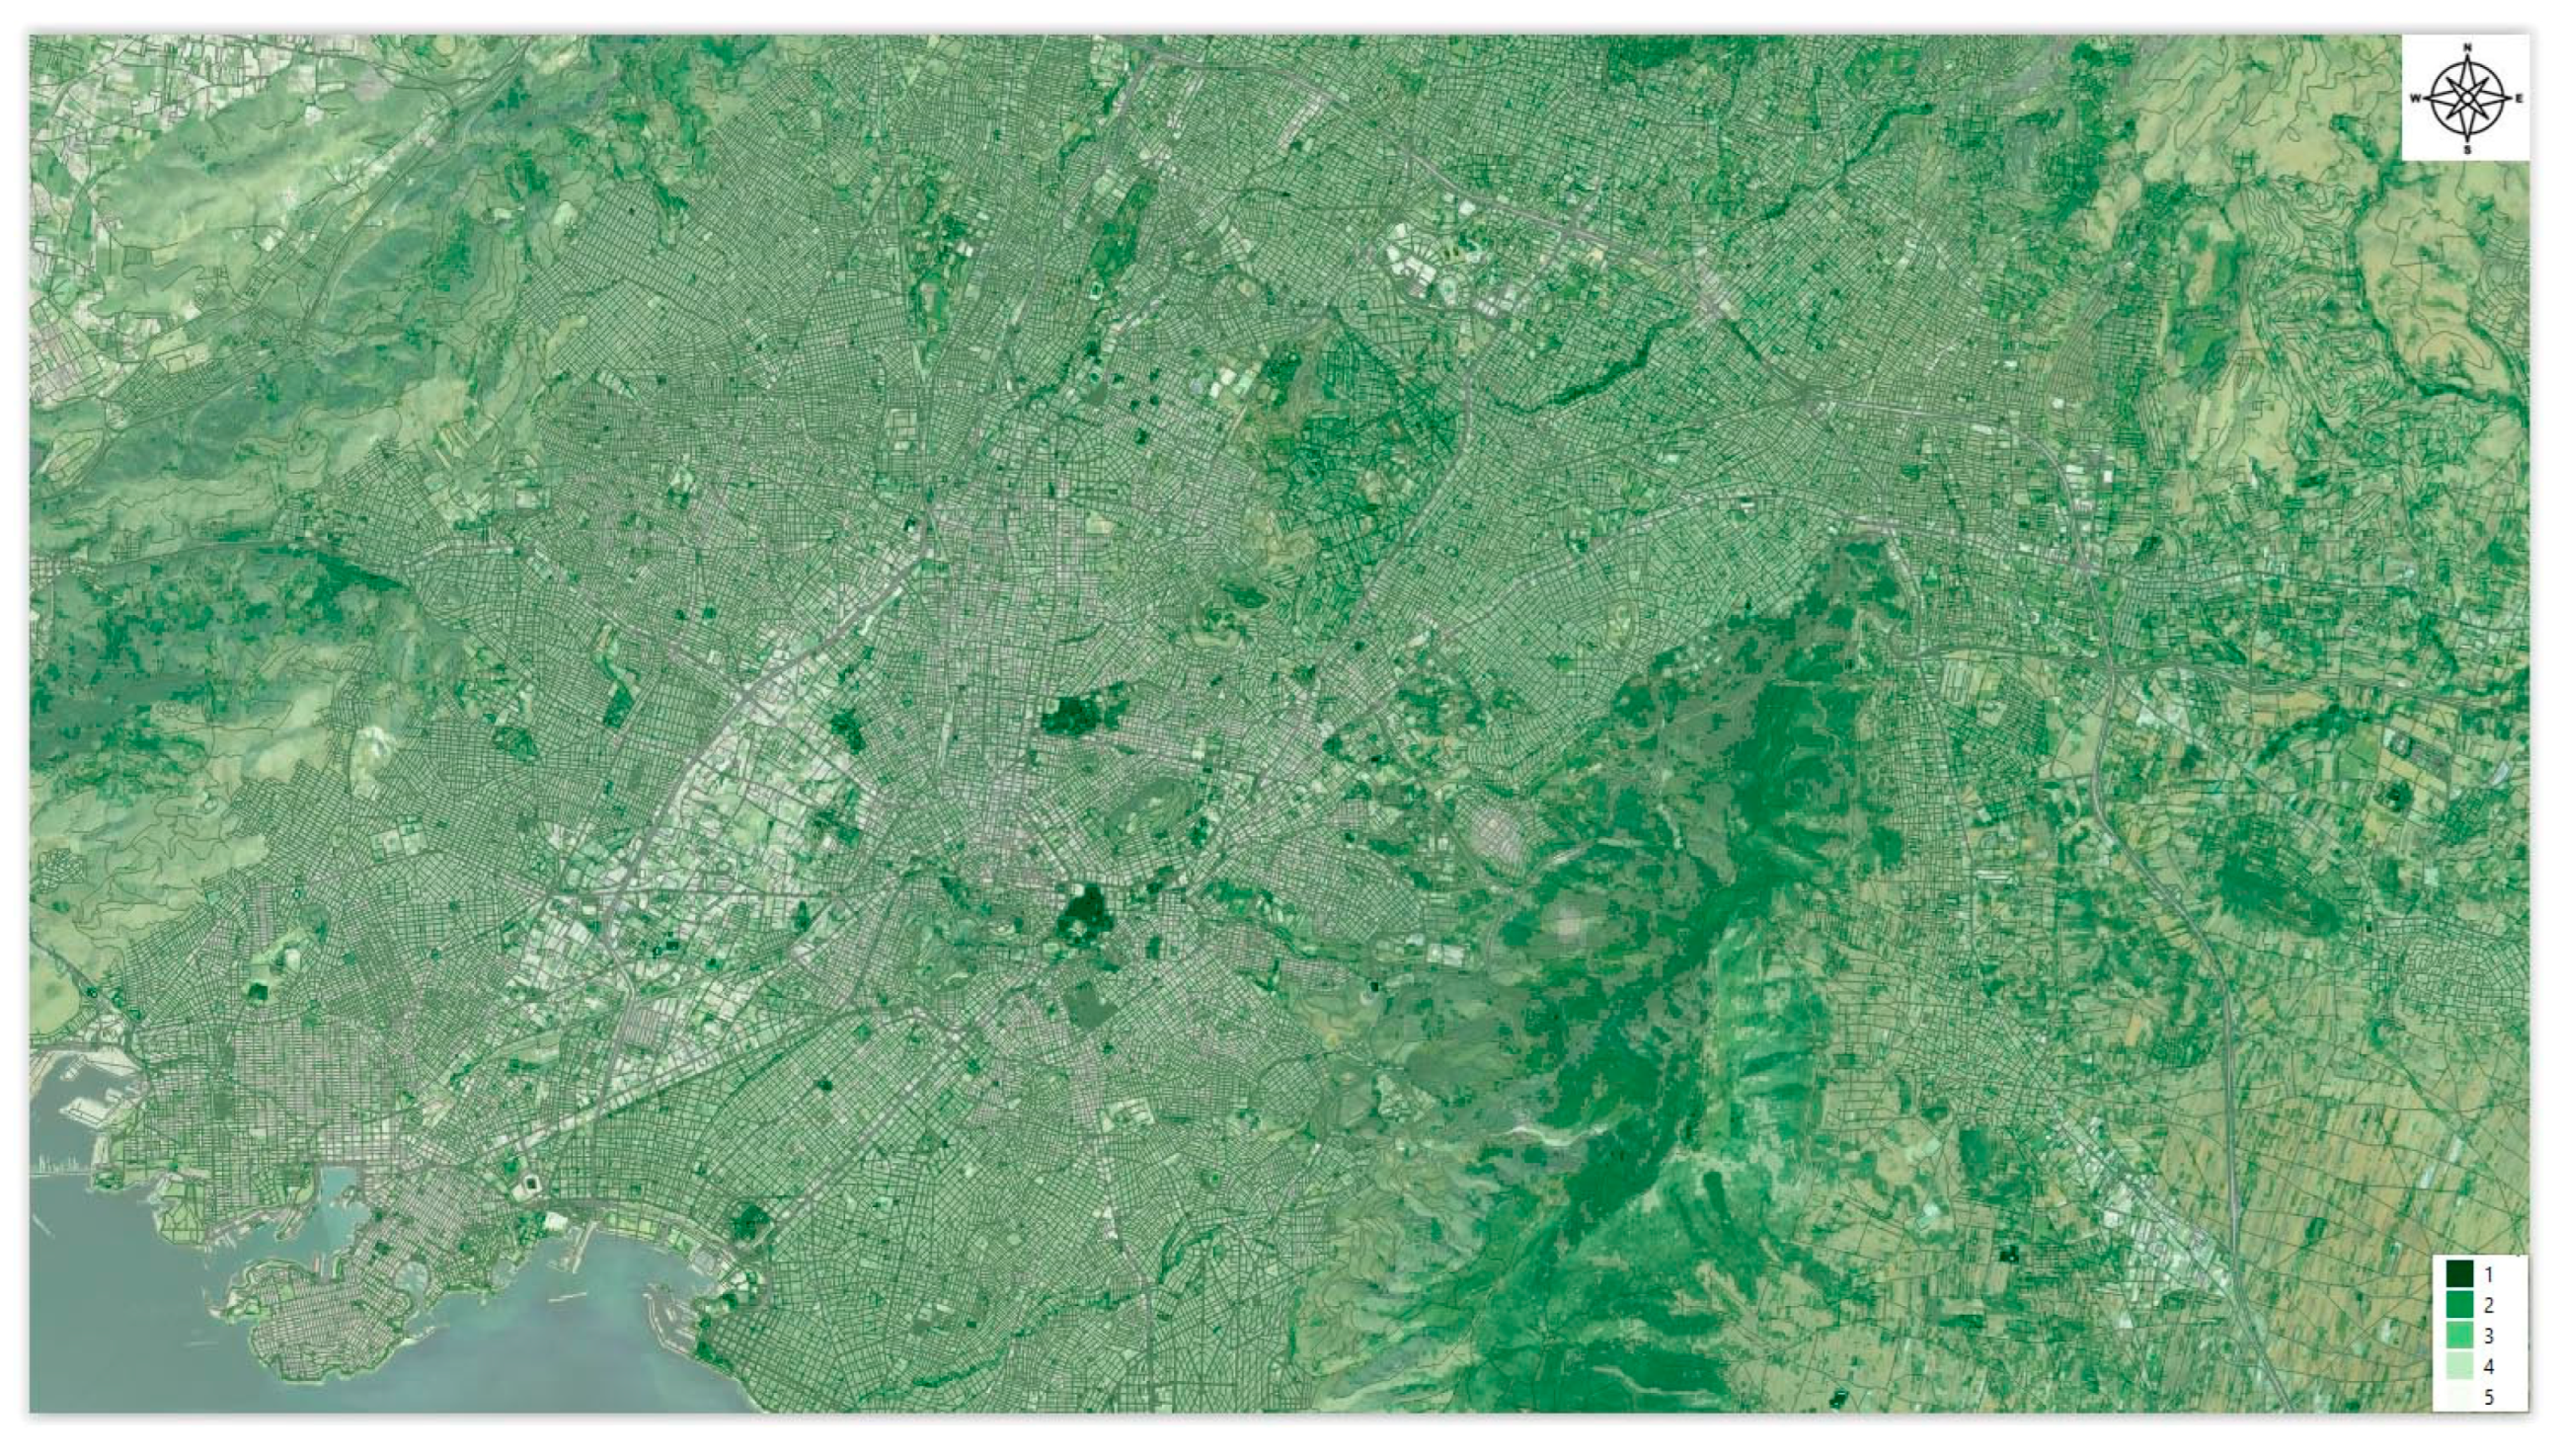
2.2.3. NDVI Reclassification (Figure 9): Classify NDVI into Categories Reflecting Vegetation Cover (e.g., High, Moderate, Low Vegetation, and Bare Soil)
Class 1—Dense/Moist Vegetation (0.397 to 0.52).
Forests, riparian zones, and healthy parks—strong cooling and moisture retention.
Class 2—Healthy Vegetation (0.273 to 0.396).
Suburban greenery, fields, and well-maintained parks.
Class 3—Moderate Vegetation (0.149 to 0.272).
Dry fields, patchy green areas, and seasonal crops.
Class 4—Sparse Vegetation (0.025 to 0.148).
Degraded green areas, roadside greenery, and weak canopy cover.
Class 5—Bare/Impervious Surfaces (−0.10 to 0.024).
Roads, rooftops, and exposed soil—minimal moisture and high heat retention.
Figure 9.
NDVI hazard zone map.
Figure 9.
NDVI hazard zone map.
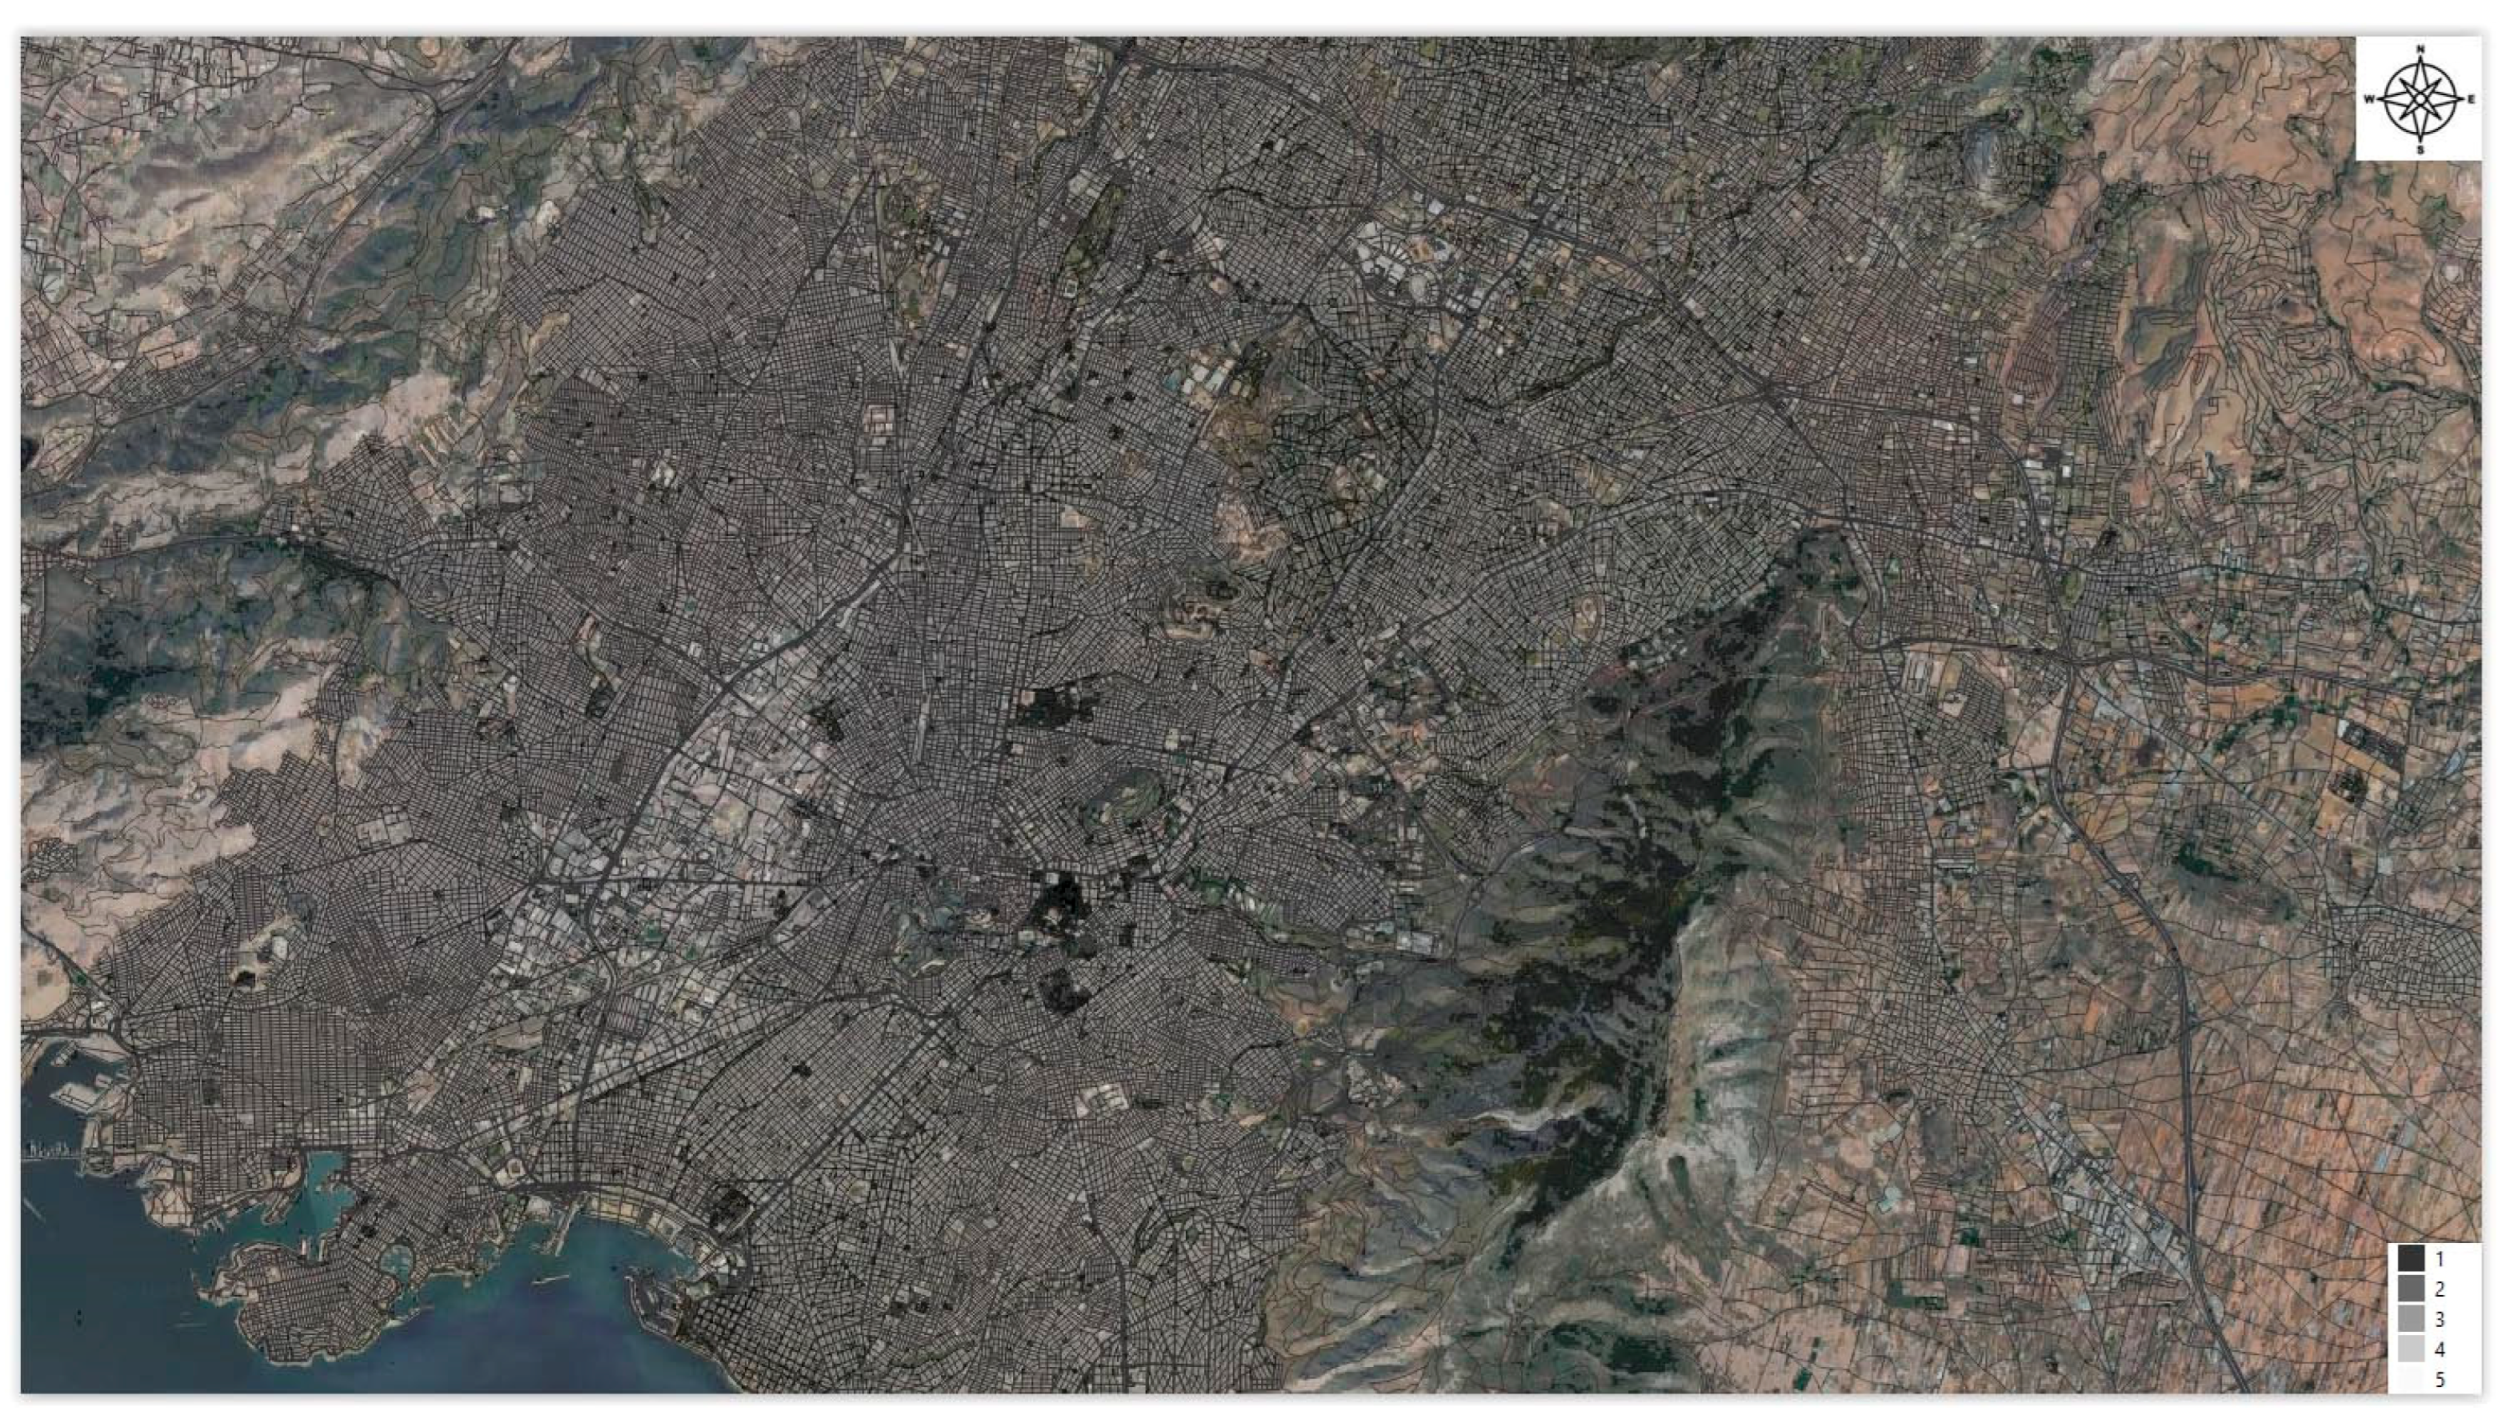
2.2.4. NDBI Reclassification (Figure 10): Classify NDBI to Reflect Urban Areas (e.g., High Built-Up Areas Indicating More Heat Absorption)
Class 1—Very Low Urbanization: −0.27 to −0.148.
Natural areas, vegetation, and water—no urban development.
Class 2—Low Urbanization: −0.147 to −0.025.
Sparse development, rural zones, and some vegetation.
Class 5—Very High Urbanization: 0.222 to 0.34.
Urban core, industrial, and commercial zones—impervious surfaces dominate.
Figure 10.
NDBI hazard zone map.
Figure 10.
NDBI hazard zone map.
2.2.5. Slope Classification (Figure 11): Classify Slope to Indicate Steepness Levels (e.g., Low, Moderate, and High Slope)
Class 1 (Minimal Risk/Extreme Slope): >45°.
Extremely steep areas, typically in mountainous terrain, with minimal moisture retention.
Class 3 (Low-Risk/Hilly Zone): 15° to 30°.
Steeper slopes, often leading to lower moisture retention and less heat exposure.
Figure 11.
Slope hazard zone map.
Figure 11.
Slope hazard zone map.
2.2.6. Curvature Upslope (Figure 12): Classify Upslope Curvature Values into Terrain Flow Types (e.g., Strongly Convex: Promotes Runoff and Dryness, Moderately Convex, Flat/Neutral, Moderately Concave, and Strongly Concave: High Potential for Moisture Accumulation)
Class 2 (Moderately Convex): 0.40 to 0.70
Moderately convex surfaces that begin to disperse moisture. These zones show lower soil moisture and are often drier, especially without vegetation cover.
Class 3 (Neutral/Flat): 0.10 to 0.40
Flat or gently sloping terrain with limited curvature effect on water movement. Moisture levels are balanced, influenced by land cover and soil properties.
Class 4 (Moderately Concave): −0.20 to 0.10
Slightly concave terrain that facilitates moderate water accumulation. These areas tend to retain more moisture, supporting cooler, greener microenvironments.
Class 5 (Strongly Concave): −0.43 to −0.20
Deeply concave landforms, such as valley bottoms or erosion-prone hollows. These zones accumulate the most moisture, making them ideal for vegetation and groundwater recharge.
In order to facilitate meaningful comparisons and analyses, each class is assigned a crafted set of standardized ratings. The standardization is achieved through the application of statistical methods, including the calculation of the z-score expressed by Equation (4).
Thus, it is ensured that the inherent variability within each layer is normalized, thereby providing a consistent and equitable basis for assessing heat & moisture potential across different parameters
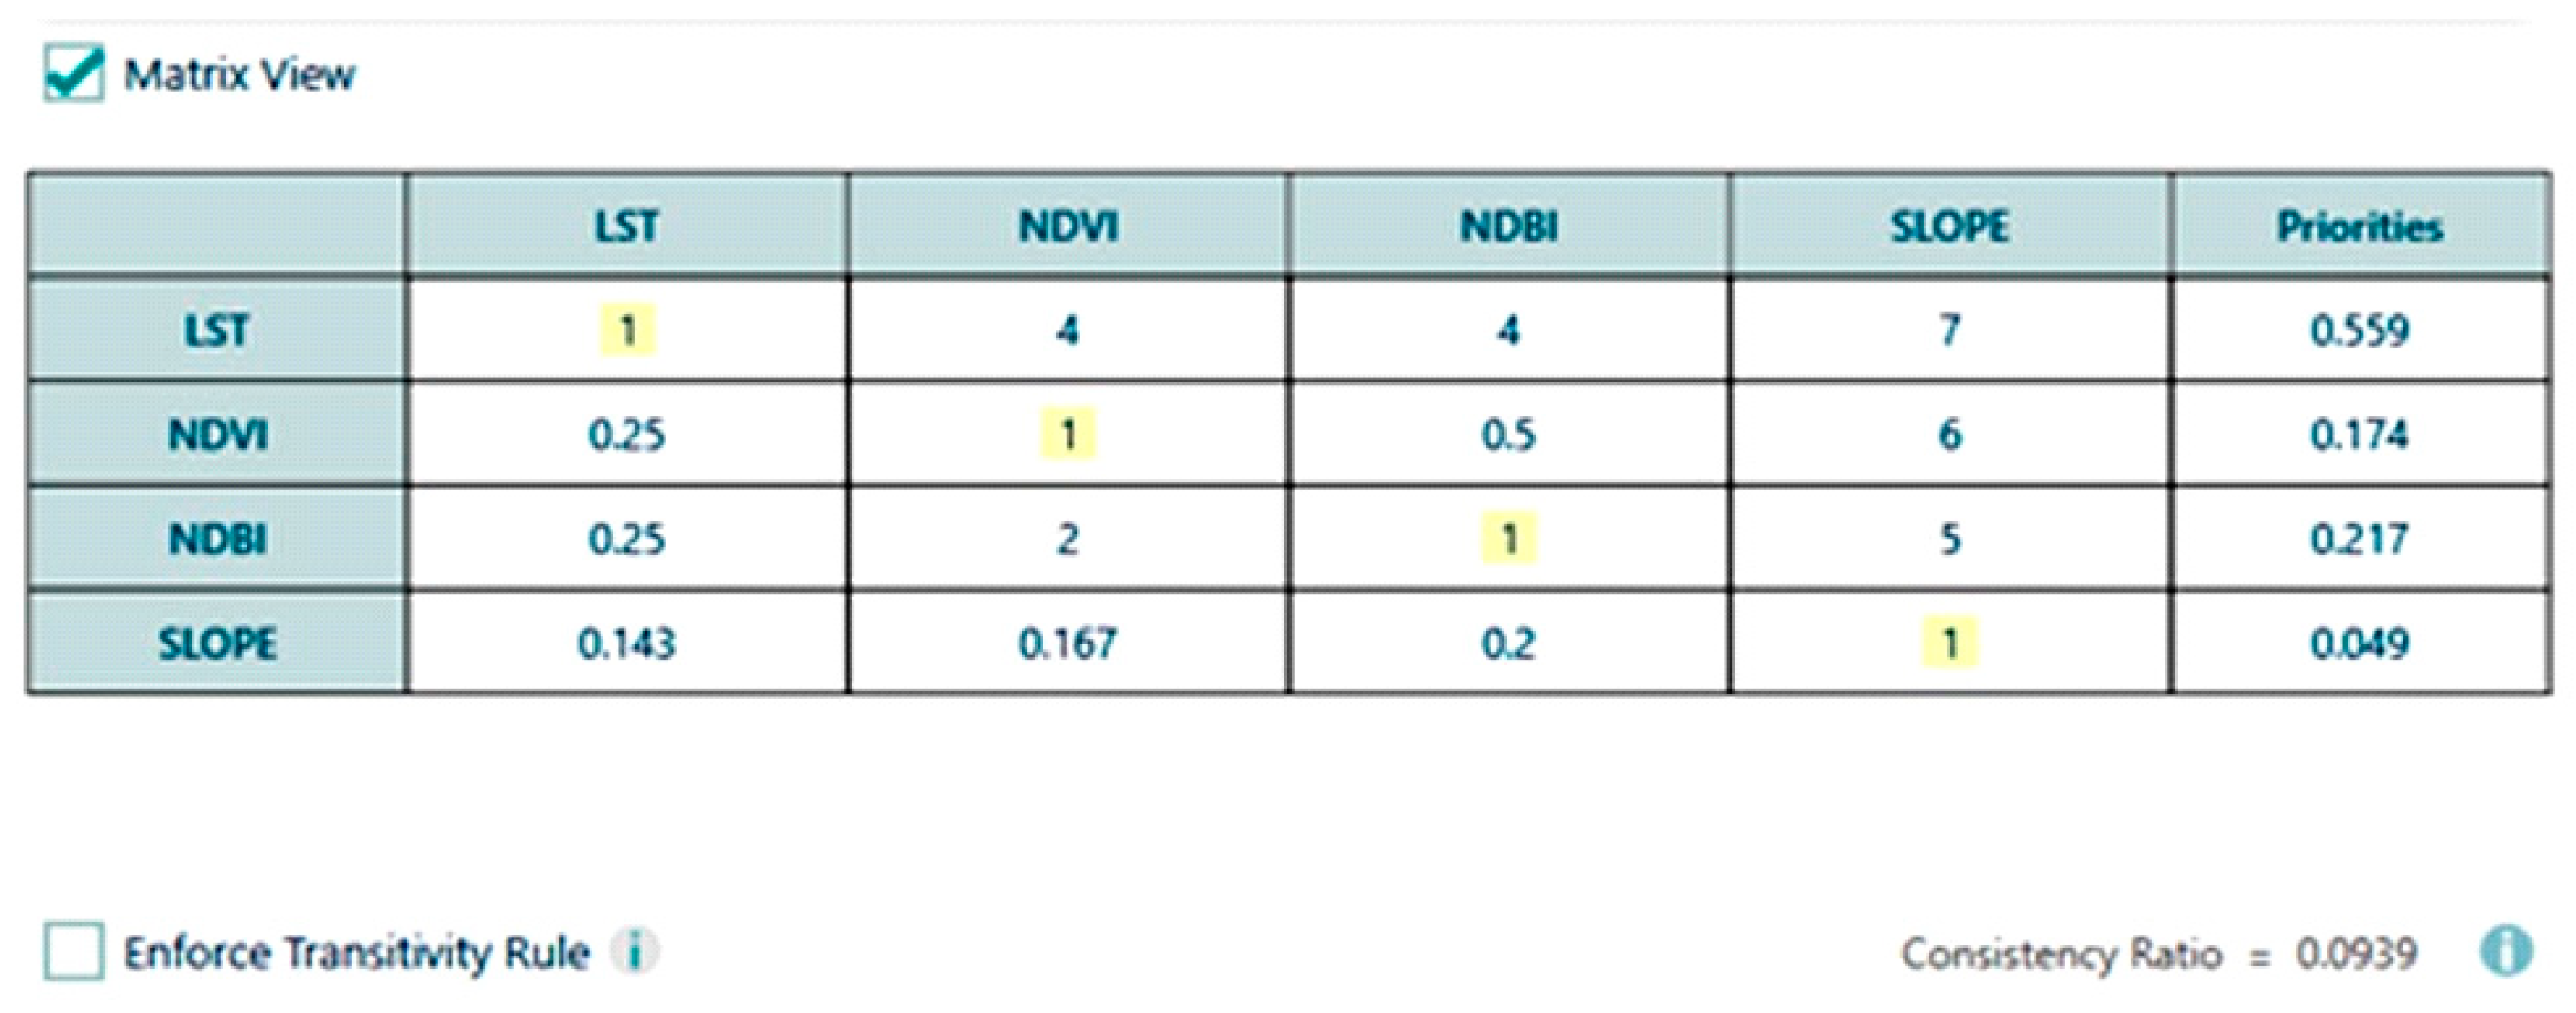
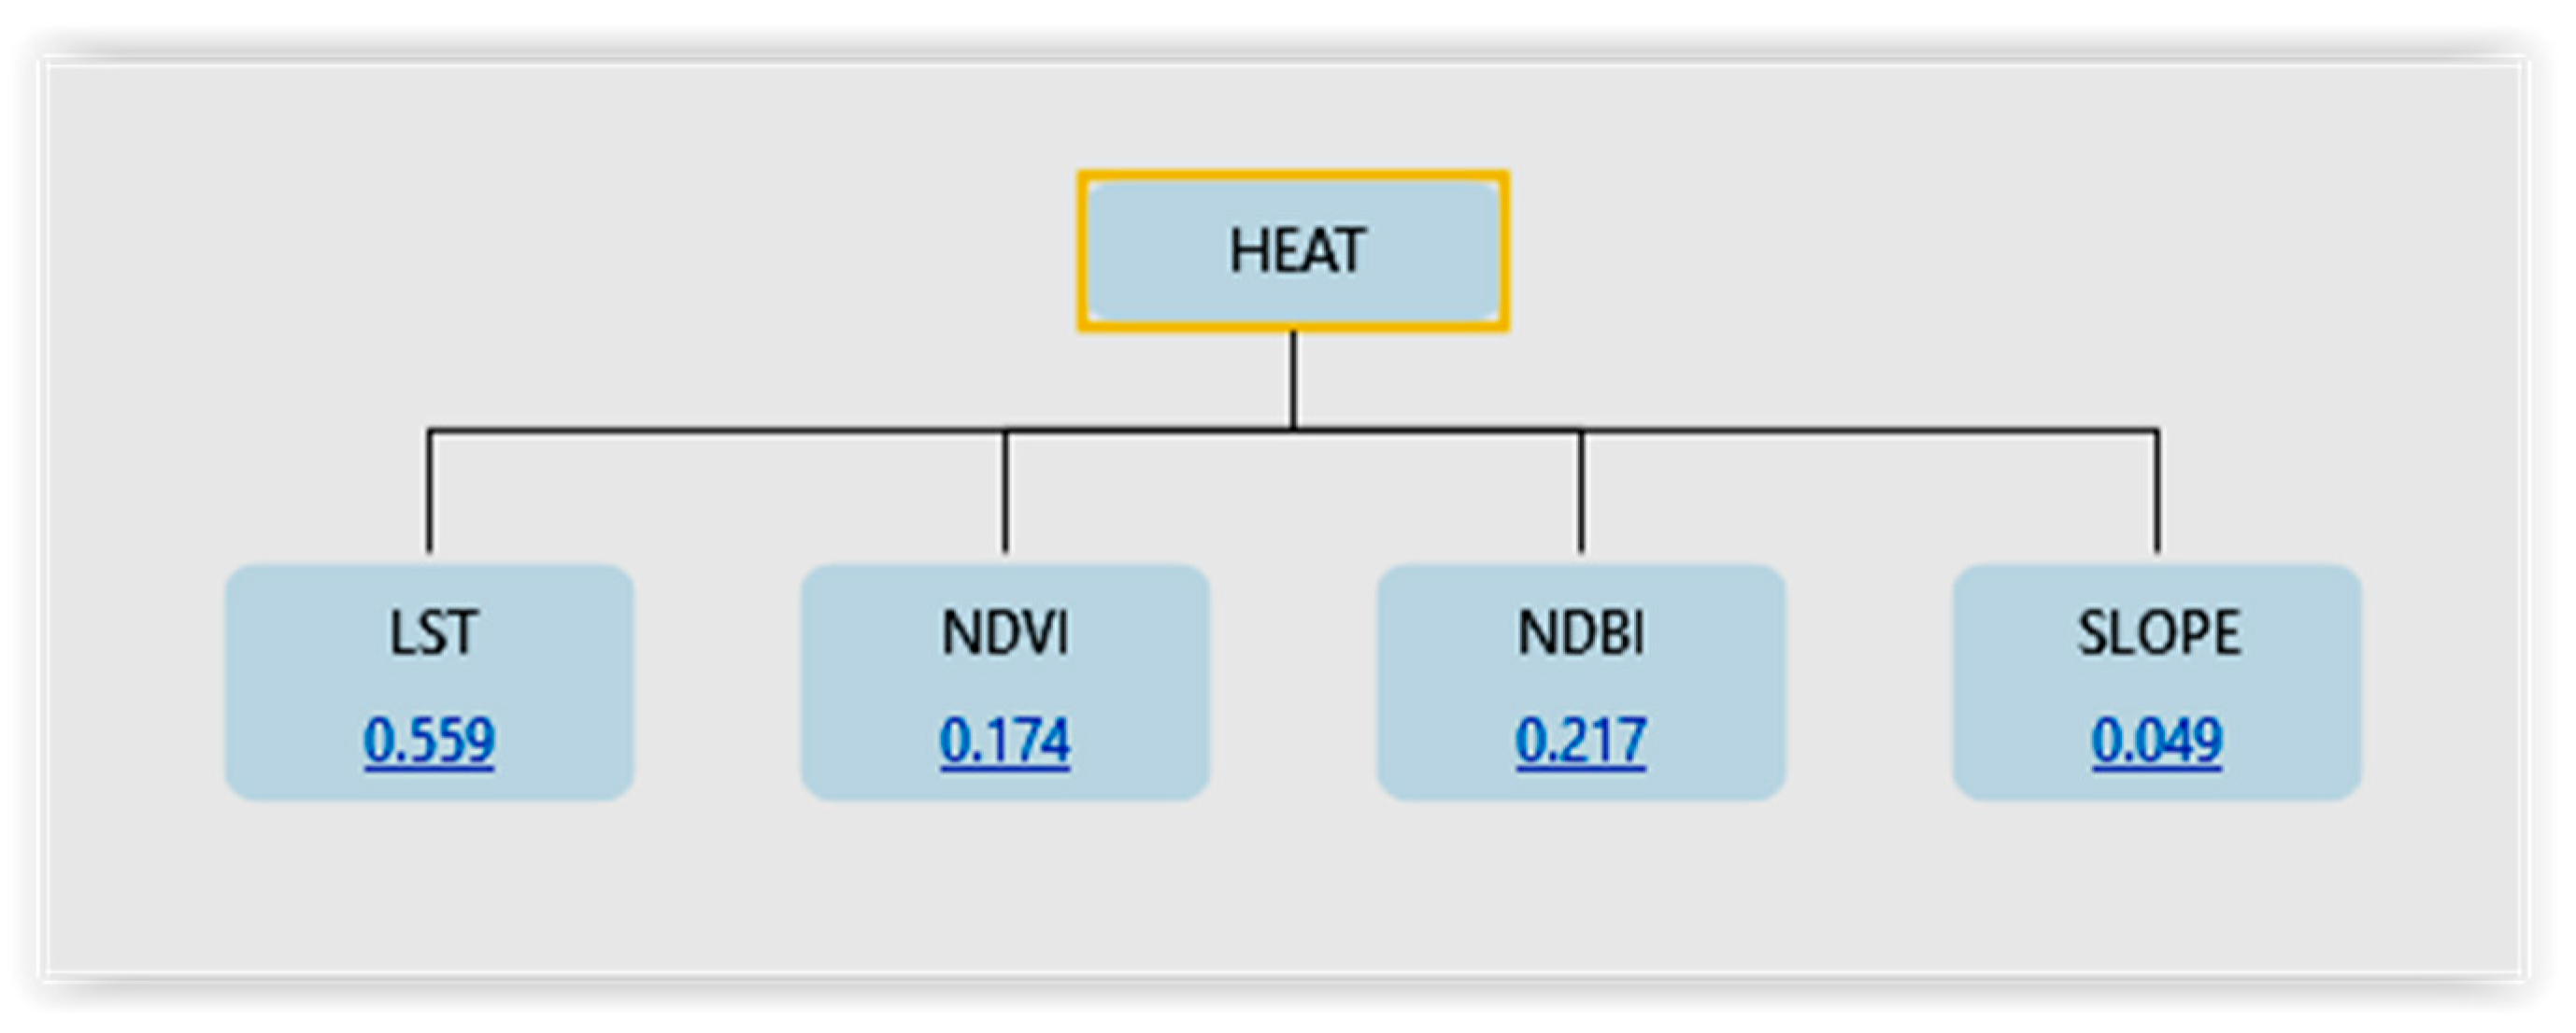
To assess and map heat exposure across the study area, the Analytic Hierarchy Process (AHP) was employed using four key criteria: Land Surface Temperature (LST), Normalized Difference Vegetation Index (NDVI), Normalized Difference Built-Up Index (NDBI), and slope [
42,
43]. These layers represent the main drivers of surface heat variation, including thermal intensity, vegetation cooling effects, urban density, and topographic influence on heat accumulation and dispersion. Through structured pairwise comparisons, the relative importance of each criterion was determined, and consistency checks ensured logical coherence in the weighting process [
40,
41]. The final weights were then applied in a weighted overlay analysis to produce a spatially explicit Heat Intensity Index, enabling the identification of urban heat island hotspots and areas of thermal risk (
Figure 13,
Figure 14 and
Figure 15).
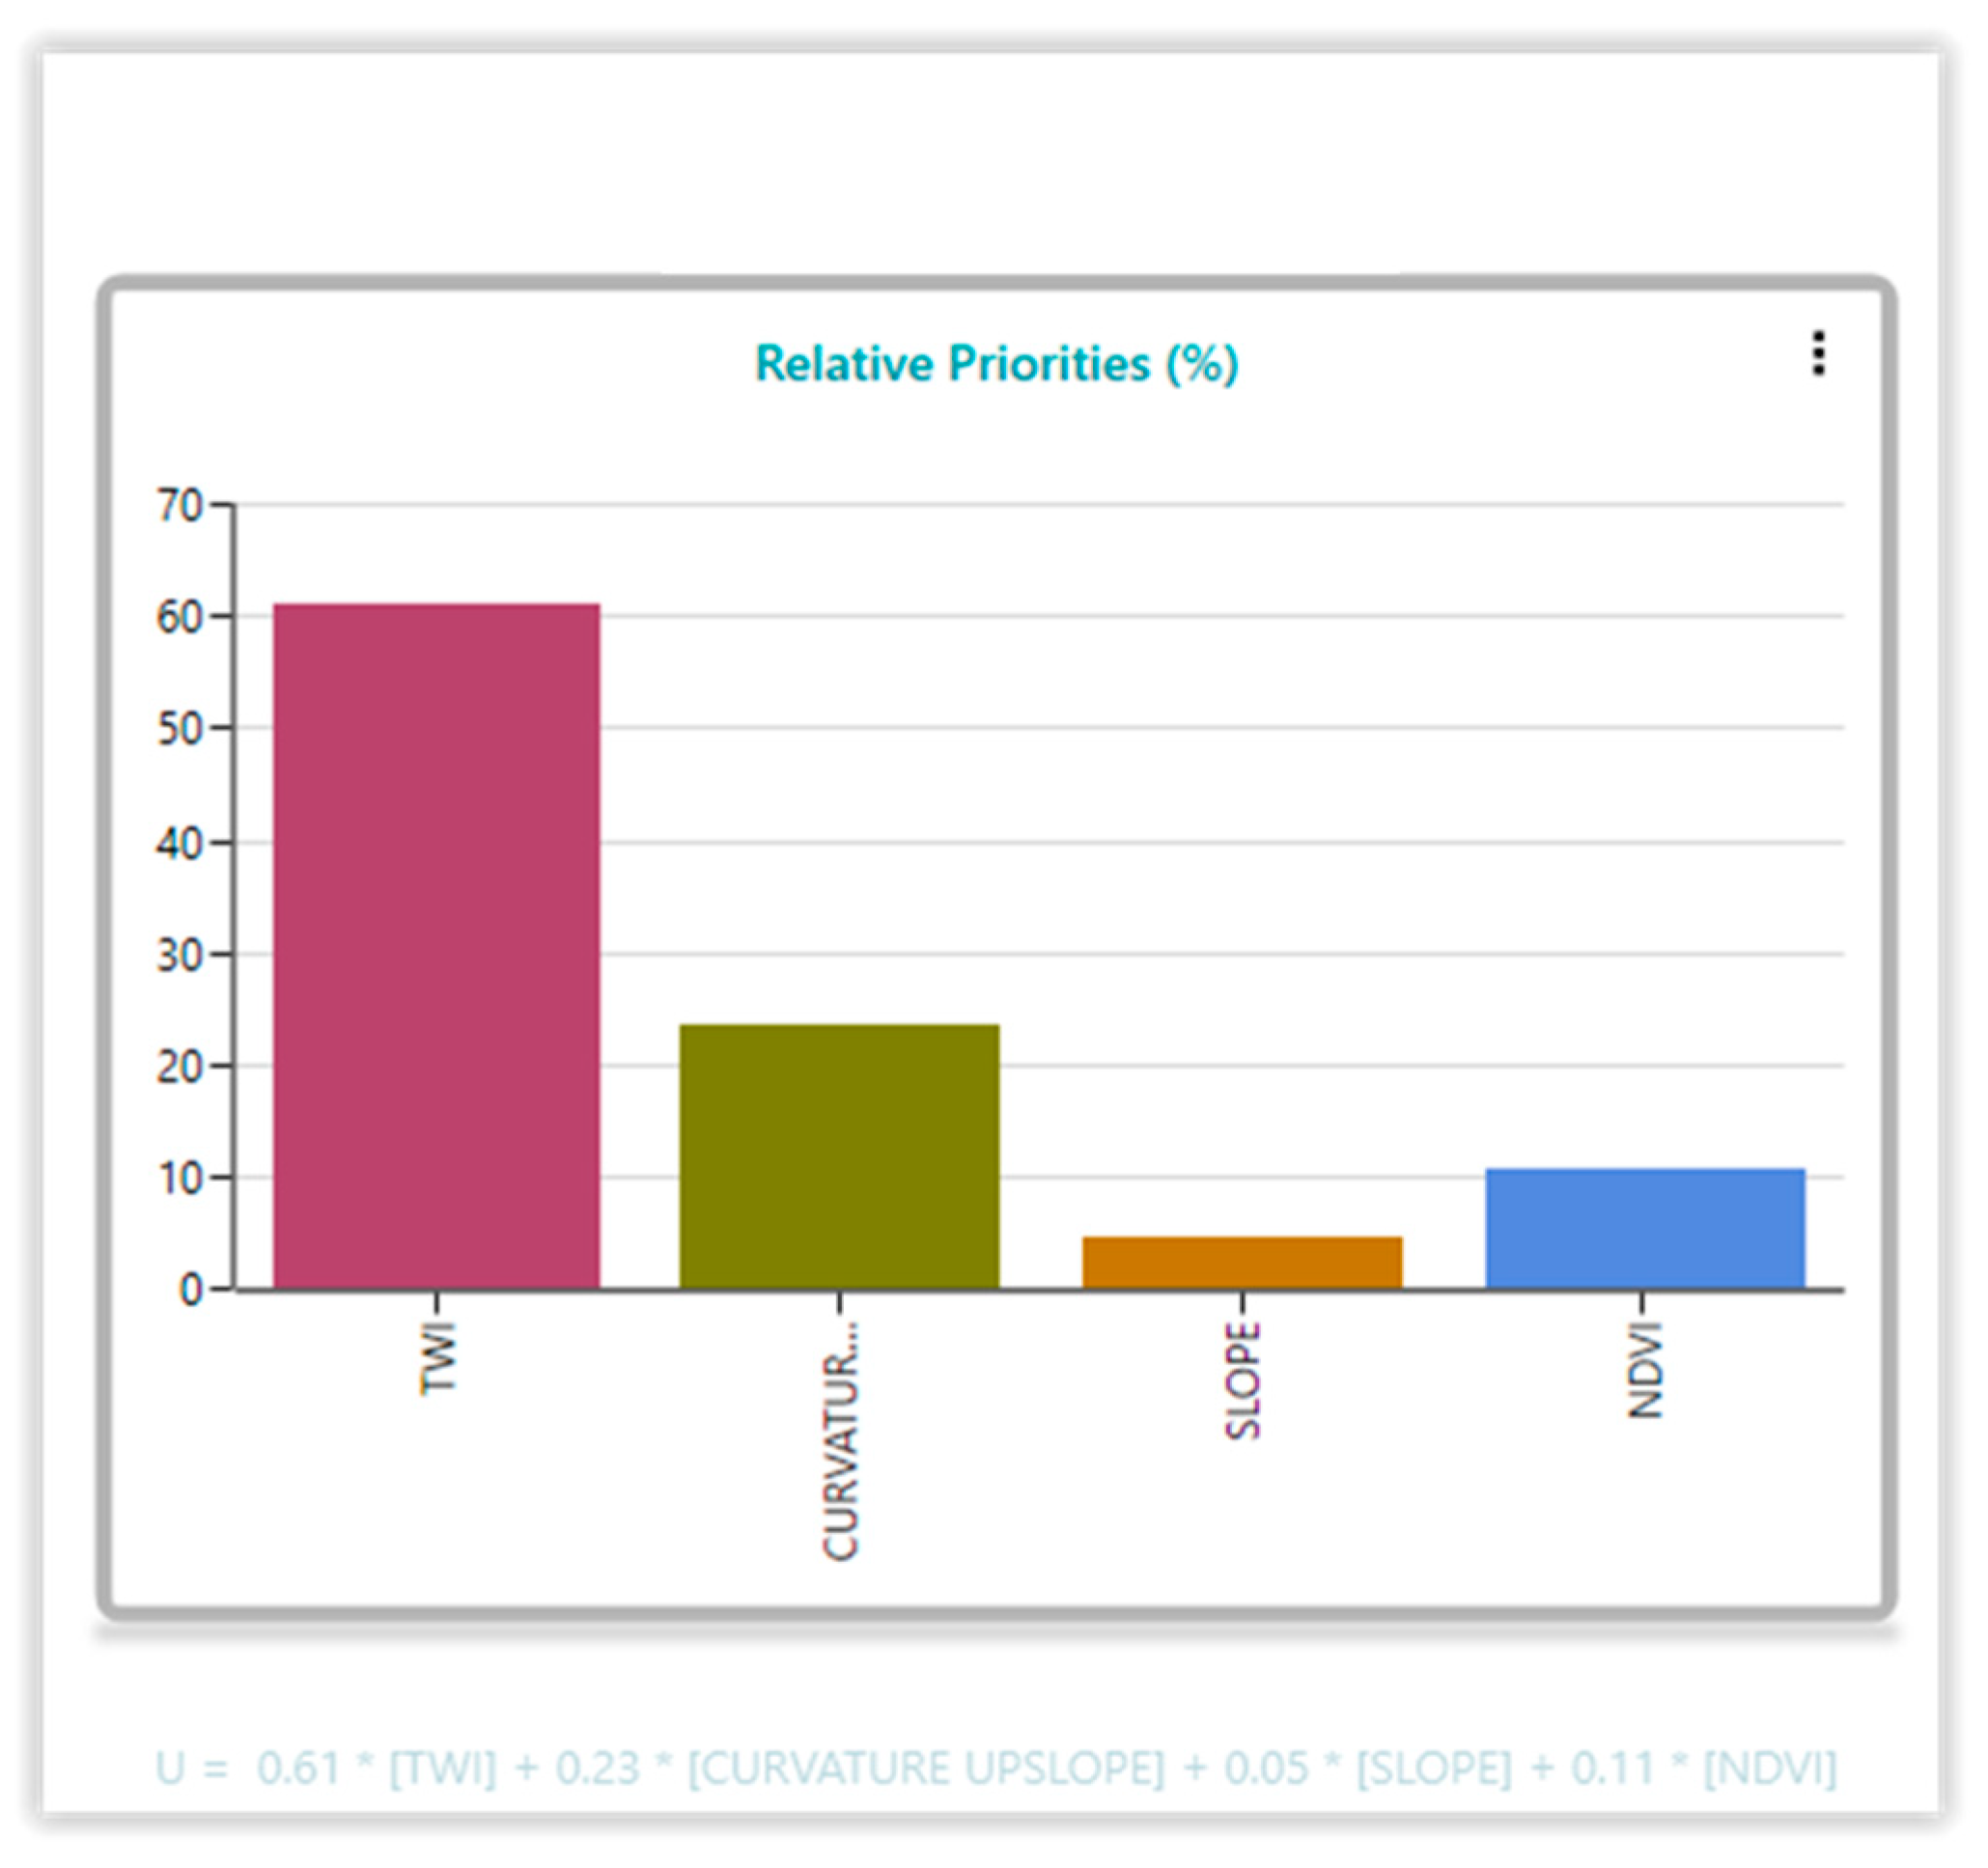
To evaluate moisture distribution and retention across the landscape, the Analytic Hierarchy Process (AHP) was applied using four key geospatial indicators: Topographic Wetness Index (TWI), curvature upslope, Normalized Difference Vegetation Index (NDVI), and slope. These factors were chosen for their influence on hydrological behavior—TWI captures areas of potential water accumulation, curvature upslope reflects terrain shapes that control flow convergence or divergence, NDVI indicates vegetation cover and transpiration capacity, and slope affects runoff velocity and infiltration potential. Through systematic pairwise comparisons, the relative contribution of each parameter to surface moisture was quantified. After validating consistency, the derived weights were integrated into a moisture index, highlighting zones of high, moderate, and low moisture availability essential for both ecological assessment and climate resilience planning (
Figure 16,
Figure 17 and
Figure 18).
Figure 12.
Curvature upslope hazard zone map.
Figure 12.
Curvature upslope hazard zone map.
Figure 13.
Relative priorities heat chart.
Figure 13.
Relative priorities heat chart.
Figure 14.
Heat matrix view.
Figure 14.
Heat matrix view.
Figure 16.
Relative priorities moisture chart.
Figure 16.
Relative priorities moisture chart.
Figure 17.
Moisture matrix view.
Figure 17.
Moisture matrix view.
Figure 18.
Moisture formula.
Figure 18.
Moisture formula.
3. Results
The application of the heat map reveals that while all urban areas in Athens experience elevated temperatures, certain zones exhibit significantly higher heat intensity (
Figure 19). The analysis reveals the presence of a substantial high-temperature zone in the vicinity of the city center, particularly in the area where the highway intersects perpendicularly with three major arteries that connect the western suburbs to the city center. This area has been observed to consistently exhibit some of the highest surface temperatures across the metropolitan region. The intense traffic flow along these thoroughfares, comprising tens of thousands of vehicles and trucks daily, results in the release of a substantial amount of emissions and heat, thereby significantly amplifying the urban heat island (UHI) effect.
In the northwest, high temperatures are concentrated in urban and industrialized zones near the foothills of Mount Parnitha, which was once a key cooling zone for the region. However, the area has been repeatedly affected by wildfires in recent years, resulting in the loss of forest cover and the deterioration of the surrounding microclimate. In the northeast, the area near Mount Penteli has also experienced devastating wildfires, some of which extended deep into the urban fabric, reaching residential neighborhoods.
The ongoing loss of vegetation, compounded by industrialization and urban expansion, has transformed these regions into persistent heat pockets. Collectively, these three areas significantly contribute to the sustained UHI phenomenon across the broader Athens metropolitan basin. Notably, the Ymittos Kaisariani forest stands as a notable exception, providing a significant cooling effect that moderates temperatures in surrounding areas, including Zografou, Ilisia, Kaisariani, Vyronas, Pangrati, and Mets. Despite remaining warmer than surrounding areas, these neighborhoods exhibit comparatively lower temperatures due to their proximity to green cover, thereby underscoring the pivotal role of urban forests in mitigating heat stress [
33,
34,
35].
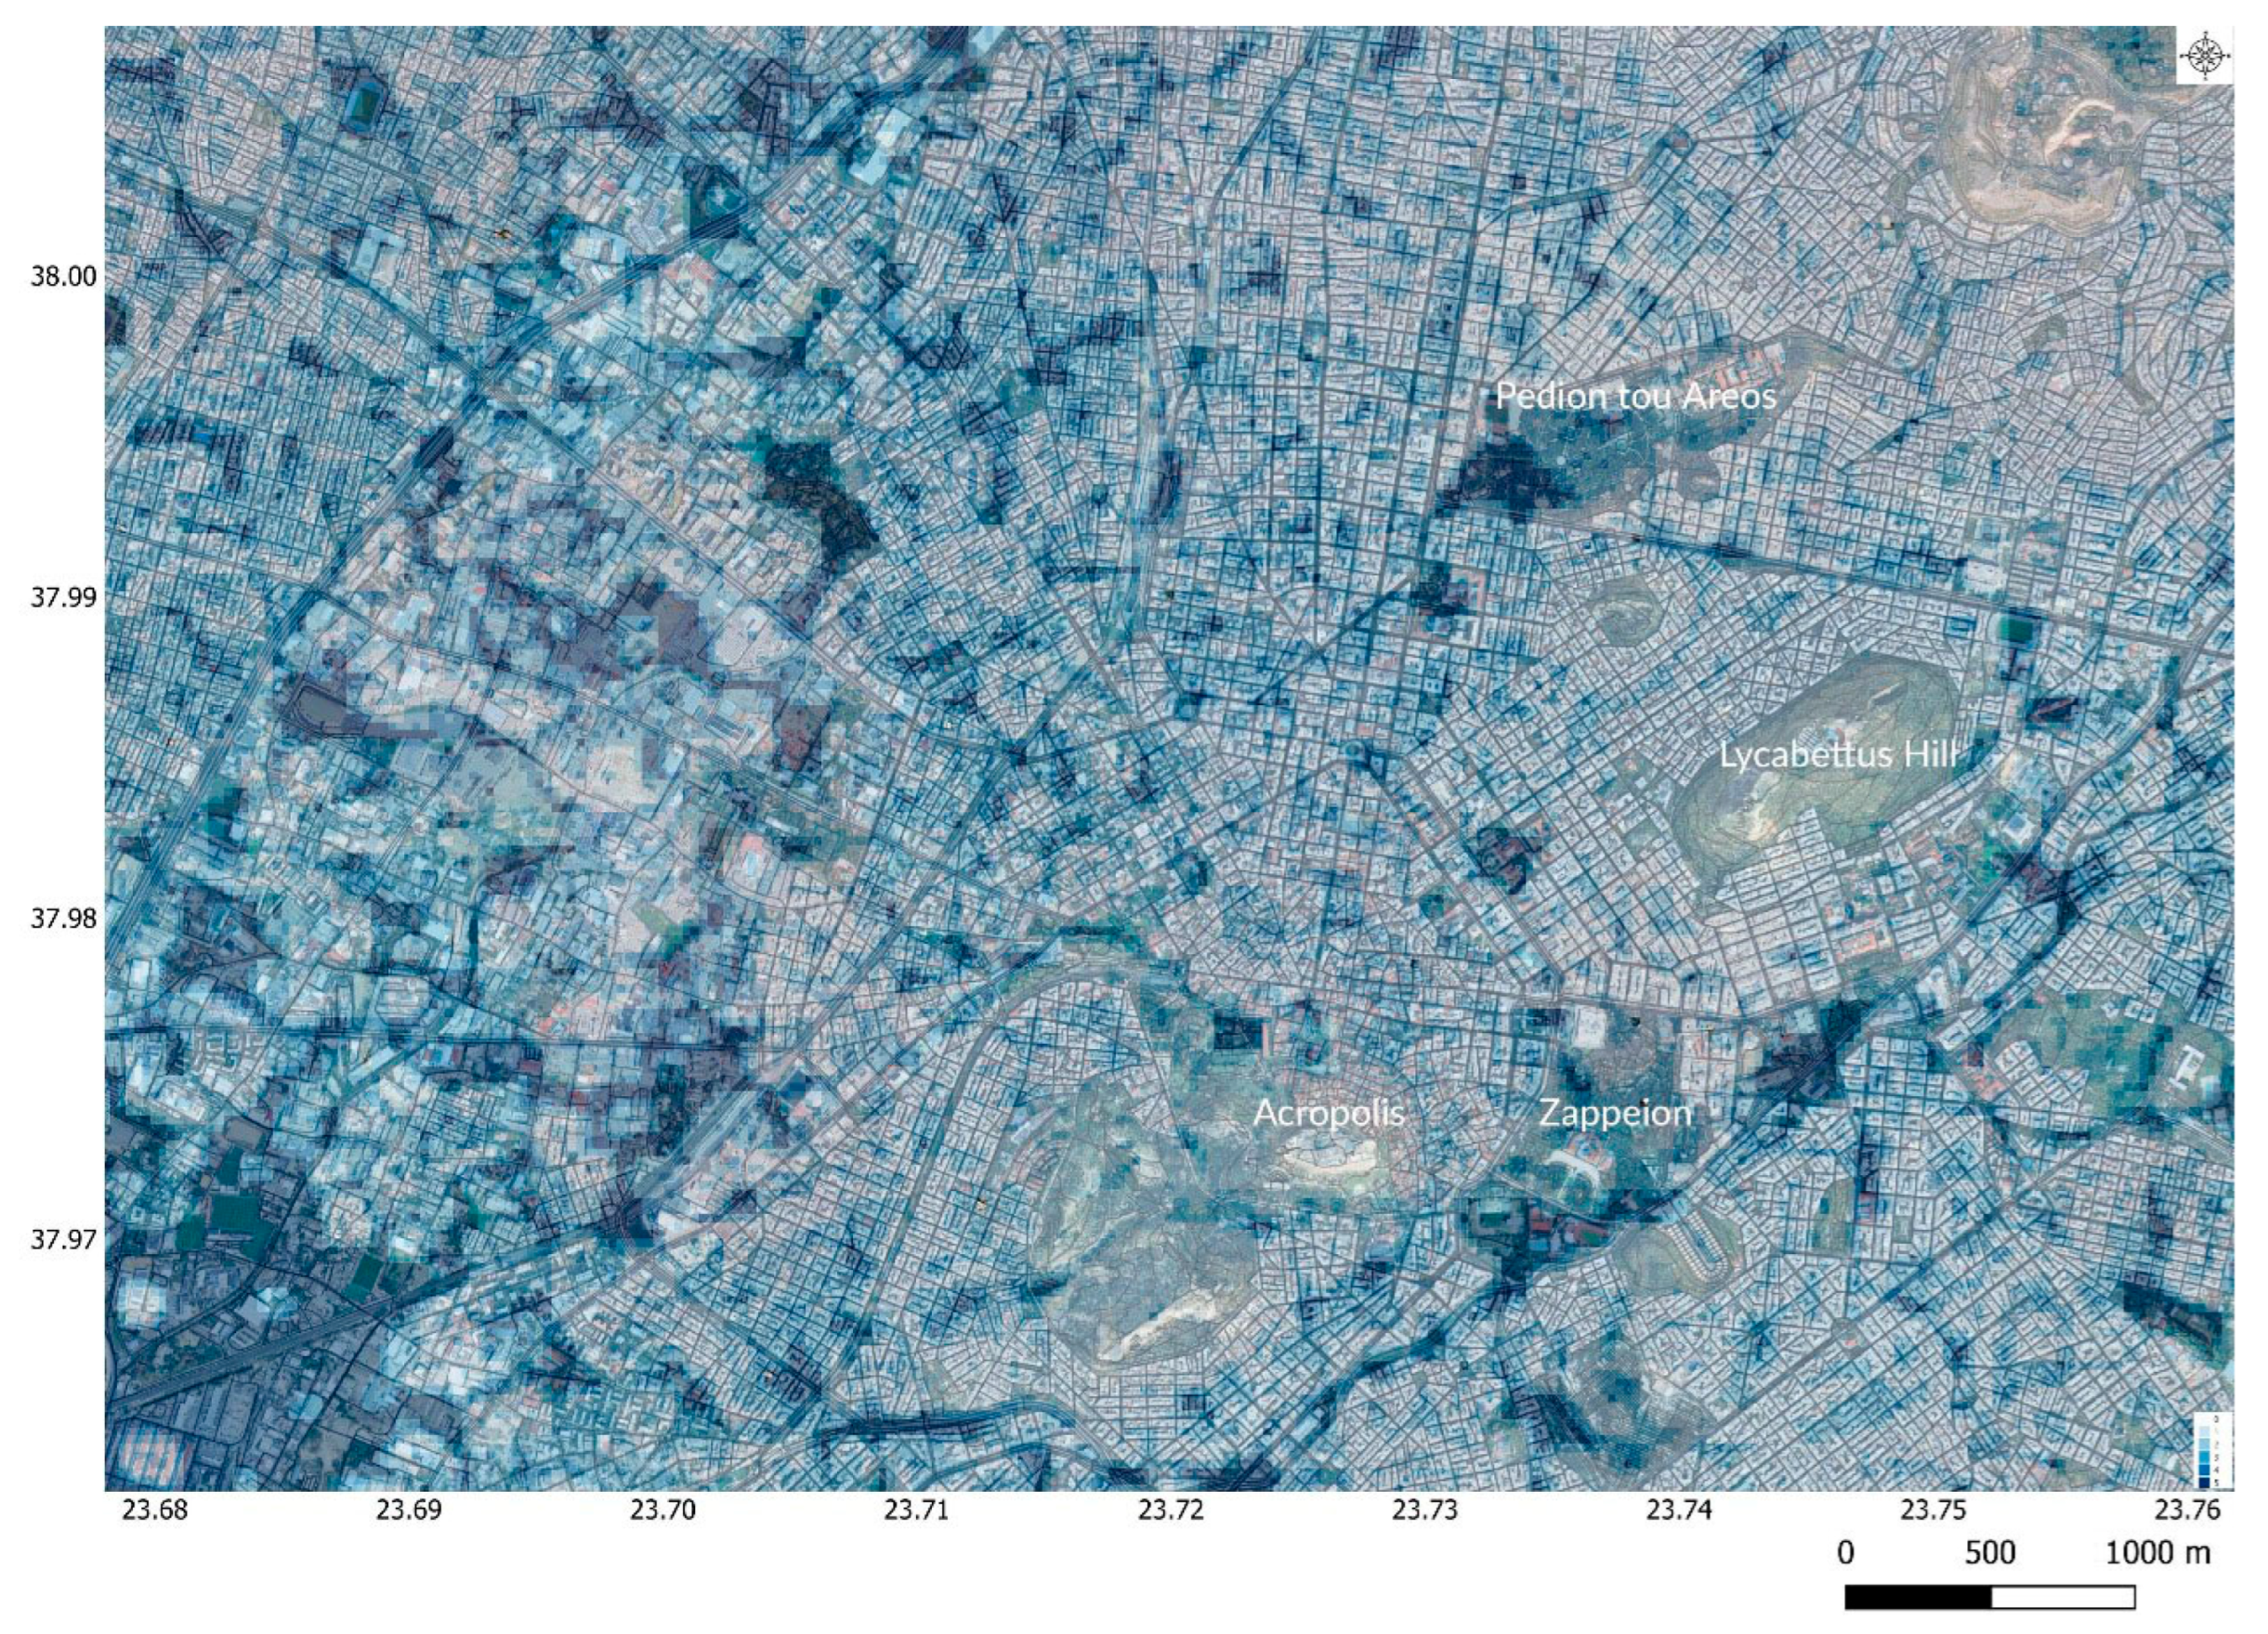
In the city of Athens, specific locales offer superior thermal conditions for individuals experiencing homelessness, thereby helping to mitigate extreme heat exposure (
Figure 20). Areas characterized by dense tree cover and natural airflow have been identified as critical urban refuges during heatwaves, offering essential relief from high temperatures.
Specifically, Zappeion, the southwestern slopes of the Acropolis, and the western side of Lycabettus Hill benefit from shade and air circulation, reducing heat stress compared to surrounding built-up areas. Additionally, Alsos Pagratiou, Alsos Ilision, and the University Campus in Kaisariani exhibit lower surface temperatures due to their proximity to green spaces and tree canopy coverage.
Pedion tou Areos, an urban park, functions as a heat-mitigating zone by providing vegetation and open spaces that help cool the surrounding environment. These findings underscore the pivotal function of urban greenery in mitigating extreme heat, particularly for vulnerable populations subjected to protracted outdoor conditions [
33,
34,
35].
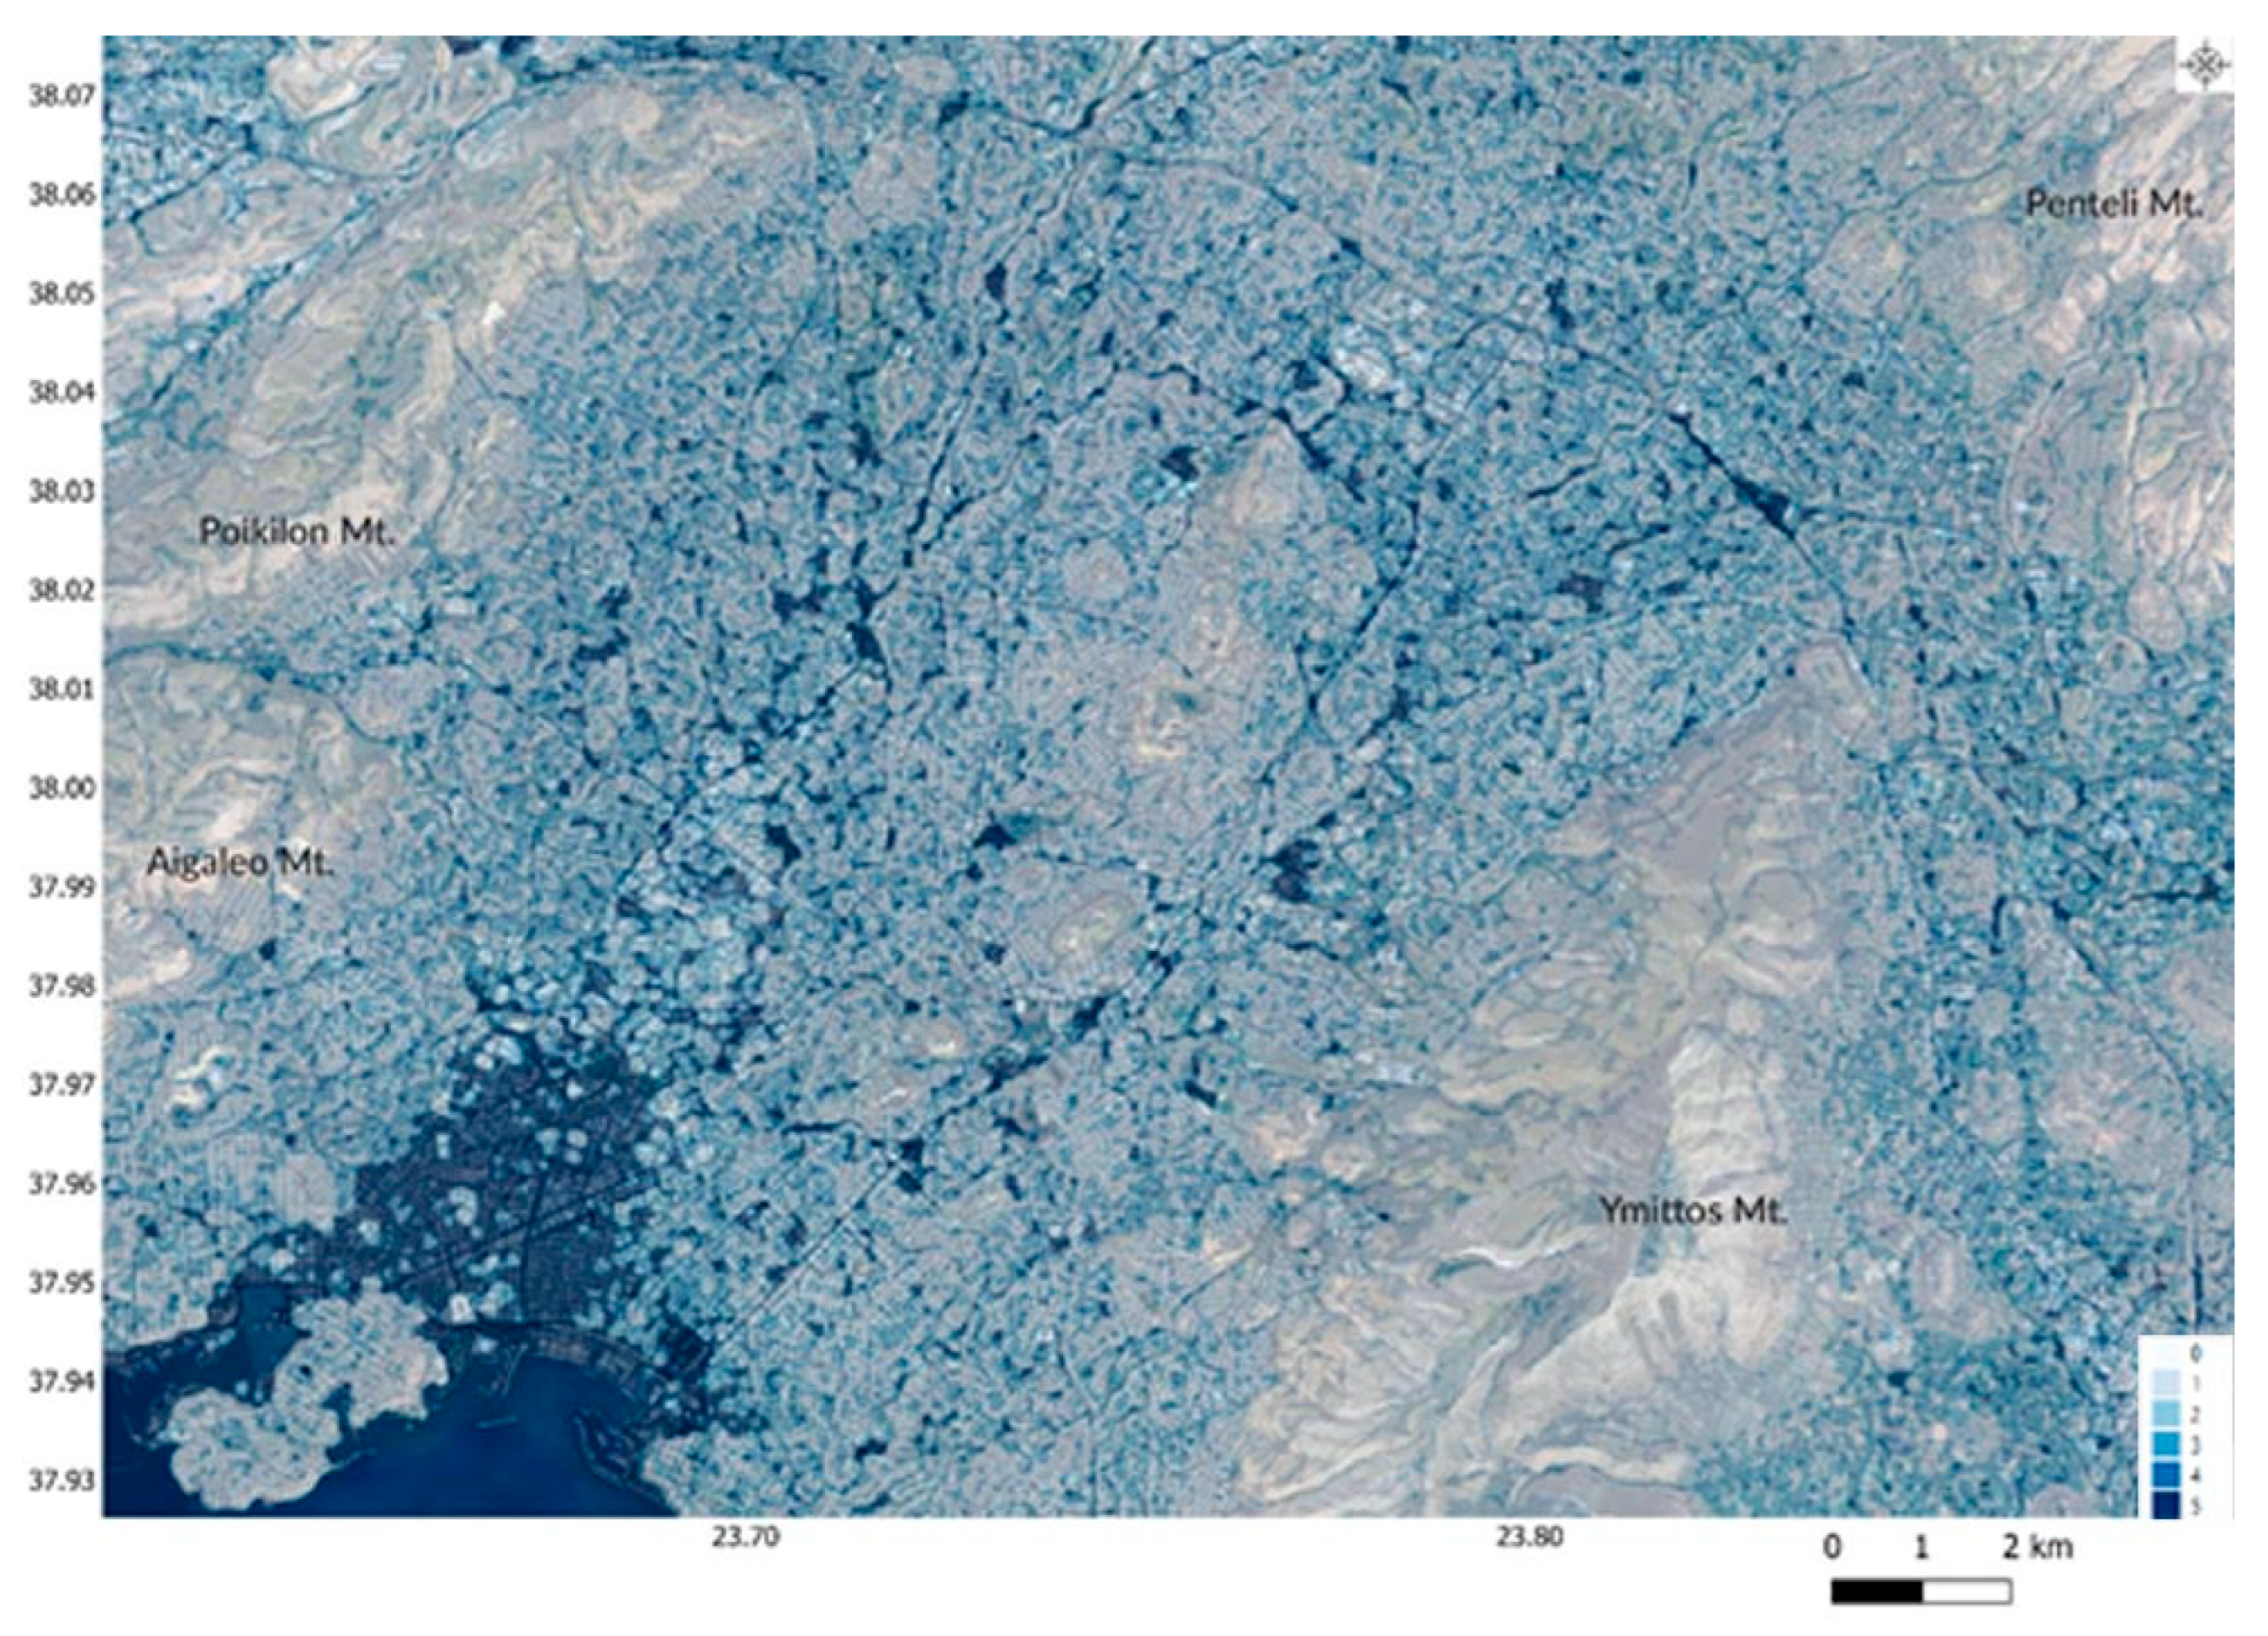
The moisture distribution map reveals two dominant hydrological pathways that have historically shaped the urban landscape of Athens (
Figure 21). These pathways correspond to the major river systems that once flowed through the city before extensive urbanization altered their courses.
The Western River System (Kifisos and Tributaries) originates from Mounts Parnitha, Penteli and this more expansive river system collects runoff from numerous smaller streams, thereby forming a substantial drainage network. It flows southward, reaching Moschato, where it historically contributed to the Piraeus delta, effectively making Piraeus appear like an island. Despite the current state of substantial coverage, the subsurface hydrology of the Western River System persists in exerting a notable influence on moisture retention, particularly in low-slope areas that are susceptible to water accumulation.
The Eastern River System, comprising the Ilissos and its tributaries, originates from Mount Penteli. This network follows a more constricted course, one that historically flowed along the present-day Syggrou Avenue, ultimately reaching the coastal area of Niarchos Park. While much of this river has been covered by subsequent deposits, its influence on urban moisture patterns remains, particularly where the natural course intersects with areas of low elevation (
Figure 22).
Furthermore, areas characterized by low slope gradients have been observed to foster the formation of natural depressions, which in turn act as moisture retention zones. These features are critical for comprehending localized humidity variations, the potential for groundwater recharge, and flood susceptibility (
Figure 23 and
Figure 24). The identification of these zones offers valuable insights for climate adaptation strategies, particularly in mitigating urban heat effects and managing stormwater retention in a rapidly densifying metropolitan environment [
30,
31,
32,
33,
34].
In terms of moisture conditions, elevated areas in Athens offer drier and healthier environments than low-lying, moisture-retaining zones. Notable locations such as Acropolis Hill, Pnyx, Philopappos, Strefi Hill, and Lycabettus demonstrate reduced moisture levels, which renders them less susceptible to humidity-related health concerns.
A detailed analysis of the moisture map reveals that many sites occupied by homeless individuals are situated within the deeper blue zones, indicating higher moisture accumulation. These areas are conducive to the proliferation of mold, bacteria, and other moisture-related health hazards, which can increase the risk of respiratory infections and other illnesses.
Consequently, the relocation of these populations to drier, elevated urban spaces could potentially enhance their living conditions, thereby reducing their exposure to the health threats associated with humidity [
30,
31,
32,
33,
34].
4. Model Application
In order to evaluate the predictive accuracy of the developed heat and moisture vulnerability models, a Receiver Operating Characteristic (ROC) analysis was performed, supplemented by field validation. The ROC curve evaluates model performance by comparing the True Positive Rate (sensitivity) to the False Positive Rate (specificity) across different classification thresholds. The area under the curve (AUC) metric was used to summarize the effectiveness of the models in distinguishing between high- and low-risk zones [
44,
45,
46].
Evaluation of the Relationship Between Environmental Risks and Locations of the Homeless Population
To assess the accuracy of the urban vulnerability models for extreme heat and moisture exposure, we evaluated the alignment between model-identified high-risk zones (classified as Classes 4 and 5) and documented locations of homeless populations. These locations were determined using data from municipal reports, NGO outreach efforts, and direct field observations.
A True Positive (TP) was defined as a high-risk area correctly predicted by the model that overlapped with a known homeless encampment or commonly used outdoor sleeping site. A False Positive (FP) referred to a model-identified high-risk area where no verified presence of homeless individuals was observed. True Negative (TN) and False Negative (FN) results represent areas accurately or inaccurately identified as low risk, respectively.
The True Positive Rate (TPR) and False Positive Rate (FPR) were then calculated using Equations (5) and (6), respectively:
This spatial validation approach allows an estimation of the model’s effectiveness in correctly identifying zones where vulnerable populations are most exposed to environmental risk.
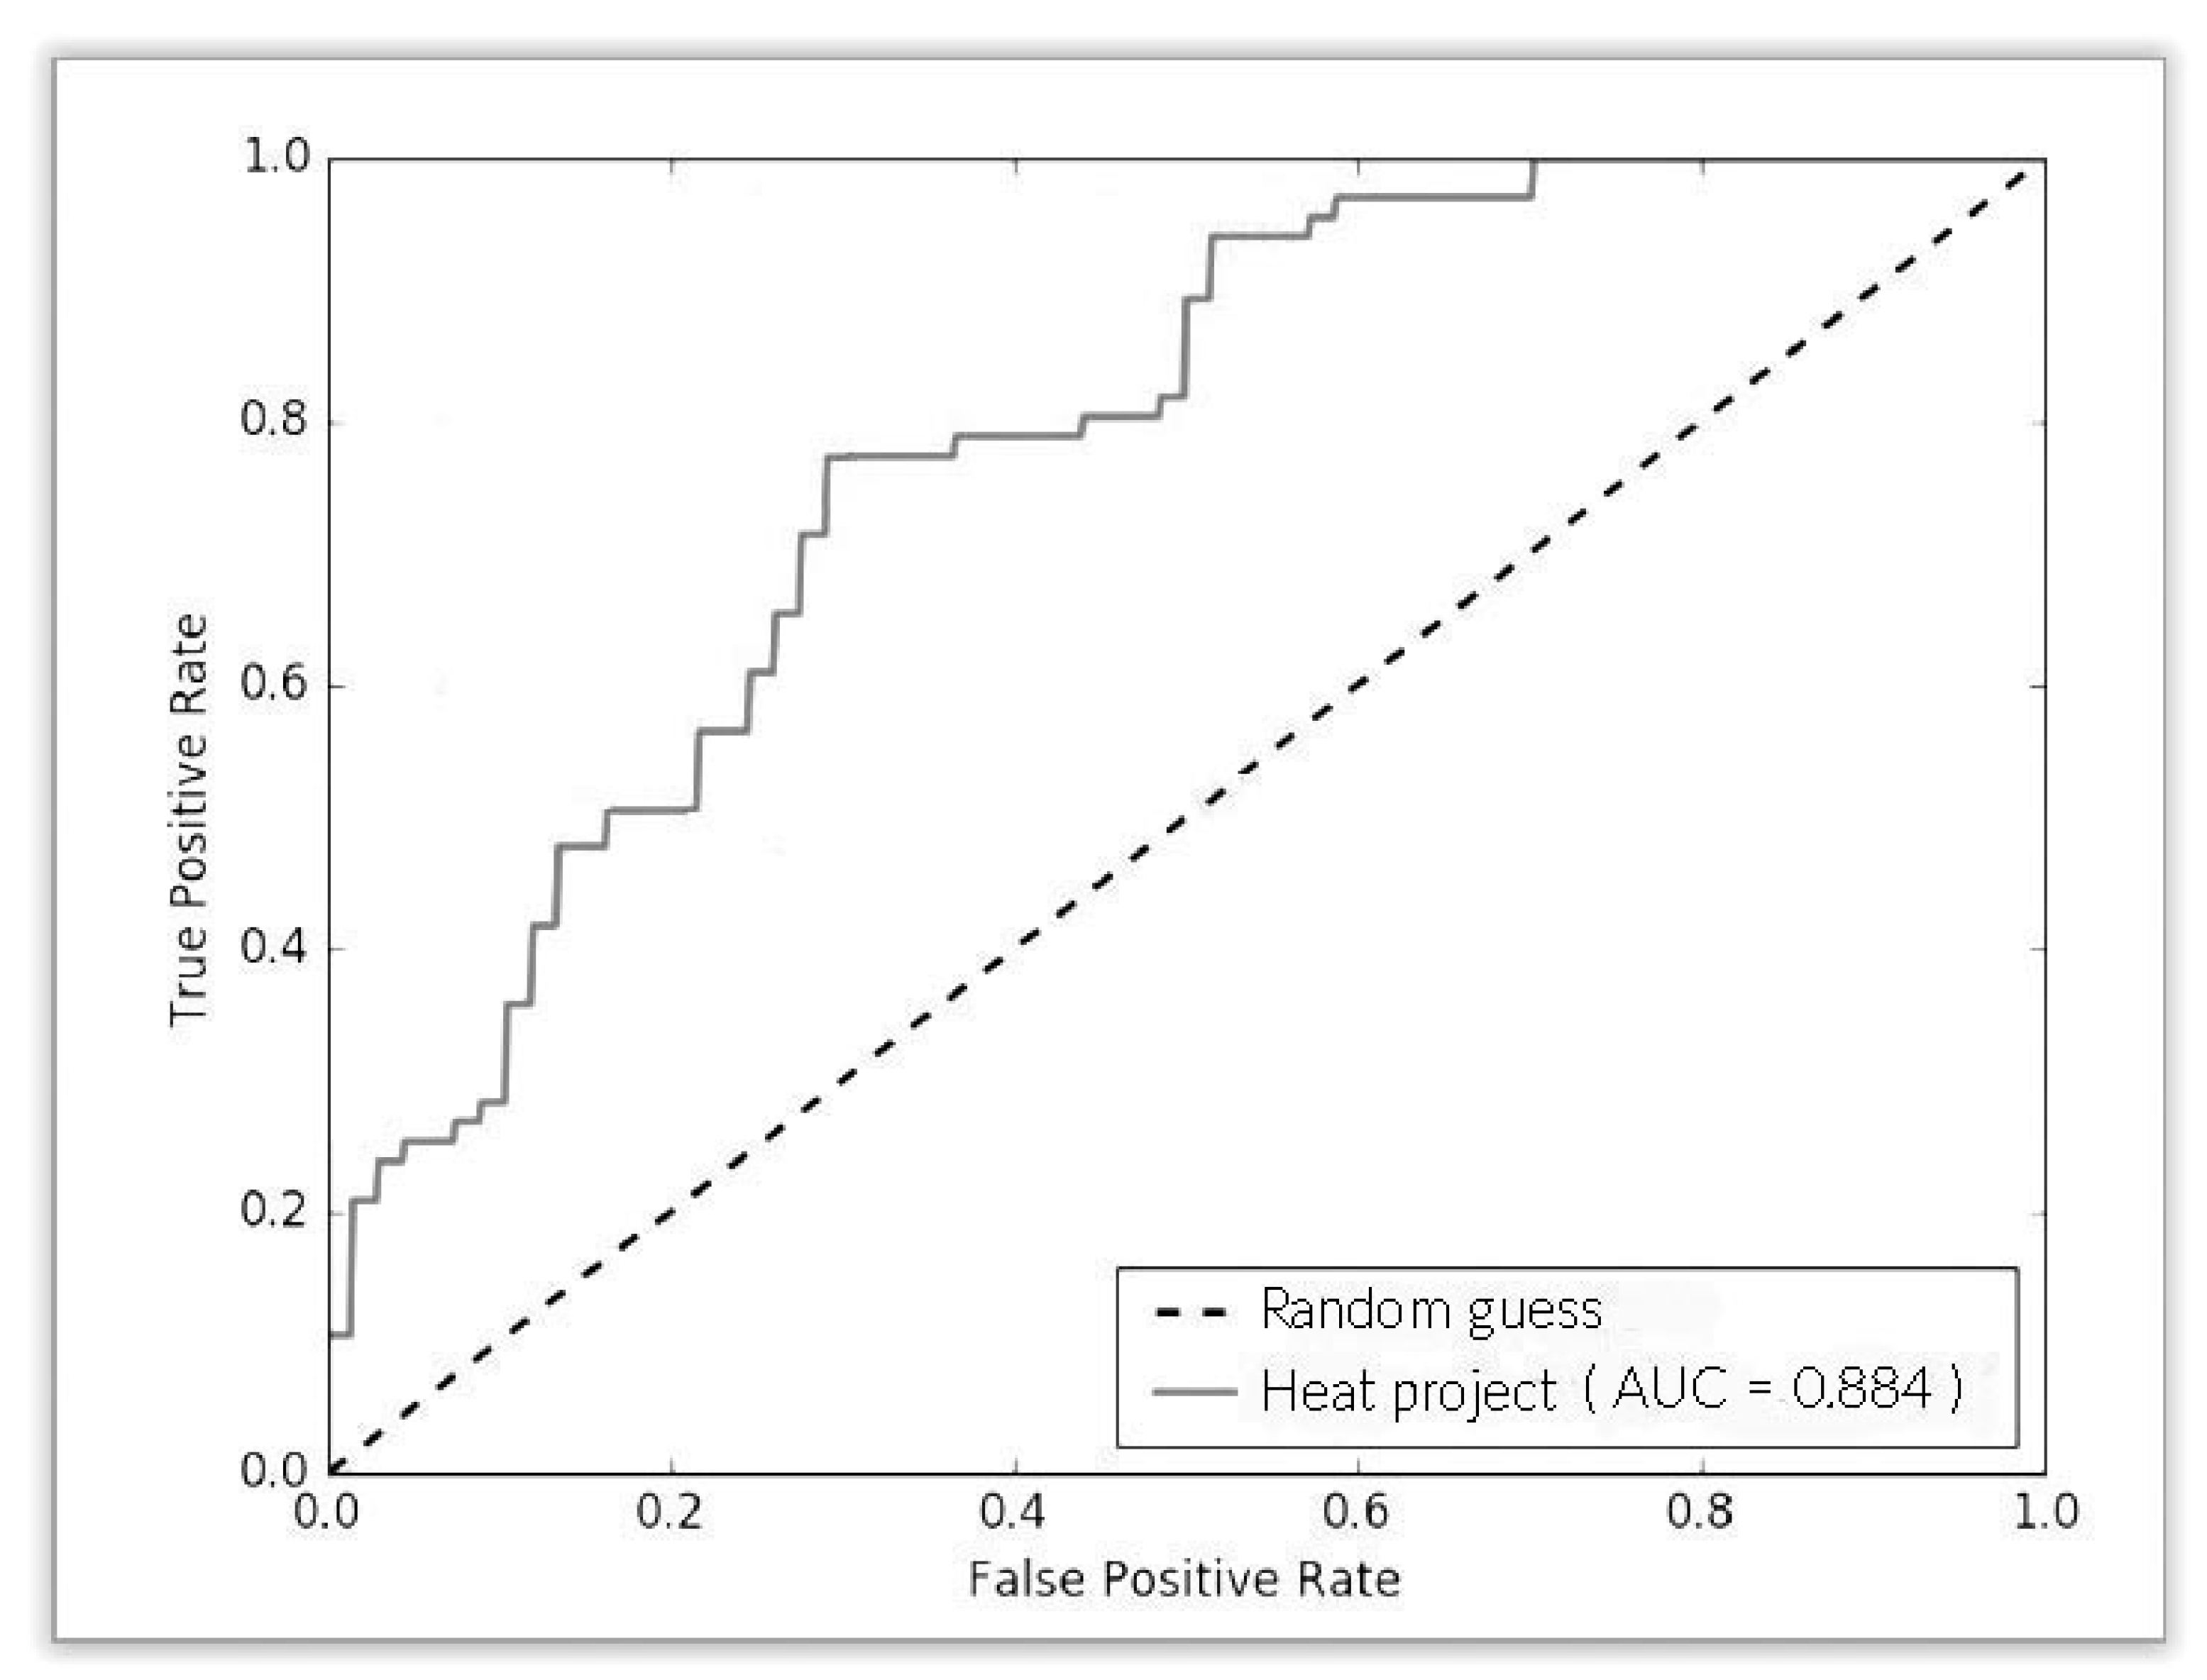
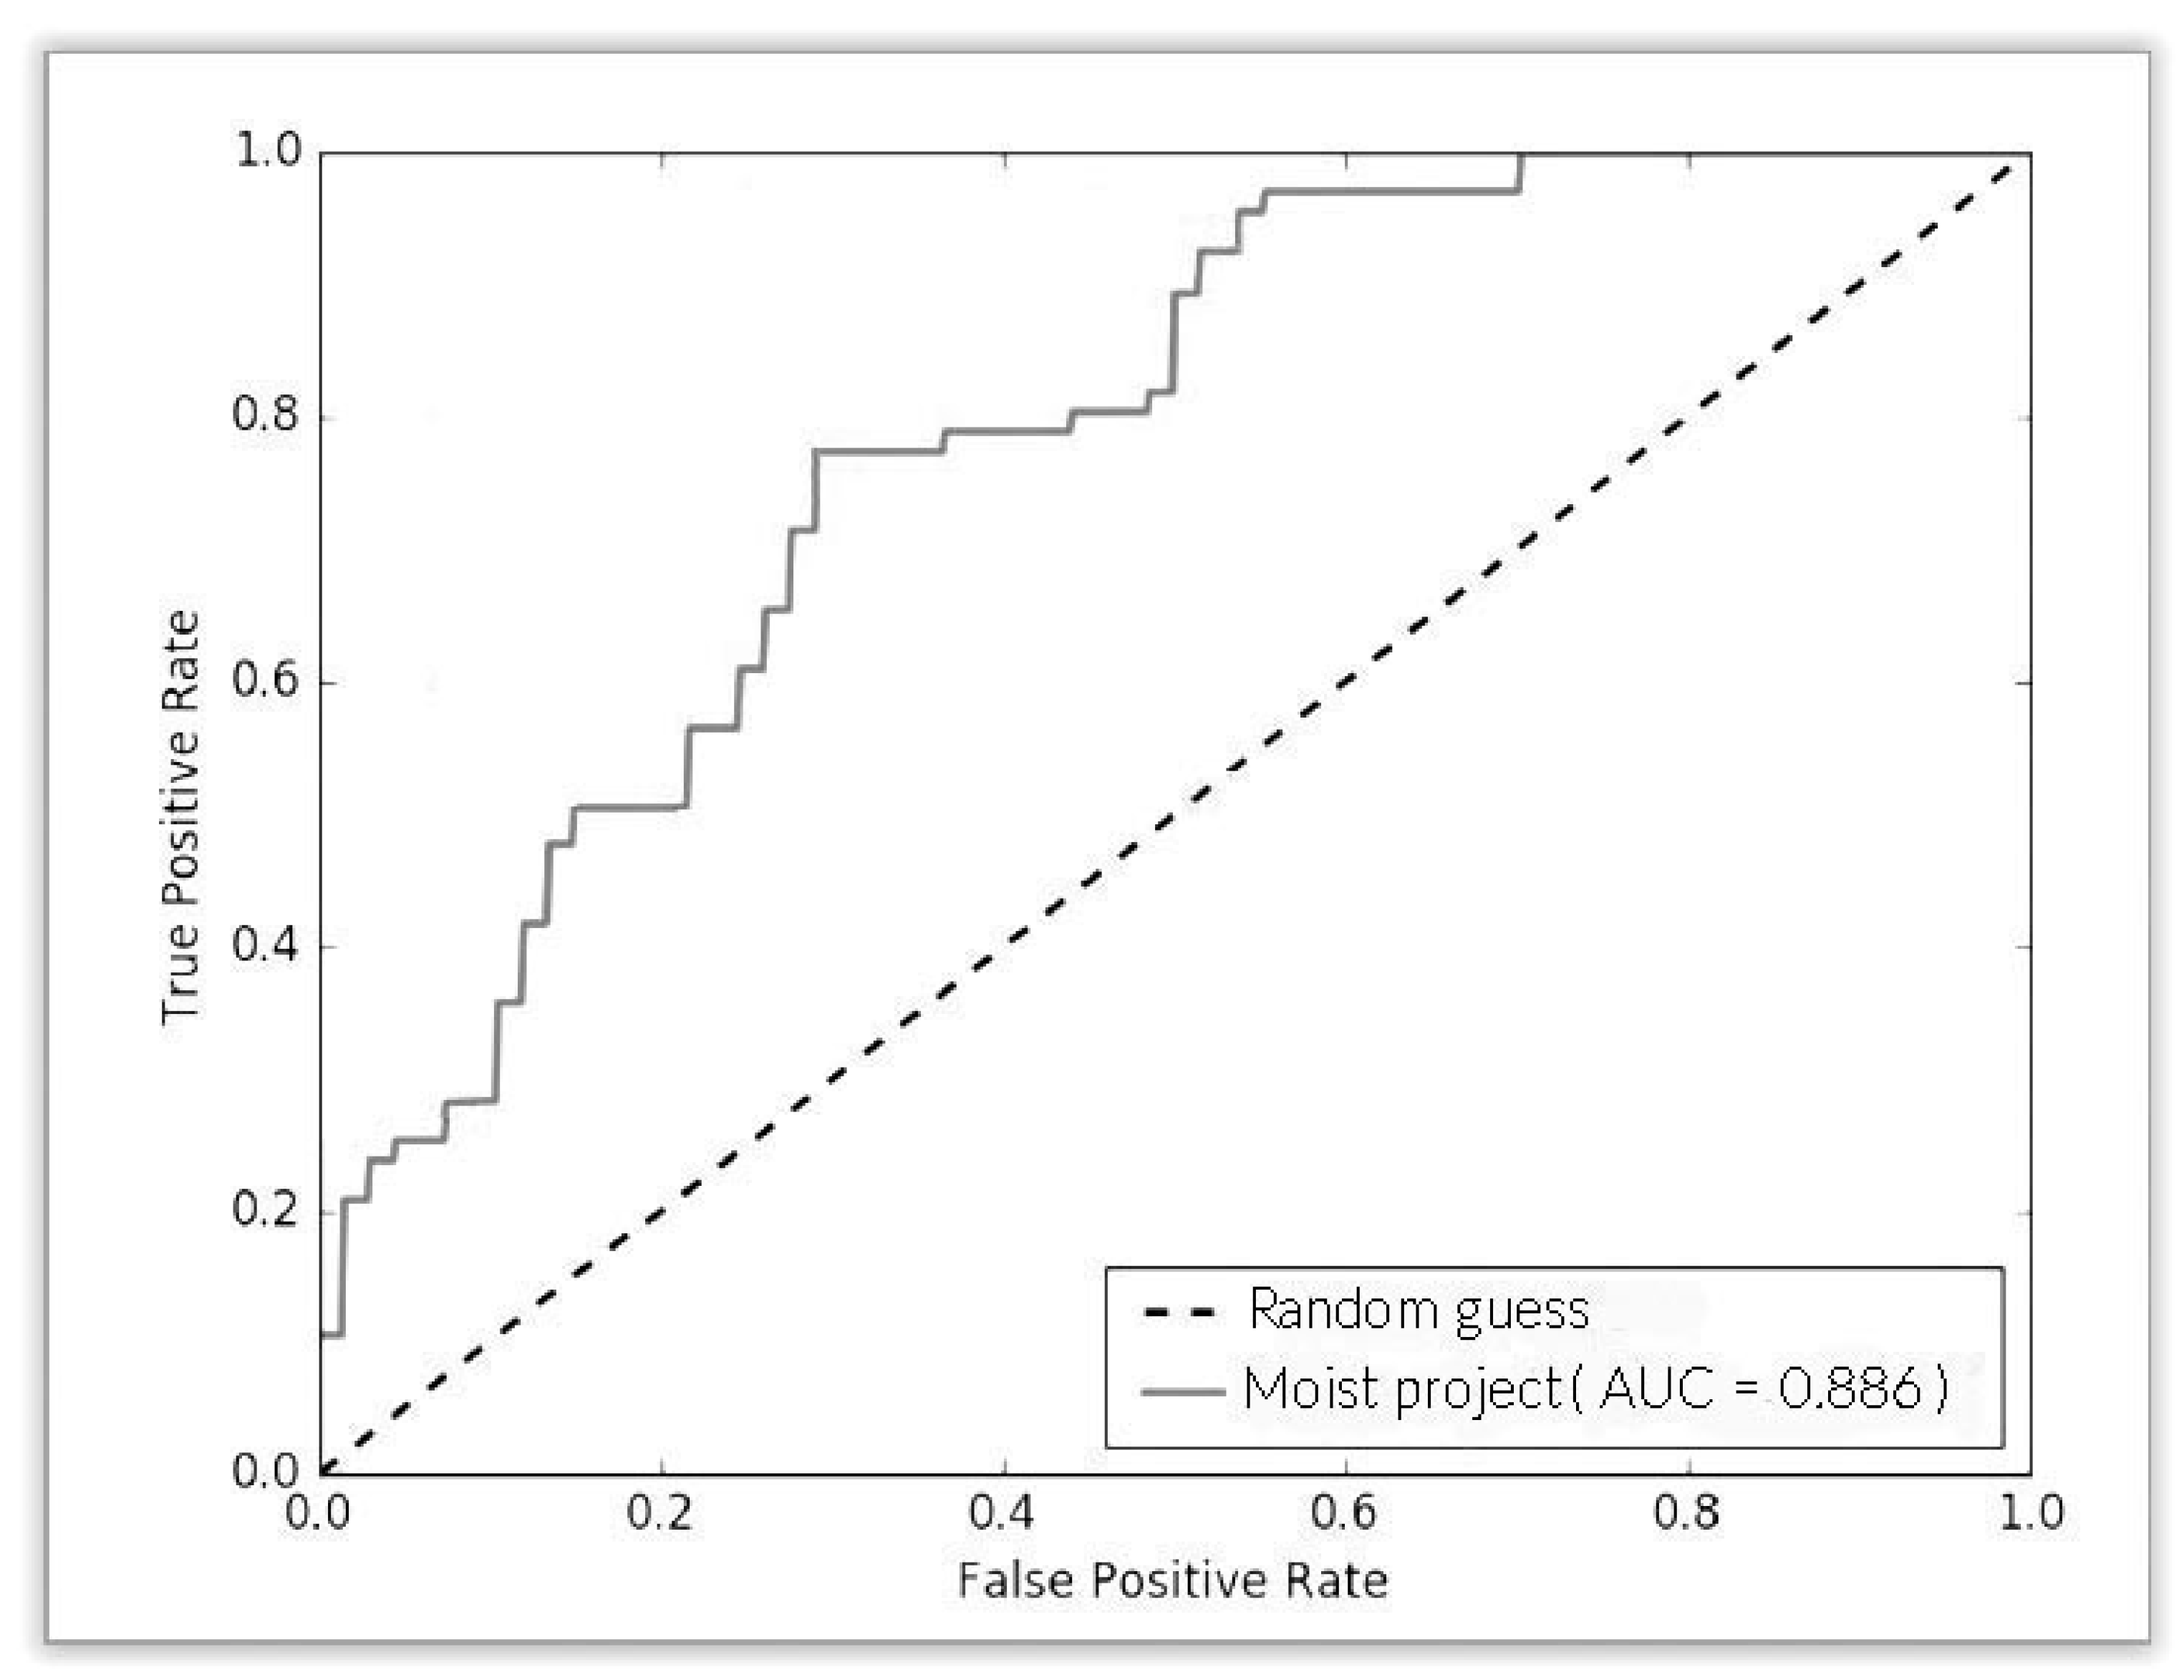
The ROC curve is a plot of TPR vs. FPR at various threshold settings (
Figure 25). Each point on the curve represents a (FPR, TPR) pair at a specific classification threshold. The AUC is a scalar value summarizing the performance of a classifier (as in Equation (7)):
The calculations were carried out within a GIS platform using the appropriate plugin [
39]. For the heat vulnerability model—constructed using LST, NDVI, NDBI, and slope data through AHP weighted overlay techniques—the ROC analysis yielded an AUC value of 0.884. This reflects a high predictive ability to detect zones of elevated thermal stress, as confirmed by in situ observations.
The moisture susceptibility model, which combines TWI, slope, NDVI, and upslope curvature (used exclusively for moisture assessment), achieved an AUC of 0.886 (
Figure 26). This indicates a high degree of accuracy in identifying moisture-prone areas, including zones of water accumulation and potential surface saturation—again verified by field inspection.
These ROC results, in agreement with ground observations, confirm that the models provide a reliable spatial representation of environmental stress zones, which is critical for informed urban planning and risk mitigation strategies [
47].
5. Discussion
The spatial analysis presented in this study underscores the pivotal function of heat and moisture indicators in delineating environmental vulnerability zones within urban landscapes, particularly for vulnerable populations such as the homeless. The utilization of indices such as Land Surface Temperature (LST), Normalized Difference Vegetation Index (NDVI), and Normalized Difference Built-Up Index (NDBI), in conjunction with terrain-derived variables like slope, TWI, and curvature, facilitated a multi-criteria assessment of urban microclimates.
The findings indicate a discernible correlation between regions of substantial urbanization and impervious surface cover (elevated NDBI values) with extreme heat zones, concomitant with diminished NDVI and TWI values, signifying reduced vegetation and diminished moisture retention. These results are consistent with previous studies linking built-up environments to the urban heat island effect and decreased evapotranspiration capacity [
48].
A notable finding of this study is the correlation between areas with strongly concave terrain and high TWI values with moisture accumulation zones. These zones, while potentially reducing temperatures, could increase vulnerability to flooding or damp exposure for individuals residing outdoors or in informal shelters. This duality of risk—excessive heat in dense urban cores and moisture exposure in poorly drained, low-lying areas —reinforces the importance of localized environmental planning and targeted interventions [
49,
50].
The demographic analysis further emphasizes that homeless populations are often situated in both central urban zones and marginal, unprotected landscapes, placing them at risk from multiple environmental stressors. In Athens, Thessaloniki, and Heraklion, for instance, 691 individuals are living on the streets, with many having been exposed for extended periods, ranging from months to years. This situation underscores the urgency of addressing the health implications, which are both grave and immediate.
From a methodological perspective, the integration of terrain data with remote sensing indices has proven to be a highly effective approach for identifying and mapping hazard zones. This finding lends support to the hypothesis that a geospatial, multi-criteria approach can provide municipalities with valuable tools for climate adaptation and social planning.
Future research endeavors should prioritize the incorporation of dynamic climate data, such as seasonal LST variations and precipitation events, to enhance the temporal resolution of vulnerability assessments. In parallel, the integration of socioeconomic variables—including mobility patterns and access to essential services—will allow for a more nuanced depiction of exposure and adaptive capacity. Additionally, validation of spatial models through comparison with ground-based meteorological and hydrological observations will be pursued in future studies, offering greater methodological rigor and accuracy. Finally, linking geospatial outputs with public health datasets could provide a more comprehensive and actionable understanding of environmental vulnerability in complex urban settings [
51].
5.1. Spatial Overlap with Vulnerable Populations
Athens has various support structures for the homeless, including day centers, food centers, and multipurpose centers. The city has social housing programs aimed at preventing and combating housing exclusion.
The ACCMR Homeless Day Shelter Center provides services such as food, cleaning, and psychological support. It operates daily in the Metaxourgeio area [
52].
The Reception and Solidarity Center of the Municipality of Athens distributes about 900–1000 full meals daily to the homeless and the needy. It also includes the Multipurpose Homeless Center, which can accommodate up to 400 people [
51].
The Ministry of Labor and Social Security offers programs such as the Social Housing Pilot Program, which aims to prevent and combat housing exclusion of vulnerable groups by utilizing unused private and public housing stock, and also the Housing and Work for the Homeless Program, which covers the cost of renting an apartment for three years, as well as repair costs [
53].
Despite the state’s active involvement in addressing homelessness, the present research acknowledges the absence of publicly available, geographically referenced datasets detailing the distribution of homelessness in Athens in real time. Nonetheless, existing literature and reports indicate that homelessness in Athens is predominantly concentrated in specific urban districts. Estimates suggest that between 1200 and 2360 individuals experience street homelessness in Athens and Piraeus, based on reports from street workers and day center registers. Notably, areas such as Omonia Square, Victoria Square, and the Exarcheia district are frequently identified as hotspots for homeless populations, including refugees and migrants residing in informal accommodations or squats [
54,
55,
56].
The objective of this study is not to map the precise locations of individuals experiencing homelessness; rather, it seeks to identify zones of environmental vulnerability. Such zones include areas characterized by extreme heat or moisture, which frequently intersect with known urban hotspots. This approach establishes a foundation for targeted interventions and policy actions in areas where social and environmental risks overlap, utilizing a proxy-based methodology. In the future, research in this field could benefit from collaborations with local authorities and non-governmental organizations (NGOs). Such collaborations would allow for the procurement of anonymized geospatial data, enhancing the precision of spatial analyses and informing more effective intervention strategies.
5.2. Transferability of the Methodology to Other Mediterranean Urban Areas
The geospatial methodology developed in this study—combining satellite-derived indices (LST, NDVI, and NDBI), topographic variables (TWI, slope, and curvature), and the Analytical Hierarchy Process (AHP)—is designed to be reproducible and adaptable to other urban environments in the Mediterranean. The use of globally accessible datasets such as Landsat 8 and SRTM or ALOS DEMs facilitates application beyond the Athens Metropolitan Area.
A city such as Nicosia, the capital of Cyprus, presents a suitable candidate for the replication of this framework due to its semi-arid Mediterranean climate, compact urban form, and growing environmental stressors, such as extreme heat, urban densification, and limited green cover. Both Athens and Nicosia experience similar challenges related to the Urban Heat Island effect, fragmented green spaces, and socio-economic disparities that leave certain populations—such as the homeless—particularly exposed.
However, transferability is not without limitations. Each urban area presents unique morphological, socio-economic, and policy contexts. For instance, differences in surface materials, housing density, and vegetative composition may require recalibration of index thresholds or AHP weights. Additionally, the absence or scarcity of spatially explicit data on homeless populations in many cities can limit targeted intervention planning.
Nonetheless, the modular structure of the model and its reliance on open-access datasets make it a robust starting point for other Mediterranean cities aiming to assess and map climate vulnerability. With context-specific adaptations, the proposed approach can provide valuable insights for urban planning and resilience strategies across southern Europe and comparable regions.
5.3. Practical Implementation for Policy and Planning
The results of this research provide a spatially explicit framework that can directly inform public policy and urban planning in Athens. Compared to previous research that tended to isolate either heat or moisture risk, this study presents an integrated spatial approach that captures both phenomena simultaneously. By incorporating curvature along with TWI, slope, and vegetation metrics, the model improves the identification of moisture pooling areas. Moreover, the inclusion of vulnerable populations—especially homeless groups—provides socially meaningful insights often lacking in hazard mapping. This geospatially reproducible approach is particularly valuable for Mediterranean urban environments and can inform targeted mitigation strategies through municipal planning.
The heat and moisture vulnerability maps can serve as decision-support tools for municipal authorities, enabling them to prioritize interventions in high-risk zones. For example, areas identified with elevated heat exposure could be targeted for urban greening programs, the installation of reflective surfaces, or the development of shaded public spaces. Moisture accumulation zones, particularly those overlapping with impervious surfaces, can inform upgrades to drainage infrastructure and storm water management systems. Furthermore, integrating these maps into municipal GIS platforms allows social services and public health agencies to coordinate targeted outreach to vulnerable populations, such as people experiencing homelessness, especially during extreme weather events. This application of geospatial analysis supports evidence-based, equity-centered planning under current and future climate conditions.
The spatial outputs of this study can serve as evidence-based tools to inform climate adaptation strategies and urban planning within the Athens metropolitan area. Municipal bodies such as Municipality of Athens, the Region of Attica, and the Ministry of Climate Crisis and Civil Protection could utilize the heat and moisture vulnerability maps to prioritize targeted interventions in high-risk zones. For instance, neighborhoods with severe heat exposure—characterized by dense built-up areas and minimal vegetation—can be prioritized for urban greening programs (e.g., green roofs and tree planting) or reflective infrastructure. Likewise, areas identified as moisture accumulation zones, particularly in low-lying urban sectors with poor drainage, could inform updates to flood protection measures under the city’s sustainable urban mobility plan or civil protection strategies. Furthermore, integration of these maps within municipal GIS platforms would support the efforts of social services and NGOs in implementing targeted outreach to vulnerable populations, including the unhoused, particularly during heat waves and heavy rainfall events. By aligning spatial vulnerability data with on-the-ground action, the methodology supports Athens’ broader resilience goals under climate stress.
6. Conclusions
This research presents a geospatially integrated approach for identifying extreme heat and moisture zones in urban environments using multi-criteria decision analysis (MCDA) through the Analytic Hierarchy Process (AHP). The methodology integrates remote sensing indicators and topographic variables to model environmental vulnerability, with a particular focus on populations at risk, particularly those experiencing homelessness.
The heat exposure model incorporates Land Surface Temperature (LST), Normalized Difference Vegetation Index (NDVI), Normalized Difference Built-up Index (NDBI), and slope. The findings indicate that regions characterized by minimal vegetation cover, substantial urbanization, and relatively flat terrain are particularly susceptible to heat accumulation, a phenomenon that aligns with the documented urban heat island effect.
Conversely, the moisture accumulation model incorporated the Topographic Wetness Index (TWI), slope, NDVI, and curvature upslope, which was used exclusively to capture terrain-driven flow accumulation behavior. The identification of moisture-prone zones was facilitated by the analysis of concave landforms and low-slope areas where runoff converges. This finding indicates a heightened susceptibility to waterlogging and potential flooding during periods of heavy rainfall [
54,
56].
The integration of satellite-derived and terrain-based parameters within a Geographic Information System (GIS) environment provides a scalable and reproducible approach to assess microclimatic and hydrological risk. These spatial risk models can support evidence-based decision-making by municipalities and civil protection agencies in designing targeted interventions, such as green infrastructure for cooling or drainage systems for moisture mitigation, especially in neighborhoods with high concentrations of vulnerable groups.
Finally, while this study focuses on the Athens Metropolitan Area, the methodology is designed to be transferable to other Mediterranean cities facing similar climate-related stressors. Urban areas, such as Nicosia in Cyprus Island, that share comparable climatic, morphological, and socio-economic characteristics can adopt and adapt this approach to identify zones of environmental vulnerability. With appropriate calibration and local data integration, this framework holds potential for broader regional applications in climate-resilient urban planning [
51,
56].
