Article

Street View-Enabled Explainable Machine Learning for Spatial Optimization of Non-Motorized Transportation-Oriented Urban Design

1
School of Spatial Planning and Design, Hangzhou City University, Hangzhou 310015, China
2
State Key Laboratory of Remote Sensing and Digital Earth, Aerospace Information Research Institute, Chinese Academy of Sciences, Beijing 100101, China
3
University of Chinese Academy of Sciences, Beijing 101408, China
4
Department of Regional and Urban Planning, College of Civil Engineering and Architecture, Zhejiang University, Hangzhou 310058, China
*
Author to whom correspondence should be addressed.
Land 2025, 14(7), 1347; https://doi.org/10.3390/land14071347
Submission received: 13 May 2025 / Revised: 17 June 2025 / Accepted: 23 June 2025 / Published: 25 June 2025
(This article belongs to the Special Issue Territorial Space and Transportation Coordinated Development)

Abstract

To advance evidence-based urban design prioritizing non-motorized mobility, this study proposes a street view-enabled explainable machine learning framework that systematically links built environment semantics to non-motorized transportation vitality optimization. By integrating Baidu Street View images with deep learning-based object detection (Faster R-CNN), we quantify fine-grained human-powered and mechanically assisted mobility vitality. These features are fused with multi-source geospatial data encompassing 23 built environment variables into an interpretable machine learning pipeline using SHAP-optimized random forest models. The key findings reveal distinct nonlinear response patterns between HP and MA modes to built environment factors; for instance, a notable promotion in mechanically assisted NMT vitality is observed as enterprise density increases beyond 0.2 facilities per ha. Emergent synergistic and threshold effects are evident from variable interactions requiring multidimensional planning consideration, as demonstrated in phenomena such as the peaking of human-powered NMT vitality occurring at public facility densities of 0.2–0.8 facilities per ha, enterprise densities of 0.6–1 facilities per ha, and spatial heterogeneity patterns identified through Bivariate Local Moran’s I clustering. This research contributes an innovative technical framework combining street view image recognition with explainable AI, while practically informing urban planning through evidence-based mobility zone classification and targeted strategy formulation, enabling more precise optimization of pedestrian-/cyclist-oriented urban spaces.

1. Introduction

Many cities around the globe are increasingly recognizing the critical importance of non-motorized transportation (NMT) in promoting sustainable urban living. The vitality of NMT systems, encompassing human-powered modes such as walking and mechanically assisted modes like cycling and e-bikes, directly impacts public health, carbon neutrality, and social equity [1,2]. As a key determinant of travel behavior, the built environment (BE) profoundly shapes NMT adoption by mediating accessibility, safety, and comfort [3,4]. However, understanding how multidimensional BE features synergistically drive NMT vitality remains challenging, requiring granular analysis of both physical infrastructure and behavioral dynamics [5,6].
The associations between the built environment and NMT travel behavior have been confirmed by numerous studies [3,4,5,6,7,8]. A general conclusion is that a compact area with mixed land use, a high population density, and high accessibility tends to enlarge the probability of NMT travel and reduce car travel [9,10,11]. Yet conceptual fragmentation persists; some studies treat NMT as a single mode within broader modal choice frameworks [12,13], while others isolate specific subtypes like pedestrian activity [14,15], cycling [16,17], or emerging e-bike usage [18,19]. However, analyses differentiating human-powered (HP) and mechanically assisted (MA) NMT subtypes remain scarce and constrained by methodological reliance on subjective survey data [20,21].
Recent advances in street view imagery (SVI) analytics now enable objective, large-scale classification of NMT activities through computer vision [22], offering unprecedented spatial resolution to decode BE-NMT interactions. Computer vision algorithms, from early feature extraction to deep learning-based object detection such as Faster R-CNN enable the automated identification of NMT agents like pedestrians and cyclists with high precision [23], as well as micro-scale urban elements, including vegetation [24], sidewalks and buildings [25], etc. Unlike satellite imagery or field surveys, SVI captures the ground-level perspectives essential for evaluating pedestrian-scale environments [26], and its temporal coverage supports longitudinal BE change tracking [27]. This SVI-centric approach addresses the resolution limitations of survey-based studies and satellite-derived land use data [28,29], providing a new quantitative means for analyzing interactions between BE factors and NMT choice.
While SVI technologies provide unprecedented observational granularity, conventional approaches to modeling built environment (BE) impacts—including multinomial logit models [11,12], spatial regressions [30], and factor analysis [31]—have established foundational relationships; their reliance on linear in-parameter assumptions oversimplifies the complex, interdependent nature of urban systems [32,33]. Emerging evidence demonstrates that nonlinear frameworks better capture threshold effects in BE–mobility interactions [34] and subtype-specific response patterns [35] critical for NMT optimization [36]. For instance, machine learning models have outperformed linear methods in explaining active travel variance and electric bike usage dynamics [37], revealing BE factor interactions that traditional approaches mask [38]. Recent studies have used SVI data to explore these relationships, leveraging the high-quality and widespread use of SVI to identify nonlinear correlations between built environment features and travel choice [39]. However, there is insufficient exploration of how nonlinear BE interactions differentially shape subtype-specific mobility patterns. This oversight impedes the design of tailored infrastructure interventions, as human-powered and mechanically assisted NMT modes exhibit divergent dependencies on gradients, connectivity, and safety features [33].
This paper advances a novel integration of SVI analytics and explainable machine learning to decode the nonlinear influence of BE factors on NMT dynamics in Hangzhou’s Binjiang District. Utilizing Faster R-CNN [24,25] for the automated detection of NMT agents and BE features from Baidu SVI, we quantify 23 geospatial variables influencing NMT vitality. By leveraging SHAP (SHapley Additive exPlanations) values [40], this study reveals not only the relative importance of each factor but also interaction effects between urban form variables. Spatial heterogeneity in these relationships is further mapped via Bivariate Local Moran’s I [41], which has important implications for the construction of NMT-friendly city planning. By bridging SVI-driven NMT observation with interpretable nonlinear modeling, our framework unfolds a deeper understanding of the diverse urban factors that drive NMT use and shows why planners must consider multiple environmental aspects for sustainable cities.
In the following section, the paper presents the research area and the data collection process used in the study. Section 3 discusses the distribution characteristics of NMT objects and BE factors, presents the model-fitting results, and conducts an analysis of the findings. Section 4 summarizes the spatial heterogeneity of different NMT types and the potential BE factors behind them. The final section discusses the novelty of the research outcomes and strategies for applying them in practical applications, combining the research findings with real-world practices.

2. Data and Methods

2.1. Study Area

The study area, Binjiang District in Hangzhou (Figure 1), serves as a representative urban case for examining the nonlinear relationship between BE with NMT vitality. As a central urban district established in 1996, Binjiang later integrated with the Hangzhou National High-Tech Industrial Development Zone in 2002. With the support of this policy, it has undergone rapid urbanization and infrastructure development. By 2023, it had a population density of 7341 persons/km2 and covered an administrative area of 72.2 km2 [42].
The district is renowned for its comprehensive non-motorized transport network, including a decade-old public bicycle system [43] and an extensive riverside greenway system that integrates recreational spaces, residential areas, and commercial hubs [44]. This infrastructure provides a unique opportunity to analyze how urban design elements influence walking, cycling, and e-bike behavior across space and time.

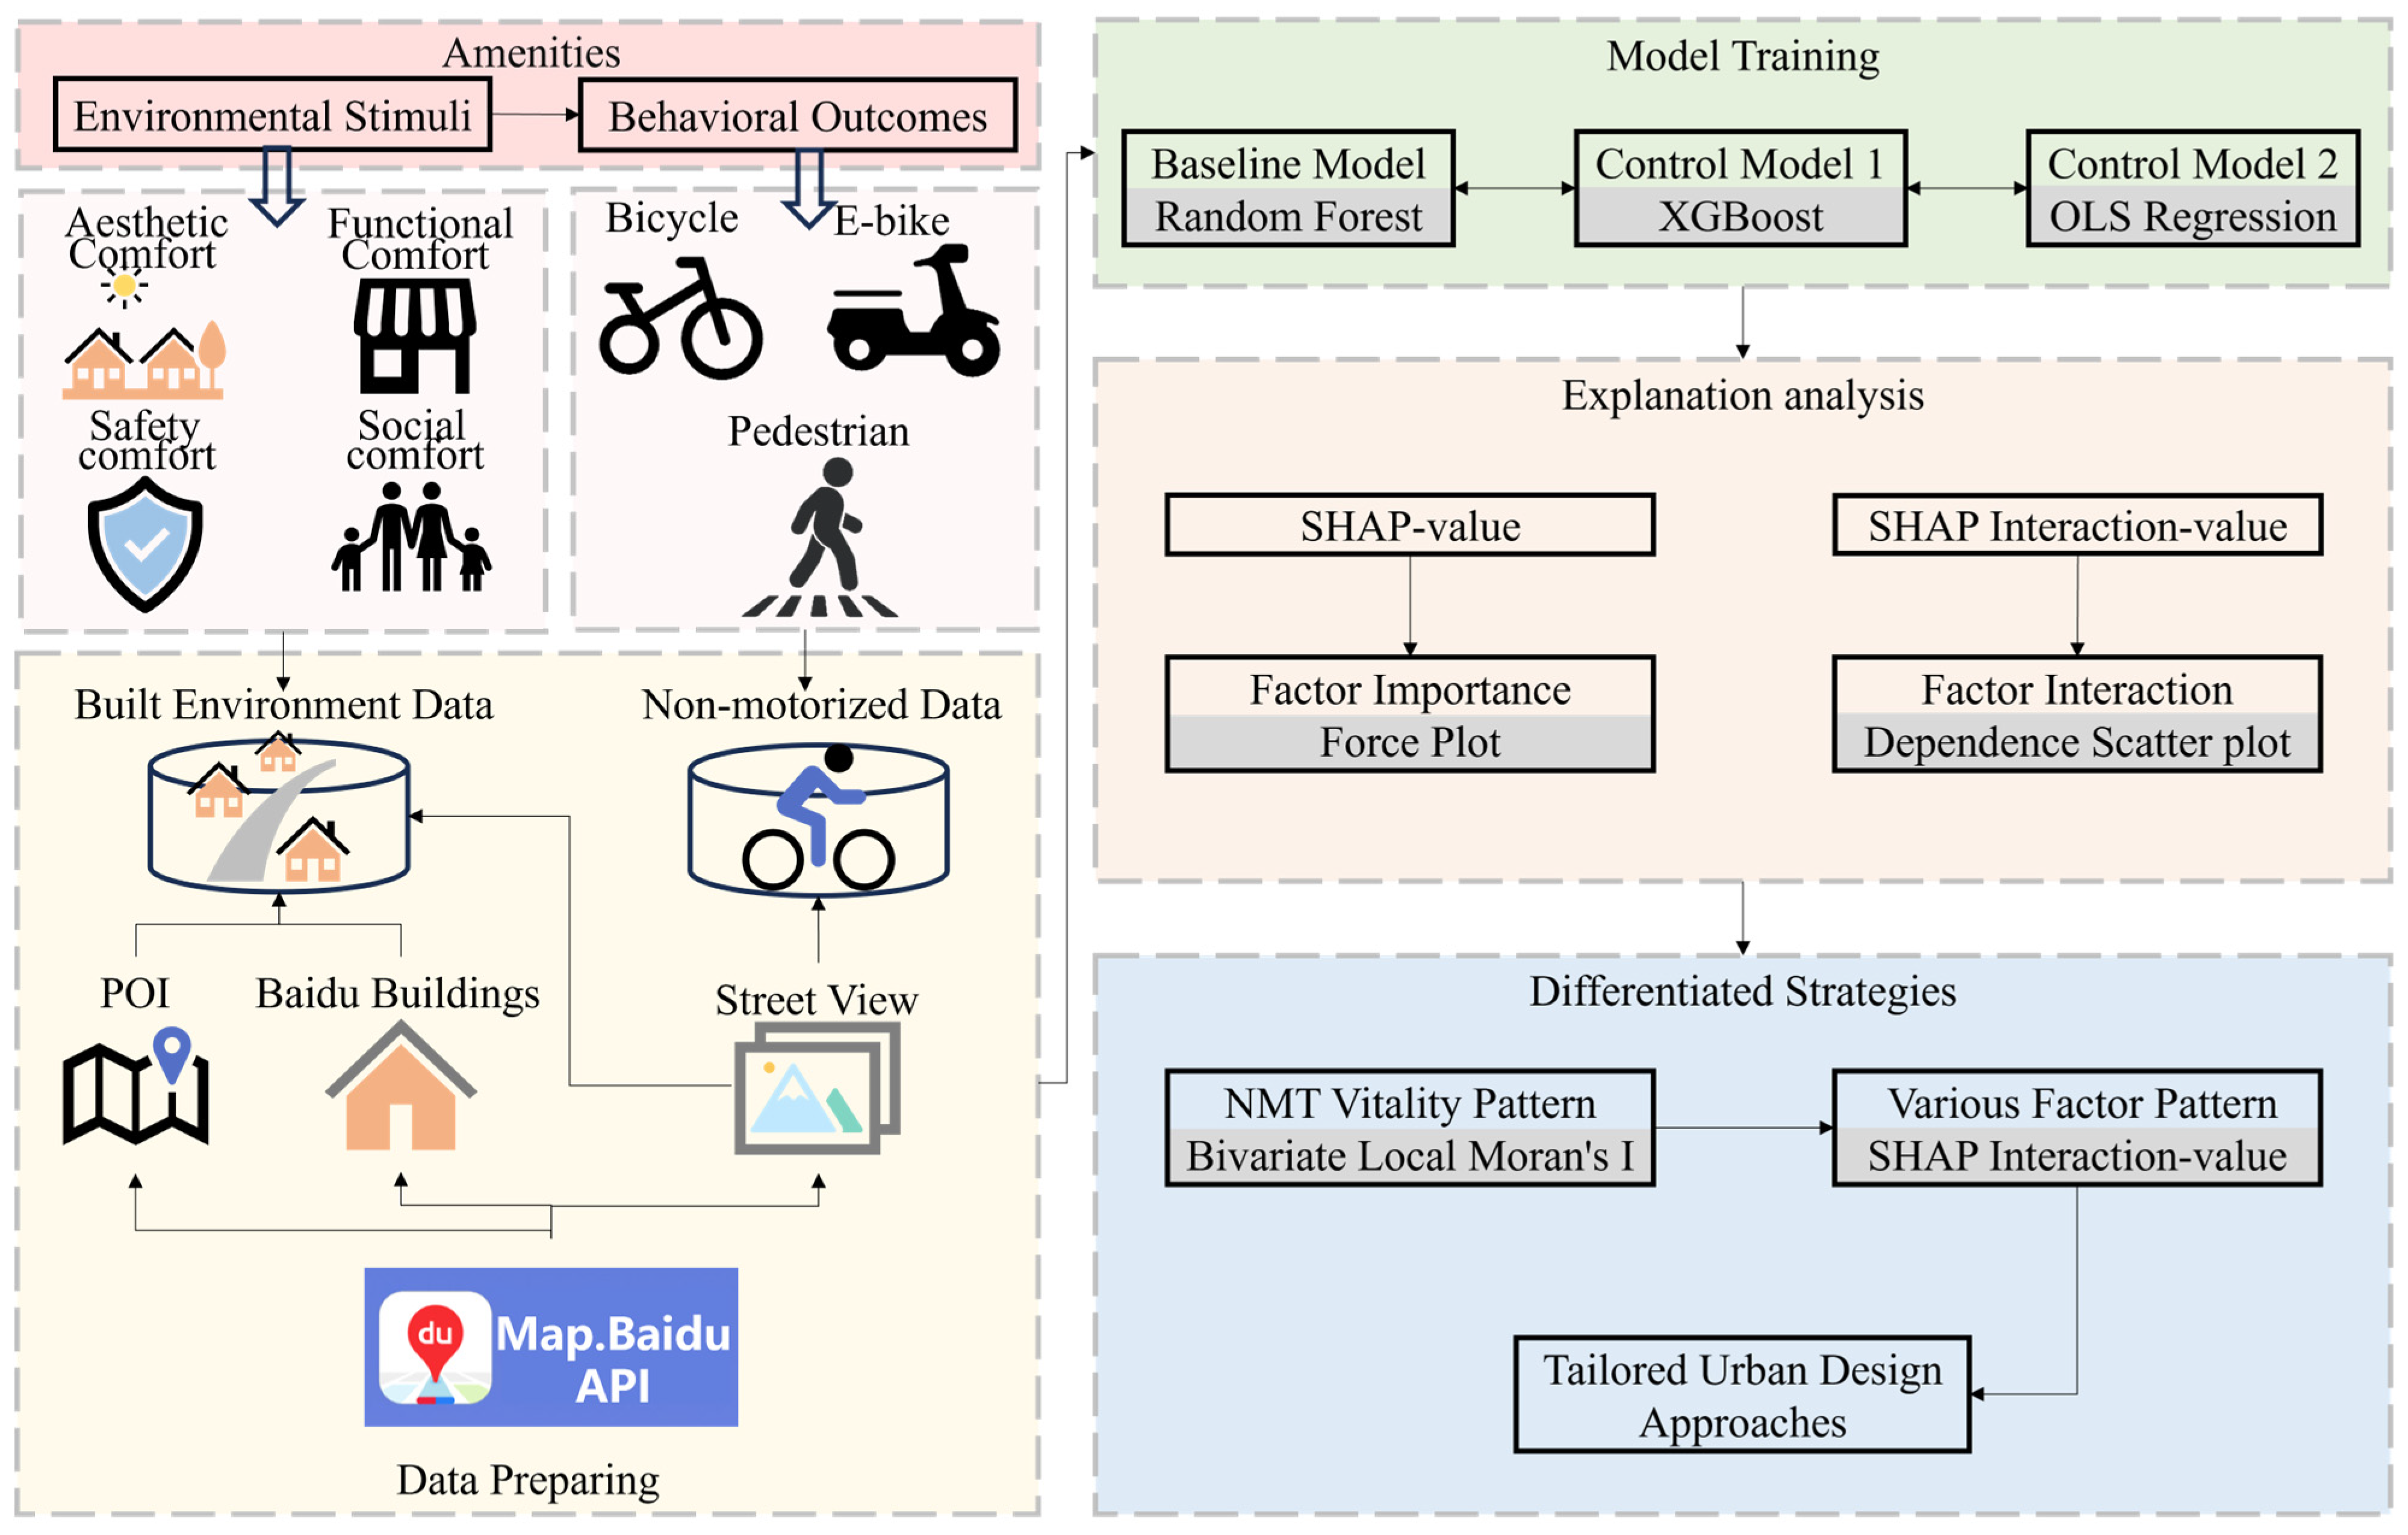
2.2. Research Framework

A quantitative analysis framework (Figure 2) is established to assess the nonlinear impact and synergistic effects of the built environment on NMT vitality, grounded in the concept of environmental amenities. As defined in the framework, amenities encompass desirable features of built environments that enhance comfort, convenience, or enjoyment through four key dimensions: esthetic comfort (visual appeal), functional comfort (utility optimization), safety comfort (risk mitigation), and social comfort (interpersonal interaction space). These environmental stimuli interact with human responses—including perceived comfort levels and behavioral intentions—to jointly determine NMT vitality.
The framework integrates three interconnected modules, an environmental stimuli module, a model training module, and an explanation analysis module. The environmental stimuli module uses multi-source geospatial data, such as building footprints and Points of Interest (POIs) from the Baidu Maps open platform (https://lbsyun.baidu.com/ accessed on 18 April 2023) and street view imagery, and extracts factors of the built environment in four comfort dimensions as well as NMT vitality. The model training module employs a hybrid validation strategy, including a random forest model [45] as a baseline model, and two control models using XGBoost and OLS regression. And the explanation analysis module leverages SHAP values and integration terms to hierarchically rank factor importance, identify nonlinear relationships, and visualize spatial heterogeneity through Bivariate Local Moran’s I and dependence scatter plots.
By coupling built environment factor prioritization with interaction effect detection, this framework enables targeted optimization strategies. The findings inform differentiated design interventions and tailored urban design guidelines for enhancing NMT vitality through evidence-based spatial reconfiguration.

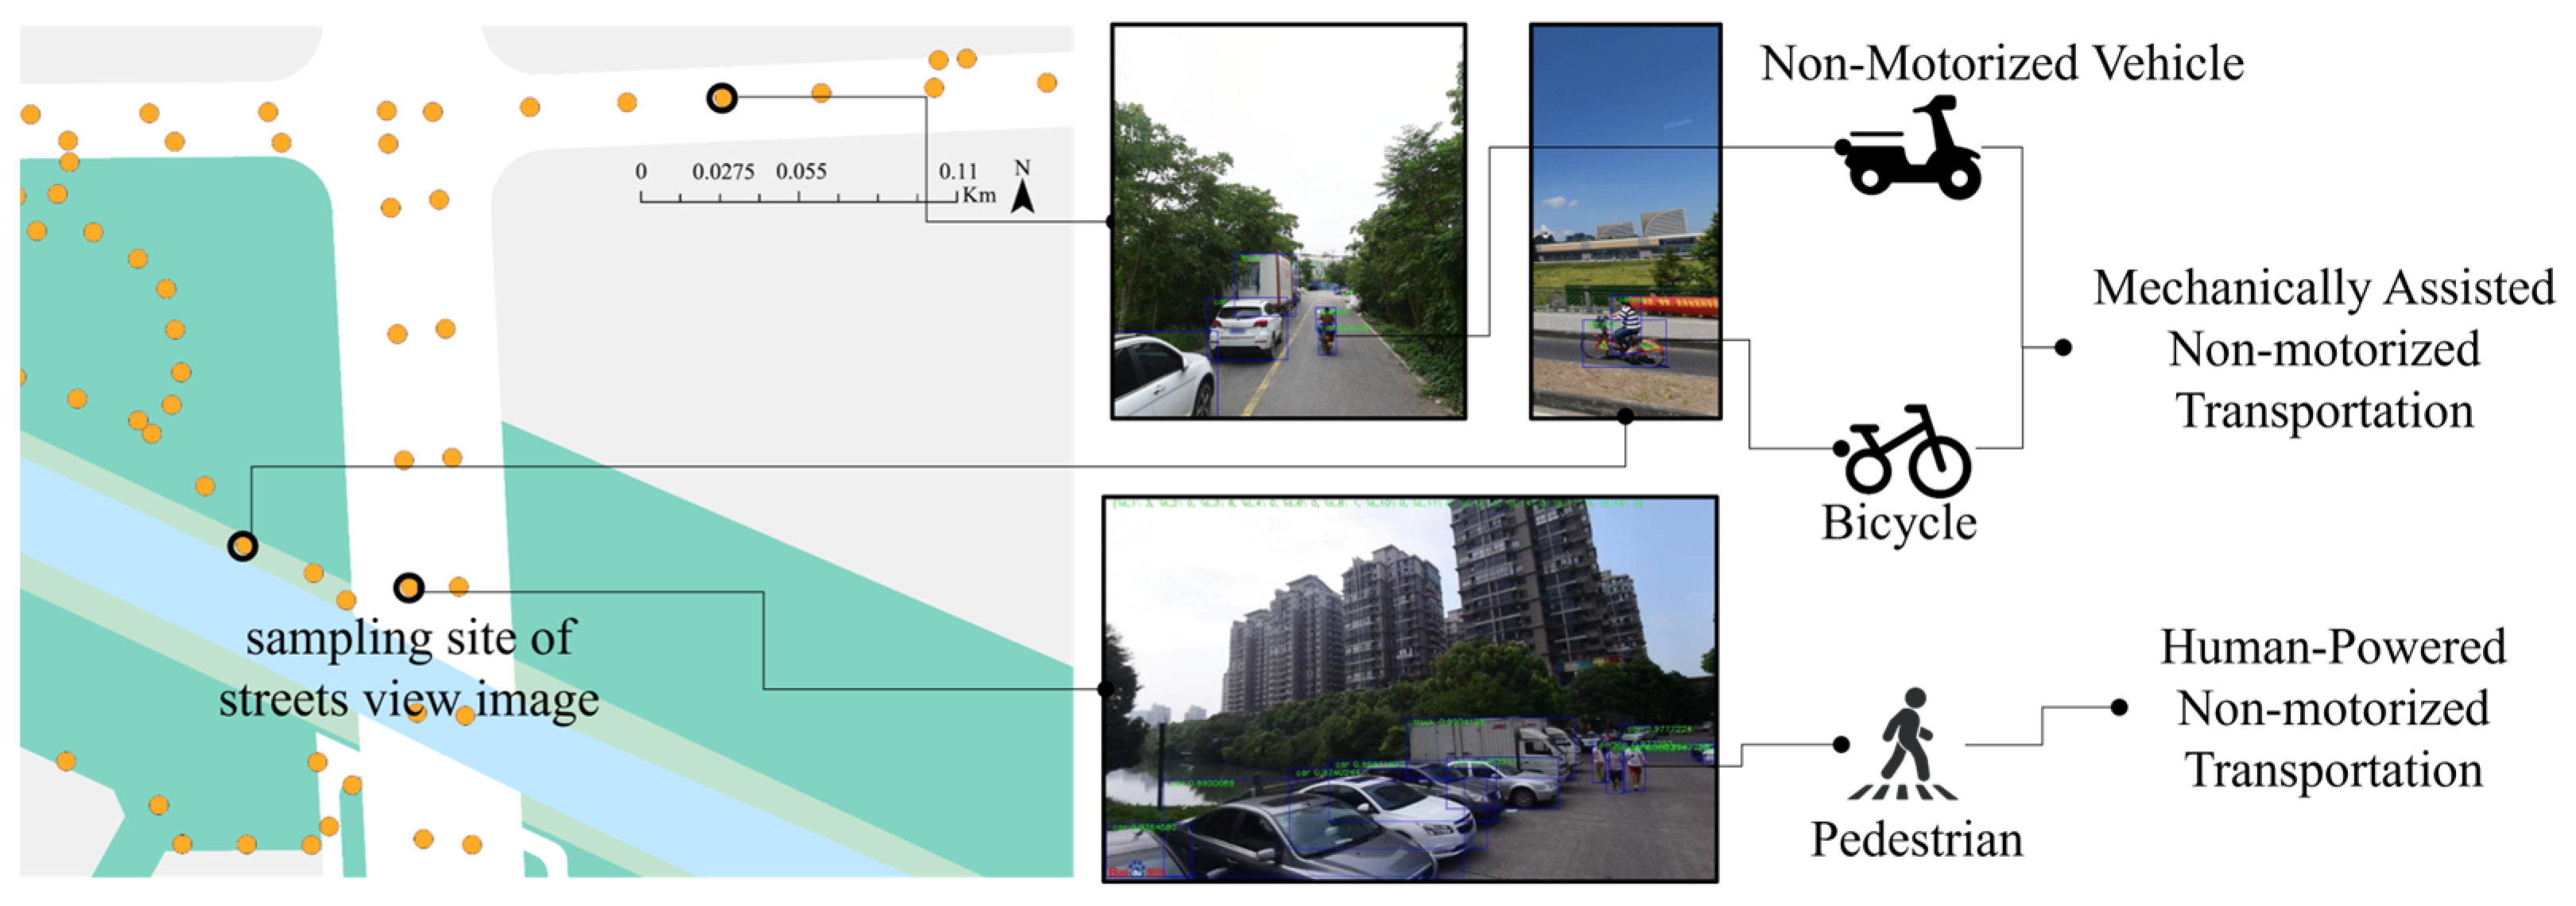
2.3. Object Detection for Non-Motorized Transportation via Street View Images

The street view images for this study were collected through Baidu Street View API in 2022, and the capture time was from June 2019 to August 2021. The street view images were systematically collected across Binjiang District, covering all administrative subdistricts through a geographically stratified sampling framework. The sampling framework is composed of the street network of the study area obtained by OpenStreetMap (OSM), and the interval between sampling points is 50 m. Through multi-task object detection, we quantified distributions of eight mobility-related agents as proxy indicators of non-motorized transport vitality (Figure 3), including pedestrians, bicycles, e-bikes, traffic lights, fire hydrants, parking signs, parking meters, and animals like cats and dogs. We implemented a modified Faster R-CNN framework with a ResNet-50 backbone pre-trained on the COCO 2017 dataset. The model achieved an 89.2% mean average precision across eight classes, with pedestrian detection showing an exceptional precision of 93.7%. Notably, animal detection served as a social comfort indicator of the built environment. Previous studies have shown that this model also performs well for built environments in Chinese streetscapes such as Guangzhou and Wuhan [25,35], demonstrating satisfactory generalization.
For each SVI coordinate point, we constructed 400 m Euclidean buffers to represent neighborhood-scale mobility catchments. The buffer corresponds to roughly a 5 min walking distance (assuming an average walking speed of about 1.3 m/s) and is a commonly used neighborhood-scale metric in urban planning and transit research [30]. This buffer both encompasses the typical catchment area for residents’ daily transfers and leisure trips and remains computationally efficient, effectively characterizing the spatial reach of NMT. Two NMT vitality metrics were derived through kernel density estimation. Human-powered NMT vitality is calculated as the mean kernel density intensity of pedestrian detections, weighted by occlusion-corrected visibility scores. Mechanically assisted NMT vitality is quantified as the sum of bicycle and e-bike kernel density intensities.

2.4. Quantifying the Nonlinear Influences of the Built Environment

2.4.1. Built Environment Factors

Urban NMT vitality emphasizes residents’ perceptions and experiences of urban space when walking or cycling. The choice to travel by foot or bicycle depends not only on destination accessibility but also on factors such as environmental comfort, pedestrian environment quality, visual esthetics, opportunities for social interaction, and perceived safety [11]. Amenity theory highlights the role of environmental factors—livability, convenience, safety, and esthetics—in an area’s attractiveness. This theory offers a framework to analyze spatial variations in urban NMT vitality and its driving factors. Recent studies apply amenity theory to NMT vitality: using streetscape data to assess the esthetic comfort of urban spaces and demonstrating its positive effect on walking activity [4]; examining how the density of different facility types (commercial, transportation, and public services) promotes walking/cycling [20]; and showing that safety infrastructure (crosswalks, traffic signals, and lighting) increases pedestrian vitality [46].
At present, scholars typically divide urban amenities into four dimensions: esthetic comfort, functional comfort, safety comfort, and social comfort. The esthetic comfort dimension measures the visual and architectural quality of urban landscapes. Previous research confirms that visual esthetics significantly affect pedestrian/cyclist choices [47]. Based on existing studies, we selected proximity to parks and plazas (PKS), the building height-to-width ratio (BHR), and building density (BD) [47,48]. BHR and BD data derive from Baidu Buildings, a vector spatial dataset via Baidu Maps API, which provides footprints, heights, floor counts, and functional data for our study area. BHR is defined as the building height divided by the street frontage width per analysis unit (400 m Euclidean buffers); BD is the ratio of total building footprint area to analysis unit area.
Functional comfort evaluates the accessibility and convenience of facilities for NMT [5]. We selected key pedestrian destinations informed by prior research [49]: parking meters (PMs), food and beverage services (FBs), public facilities (PFs), enterprises (ENTs), shopping venues (Ss), transportation services (TSs), financial and insurance services (FISs), commercial residences (CHs), daily life services (DLSs), sports and recreation facilities (SRs), and accommodation services (ASs).
Safety comfort assesses safety infrastructure for pedestrians and cyclists. Safety factors strongly influence individuals’ willingness to engage in NMT [15]. Evidence confirms that facilities such as traffic lights (TL), parking signs (PGSs), fire hydrants (FHs), and medical services (MSs) improve actual and perceived safety, encouraging non-motorized activity [50].
The social comfort dimension encompasses factors related to social interaction opportunities and population vitality, grounded in social capital theory and human-centered urban design principles [51]. The presence of pets (cats and dogs, CDs), resident population (R), employed population (EMP), science and educational and cultural service facilities (SESs), and government and social organizations (GOSGs) have all been widely recognized as important indicators affecting social interaction, community cohesion, and walking vitality [5]. All built environment factors with the associated data sources can be seen in Table 1.

2.4.2. Regression Model Construction

To comprehensively assess model performance and validate the robustness of the nonlinear relationships, we implemented a hybrid analytical framework. Random forest (RF) served as the core interpretable machine learning model, XGBoost worked as a high-performance gradient-boosting counterpart, and ordinary least squares (OLS) worked as a linear baseline.
Random forest employs dual stochastic mechanisms to enhance generalizability. First, each decision tree is trained on a bootstrapped subset of the data (sampled with replacement), allowing ensemble aggregation to mitigate overfitting. Second, at every node split, a random subset of features is evaluated to decorrelate trees and improve collective predictive stability.
As a state-of-the-art gradient boosting implementation, XGBoost optimizes differentiable loss functions through additive tree construction. Its sequential error-correction mechanism contrasts with RF’s parallelized bagging approach, providing insights into nonlinear pattern capture efficiency. OLS with standardized coefficients assumes fixed marginal effects between BE factors and NMT vitality. This traditional parametric method highlights the limitations of linear additivity in capturing threshold behaviors and variable interactions.

2.4.3. Nonlinear Influences Interpretation

To decode the nonlinear mechanisms through which built environment (BE) factors shape non-motorized transportation vitality, we employed SHAP [52], a game theory-based interpretability framework uniquely suited to analyzing complex spatial interactions in urban systems. Unlike global feature importance metrics, SHAP quantifies localized contributions of individual BE variables to specific NMT vitality predictions. This granular perspective aligns with our focus on spatially heterogeneous BE-NMT dynamics in high-density urban cores.
Using the SHAP v0.43.0 Python package, we applied TreeExplainer, optimized for ensemble tree models like random forests, to calculate two critical metrics. The Shapley value (Equation (1)) quantifies the marginal impact of each BE variable on localized NMT vitality predictions relative to the dataset mean. Shapley interaction values (Equation (2)) identify synergistic or antagonistic effects between BE variable pairs.
ϕ k f , x = s τ 1 K ! [ f x P k S k f x ( P k S ) ]
where ϕ k f , x is the Shapley value, τ is the set of possible variable orderings, k is the number of variables, P k S is the variables that come before the variable k in the ordering S , x is the value of explanatory variables, and f means a single prediction.
ϕ i , j f , x = T ξ \ i , j T ! K T 2 ! 2 k 1 i , j f , x , T
where ϕ i , j f , x is the Shapley interaction value that reflects the interaction effect between variable i and variable j on a single prediction, K is the number of variables, ξ is the set of input variables, T is the possible variable coalitions, and x is the value of input variable for the prediction.
Synergism emerges when a cooperation or interaction causes an increase in the whole so that the whole is greater than the sum of parts [53]. For our NMT context, positive interactions ϕ i , j > 0 indicate BE factor synergies amplifying subtype vitality, while negative values ϕ i , j < 0 suggest conflicting design priorities.
This approach advances traditional linear paradigms by addressing three core challenges in BE-NMT modeling, the spatial heterogeneity of nonlinear effects, context-dependent variable interactions, and subtype-specific infrastructure optimization thresholds.

3. Results

3.1. NMT Target Objects and BE Factors in the Study Area

A total of 31,302 street view images were collected across Binjiang District via Baidu Map API, achieving a spatial density of approximately 433 images per square kilometer. These images comprehensively cover both arterial roads and secondary street networks. Using Faster R-CNN-based object detection, we identified eight critical street-level elements (Table 2), including pedestrians, bicycles, and e-bikes (response variables, Y), as well as infrastructure features such as traffic lights and fire hydrants (explanatory variables, X).
NMT vitality was measured through kernel density estimation within 400 m buffers. Pedestrian vitality has an average number of 1243.87 (SD = 979.24), exhibiting a polycentric clustering pattern. Pedestrians typically travel at speeds ranging from 3 to 4 km per hour, offering a high degree of freedom and spontaneity that allows for thorough observation of the streetscape during transit. Bicycle vitality has an average number of 443.78 (SD = 547.80), concentrated along greenways and metro station corridors. E-bike vitality has an average number of 218.21 (SD = 166.24), primarily aggregated near arterial road connectors. Bicycles and e-bikes, generally travel at speeds between 15 and 20 km per hour. These travel modes are more constrained by non-motorized lanes and topographical conditions, leading to less spontaneity and more superficial streetscape observation. Additionally, they require specific parking spaces.
The other five built environment elements are all in a low mean count, while having different distributions. The average number of traffic lights within the 400 m buffer is 0.21 ± 0.66, a quite large SD compared to the mean. It suggests limited signalization in secondary streets, potentially prioritizing vehicle flow over NMT safety in peripheral areas. Proximity to hydrants may signal well-maintained public spaces conducive to walking, though sparse distribution (mean = 0.02 ± 0.14) limits broad applicability. Clustered parking signage (mean = 0.02 ± 0.13) often coincides with commercial hubs, where vehicular encroachment on sidewalks may deter walking comfort. A near absence of parking meters reflects Binjiang’s reliance on off-street parking facilities, suggesting a segregated rather than shared street design. Regarding the situation for animals, however, even a minimal presence (max = 1) could signal micro-scale social comfort zones attractive to pedestrians.
Fire hydrants (FHs) and cats and dogs (CDs) exhibit zero-inflated distributions, yet they each represent critical dimensions of safety and social comfort. Even a single fire hydrant in a neighborhood can signal effective curb-side management and emergency preparedness, factors closely linked to pedestrian confidence and route choice in prior research. Likewise, the occasional presence of pets on the street enhances the “eyes on the street” effect, fostering social ambiance and encouraging walking, so we have retained these variables.
A comprehensive analysis of built environment (BE) factors was conducted using 70,661 Points of Interest (POIs), supplemented by two variables derived from Baidu building data and two mobile data-driven metrics. Pearson correlation coefficients were calculated to assess interdependencies among all 23 BE variables, with results ranging from 0 to 0.7 (Figure 4). This moderate correlation spectrum suggests generally independent explanatory power across most variables, aligning with the study’s goal of minimizing multicollinearity in predictive modeling. However, the coefficient for residents and employees is 0.99, indicating a clear collinearity between them. Including both variables in the model may lead to endogeneity issues due to explanatory redundancy. So, we combined the resident population and the employed population into a new variable called population by calculating its average. The retained correlation range ensures stable regression coefficient estimation while preserving granular BE dimensionality.

3.2. Regression Model Optimization and Comparative Analysis

The comparative analysis of regression models systematically evaluated the predictive performance of nonlinear machine learning algorithms against traditional linear regression for NMT vitality prediction. Hyperparameter optimization through grid search identified optimal configurations: random forest (RF) achieved a maximum accuracy with max_depth = None, min_samples_leaf = 1, min_samples_split = 2, and n_estimators = 200, while XGBoost demonstrated superior calibration under constraints of gamma = 0, learning_rate = 0.2, max_depth = 5, min_child_weight = 3, and n_estimators = 300. Both models were rigorously validated against ordinary least squares (OLS) regression using root mean squared error (RMSE) for neighborhood-scale error quantification and adjusted R2 for variance explanation relative to model complexity. The results in Table 3 reveal consistent nonlinear advantages: XGBoost achieves a 75.16% lower test RMSE than OLS, while RF reduces it by 79.15%, on average. Adjusted R2 improvements were equally striking, rising from 0.438 (OLS) to 0.960 (XGB) and 0.970 (RF) in the test sets, confirming strong nonlinear relationships between built environment variables and NMT vitality.
Notably, human-powered mobility vitality (HPMV) exhibited superior modeling performance compared to mechanically assisted mobility vitality (MAMV), with pedestrians showing higher adjusted R2 scores than bicycles/e-bikes across all models. This divergence stems from fundamental differences in mobility patterns; pedestrian activity demonstrates strong spatial autocorrelation due to fixed infrastructure and micro-scale environmental factors, which align with both the linear and tree-based models’ capacity to capture localized interactions. In contrast, MAMV’s heterogeneity—spanning bicycle lane preferences, e-bike speed dynamics, and route choice hierarchies—introduces spatial non-stationarity that challenges conventional modeling assumptions. The persistent performance gap underscores the importance of differentiated analytical frameworks, particularly the need for interpretability-driven methods to decipher complex nonlinear interactions while maintaining actionable linkages to urban design interventions.

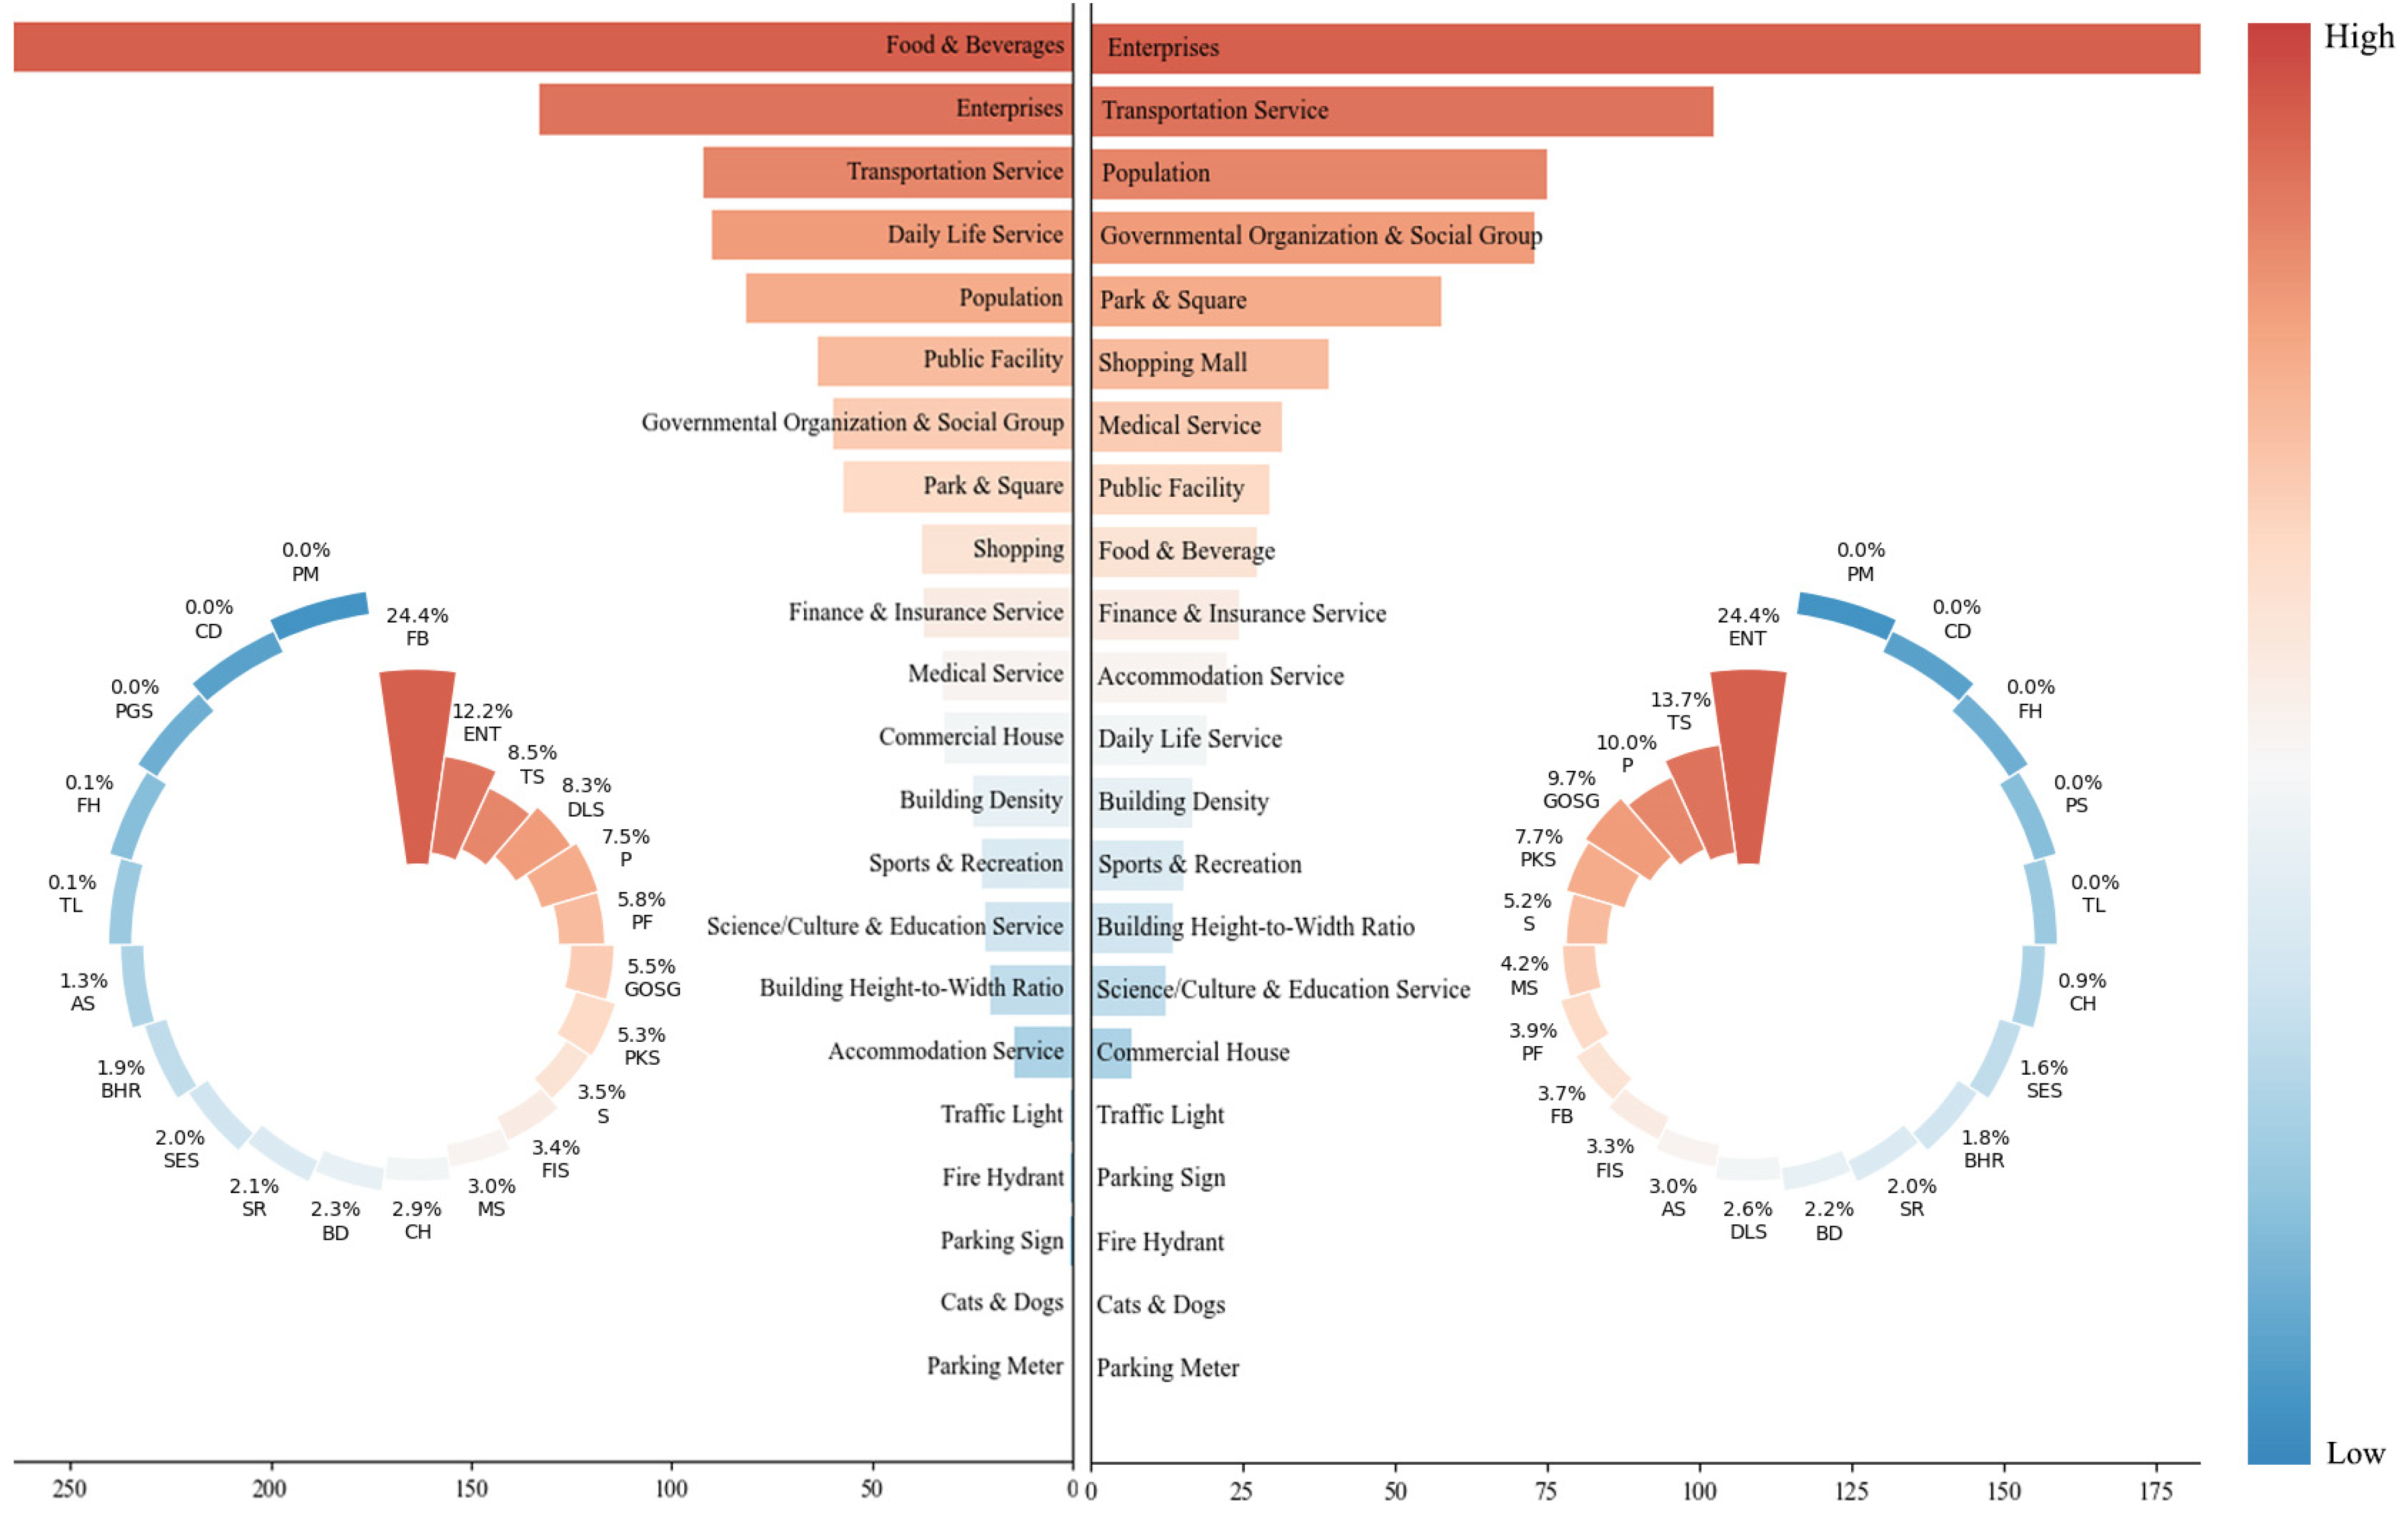
3.3. Influence of BE Factors on NMT Vitality

To address the black box nature of machine learning models while preserving their capacity to capture complex built environment dynamics, we calculated mean SHAP values to reveal significant disparities in the relative importance of built environment factors between HP and MA NMT modes (Figure 5). The larger the value, the stronger the global influence of the feature on the model’s prediction.
Nine of the top ten built environment factors overlap between the HP and MA models—enterprises, transportation services, population density, governmental organizations and social groups, parks and squares, commercial establishments, food and beverage outlets, public facilities, and finance and insurance services—yet their rank order differs markedly. Daily life services, for instance, rank 4th in the HP model but fall to 12th in the MA predictions, while medical services climb from 11th in HP to 7th in MA. These rank shifts reflect distinct spatial dependencies: pedestrian trips hinge on micro-scale accessibility to daily needs—shorter distances minimize spatial friction and directly boost walking frequency—whereas cyclists and e-bike users tend toward longer, utility-driven journeys. For them, access to medical facilities often depends on dedicated infrastructure that enhances multimodal connectivity. In other words, HP networks prioritize dense, local amenity clusters, while MA networks emphasize key infrastructure placements to serve longer-distance travel demands.
On the other hand, factors like public facilities, parks and squares, and shopping amenities show a strong influence on HP but are less significant for MA, revealing critical insights into mobility mode-specific environmental dependencies. High concentrations of public facilities (e.g., libraries or community centers) within 400 m walking catchments reduce spatial friction for pedestrians, creating gravity-driven trip generation patterns. In contrast, MA users prioritize route efficiency over proximity, often bypassing localized amenities to optimize travel time. Parks and squares enhance pedestrian activity through sensory stimulation and social facilitation [54], which are less relevant to MA riders focused on utility-oriented navigation. The spatial configuration of commercial areas further amplifies this dichotomy—compact retail clusters with wide sidewalks boost walking trips but show negligible impact on bicycle route choices.
Overall, the SHAP value shows the nuanced needs of different non-motorized transportation modes and the importance of tailoring mechanism analyses especially nonlinear effects and the interaction effects of factors, as well as tailoring urban design and policy interventions to support the varied requirements of urban NMT vitality.

3.4. Interaction of BE Factors for NMT Vitality

Beyond evaluating each variable’s overall importance, we leverage Shapley interaction values to uncover deeper insights into their nonlinear effects. Figure 6 and Figure 7 show the six influential factors driving human-powered and mechanically assisted NMT vitality and their SHAP dependency graphs with the most relevant factors. Each subplot corresponds to a specific BE factor; the Y-axis remains the total SHAP value for the specific BE factors, representing its total contribution to the NMT vitality model, including the main effect and the interaction effect. Color represents the value of an interactive factor, and color mapping helps to intuitively analyze the synergistic effect between features. The trend line fits the relationship between the SHAP value and the BE factors through a Generalized Additive Model (GAM; a GAM fits each predictor with its own smooth function allowing us to capture and visualize nonlinear effects), revealing the average marginal contribution of this feature to the model’s output under different values. It removes noise and nonlinear fluctuations, showing the overall trend between BE factors and SHAP values.
The SHAP values for food and beverages demonstrate a nonlinear impact on human-powered vitality; when FB density exceeds a threshold of 100, SHAP values become positive. This indicates that dense concentrations of food and beverage services enhance pedestrian vitality1. The most relevant factor for food and beverages is transport services. Transportation services have some antagonistic effects on the food and beverage factor. When the food and beverage factor is at a low level—that is, when the SHAP value is negative—the SHAP value gradually increases as the transport service density increases. When the food and beverage factor is at a high level, the SHAP value gradually decreases with the increase in transportation service density.
Enterprise density has a similar threshold effect. When the density exceeds 20, equal to 0.5 enterprises/ha, the SHAP value becomes positive and enterprise density begins to have a positive impact on HP NMT vitality. When the density is in the range of 50 to 125—that is, 1 to 2.5 enterprises/ha—the promotion effect reaches its peak. Beyond this peak range, the promotion effect declines and tends to stabilize. An excessive density of enterprises indicates a higher occupation of space in the area, which can exert a repulsive force on other urban functions. The highest interaction factor for enterprises is food and beverages. There is also a certain antagonistic effect between the two factors. When the enterprise density is the same, the larger the food and beverage store density is, the smaller the SHAP value is. When the SHAP value of enterprise density reaches a stable level, the effect between food and beverages and enterprises disappears.
The transportation service factor exhibits a non-monotonic effect on NMT vitality. Its SHAP value is highest at very low TS levels, then steadily declines as TS density increases, reaching zero around 50 facilities (≈1/ha) and turning negative past 300 facilities (≈6/ha). This pattern makes intuitive sense: when transport options are scarce, walking predominates and contributes positively to NMT vitality; at moderate TS levels, walking serves efficiently as a transfer mode; but when TS is abundant, alternative modes dilute its positive impact on NMT. Furthermore, TS shows its strongest synergy with daily life services. This interaction peaks at medium TS densities (50–250 facilities, or 1–5/ha), where each additional DLS facility significantly boosts the SHAP value of TS. Beyond 250 TS facilities (>5/ha); however, further increases in DLS coincide with a reduction in TS’s SHAP contribution.
The SHAP distribution for daily life services is similar to the food and beverage factor, with a threshold of 120, or 2.4 stores/ha. After the threshold is exceeded, the SHAP value increases with the increase in the service level of daily life. At the same time, it has the most significant synergies with the factor of food and beverages. Especially when the level of daily life service exceeds the threshold, there is an obvious enhancement between the two factors. The SHAP value curve of population reaches its maximum promotive effect at approximately 10, equal to 2000 people/ha, after which it tends to stabilize. The optimal interactive factor for population is the food and beverage factor, further indicating that community activities within living scenes are more conducive to promoting HP. The SHAP distribution for public facilities is similar to the enterprise factor, with a threshold of 10 to 40, or 0.2 to 0.8 facilities/ha. Exceeding the range, the SHAP value begins to diminish and stabilize. The enterprises factor shows an additive effect. When the level of public facilities is the same, the increase in enterprise factors is accompanied by the increase in SHAP value.
In the context of MA (Figure 7), the factor of enterprises emerges as the most impactful among the top six factors, exhibiting a nonlinear relationship in its SHAP value analysis. A significant threshold is observed as enterprise density exceeds 15, equaling 0.3 enterprises/ha. When this value is exceeded, the synergistic effect of the transportation service factor is obvious. When the enterprise density is the same, the lower the level of transportation services, the larger the SHAP value is and the value is positive; while when the level of traffic facilities is higher, the SHAP value becomes smaller and negative. For Transportation Service, an initial surge in SHAP values corresponds to an increase in facility count, indicating a potent positive influence on MA transportation. This effect plateaus upon reaching 8 facilities/ha, suggesting a saturation point. Transportation Service shows two similar trend lines with comparable shapes and thresholds, indicating a stable operational mechanism, potentially with spatial heterogeneity contributing to divergent impacts. The strongest interaction factor for transportation service is governmental organization and social group, with the synergistic effect becoming apparent below 0.1 facilities/ha.
Population density affects MA NMT vitality in a nonlinear way: it bolsters MA usage at low to moderate densities but plateaus—and even declines—when areas become overly crowded, suggesting that extreme density offers diminishing returns for cycling and e-biking. The strongest synergy for population is with shopping density, highlighting how access to retail amenities amplifies functional comfort and MA uptake. Governmental organizations and social groups also drive MA vitality at lower presence levels, likely because institutional hubs concentrate trip demand. Moreover, under a fixed level of government infrastructure, increasing transportation service slightly reduces population’s SHAP contribution—implying that when transit options are plentiful, travelers may shift toward private cars, buses/metro, or walking rather than MA modes. The SHAP values for parks and squares unveil a distinct pattern where beyond 60, equal to 1.2 facilities/ha, there is a positive impact on MA. The most important interaction factor of parks and squares is enterprises, indicating that internal interactions between functional factors can also generate significant synergistic effects and promote MA. A high concentration of Shopping tends to positively affect MA transportation, yet beyond 300, equal to 6 shops/ha, the promotional effect plateaus. There is also a suppressive effect observed in local samples between 200 and 300, that is 4 to 6 shops/ha, suggesting a possible oversaturation effect.
Overall, the SHAP values for both HP and MA highlight the nonlinear actions and interactions between factors affecting non-motorized transportation. Most factors are dynamically reversed before and after a certain threshold. For example, when the density exceeds 0.3~0.5 enterprises/ha, the promotion of HP vitality turns to inhibition; When the density of transportation services reaches 8 facilities/ha, the marginal benefit of MA is saturated, and when the density exceeds 300 facilities/ha, the marginal benefit of MA is negative. There are trade-offs and complementary effects among built environment factors. Food and beverages and daily life services exert synergistic gains on each other in HP NMT vitality, but a high enterprise density will inhibit the contribution of food and beverage services. The positive effect of transportation services on MA increases first and then decreases with the increase in the number of facilities, while its promotion of HP competes with the population density. The intensity of the interaction effect is closely related to the combination of factors and the range of densities. For example, the synergistic effect of government organizations and social groups on MA is more significant at low transportation service levels, while parks and squares are synergistic with enterprise density in areas of medium enterprise concentration. Another characteristic is the space crowding effect at high densities. For example, a high density of enterprises inhibits HP vitality, and a high density of transportation services weakens MA attraction. However, the threshold points and influence paths of different functional areas are different.

4. Discussion

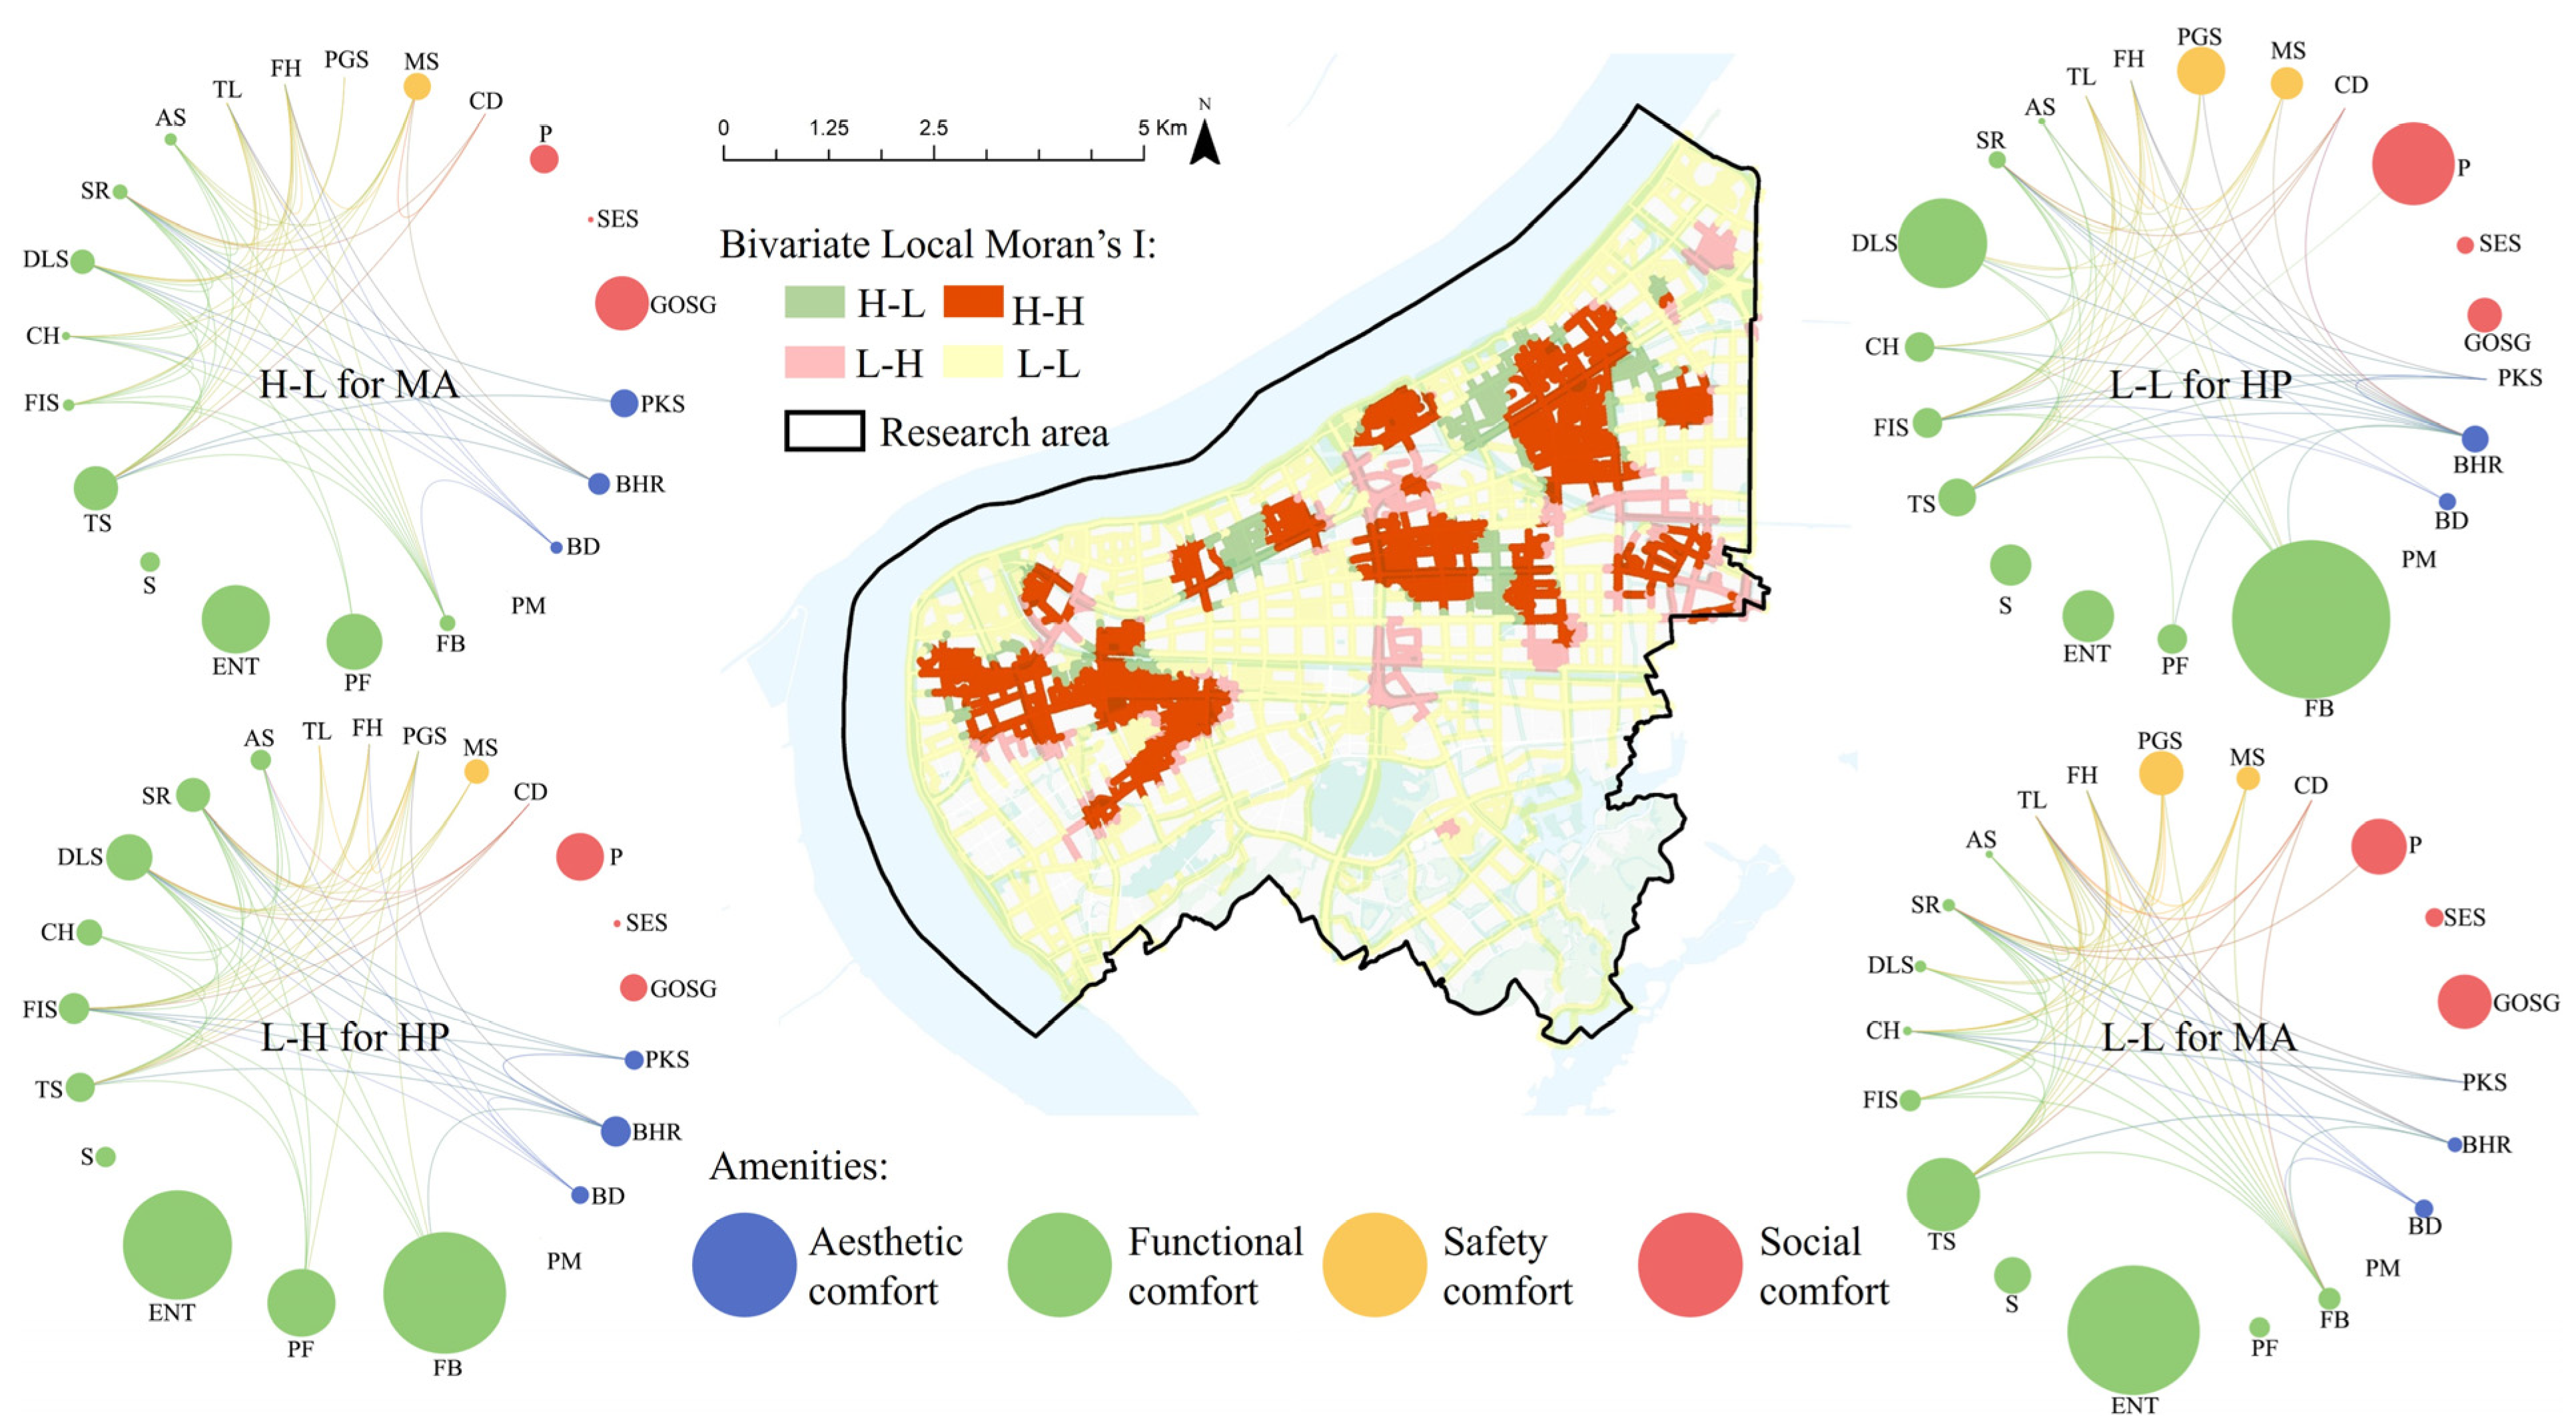
4.1. Bivariate Local Moran’s I and Strategies

By examining the spatial heterogeneity of key factors, we can formulate more targeted urban planning strategies. We employed a multi-stage analytical framework combining spatial statistics and machine learning interpretability to guide context-sensitive urban design. First, using Bivariate Local Moran’s I (Figure 8), we classified spatial heterogeneity in NMT vitality into four distinct zones. H-L clusters means human-powered mobility hotspots with below-average mechanically assisted mobility, L-H clusters represent MA-dominant zones with suppressed HP vitality, H-H clusters have dual-mode vitality hotspots, and L-L clusters have dual-mode underperformance areas.
Subsequently, we conducted weighted factor analysis within each zone, leveraging SHAP values and interaction metrics to identify context-specific drivers. For visualization, Figure 8 integrates spatial clustering results with SHAP-based feature importance. The diameter of the circles corresponds to the average absolute SHAP magnitude, and the line connections denote interaction effects with the most relevant factors. This integrated approach enables evidence-based, spatially differentiated planning that resolves the paradoxical coexistence of HP and MA deficiencies through tailored interventions. By coupling geostatistical diagnostics with explainable AI techniques, the framework advances precision urbanism in NMT system optimization.

4.1.1. H-L Clusters

H-L clusters are primarily found near the H-H cluster. These zones maintain significant HP vitality, though MA vitality has notably declined. Spatially, potential areas for reinforcement are some H-L clusters along the river. These regions boast well-developed greenways and are well-equipped with infrastructure supporting non-motorized transportation. Therefore, we conduct an interpretable analysis of MA for this segment of the sample to facilitate the formulation of targeted planning strategies.
The most significant factors influencing this trend are enterprises, public facilities, and governmental organizations and social groups, which suggests that MA predominantly involves purpose-driven, short- to medium-distance trips. Transportation services also play a crucial role, with transit exchanges being one of the primary purposes of NMT. This suggests that functionality is paramount in MA non-motorized transportation. In urban planning, emphasis should be placed on achieving a balance between work and residential areas, promoting the development of parcels under a transit-oriented development (TOD) strategy, and enhancing the accessibility and mobility of the NMT system.
The strongest interaction effect occurs between cats and dogs and shopping, indicating that pet-accompanied shopping expeditions constitute a stable NMT micro-mobility pattern. The significance of these factors is currently limited by the urban pet ownership ratio. While its current expression is constrained by urban pet ownership rates, this pattern exhibits high growth potential as pet-friendly infrastructure expands. The factor of enterprises and the factor of governmental organizations and social groups exert significant effects but they lack strong interactions; one possible reason for this might be that these trips are more unidirectional and work-related, being characterized by point-to-point transit. The most frequent strong interactions are between social comfort and functional comfort, followed by interactions between esthetic comfort, safety comfort, and functional comfort. Therefore, emphasizing mixed-use land strategies that blend urban functions can enhance the vitality of NMT activities.

4.1.2. L-H Clusters

L-H clusters are similarly distributed around the H-H cluster, but unlike H-L clusters, they are located in the southern parts of the study area. These regions lack the well-developed NMT infrastructure such as the riverside and offer opportunities for simultaneous strengthening of planning and spatial design.
The most influential BE factor is food and beverages. Unlike MA, HP includes more lifestyle-oriented or non-purposeful dwelling with higher randomness and urban service interaction, making it more susceptible to the influence of the density of food and beverages. Enhancing this type of NMT movement could emphasize commercial route design. Enterprises remain important for balancing work and residence. Following that, public facilities shift from 6 in HP importance ranking to 3 in L-H importance ranking, indicating that walkable public services are a critical urban function. Population and daily life services are also significant, underscoring the promotional effect of residential functions on HP. This suggests that community-building strategies focused on walkability, such as the 15 min living circle and neighborhood units, are viable strategies for enhancing HP non-motorized transportation.
The strongest interactions are between shopping and transportation services, reinforcing that TOD combining transit and shopping remains an effective strategy for developing NMT levels. Enterprises have significant importance but lack crucial interactions, similar to H-L clusters for MA. Also, there are strong interactions between social comfort and functional comfort factors, such as cats and dogs and medical services, building height-to-width ratio, and food and beverages. As anticipated, the higher time cost of walking necessitates comprehensive benefits including safety, esthetics, and functional comfort.

4.1.3. L-L Clusters

L-L clusters are prevalent in most of the study areas, especially in the southern region, despite it having more green space. For HP, significant factors include food and beverages, daily life services, and population, highlighting the critical role of lifestyle services in stimulating pedestrian activity in low-vitality areas. Therefore, urban revitalization efforts in these zones should prioritize the planning of commercial spaces tailored to retail activities to enhance walkability. The most crucial correlations within this cluster arise between public facilities and transportation services, underscoring the importance of transit-oriented public services as a foundation for HP. Consequently, improving accessibility to these facilities should be a focal point.
For MA, significant factors include enterprises, followed by transportation services and population. Similarly to the H-L clusters, the focus of urban renewal should be on achieving a work–residence balance and implementing TOD strategies to enhance MA. The most important interactions for MA involve commercial houses with transportation services, and with cats and dogs. A possible explanation is that commercial housing serves as a significant source of NMT travel, thus making transit-related and pet-accompanied dwelling impact NMT vitality. Therefore, enhancing NMT infrastructure remains essential.

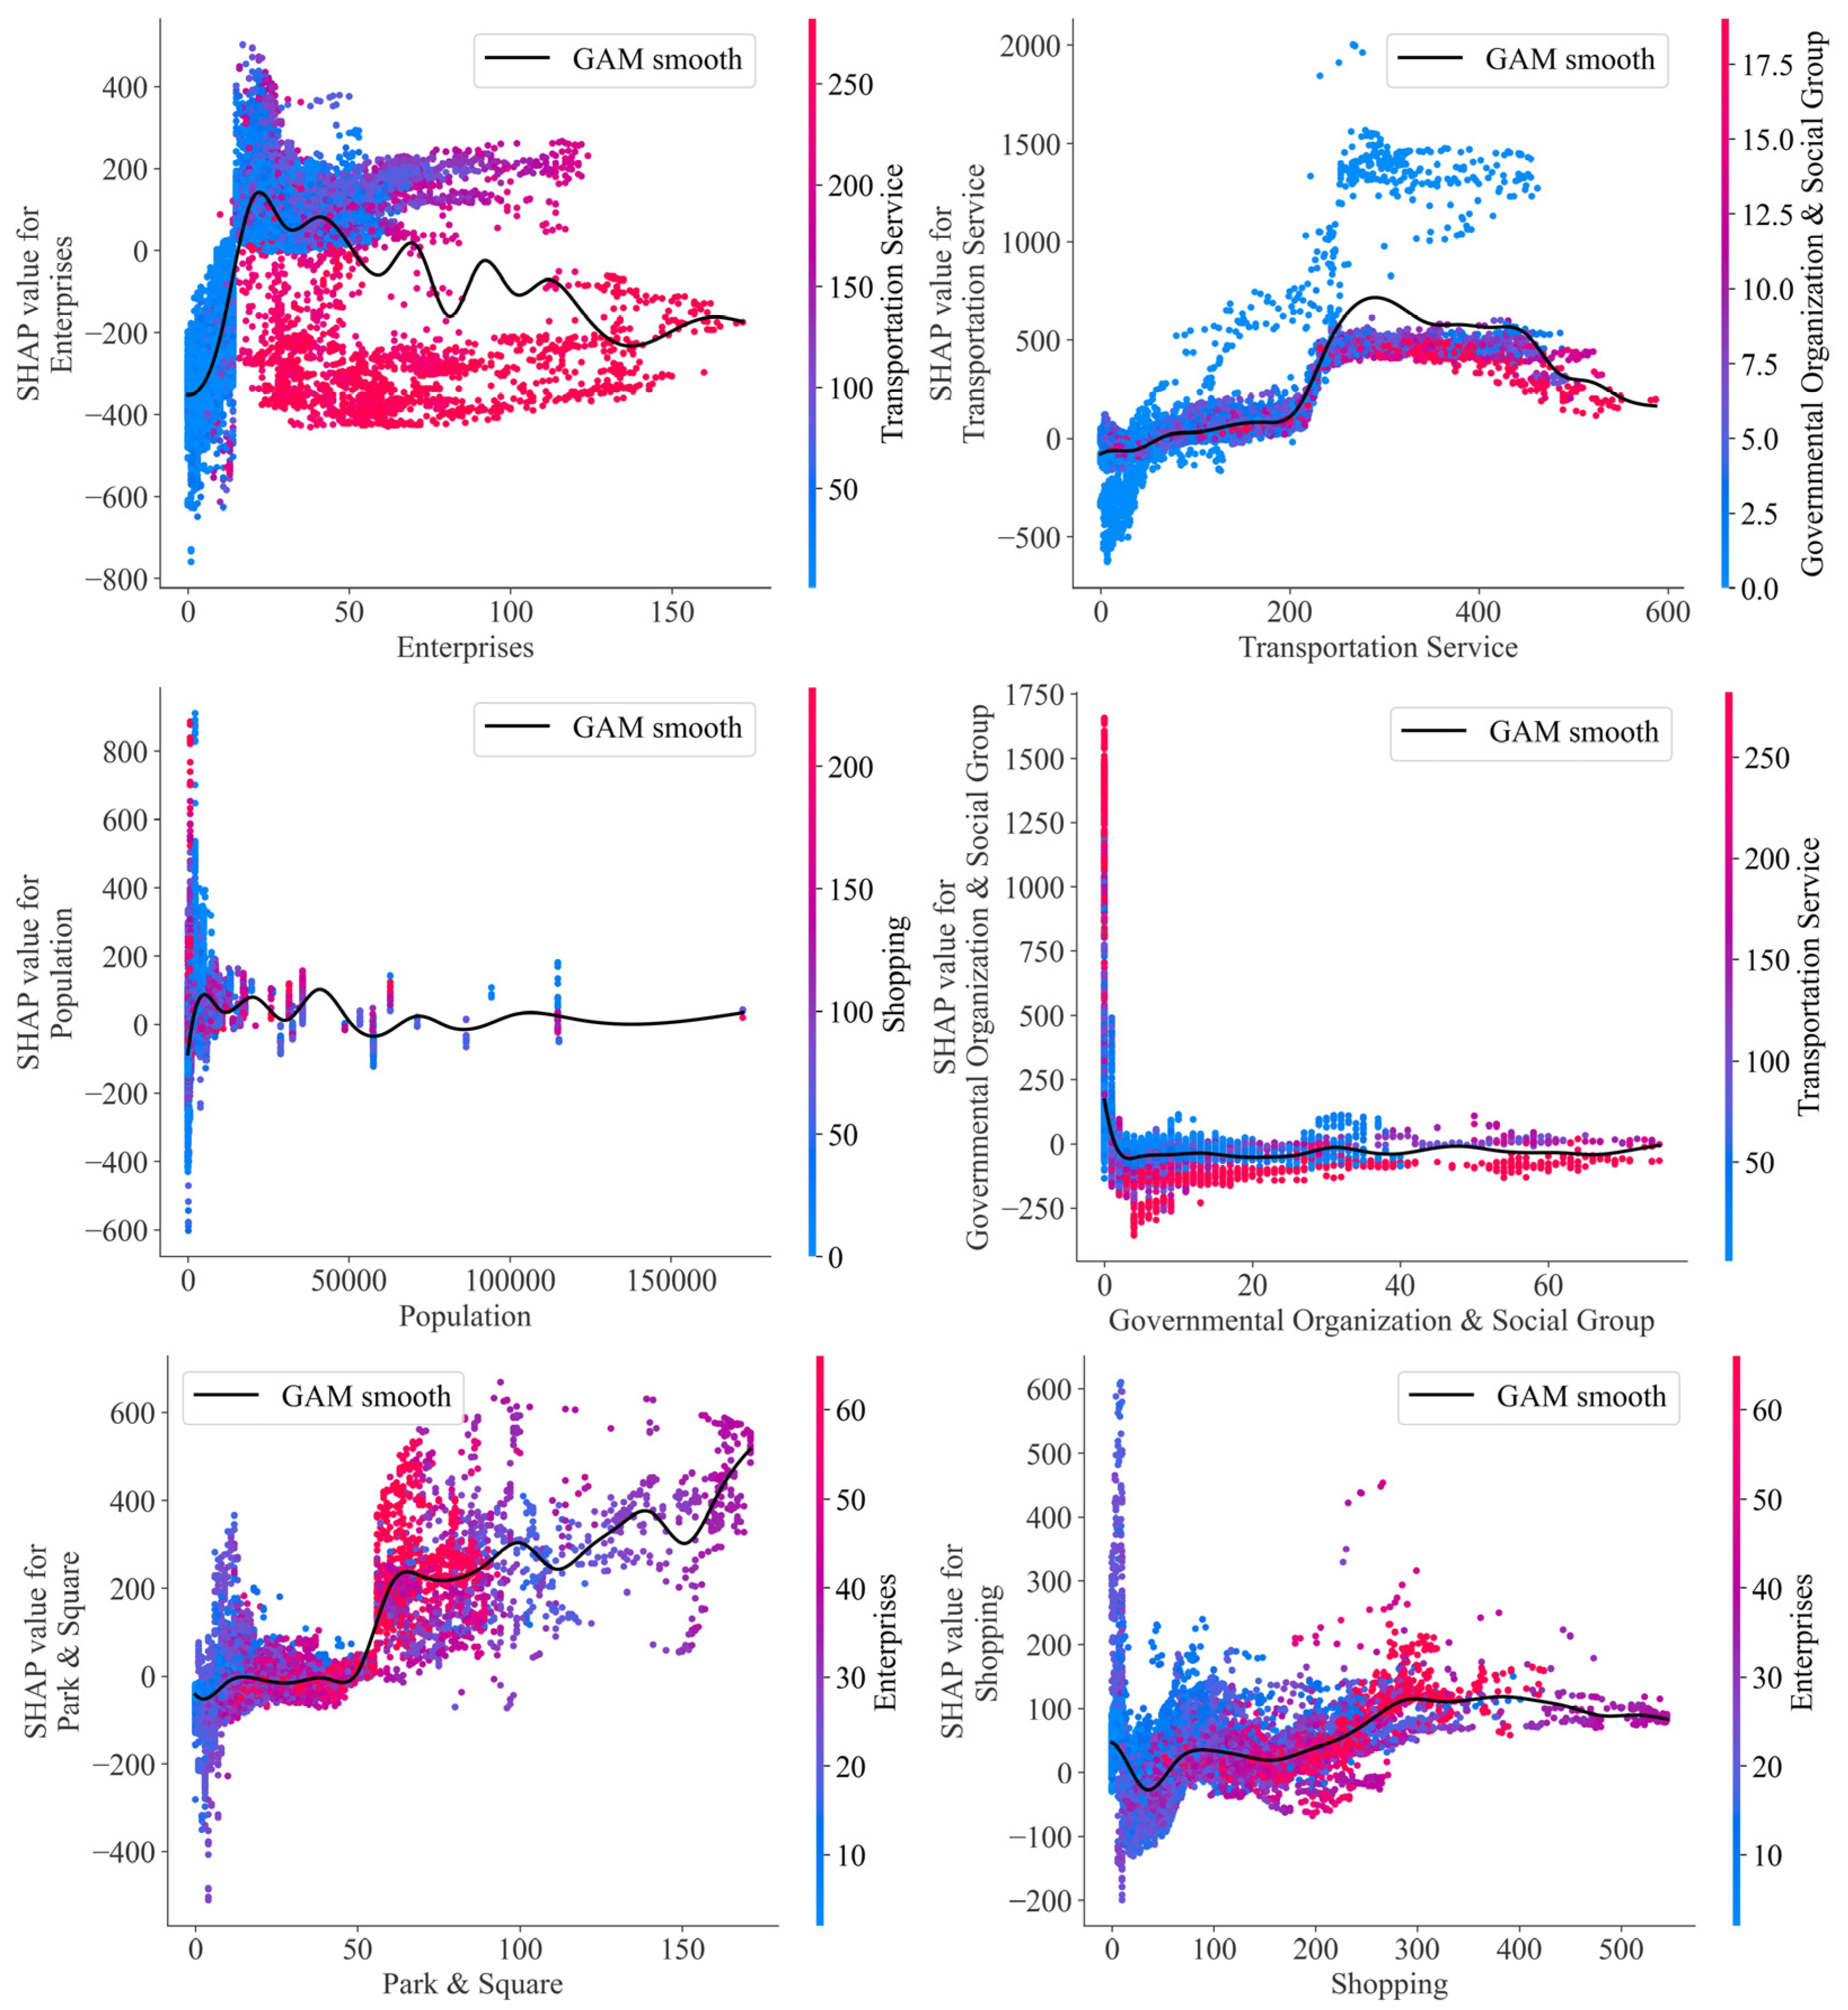
4.2. Nonlinear Relationships Between BE Factors and NMT Vitality

The results of our study demonstrate that the built environment significantly influences the non-motorized traffic patterns of both human-powered and mechanically assisted transportation, and the effects exhibit differentiated and complex local characteristics.

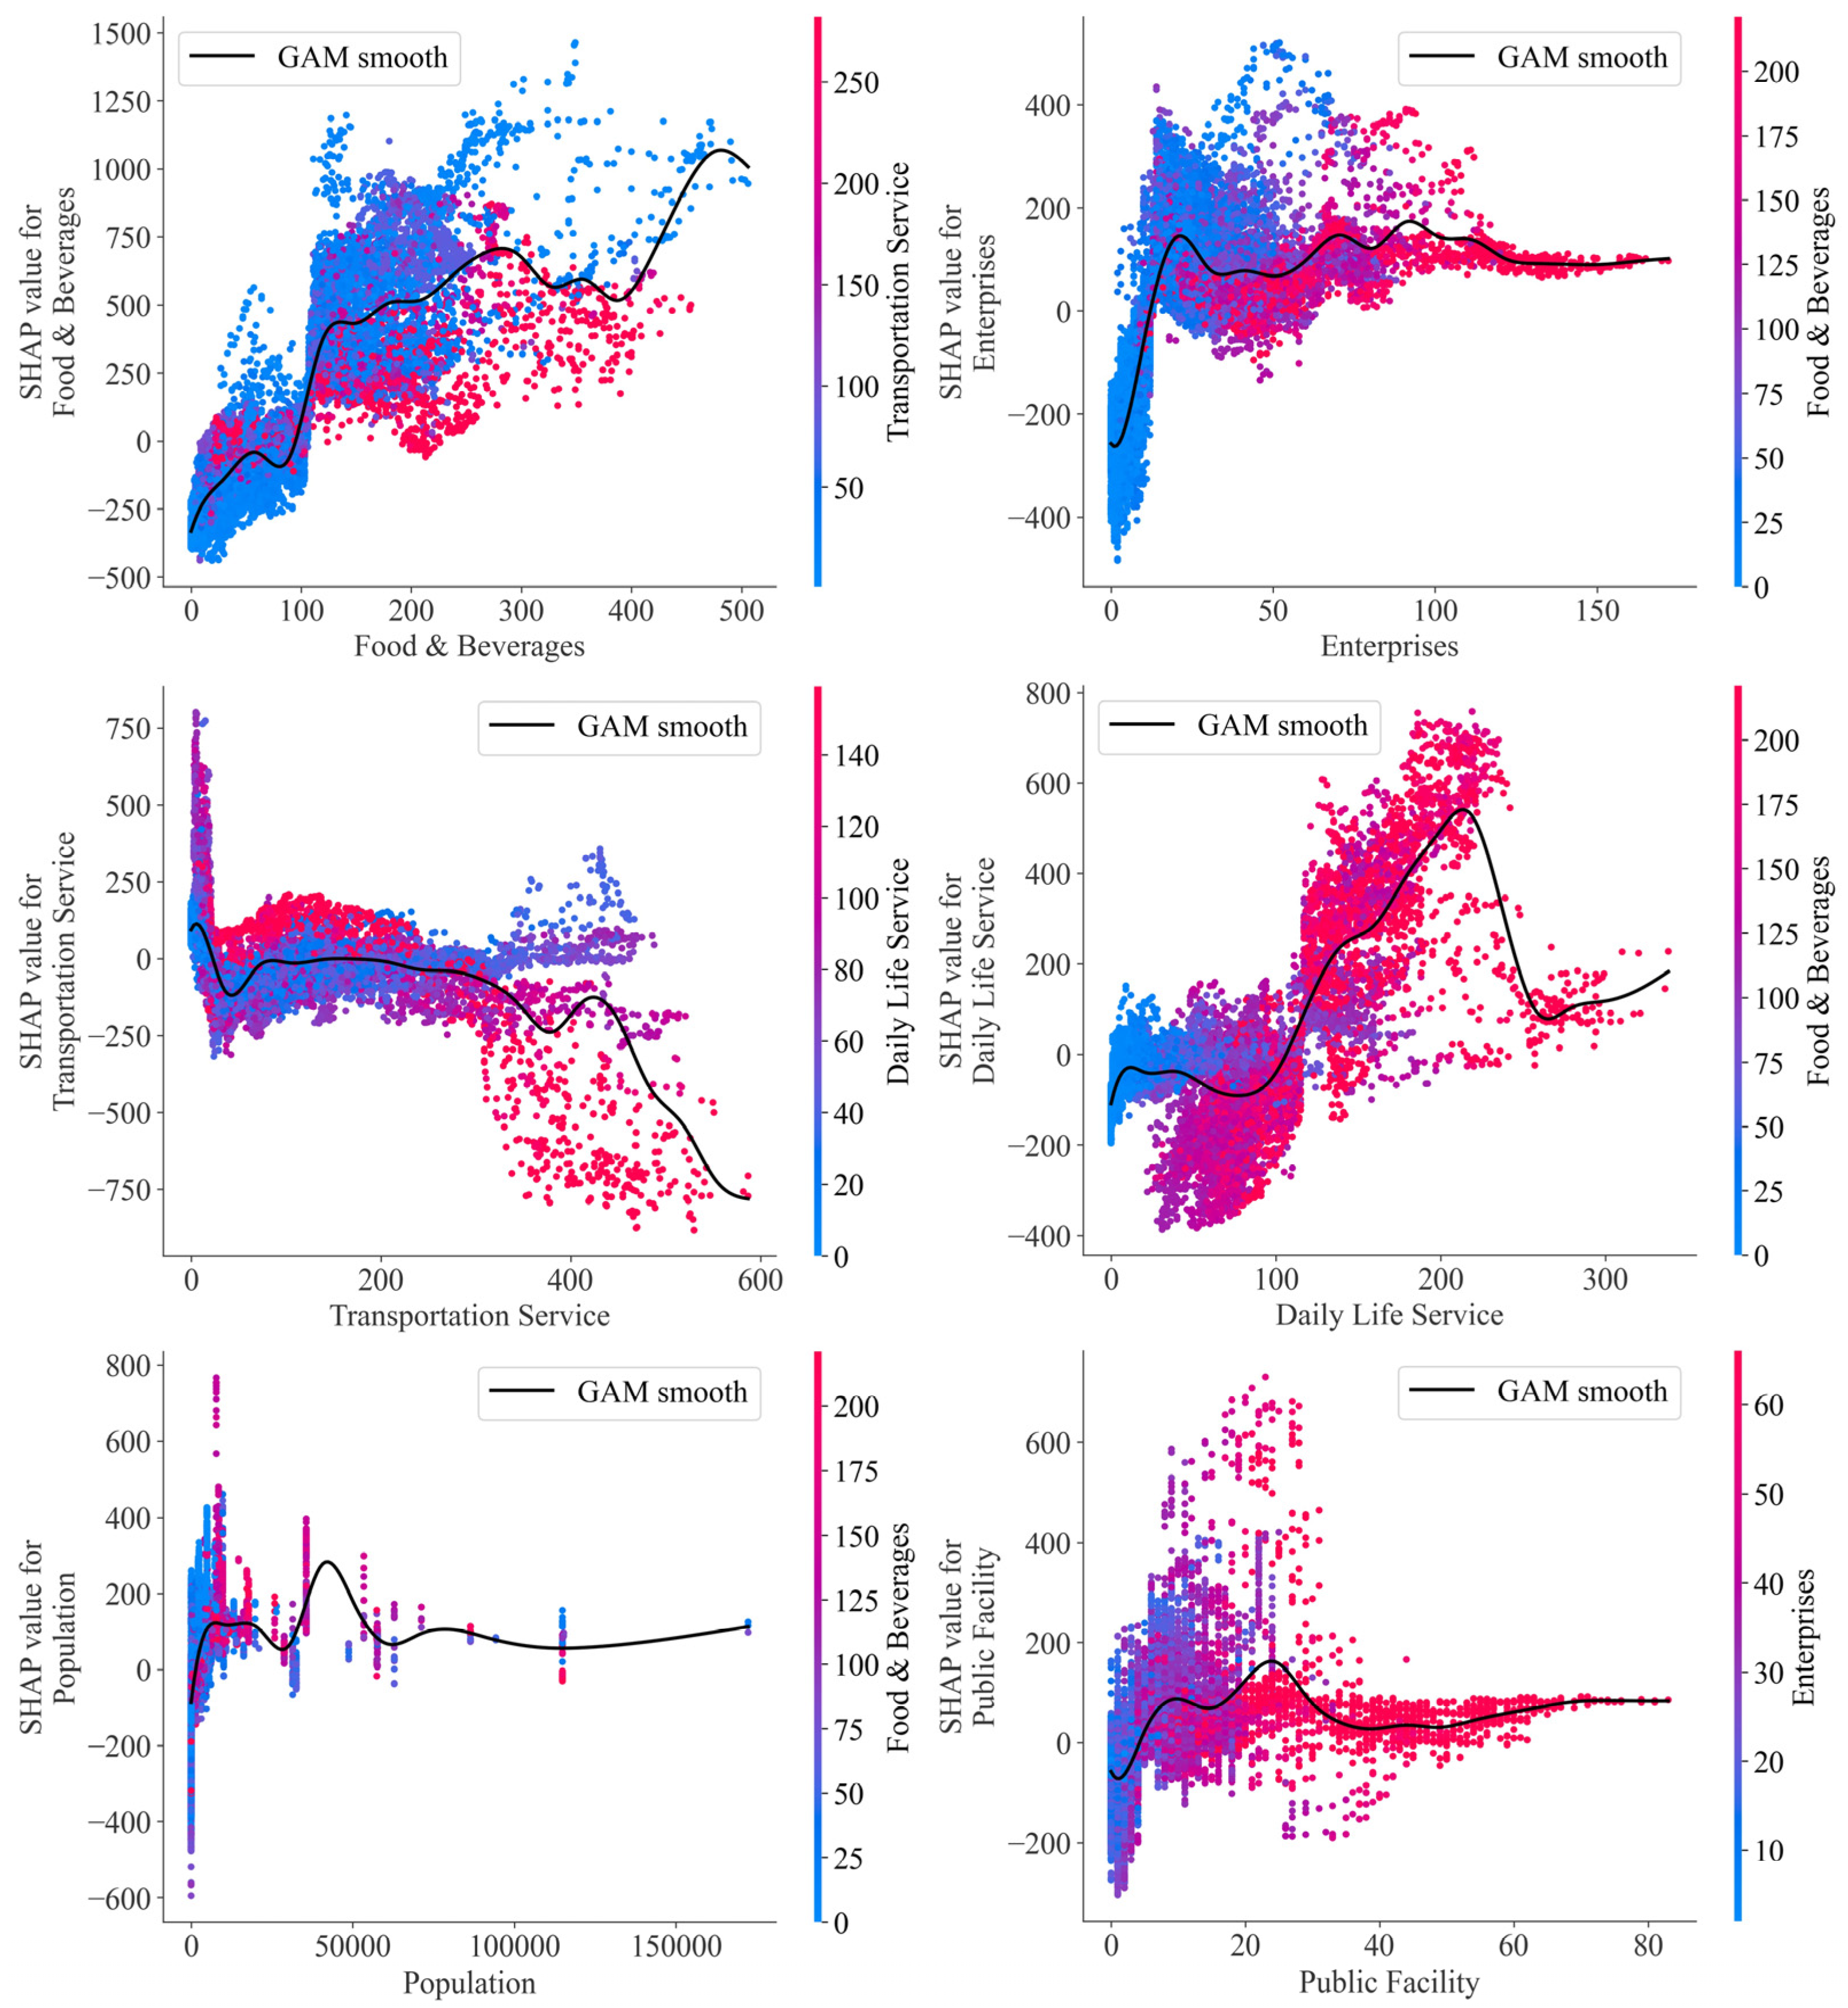
4.2.1. Threshold Effects

The nonlinear impact of BE factors exhibits a turning point where their local effects switch from negative to positive or vice versa. Changes in the rate of increase or decrease in local effects before and after the threshold are often observed, aligning with studies on the nonlinear impact of the built environment on urban vitality [55]. For example, a notable promotion of MA vitality is observed as enterprise density increases beyond 0.2 enterprises/ha.
In our study, we identify two kinds of thresholds: Lower limits, below which a factor has little effect. For example, HP’s NMT vitality only rises once food and beverage density exceeds two stores/ha. Upper limits, beyond which extra increases no longer help. For example, MA’s NMT vitality plateaus once transport services exceed eight facilities/ha. Recognizing these bounds helps planners target the detailed rules where each factor most effectively boosts non-motorized transport.

4.2.2. Synergistic Effects

Nonlinear effects exist when a built environment factor can be amplified or diminished by changes in another factor. In particular, when factors from different dimensions meet under specific conditions, they produce significant synergistic effects, supporting the amenities theory [56,57,58]. For instance, for HP’s NMT vitality, a synergistic effect is observed when the density of public facilities is within the range of 0.2 to 0.8 facilities/ha, combined with enterprises at a moderate density of around 0.6 to 1 enterprise/ha. This confirmed that considering only one dimension is often insufficient when implementing NMT facilities or road planning to enhance vitality. Instead, policy-makers should take into account the circumstances of other built environment factors to achieve synergy and avoid negative interactions.

4.2.3. Spatial Clustering Effects

H-L clusters reveal asymmetric suppression effects, where dominant HP infrastructure (e.g., pedestrian zones or bike lanes) inadvertently restricts MA integration, creating trade-offs between accessibility and sustainability. Conversely, L-H clusters demonstrate over-reliance inertia, where car-centric design displaces walkability, reflecting nonlinear thresholds where MA saturation erodes opportunities for HP reclamation. H-H clusters highlight synergistic scaling, where the optimized coexistence of HP and MA amplifies network efficiency through multiplicative gains. L-L clusters, despite their balanced infrastructure potential, suffer from latent interaction deficits—neither mode thrives due to fragmented land use policies or insufficient demand triggers.
These dynamics underscore that HP and MA are nonlinearly interdependent, not merely competing forces. For example, in H-L clusters, HP vitality plateaus once MA infrastructure exceeds a critical threshold, triggering congestion that degrades pedestrian appeal. Similarly, L-H clusters exhibit tipping points where MA density surpasses a threshold, nonlinearly suppressing pedestrian activity via safety declines or route fragmentation. H-H clusters, by contrast, achieve super-linear returns when HP and MA networks intersect strategically. This nonlinear framework challenges linear planning models, emphasizing that mobility outcomes depend on threshold-crossing, context-dependent interactions, and phase shifts between modes rather than isolated investments.

5. Conclusions

This study demonstrates that built environment factors and non-motorized transportation vitality interact in highly nonlinear ways, with clear threshold and synergistic effects, and distinct spatial clusters that demand tailored interventions. Leveraging street view images and geospatial big data, twenty-three BE factors were systematically extracted, and human-powered NMT was distinguished from mechanically assisted NMT. Through comparative modeling—random forest, XGBoost, and OLS regressions—the analysis revealed that nonlinear models outperformed linear counterparts, underscoring the non-additive nature of relationships between the built environment and NMT. Specifically, threshold effects emerged. For instance, a notable promotion in MA NMT vitality is observed as enterprise density increases beyond 0.2 enterprises/ha, while HP NMT requires more than two stores/ha of food and beverages to boost its vitality. Synergistic effects also dominated, such as the density of public facilities that has a range from 0.2 to 0.8 facilities/ha, when combined with enterprises, which has a range from 0.6 to 1 enterprise/ha, can largely boost the vitality of HP NMT.
These findings challenge linear planning paradigms, advocating instead for adaptive, context-sensitive interventions that account for nonlinear thresholds and cross-mode synergies. For instance, areas identified as H-L clusters, with high human-powered mobility but suppressed mechanically assisted mobility, require recalibration of land use configurations to balance pedestrian dominance with strategic MA integration, such as shared-use pathways alongside transit hubs. Conversely, in L-H clusters, MA-dominant but HP-suppressed zones, demand de-prioritizing car-centric infrastructure while incentivizing compact mixed-use developments to reignite walkability. L-L clusters, marked by dual-mode underperformance, necessitate holistic interventions that simultaneously address fragmented zoning, inadequate transit frequency, and underutilized green spaces. By coupling bivariate Local Moran’s I analysis with SHAP interaction mapping, this study identifies actionable leverage points. Crucially, the spatial heterogeneity of SHAP interactions underscores the need for tailored, cluster-specific strategies rather than uniform policies.
In our study, the street-view images we obtained were captured between June 2019 and August 2021, all during daytime hours. As these images are static and time-specific snapshots, the numbers of pedestrians, cyclists, and e-bikers may fluctuate depending on the capture date, season, weekdays or weekend, and specific time of day (e.g., morning peak, midday, evening peak), and may deviate from the actual NMT activity level. In addition, changes in camera angle, lighting conditions, and occlusions between images may affect the accuracy of the target detection algorithm. These limitations in time and image quality may affect our estimation of NMT vitality. Future work could incorporate multi-temporal, full-season historical street-view imagery and real-time mobile signal data to strengthen the results’ robustness and representativeness. Moreover, COCO images differ from typical Chinese street view images in certain respects, such as the appearance of traffic lights, parking signs, or fire hydrants. Future work may fine-tune the model using local data to mitigate domain shift and further improve detection accuracy.
Moving forward, this research can be advanced through multi-dimensional data fusion, integrating urban morphology, socio-economic demographics, and behavioral patterns to decode why certain BE and NMT relationships emerge. Longitudinal studies may track post-intervention outcomes, such as health improvements from NMT adoption or economic shifts from reduced car dependency, and compare NMT across different demographic groups. Further, an adaptive computational framework can be implemented using AutoML platforms (e.g., H2O AutoML, Auto-sklearn) to automatically benchmark multiple algorithms and hyperparameter configurations, simplifying model selection and reducing human bias, and using a modular framework that allows new built environment variables to be added or modified. By bridging predictive analytics with causal inference, this work aims to deliver adaptive, evidence-driven frameworks that evolve with urban dynamics, ensuring NMT initiatives not only enhance mobility but also foster inclusive, resilient cities.

Author Contributions

Conceptualization, Y.R. and X.Z.; methodology, X.Z.; software, X.Z.; validation, X.C. and Y.R.; formal analysis, Y.R.; investigation, X.C.; resources, X.Z.; data curation, Y.R. and X.Z.; writing—original draft preparation, Y.R.; writing—review and editing, Q.C. and S.W.; visualization, Y.R.; supervision, Q.C. and S.W.; visualization; project administration, Q.C.; funding acquisition, Y.R. and X.Z. All authors have read and agreed to the published version of the manuscript.

Funding

This research was supported by the Joint Funds of the Zhejiang Provincial Natural Science Foundation of China under Grant No. LHZY24A010001; and the Key R&D Program of Zhejiang (No.2024C03234); and the Talent introduction Program Youth Project of the Chinese Academy of Sciences (E43302020D, E2Z105010F).

Data Availability Statement

The data presented in this study are available on request from the corresponding author.

Conflicts of Interest

The authors declare no conflicts of interest.

Note

1
The threshold of 100 stores per analysis unit corresponds to ≈2 stores per hectare (stores/ha), calculated based on the standard area of the analysis unit (4002π m2 ≈ 0.0503 ha). Subsequent references to facility density will report values exclusively in stores/ha.

References

  1. Balsas, C. Blending Individual Tenacity with Government’s Responsibility in the Implementation of US Non-Motorized Transportation Planning (NMT). Plan. Pract. Res. 2017, 32, 197–211. [Google Scholar] [CrossRef]
  2. Mansoor, U.; Kashifi, M.T.; Safi, F.R.; Rahman, S.M. A Review of Factors and Benefits of Non-Motorized Transport: A Way Forward for Developing Countries. Environ. Dev. Sustain. 2022, 24, 1560–1582. [Google Scholar] [CrossRef]
  3. Næss, P. Built Environment, Causality and Travel. Transp. Rev. 2015, 35, 275–291. [Google Scholar] [CrossRef]
  4. Nag, D.; Sen, J.; Goswami, A.K. Measuring Connectivity of Pedestrian Street Networks in the Built Environment for Walking: A Space-Syntax Approach. Transp. Dev. Econ. 2022, 8, 34. [Google Scholar] [CrossRef]
  5. Miranda-Moreno, L.F.; Morency, P.; El-Geneidy, A.M. The Link between Built Environment, Pedestrian Activity and Pedestrian–Vehicle Collision Occurrence at Signalized Intersections. Accid. Anal. Prev. 2011, 43, 1624–1634. [Google Scholar] [CrossRef] [PubMed]
  6. Mirzakhani, A.; Behzadfar, M.; Turró, M. Pedestrian Movement Patterns in Historical Urban Fabrics. GeoJournal 2023, 88, 6483–6506. [Google Scholar] [CrossRef]
  7. Cao, X. (Jason); Mokhtarian, P.L.; Handy, S.L. The Relationship between the Built Environment and Nonwork Travel: A Case Study of Northern California. Transp. Res. Part A Policy Pract. 2009, 43, 548–559. [Google Scholar] [CrossRef]
  8. Liu, C.; Shen, Q. An Empirical Analysis of the Influence of Urban Form on Household Travel and Energy Consumption. Comput. Environ. Urban Syst. 2011, 35, 347–357. [Google Scholar] [CrossRef]
  9. Ewing, R.; Cervero, R. Travel and the Built Environment: A Meta-Analysis. J. Am. Plan. Assoc. 2010, 76, 265–294. [Google Scholar] [CrossRef]
  10. Lanzini, P.; Stocchetti, A. From Techno-Centrism to Socio-Centrism: The Evolution of Principles for Urban Sustainable Mobility. Int. J. Sustain. Transp. 2021, 15, 815–825. [Google Scholar] [CrossRef]
  11. Rahul, T.M.; Verma, A. Study of Impact of Various Influencing Factors on NMT Mode Choice. Procedia—Soc. Behav. Sci. 2013, 104, 1112–1119. [Google Scholar] [CrossRef]
  12. Bautista-Hernández, D.A. Mode Choice in Commuting and the Built Environment in México City. Is There a Chance for Non-Motorized Travel? J. Transp. Geogr. 2021, 92, 103024. [Google Scholar] [CrossRef]
  13. Gehrke, S.R.; Wang, L. Operationalizing the Neighborhood Effects of the Built Environment on Travel Behavior. J. Transp. Geogr. 2020, 82, 102561. [Google Scholar] [CrossRef]
  14. Khan, M.; Kockelman, K.M.; Xiong, X. Models for Anticipating Non-Motorized Travel Choices, and the Role of the Built Environment. Transp. Policy 2014, 35, 117–126. [Google Scholar] [CrossRef]
  15. Basu, N.; Oviedo-Trespalacios, O.; King, M.; Kamruzzaman, M.; Haque, M.M. The Influence of the Built Environment on Pedestrians’ Perceptions of Attractiveness, Safety and Security. Transp. Res. Part F Traffic Psychol. Behav. 2022, 87, 203–218. [Google Scholar] [CrossRef]
  16. Cheng, Y.-T.; Lin, J.-J. The Associations of Built Environments with Public Bike Use for Metro Commuters. Transp. Plan. Technol. 2024, 47, 903–921. [Google Scholar] [CrossRef]
  17. Zhang, Y.; Thomas, T.; Brussel, M.; van Maarseveen, M. Exploring the Impact of Built Environment Factors on the Use of Public Bikes at Bike Stations: Case Study in Zhongshan, China. J. Transp. Geogr. 2017, 58, 59–70. [Google Scholar] [CrossRef]
  18. Hu, Y.; Sobhani, A.; Ettema, D. To E-Bike or Not to e-Bike? A Study of the Impact of the Built Environment on Commute Mode Choice in Small Chinese City. JTLU 2021, 14, 479–497. [Google Scholar] [CrossRef]
  19. Yu, Y.; Jiang, Y.; Qiu, N.; Guo, H.; Han, X.; Guo, Y. Exploring Built Environment Factors on E-Bike Travel Behavior in Urban China: A Case Study of Jinan. Front. Public Health 2022, 10, 1013421. [Google Scholar] [CrossRef]
  20. Hankey, S.; Zhang, W.; Le, H.T.K.; Hystad, P.; James, P. Predicting Bicycling and Walking Traffic Using Street View Imagery and Destination Data. Transp. Res. Part D Transp. Environ. 2021, 90, 102651. [Google Scholar] [CrossRef]
  21. Larkin, A.; Hystad, P. Evaluating Street View Exposure Measures of Visible Green Space for Health Research. J. Expo. Sci. Environ. Epidemiol. 2019, 29, 447–456. [Google Scholar] [CrossRef] [PubMed]
  22. Ito, K.; Bansal, P.; Biljecki, F. Examining the Causal Impacts of the Built Environment on Cycling Activities Using Time-Series Street View Imagery. Transp. Res. Part A Policy Pract. 2024, 190, 104286. [Google Scholar] [CrossRef]
  23. Ito, K.; Zhu, Y.; Abdelrahman, M.; Liang, X.; Fan, Z.; Hou, Y.; Zhao, T.; Ma, R.; Fujiwara, K.; Ouyang, J.; et al. ZenSVI: An Open-Source Software for the Integrated Acquisition, Processing and Analysis of Street View Imagery towards Scalable Urban Science. Comput. Environ. Urban Syst. 2025, 119, 102283. [Google Scholar] [CrossRef]
  24. Barbierato, E.; Bernetti, I.; Capecchi, I.; Saragosa, C. Integrating Remote Sensing and Street View Images to Quantify Urban Forest Ecosystem Services. Remote Sens. 2020, 12, 329. [Google Scholar] [CrossRef]
  25. Yue, H.; Xie, H.; Liu, L.; Chen, J. Detecting People on the Street and the Streetscape Physical Environment from Baidu Street View Images and Their Effects on Community-Level Street Crime in a Chinese City. IJGI 2022, 11, 151. [Google Scholar] [CrossRef]
  26. Wu, F.; Li, W.; Qiu, W. Examining Non-Linear Relationship between Streetscape Features and Propensity of Walking to School in Hong Kong Using Machine Learning Techniques. J. Transp. Geogr. 2023, 113, 103698. [Google Scholar] [CrossRef]
  27. Lei, Y.; Peng, D.; Zhang, P.; Ke, Q.; Li, H. Hierarchical Paired Channel Fusion Network for Street Scene Change Detection. IEEE Trans. Image Process. 2021, 30, 55–67. [Google Scholar] [CrossRef]
  28. Wang, Y.; Wang, S.; Wang, X.; Huang, X.; Li, X.; Zhang, X.; Li, Z. Dynamic Visual Landscape Assessment of Disused Railway in Complex Terrain: A Study of Jingmen Railway. IEEE J. Sel. Top. Appl. Earth Obs. Remote Sens. 2024, 17, 10877–10892. [Google Scholar] [CrossRef]
  29. Liu, C.; Huang, H.; Melack, J.M.; Tian, Y.; Jiang, J.; Fu, X.; Cao, Z.; Wang, S. Assessing Land Degradation and Restoration in Eastern China Grasslands from 1985 to 2018 Using Multitemporal Landsat Data. IEEE J. Sel. Top. Appl. Earth Obs. Remote Sens. 2024, 17, 19328–19342. [Google Scholar] [CrossRef]
  30. Wu, C.; Kim, I.; Chung, H. The Effects of Built Environment Spatial Variation on Bike-Sharing Usage: A Case Study of Suzhou, China. Cities 2021, 110, 103063. [Google Scholar] [CrossRef]
  31. Sharma, T.; Jain, S. Nexus between Built Environment, Travel Behaviour and Human Health: An Integrated Framework to Reinform Transport System. J. Clean. Prod. 2023, 416, 137744. [Google Scholar] [CrossRef]
  32. Li, Y.; Zhang, C.; Wang, C.; Cheng, Z. Human Perception Evaluation System for Urban Streetscapes Based on Computer Vision Algorithms with Attention Mechanisms. Trans. GIS 2022, 26, 2440–2454. [Google Scholar] [CrossRef]
  33. Feuillet, T.; Salze, P.; Charreire, H.; Menai, M.; Enaux, C.; Perchoux, C.; Hess, F.; Kesse-Guyot, E.; Hercberg, S.; Simon, C.; et al. Built Environment in Local Relation with Walking: Why Here and Not There? J. Transp. Health 2016, 3, 500–512. [Google Scholar] [CrossRef]
  34. Tao, T.; Wu, X.; Cao, J.; Fan, Y.; Das, K.; Ramaswami, A. Exploring the Nonlinear Relationship between the Built Environment and Active Travel in the Twin Cities. J. Plan. Educ. Res. 2023, 43, 637–652. [Google Scholar] [CrossRef]
  35. Qin, K.; Xu, Y.; Kang, C.; Kwan, M. A Graph Convolutional Network Model for Evaluating Potential Congestion Spots Based on Local Urban Built Environments. Trans. GIS 2020, 24, 1382–1401. [Google Scholar] [CrossRef]
  36. Xiao, W.; Wei, Y.D. Assess the Non-Linear Relationship between Built Environment and Active Travel around Light-Rail Transit Stations. Appl. Geogr. 2023, 151, 102862. [Google Scholar] [CrossRef]
  37. Ding, C.; Cao, X.; Dong, M.; Zhang, Y.; Yang, J. Non-Linear Relationships between Built Environment Characteristics and Electric-Bike Ownership in Zhongshan, China. Transp. Res. Part D Transp. Environ. 2019, 75, 286–296. [Google Scholar] [CrossRef]
  38. Xu, Y.; Yan, X.; Liu, X.; Zhao, X. Identifying Key Factors Associated with Ridesplitting Adoption Rate and Modeling Their Nonlinear Relationships. Transp. Res. Part A Policy Pract. 2021, 144, 170–188. [Google Scholar] [CrossRef]
  39. Rui, J.; Xu, Y. Beyond Built Environment: Unveiling the Interplay of Streetscape Perceptions and Cycling Behavior. Sustain. Cities Soc. 2024, 109, 105525. [Google Scholar] [CrossRef]
  40. Hatami, F.; Rahman, M.M.; Nikparvar, B.; Thill, J.-C. Non-Linear Associations Between the Urban Built Environment and Commuting Modal Split: A Random Forest Approach and SHAP Evaluation. IEEE Access 2023, 11, 12649–12662. [Google Scholar] [CrossRef]
  41. Bone, C.; Wulder, M.A.; White, J.C.; Robertson, C.; Nelson, T.A. A GIS-Based Risk Rating of Forest Insect Outbreaks Using Aerial Overview Surveys and the Local Moran’s I Statistic. Appl. Geogr. 2013, 40, 161–170. [Google Scholar] [CrossRef]
  42. Zhang, X.; Li, W.; Zhang, F.; Liu, R.; Du, Z. Identifying Urban Functional Zones Using Public Bicycle Rental Records and Point-of-Interest Data. IJGI 2018, 7, 459. [Google Scholar] [CrossRef]
  43. Zhang, X.; Chen, Y.; Zhong, Y. Spatial and Temporal Characteristic Analysis of Imbalance Usage in the Hangzhou Public Bicycle System. IJGI 2021, 10, 637. [Google Scholar] [CrossRef]
  44. Zhu, H.; Nan, X.; Yang, F.; Bao, Z. Utilizing the Green View Index to Improve the Urban Street Greenery Index System: A Statistical Study Using Road Patterns and Vegetation Structures as Entry Points. Landsc. Urban Plan. 2023, 237, 104780. [Google Scholar] [CrossRef]
  45. Zhou, L.; Dang, X.; Sun, Q.; Wang, S. Multi-Scenario Simulation of Urban Land Change in Shanghai by Random Forest and CA-Markov Model. Sustain. Cities Soc. 2020, 55, 102045. [Google Scholar] [CrossRef]
  46. Ewing, R.; Handy, S. Measuring the Unmeasurable: Urban Design Qualities Related to Walkability. J. Urban Des. 2009, 14, 65–84. [Google Scholar] [CrossRef]
  47. Nasar, J.L. Urban Design Aesthetics: The Evaluative Qualities of Building Exteriors. Environ. Behav. 1994, 26, 377–401. [Google Scholar] [CrossRef]
  48. Salleh, B.S.; Rahmat, R.A.A.O.; Ismail, A. Research Article A Study on Non-Motorised (NMT) Activities for Urban Environment. Res. J. Appl. Sci. Eng. Technol. 2014, 7, 290–295. [Google Scholar] [CrossRef]
  49. Handy, S.L. Urban Form and Pedestrian Choices: Study of Austin Neighborhoods. Transp. Res. Rec. J. Transp. Res. Board 1996, 1552, 135–144. [Google Scholar] [CrossRef]
  50. Ewing, R.; Dumbaugh, E. The Built Environment and Traffic Safety: A Review of Empirical Evidence. J. Plan. Lit. 2009, 23, 347–367. [Google Scholar] [CrossRef]
  51. Arellana, J.; Saltarín, M.; Larrañaga, A.M.; Alvarez, V.; Henao, C.A. Urban Walkability Considering Pedestrians’ Perceptions of the Built Environment: A 10-Year Review and a Case Study in a Medium-Sized City in Latin America. Transp. Rev. 2020, 40, 183–203. [Google Scholar] [CrossRef]
  52. Alabi, R.O.; Elmusrati, M.; Leivo, I.; Almangush, A.; Mäkitie, A.A. Machine Learning Explainability in Nasopharyngeal Cancer Survival Using LIME and SHAP. Sci. Rep. 2023, 13, 8984. [Google Scholar] [CrossRef]
  53. Lundberg, S.M.; Lee, S.-I. A Unified Approach to Interpreting Model Predictions. In Proceedings of the Advances in Neural Information Processing Systems; Guyon, I., Luxburg, U.V., Bengio, S., Wallach, H., Fergus, R., Vishwanathan, S., Garnett, R., Eds.; Curran Associates, Inc.: Red Hook, NY, USA, 2017; Volume 30, ISBN 9781510860964. [Google Scholar]
  54. Rao, J.; Ma, J.; Dong, G. How Mobility-Based Exposure to Green Space and Environmental Pollution Influence Individuals’ Wellbeing? A Structural Equation Analysis through the Lens of Environmental Justice. Landsc. Urban Plan. 2024, 252, 105199. [Google Scholar] [CrossRef]
  55. Xiao, L.; Lo, S.; Liu, J.; Zhou, J.; Li, Q. Nonlinear and Synergistic Effects of TOD on Urban Vibrancy: Applying Local Explanations for Gradient Boosting Decision Tree. Sustain. Cities Soc. 2021, 72, 103063. [Google Scholar] [CrossRef]
  56. Carlino, G.A.; Saiz, A. Beautiful City: Leisure Amenities and Urban Growth. J. Reg. Sci. 2019, 59, 369–408. [Google Scholar] [CrossRef]
  57. Clark, T.N.; Lloyd, R.; Wong, K.K.; Jain, P. Amenities Drive Urban Growth. J. Urban Aff. 2002, 24, 493–515. [Google Scholar] [CrossRef]
  58. Wang, M. Polycentric Urban Development and Urban Amenities: Evidence from Chinese Cities. Environ. Plan. B Urban Anal. City Sci. 2021, 48, 400–416. [Google Scholar] [CrossRef]
Figure 1. Study area: Binjiang District in the city of Hangzhou.
Land 14 01347 g001
Figure 2. Research framework and three interconnected modules.
Land 14 01347 g002
Figure 3. Object detection from Street View Images.
Land 14 01347 g003
Figure 4. Pearson correlation coefficients of factors.
Land 14 01347 g004
Figure 5. SHAP values of built environment factors for HP and MA scenarios.
Land 14 01347 g005
Figure 6. Interaction importance of top six built environment factors on HP.
Land 14 01347 g006
Figure 7. Interaction importance of top six built environment factors on MA.
Land 14 01347 g007
Figure 8. Factor effects and interactions in three types of low-vitality clusters.
Land 14 01347 g008
Table 1. Built-environment factors and data sources associated with the four comfort states.
CategoryFactorsAbbreviationData Source
Esthetic comfortPark and SquarePKSPOI
Building Height-to-Width RatioBHRBaidu buildings
Building DensityBDBaidu buildings
Functional comfortParking MeterPMStreet view
Food and BeveragesFBPOI
Public FacilityPFPOI
EnterprisesENTsPOI
ShoppingSPOI
Transportation ServiceTSPOI
Finance and Insurance ServiceFISPOI
Commercial HouseCHPOI
Daily Life ServiceDLSPOI
Sports and RecreationSRPOI
Accommodation ServiceASPOI
Safety comfortTraffic LightTLStreet view
Fire HydrantFHStreet view
Parking SignPGSStreet view
Medical ServiceMSPOI
Social comfortCats and DogsCDsStreet view
ResidentsRsMobile data
EmployeesEMPsMobile data
Science/Culture and Education ServiceSESPOI
Governmental Organization and Social GroupGOSGPOI
Table 2. Detected elements from street view imagery and descriptive statistics.
ElementsMeanRangeMedianStandard DeviationVariable TypeStatistic Method
Pedestrian1243.87[0, 5000]994.13979.24Ykernel density
Bicycle443.78[0, 3828]274.82547.80Ykernel density
E-Bikes218.21[0, 868]218.21166.24Ykernel density
Traffic Light0.21[0, 8]0.000.66Xcount
Fire Hydrant0.02[0, 3]0.000.14Xcount
Parking Sign0.02[0, 2]0.000.13Xcount
Parking Meter0.00[0, 1]0.000.03Xcount
Cats and Dogs0.00[0, 1]0.000.04Xcount
Table 3. The performance of the XGBoost, RF, and OLS models.
ModelRandom ForestXGBoostOLS
HPMAHPMAHPMA
RMSETraining Set554212586617522
Test Set148102171126643546
Adjusted R2Training Set0.9960.9950.9780.9780.4590.216
Test Set0.9700.9650.9600.9570.4380.200
Disclaimer/Publisher’s Note: The statements, opinions and data contained in all publications are solely those of the individual author(s) and contributor(s) and not of MDPI and/or the editor(s). MDPI and/or the editor(s) disclaim responsibility for any injury to people or property resulting from any ideas, methods, instructions or products referred to in the content.

