Article

Water–Energy–Land–Food Nexus Performance and Regional Inequality Toward Low-Carbon Transition in China

1
School of Public Administration, Hohai University, Nanjing 211100, China
2
Sustainable Minerals Institute, The University of Queensland, Brisbane, QLD 4072, Australia
*
Author to whom correspondence should be addressed.
Land 2025, 14(7), 1343; https://doi.org/10.3390/land14071343
Submission received: 22 May 2025 / Revised: 12 June 2025 / Accepted: 21 June 2025 / Published: 24 June 2025

Abstract

The transition to a low-carbon economy in China necessitates an integrated understanding of the interdependencies within the water–energy–land–food (WELF) nexus. This study evaluates the performance of the WELF nexus across Chinese provinces and examines regional disparities that may hinder or facilitate sustainable development goals. Using a multi-dimensional performance index and spatial econometric analysis, we identified key synergies and trade-offs among resource systems under low-carbon policy scenarios. The results revealed significant regional inequalities in nexus efficiency, with economically developed regions exhibiting higher integration and resource optimization, while less-developed areas face persistent structural challenges. These disparities underscore the need for regionally tailored policy interventions that address localized constraints while promoting cohesive national strategies. Our findings provide critical insights for policymakers aiming to align resource management with China’s climate commitments and sustainable development agenda.

1. Introduction

The global urgency to address climate change has shifted attention toward integrated resource management approaches that support sustainable, low-carbon development [1,2]. Among these, the water–energy–land–food (WELF) nexus has emerged as a critical framework to understand and manage the interdependencies among essential resource systems [3]. These systems are deeply interconnected: energy production often requires water and land; agriculture consumes both water and energy while producing food and using land; and land-use changes can impact water availability and carbon emissions [4,5]. Effective management of these interlinked systems is essential for ensuring long-term resource security, environmental sustainability, and social equity—particularly during the transition to a low-carbon economy [6,7].
China, as the world’s largest energy consumer and carbon emitter, is at the center of the global climate challenge [8,9,10]. In 2020, China announced ambitious climate targets: to peak carbon emissions before 2030 and achieve carbon neutrality by 2060 [11]. Achieving these goals requires systemic changes across all sectors of the economy and society, especially in how the country manages its critical resources [12]. The WELF nexus framework offers a powerful lens through which to assess these changes, identify trade-offs and synergies, and guide integrated policy-making to support China’s climate goals [13,14].
However, implementing WELF nexus-based strategies in China is far from straightforward [15]. The country is characterized by immense regional diversity in natural resource endowments, economic development, industrial structures, and governance capacities [16,17]. For example, water scarcity is severe in northern provinces but less so in the south; energy-intensive industries are concentrated in certain inland regions; agricultural productivity varies widely by climate and soil conditions [18]; and land-use conflicts are more acute in rapidly urbanizing eastern provinces [19,20]. These disparities create uneven capacities for integrating and optimizing resource systems in line with low-carbon goals, leading to differentiated WELF nexus performance across regions [21,22]. The WELF nexus highlights the complex and interdependent relationships among key resource systems that are essential for sustainable development [23]. Water is required not only for agricultural irrigation but also for energy production; energy is needed to extract, treat, and transport water, as well as to power agricultural machinery and food processing [24]. Land provides the physical space and ecological basis for both food production and energy infrastructure; and food systems, in turn, depend on efficient and balanced access to all three [25]. A higher degree of correlation among these elements indicates that they are functioning in a more interconnected and coordinated manner, where improvements or constraints in one system are effectively aligned with the conditions of the others. For example, in the water-scarce northwestern provinces of China, agricultural productivity can still be enhanced through the adoption of water-saving irrigation technologies, which integrate water efficiency with land use planning and energy inputs. In such cases, strong linkages between sectors enable regions to overcome individual resource limitations by leveraging systemic synergies. Therefore, a higher correlation between elements reflects not only tighter relationships but also greater potential for adaptive resource management, resilience under environmental stress, and sustainable development outcomes [26,27].
Moreover, China’s regional inequality has long been a structural issue in its development model [28]. While coastal provinces have experienced rapid economic growth and technological advancement, many interior and western regions lag behind in infrastructure, institutional capacity, and environmental governance [29,30]. These inequalities influence the ability of local governments to adopt and enforce low-carbon and nexus-integrated policies effectively [13,14]. As a result, some regions may progress more rapidly toward decarbonization, while others face systemic constraints that slow their transition and deepen developmental gaps [9].
Despite increasing recognition of the WELF nexus in both academic and policy circles, most studies to date have examined isolated subsystems or focused on national-level assessments [20,21,22]. There remains a significant gap in understanding how WELF nexus performance varies across regions, how it interacts with patterns of inequality, and what implications this has for achieving a coordinated low-carbon transition in China [19,20]. A nuanced, regionally disaggregated analysis is essential for informing differentiated policy responses that align with local contexts while contributing to national and global sustainability objectives [4,5].
This study seeks to fill this gap by conducting a comprehensive, province-level evaluation of WELF nexus performance across China, with a specific focus on how regional inequality affects, and is affected by, the low-carbon transition. We construct a multi-dimensional performance index to assess the efficiency, integration, and sustainability of WELF systems in each province. Furthermore, we apply spatial econometric models to investigate the geographic patterns of inequality and identify clusters of high and low performance. By doing so, we aim to answer key questions: Which regions are leading or lagging in WELF nexus integration? What are the drivers of these disparities? And how can policy be tailored to support more balanced and equitable transitions toward a low-carbon future?
Our findings provide empirical evidence to support more region-sensitive strategies in China’s carbon neutrality agenda. By highlighting the spatial dimensions of nexus performance and inequality, this study contributes to the broader discourse on sustainable resource governance, climate justice, and regional development planning.

2. Methodologies and Materials

This study employs the panel entropy method and the comprehensive index evaluation method to construct a composite development index for the WELF nexus across 30 provinces and municipalities in mainland China from 2007 to 2023. Based on this index, a coupling coordination degree model is applied to evaluate the level of coordination among WELF nexus. To examine the dynamic evolution of this coupling coordination over time, this study utilizes three-dimensional kernel density estimation, which provides a visual and statistical representation of the temporal trends in nexus coordination. Furthermore, to identify the key factors influencing the degree of coupling coordination within the WELF nexus, this study conducts regression analysis using a fixed-effects model, thereby controlling for unobserved heterogeneity across regions and over time.

2.1. Methods

Panel Data Entropy Method and Comprehensive Index Evaluation Method

To ensure the objectivity of the evaluation results, the method of range standardization is adopted when the original data are standardized, the panel data entropy method is used for index weight processing, and the comprehensive index evaluation method is used to calculate the comprehensive index. The calculation process is as follows:
(1) Standardized processing
Considering that there are differences in the dimensions of different indicators and the direction of their action on the system, it is impossible to make direct comparisons, and it is necessary to standardize the indicators first.
Positive   indicators : x i j = x i j min x j max x j min x j
Negative   indicators : x i j = max x j x i j max x j min x j
(2) Normalization
P i j = x i j α i x i j
(3) Calculate the entropy value
e j = k i P i j ln P i j
(4) Calculate the weights
w j = 1 e j j 1 e j
(5) Calculate the composite indices of the WELF nexus
S i = x i j × w j

2.2. Coupling Coordination Model

The degree of coupling—also referred to as the performance level—reflects the extent of correlation among the components of the WELF nexus. A higher coupling value indicates a stronger positive correlation, suggesting that the elements are closely linked in their development trajectories. However, a high degree of correlation does not necessarily imply a desirable or balanced state. In fact, such strong correlations may occur at either a high or low level of development, meaning that while the elements move together, they may still be underdeveloped or inefficiently utilized. Therefore, measuring coupling alone is insufficient for evaluating the quality or sustainability of the nexus interactions, and it becomes necessary to further assess the coupling coordination.
The degree of coupling coordination—also referred to as the performance relevance level—captures the extent to which the WELF nexus not only co-evolves but also promotes and reinforces its components in a synergistic manner. A higher coordination value indicates a stronger degree of mutual reinforcement and balanced development across the four systems. In other words, it reflects how well these interconnected subsystems are functioning together to support integrated and sustainable regional development. Assessing coupling coordination thus provides a more comprehensive and meaningful understanding of the functionality and resilience of the WELF nexus.
Coupling coordination analysis is a useful method for examining the interrelationships and the degree of interdependence among various elements or subsystems within a region. Specifically, the degree of coupling reflects the strength of the association or interaction between systems, indicating how closely they influence one another. In contrast, the degree of coupling coordination captures the extent to which these systems develop harmoniously under the influence of their interconnections. It reflects not only the presence of interaction but also the quality and balance of that interaction in terms of mutual promotion and synchronized development. Based on this analytical framework, this study constructs a coupling coordination measurement model. The specific calculation formula is as follows:
C = 4 × S 1 × S 2 × S 3 × S 4 S 1 + S 2 + S 3 + S 4 1 4
D = C × T T = 1 S 1 + 2 S 2 + 3 S 3 + 4 S 4
In the formula, C is the coupling degree, D is the coupling coordination degree, and the value range is 0–1. The larger the value, the higher the level of coupling and coordinated development within the WELF nexus. 1 ,   2 ,   3 , and 4 are the undetermined parameters of the four systems, and the values are each one-fourth.

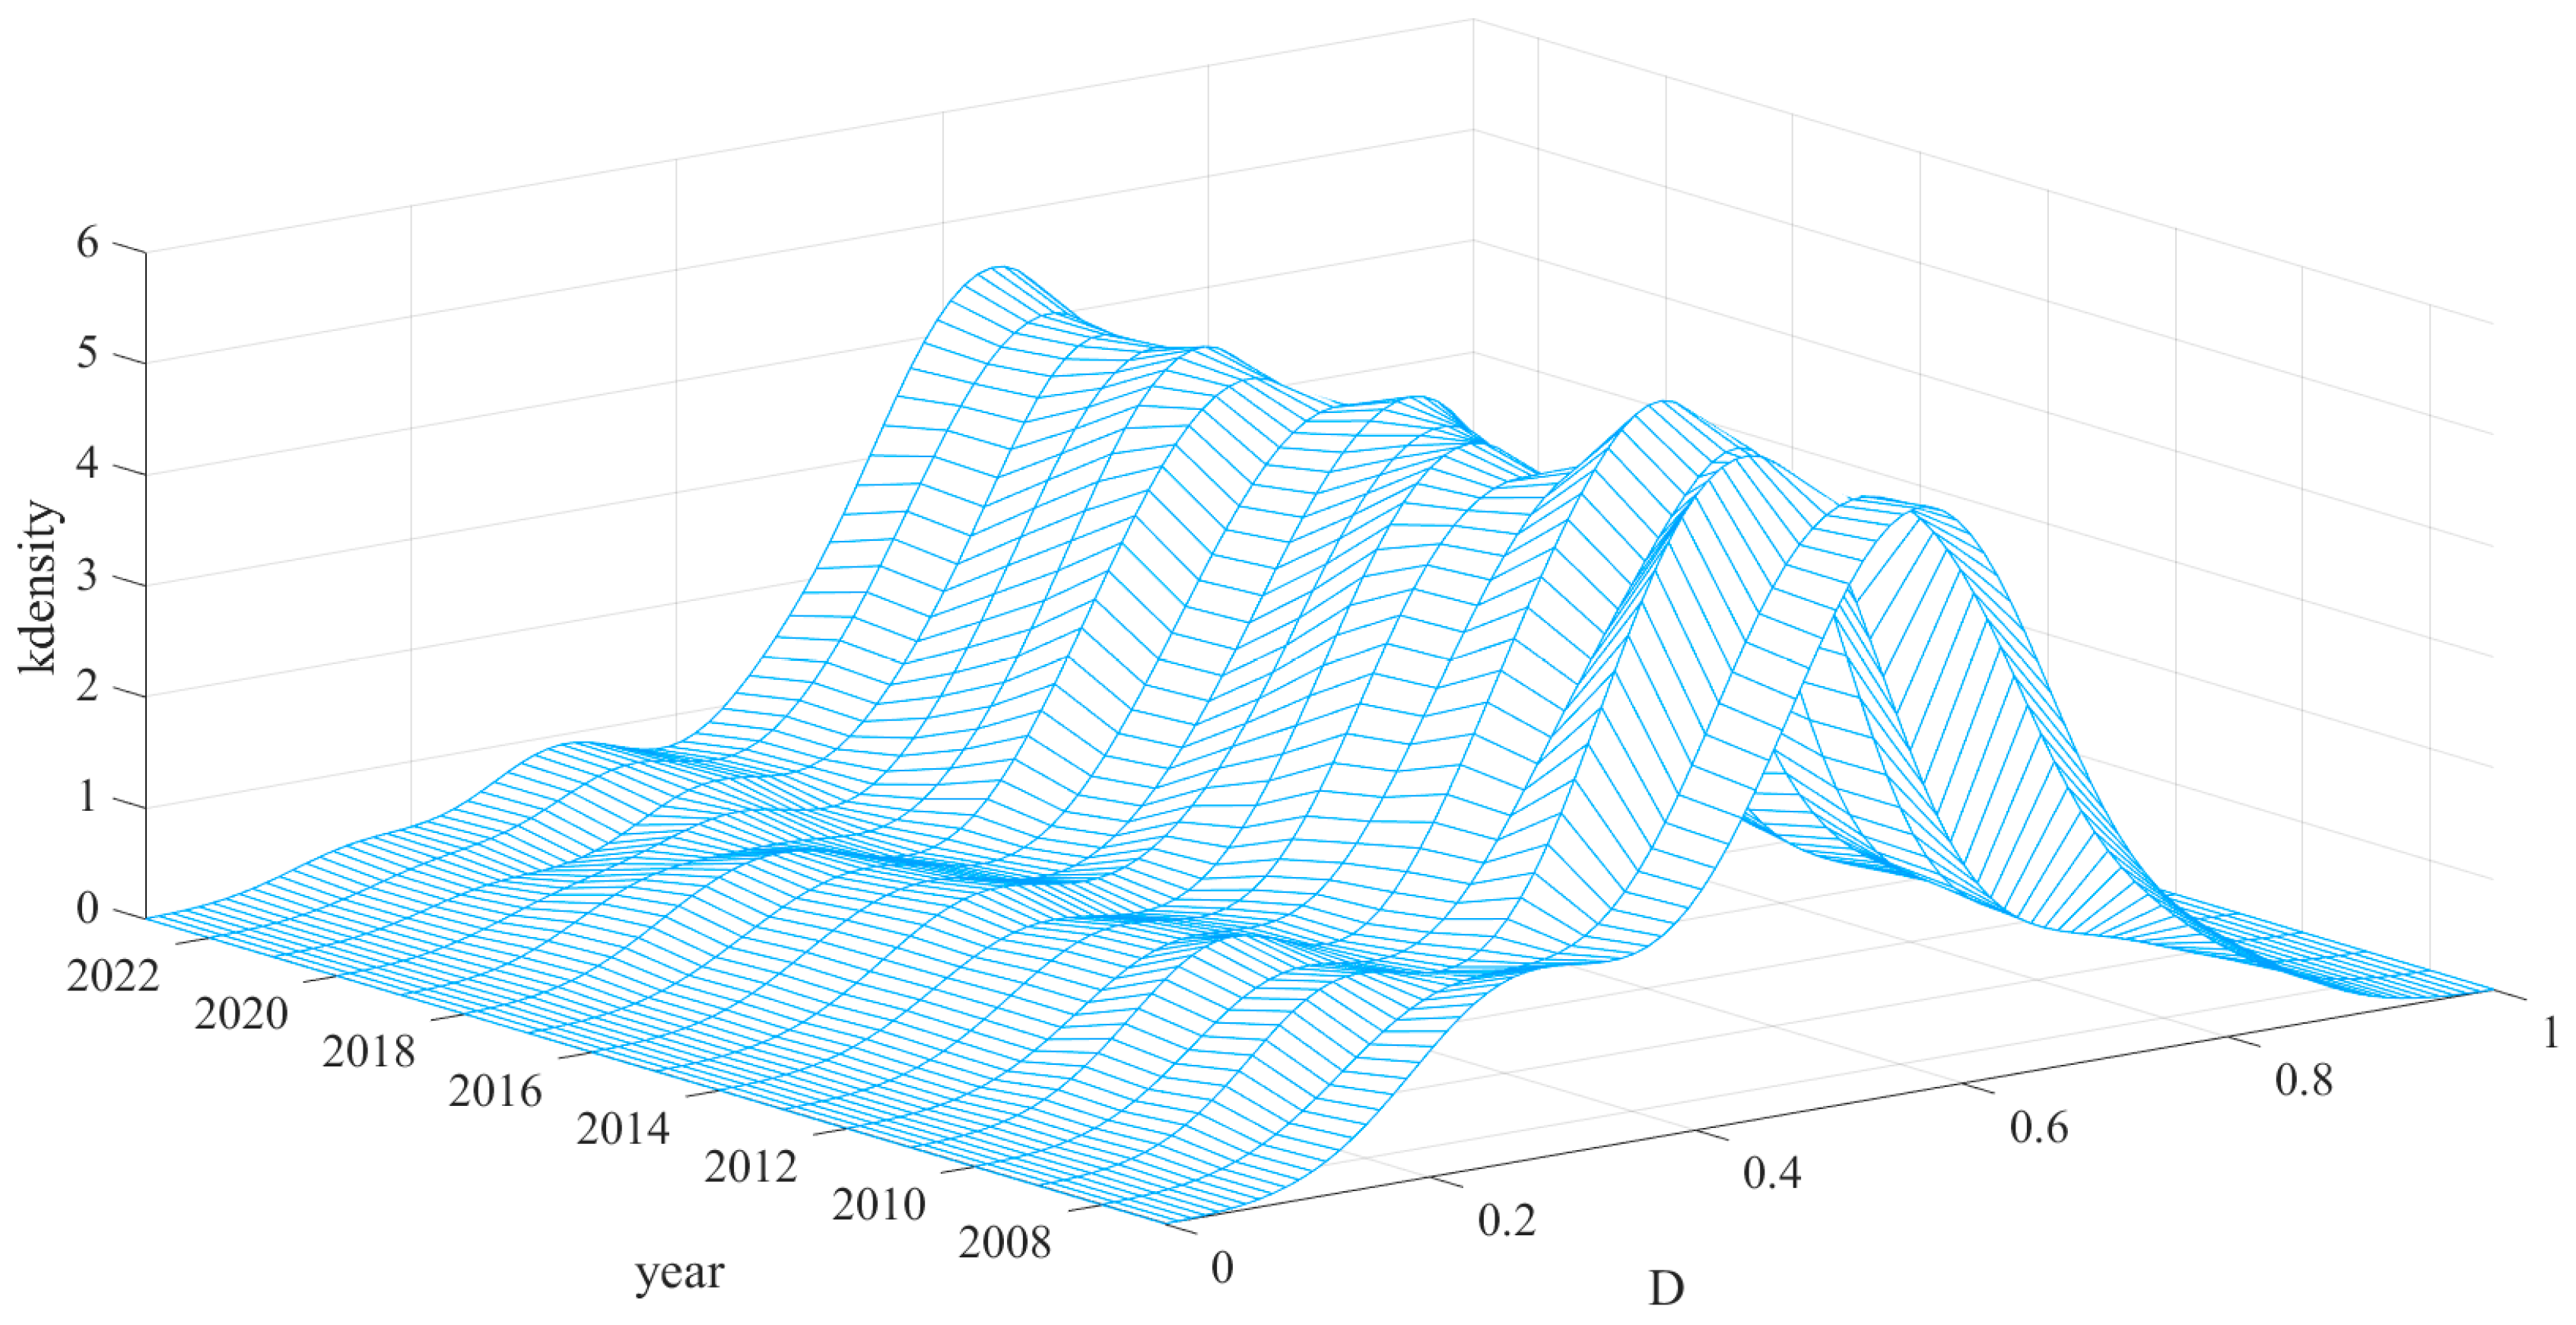
2.3. Three-Dimensional Kernel Density Estimation Plot

In order to explore the spatiotemporal evolution trend of the coupling coordination development level among regional WELF nexus systems, the three-dimensional kernel density estimation method was used to fit the data based on the coupling coordination index of 30 provinces and cities in mainland China from 2007 to 2023. x , y represents a joint kernel density estimation function of two-dimensional random variables. The random variables are independently distributed, and the X , Y X = x 1 , x 2 , , x m Y = y 1 , y 2 , y n specific formula is as follows:
f x , y = 1 n h x h y i = 1 n K x x i x ¯ h x K y y i y ¯ h y
Among them, K x x i x ¯ h x and K y y i y ¯ h y are the kernel functions, and h represents the window width of the kernel density function, which determines the smoothness and estimation accuracy of the kernel density curve.

2.4. Regression Models

To further explore the influencing factors of the coupling coordination degree of the WELF nexus, the following fixed-effect model was adopted:
D i t = α 0 + α 1 l n x 1 i t + α 2 l n x 2 i t + α 3 l n x 3 i t + α 4 l n x 4 i t = + α 5 l n x 5 i t + α 6 l n x 6 i t + μ i + v t + ε i t
where represents the D i t coupling coordination index of the WELF nexus in year t of province i; l n x 1 i t , l n x 2 i t , l n x 3 i t , l n x 4 i t , l n x 5 i t , and l n x 6 i t represent the levels of economic development, industrialization, marketization, human capital, population density, and environmental regulation. μ i   a n d   v t represent the fixed effects of region and time, respectively, while ε i t is the random error.

2.5. Data Sources and Variables

2.5.1. Explained Variables

The explained variable is the WELF nexus performance relevance index. Table 1 shows the evaluation index system of the WELF nexus, and uses the panel data entropy method and the comprehensive index evaluation method to measure the development index of different systems. At the same time, the coupling coordination degree model was borrowed to calculate the performance relevance of the WELF nexus. The selection of indicators in this study reflects the core functions and interdependencies of the WELF nexus, with each factor chosen for its representative significance and its capacity to influence multiple subsystems simultaneously. Water-related indicators such as water resources, water consumption, and agricultural water use capture both the availability and sectoral allocation of water—a critical input for energy production (e.g., hydropower cooling), land management (e.g., irrigation), and food security (e.g., crop yield) [31]. Energy indicators, such as energy consumption per unit of GDP, energy consumption growth rate, proportion of clean energy consumption, and proportion of coal energy consumption measure not only energy efficiency and transition but also the environmental externalities and resource pressures that influence water demand and land-use decisions [32,33]. For example, a high share of coal consumption implies increased water use and land degradation due to mining, whereas a shift toward clean energy reduces such pressures and promotes sustainability across systems. Land indicators, including arable land, woodland area, land for transportation, and land transfer rate, reflect the availability, ecological balance, and spatial use of land resources, which directly affect food production capacity and indirectly influence water and energy demands [34]. Finally, food system indicators such as food production, grain production, and non-grain yields provide insights into the stability, sufficiency, and structure of the agricultural system, which relies on both water and energy inputs and is constrained by land availability [35,36]. Fluctuations in food production are treated as positive in the index because the variable has likely been transformed to represent production stability, which enhances the overall performance and coordination of the WELF nexus. By incorporating these multifaceted indicators, this study ensures that each selected variable not only reflects conditions within its respective subsystem but also serves as a lever that can trigger changes—positive or negative—across the entire nexus. This integrated approach is essential for accurately assessing and improving the coordination and resilience of the WELF system under the pressures of development and transition. In addition, considering the impact of inflation on the results and the comparability of the data, GDP was deflated using the GDP deflator for the base period of 2006.

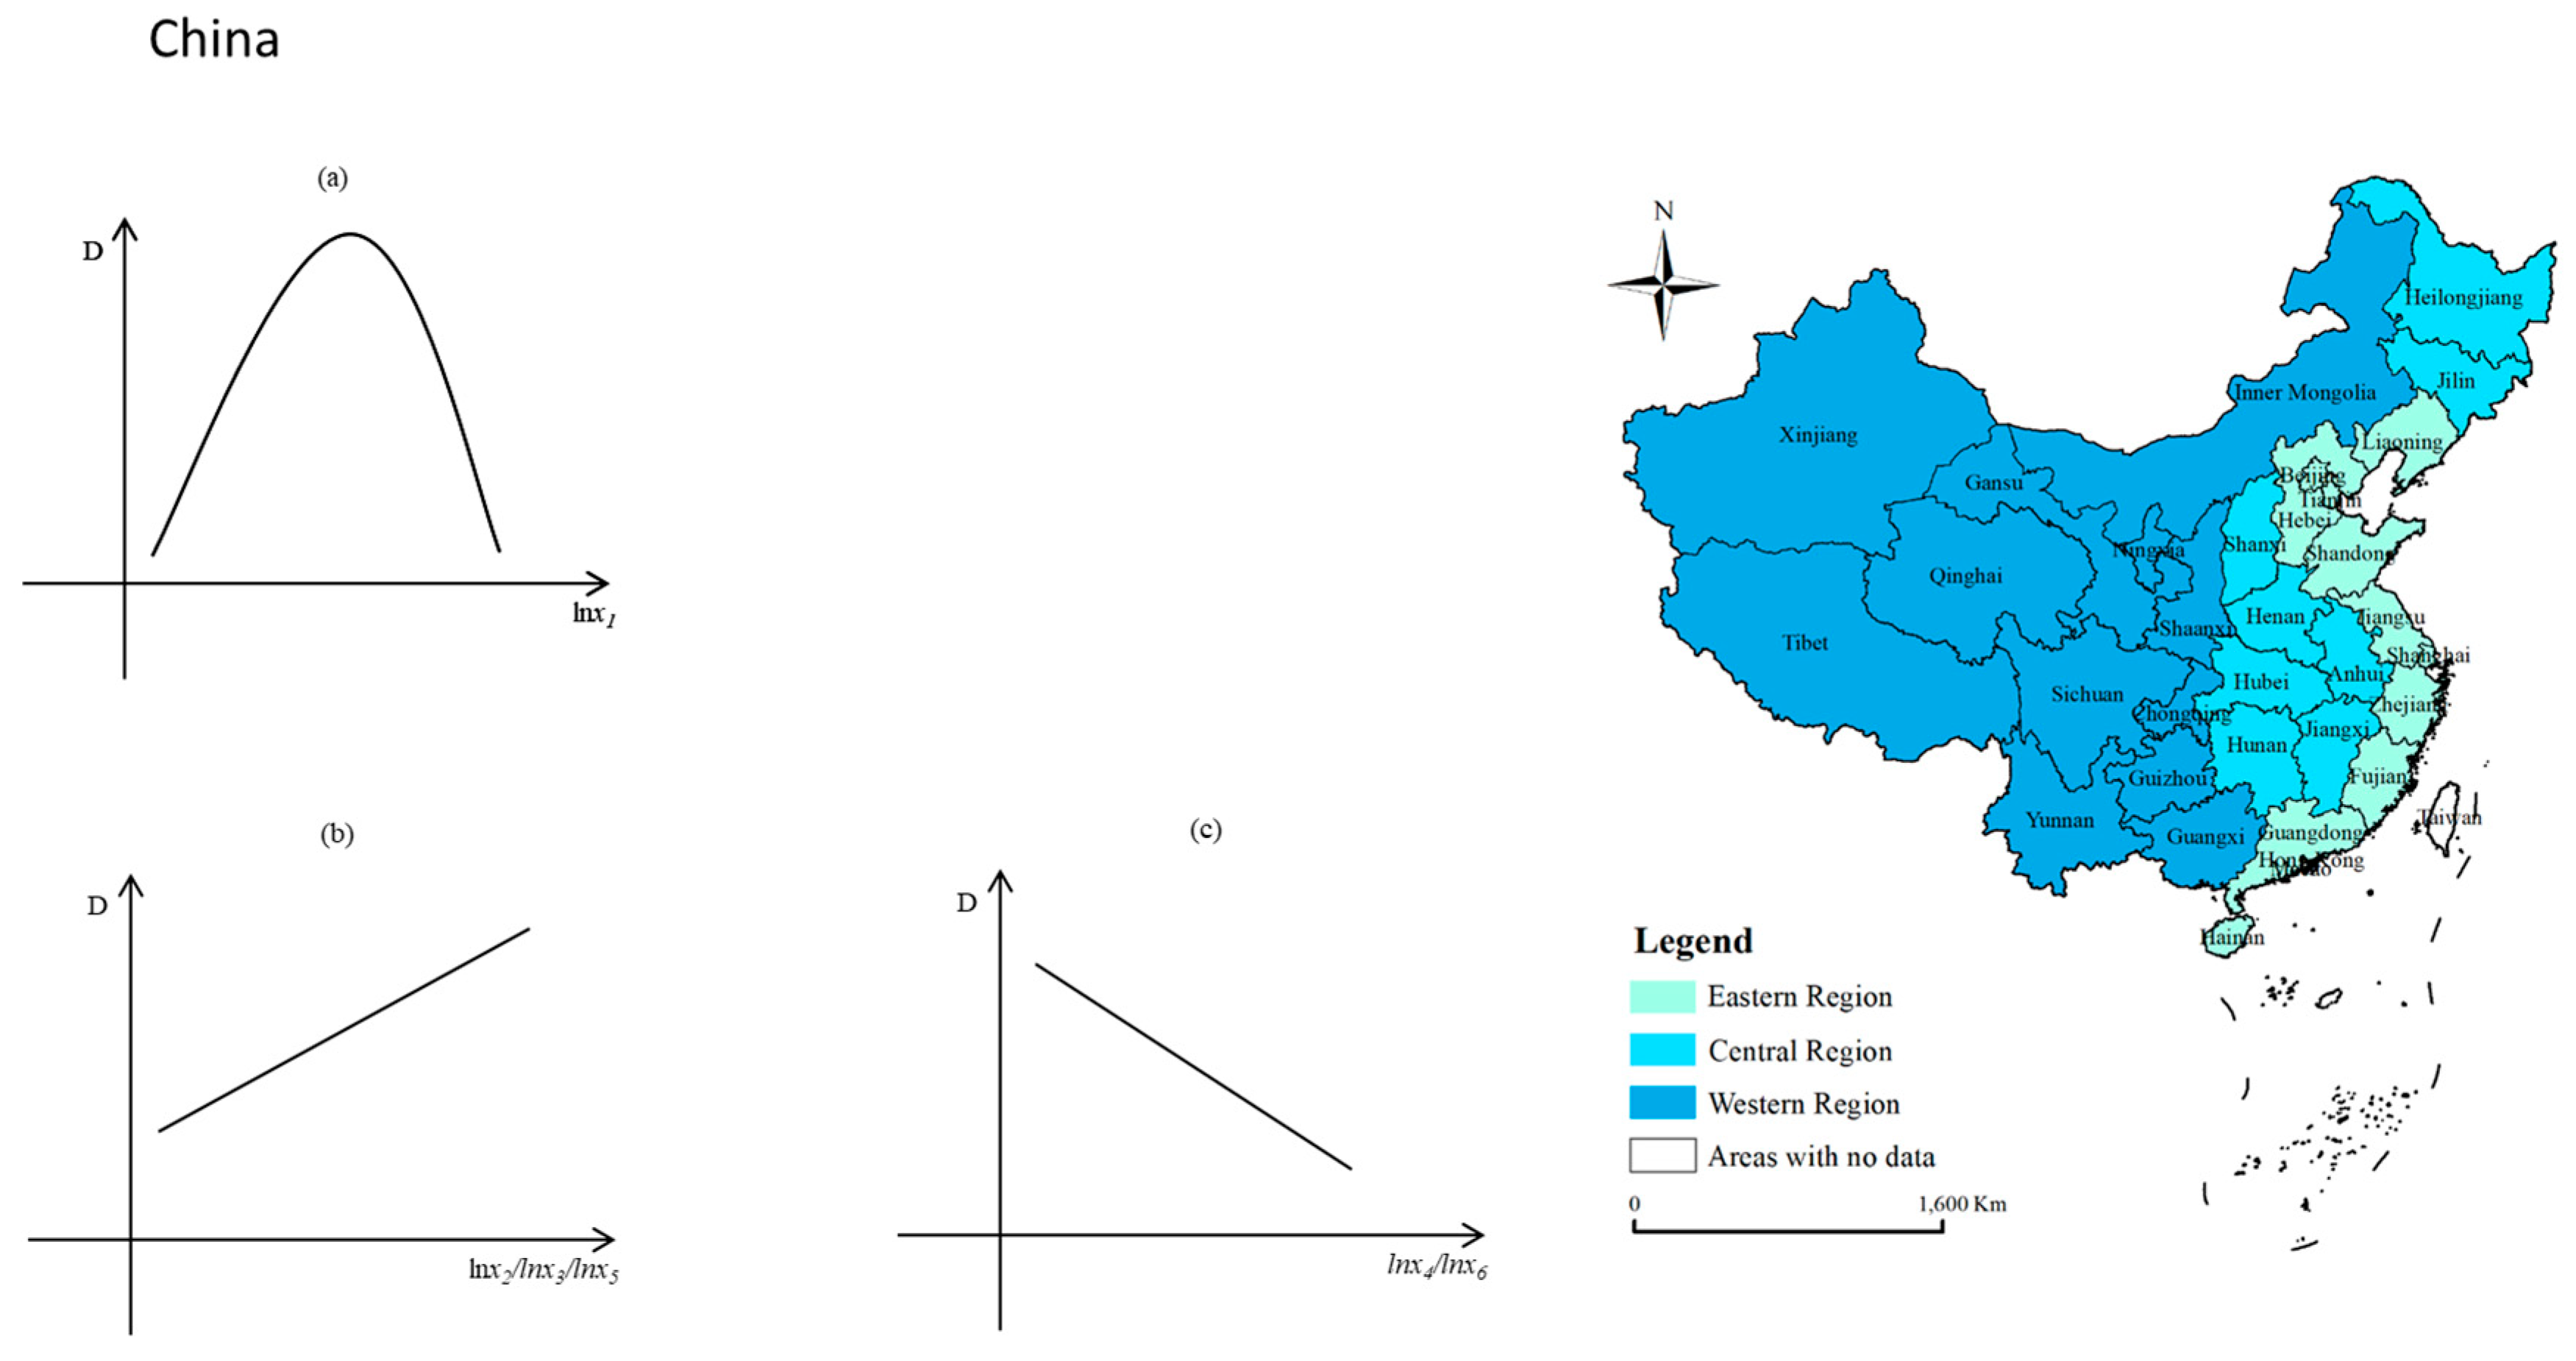
2.5.2. Explanatory Variables

The influencing factors are economic development level, industrialization level, marketization level, human capital level, population density, and environmental regulation, while the measurement methods are as follows: (1) the economic development level is the regional per capita GDP; (2) the level of industrialization is measured as the ratio of industrial value added to GDP; (3) the level of marketization is characterized by the marketization index compiled by Fan Gang and Wang Xiaolu; (4) the level of human capital is measured by the number of college students per 100,000 people; (5) population density is the ratio of permanent population to administrative area. (6) Environmental regulation is the frequency with which words such as ‘environmental protection’, ‘green development’, and ‘sustainable development’ appear in regional government documents.

2.5.3. Data Sources

The research scope of this paper covers 30 provinces and cities in mainland China (excluding Hong Kong, Macao, Taiwan, and Tibet), and the main sources of data used were the China Statistical Yearbook from 2008 to 2024, the statistical yearbooks of various regions in previous years, and the Development Statistical Bulletin (Table 2).

3. Results

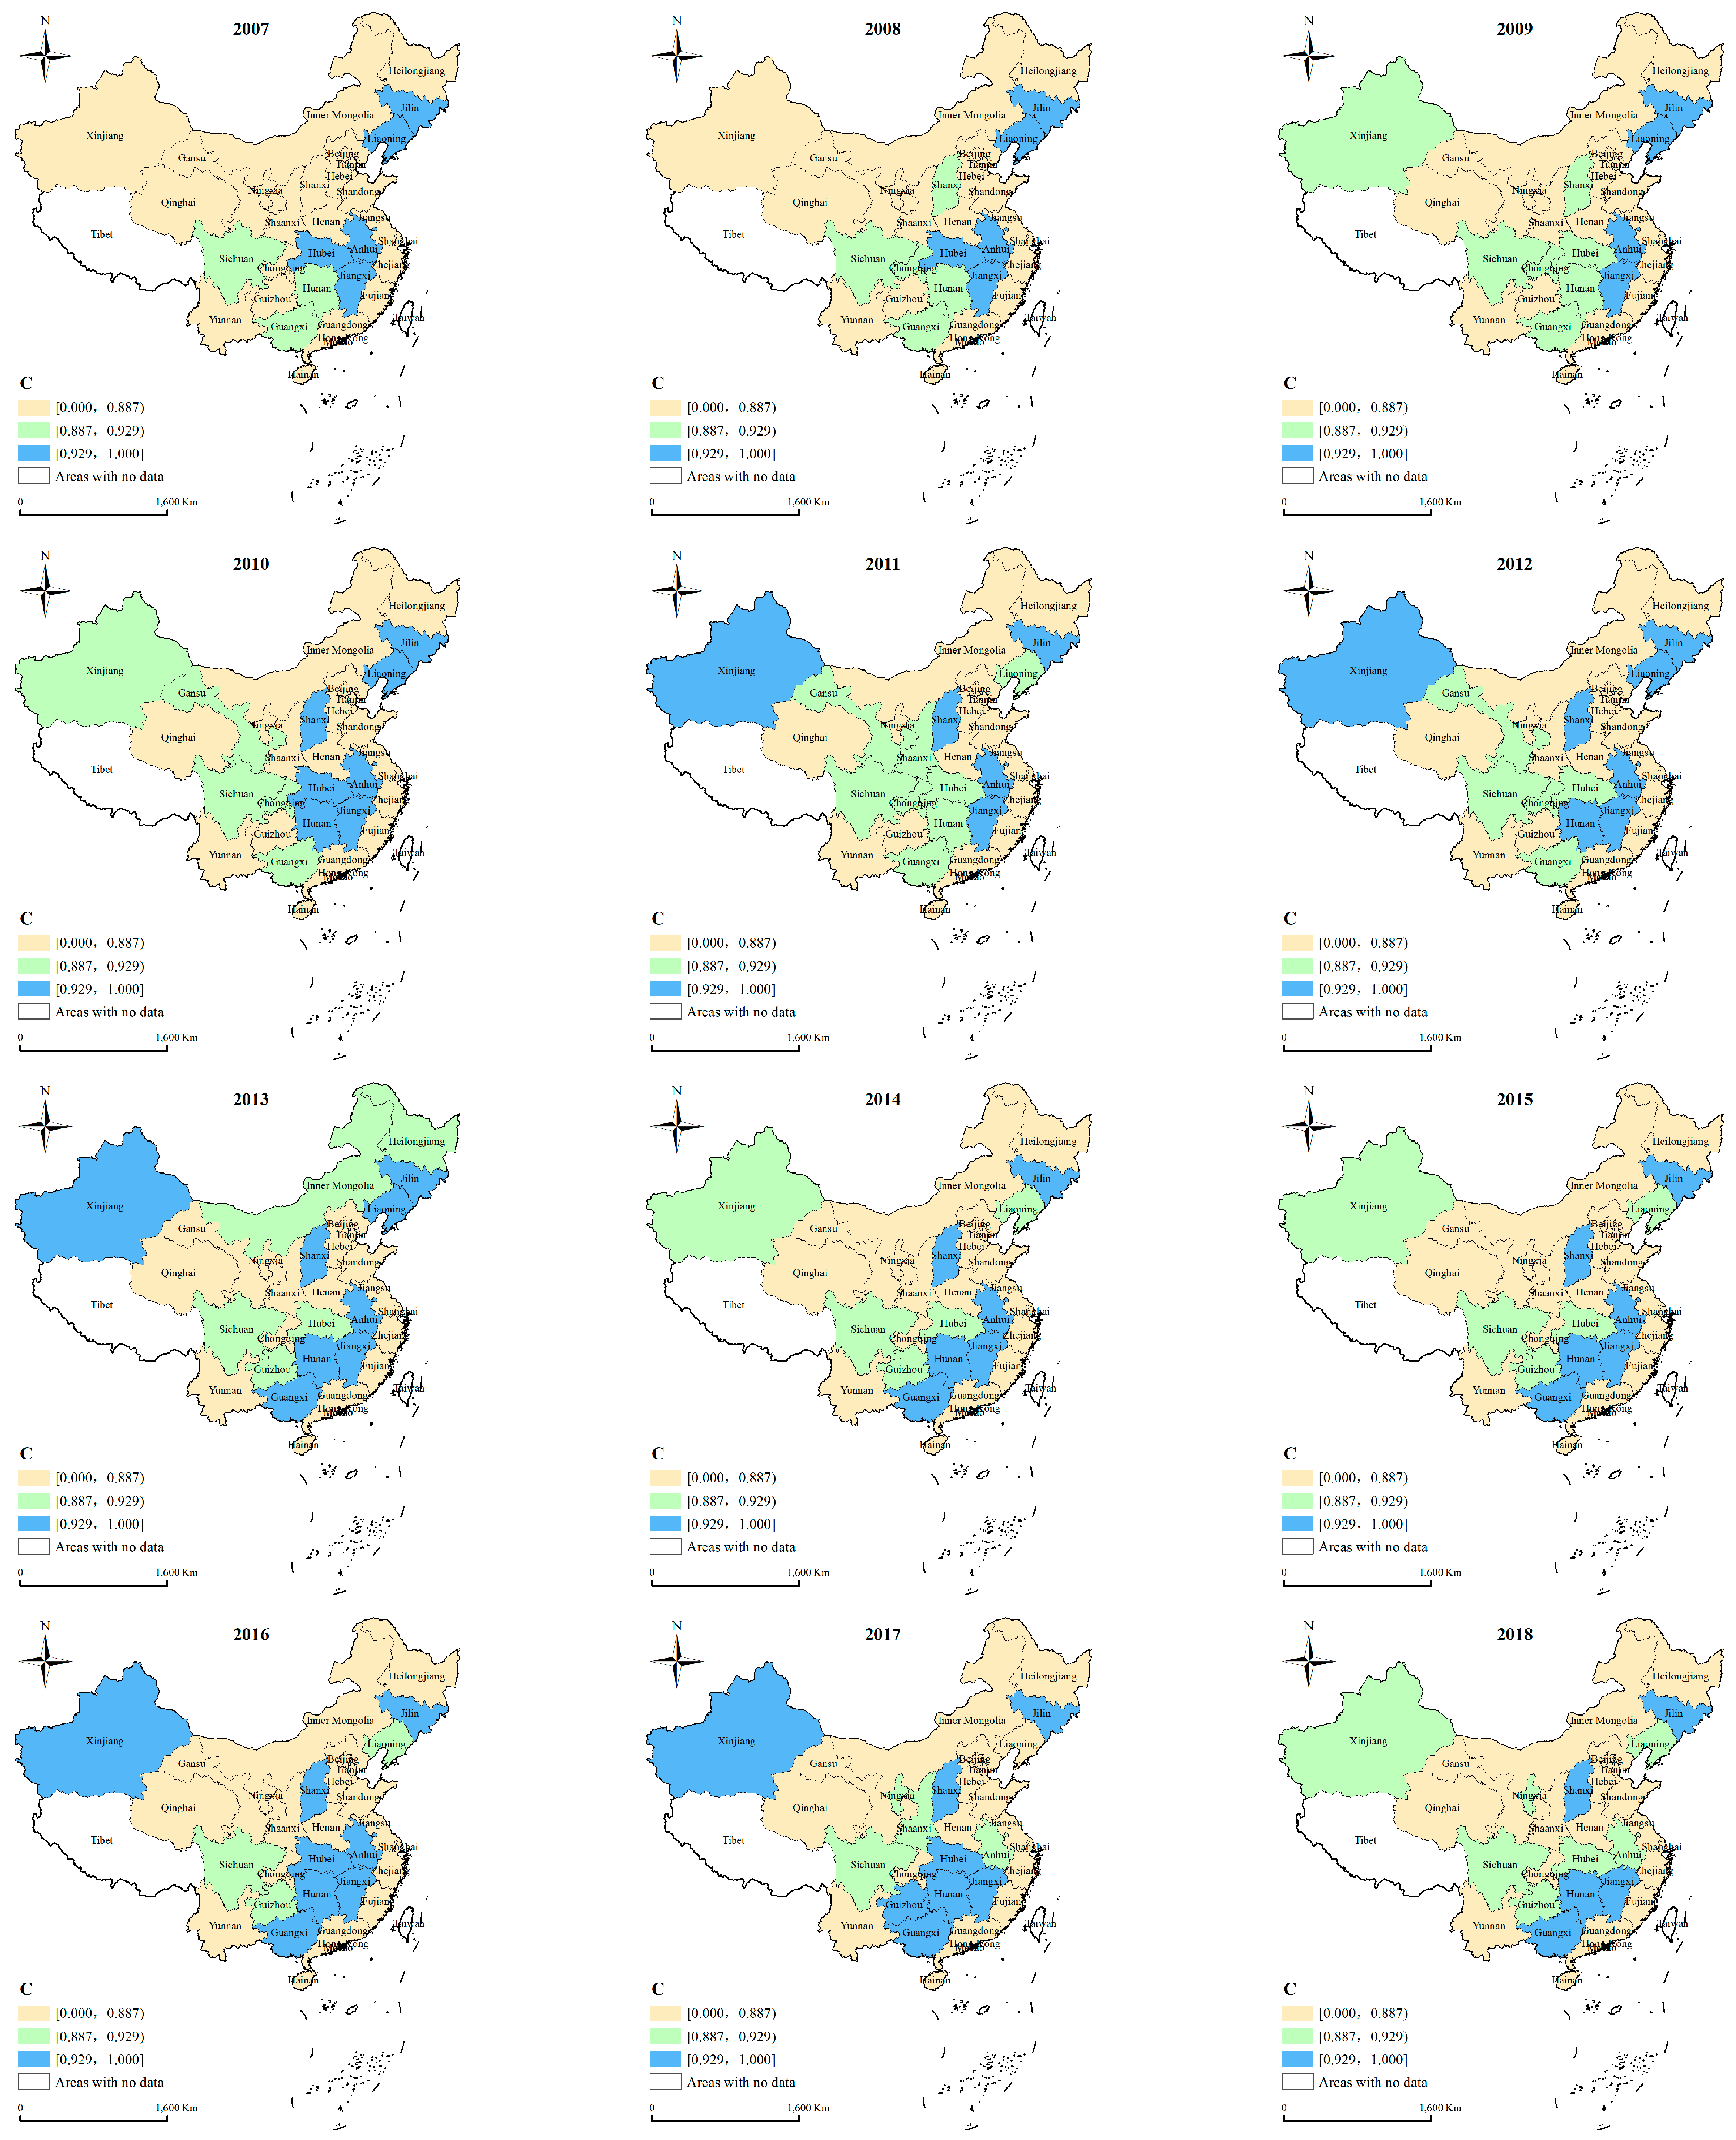
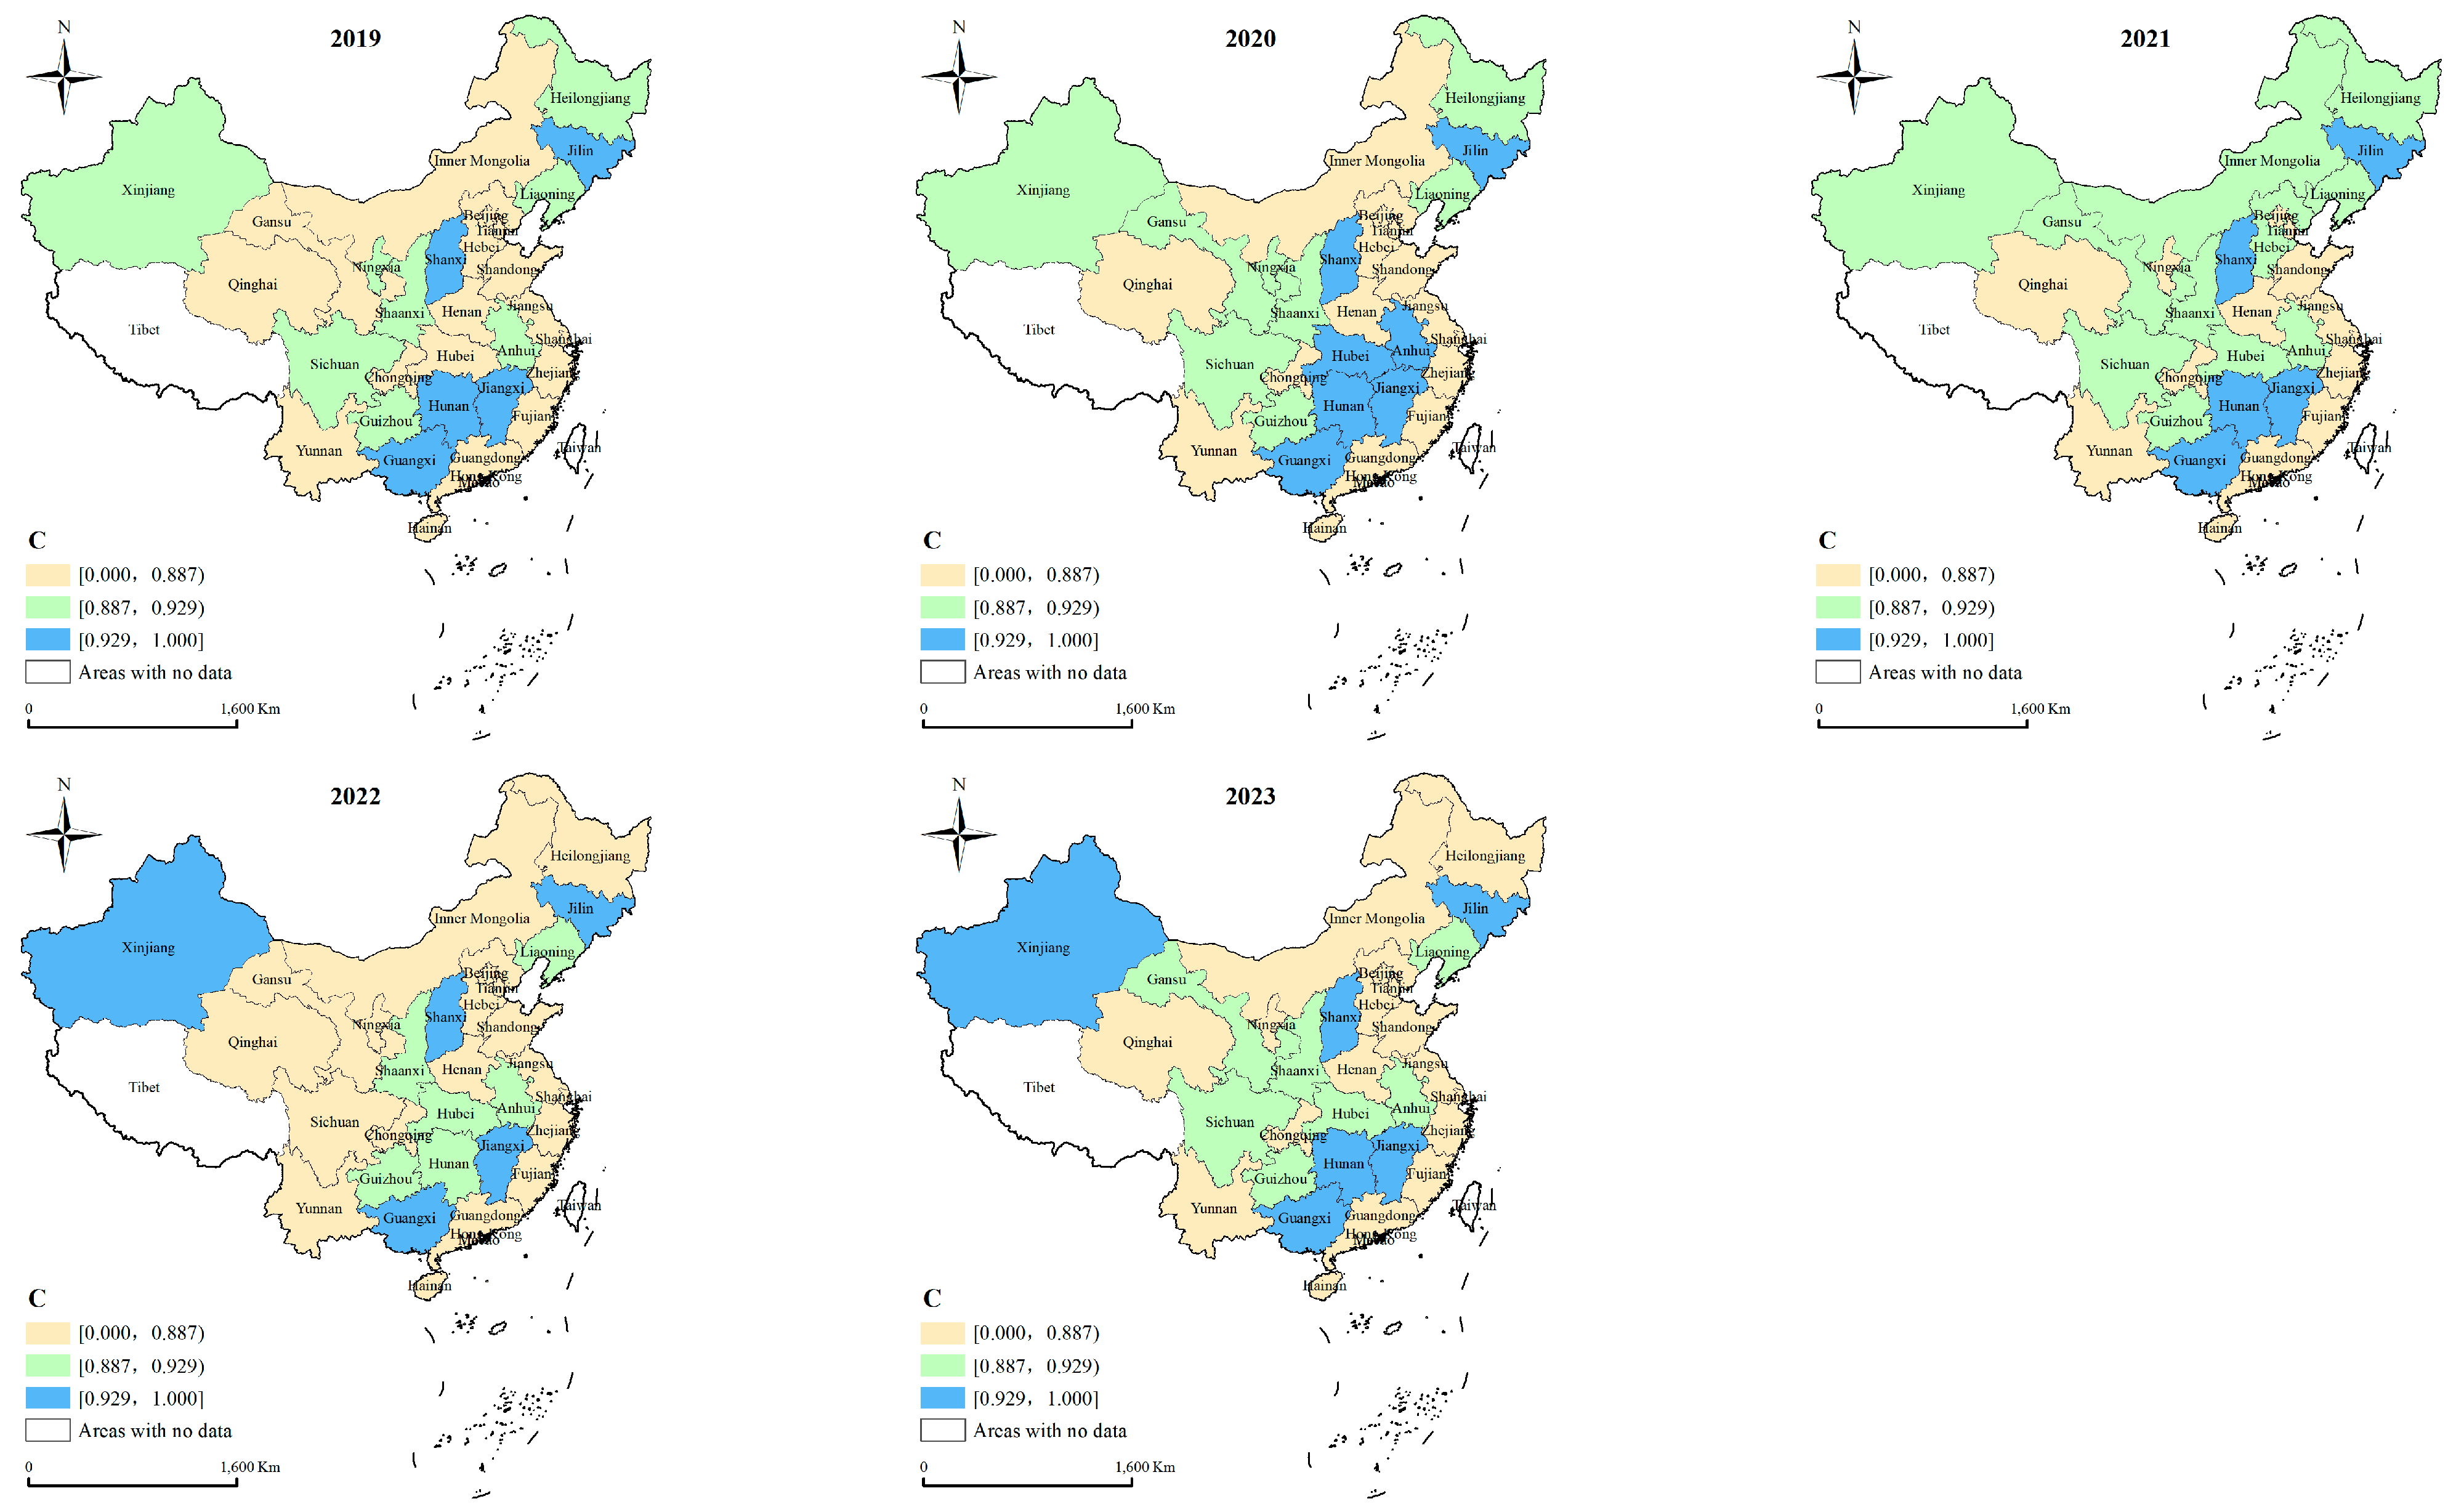
3.1. Spatial and Temporal Trends of WELF Nexus Performance

WEFL Nexus Performance Level Change

Overall decline with fluctuations in WELF nexus performance (2007–2023): During the period from 2007 to 2023, the overall performance of China’s water–energy–land–food nexus exhibited a fluctuating, yet gradually declining trend. This suggests that while some temporary improvements were achieved—possibly due to targeted policy interventions or technological upgrades—these gains were not sustained over the long term. The general decline may be attributed to increasing resource pressures, rising environmental constraints, and inconsistent cross-sectoral coordination, particularly as economic growth accelerated during this period (Figure 1).
Significant regional disparities in WELF nexus performance: There are pronounced differences in the WELF nexus performance across China’s regions. The economically developed provinces, especially those in the eastern and coastal areas, generally perform better due to stronger institutional capacity, higher levels of technological adoption, and more efficient resource use. In contrast, the less-developed inland and western regions face challenges such as limited infrastructure, less integrated planning, and higher dependency on resource-intensive activities, resulting in weaker nexus performance. These disparities reflect underlying inequalities in economic development, resource endowments, and policy implementation capacity.
Widening gaps in interregional performance relevance: From 2007 to 2023, the degree of correlation in WELF nexus performance among regions became increasingly uneven, with a stable trend of widening differences. This indicates that provinces are diverging in their levels of coordination and integration across the WELF nexus. High-performing regions are becoming more advanced in implementing holistic, nexus-oriented approaches, while low-performing regions are not catching up at the same pace. This growing divergence raises concerns about national cohesion in achieving sustainable and equitable low-carbon development, as uneven progress could lead to policy fragmentation and exacerbate regional imbalances.
From 2007 to 2023, the internal correlation among water, energy, land, and food system performance at the provincial level showed a consistent upward trend. This indicates that, over time, the interdependencies among these resource systems have become stronger and more pronounced. Such growing correlations suggest a gradual shift toward greater system integration, where changes or improvements in one domain (e.g., water efficiency) are increasingly associated with corresponding outcomes in others (e.g., energy consumption or land productivity). This trend may reflect the influence of policy efforts aimed at holistic resource management and the growing recognition of nexus thinking in environmental and economic planning (Figure 2).
Despite the overall national trend toward stronger nexus linkages, large differences persist across regions in terms of the strength and nature of WELF performance correlations. The coastal and more developed provinces often exhibit higher levels of coordination and synergy among resource systems, likely due to more advanced governance capacity, data availability, and cross-sectoral planning mechanisms. In contrast, the less-developed regions, particularly in central and western China, may experience weaker or more fragmented relationships between resource systems, which can hinder integrated decision-making and reduce policy effectiveness.
While the national average correlation among WELF sectors has risen, the differences between regions have grown more pronounced, indicating a trend of spatial divergence. The provinces that initially had better-integrated resource systems have continued to improve, possibly due to institutional learning and sustained investment in coordination mechanisms. Meanwhile, the regions with lower baseline integration have not kept pace, leading to a widening performance gap. This divergence raises concerns about uneven progress in achieving sustainable development and low-carbon goals, as the regions with weaker nexus integration may face greater difficulty in adapting to complex environmental challenges or implementing systemic policy interventions.

3.2. WEFL Nexus Performance Relevance Level Change

WELF Nexus Performance Level Findings

From 2007 to 2023, China’s overall water–energy–land–food (WELF) nexus performance level exhibited a fluctuating but gradually declining trend. Despite occasional improvements during this period, the general trajectory suggests increasing difficulty in maintaining balanced and efficient use of these interconnected resources. By 2023, the national performance level had dropped by 0.478% compared to 2007, indicating growing pressures on resource coordination amid rapid industrialization, urbanization, and environmental constraints.
The average WELF performance level from 2007 to 2023 was 0.843. However, this value varied over time, reflecting underlying shifts in policy, economic conditions, and environmental challenges. The lowest annual average occurred in 2019 (0.832), potentially due to intensified environmental stress or policy misalignments. In contrast, the peak performance was recorded in 2010 (0.853), possibly reflecting early-stage policy gains from energy and resource efficiency measures initiated in the late 2000s. This temporal variation underscores the dynamic nature of resource interactions and the sensitivity of nexus performance to external shocks and reforms (Figure 3).
Since 2016, the national WELF performance level has consistently remained below the long-term average (0.843), indicating a sustained period of system inefficiency. This trend may be linked to growing tensions among resource demands (e.g., increased urban water and energy use, land conversion for infrastructure, and food system pressures), which have outpaced improvements in cross-sector coordination. The post-2016 decline also coincides with the intensification of climate policy goals, suggesting that the low-carbon transition may be challenging to reconcile with existing resource management frameworks in some regions.
An analysis of 30 provinces and municipalities revealed substantial differences in WELF performance levels. The overall average across all regions was 0.843, but the values ranged from a low of 0.303 (Shanghai) to a high of 0.977 (Jilin). These disparities reflect the diverse geographic, economic, and policy contexts across China. Provinces with better integration and efficiency tend to have more balanced development models and proactive resource governance, while others face fragmentation, scarcity issues, or trade-offs among competing policy priorities.
Jilin Province ranked highest in WELF performance (0.977), followed by Jiangxi (0.974), Hunan (0.966), Shanxi (0.964), and Anhui (0.963). These provinces, most of which are located in central or Northeastern China, may benefit from relatively favorable resource endowments, lower urbanization pressure, and more integrated land and water use strategies. Notably, 80% of the provinces recorded performance levels at or above the national average, indicating a majority trend toward moderate-to-strong nexus alignment.
At the other end of the spectrum, Shanghai had the lowest average WELF performance (0.303), followed by Beijing (0.379), Qinghai (0.499), Tianjin (0.543), and Hainan (0.572). The low scores in major metropolitan areas such as Shanghai and Beijing likely reflect the intense resource demands, spatial constraints, and reliance on external food and water inputs, typical of large urban centers. These cities may exhibit high economic output but lower efficiency or self-sufficiency in nexus terms. Meanwhile, provinces such as Qinghai face natural limitations in water availability and agricultural productivity, which can hinder balanced performance across the nexus (Figure 4).
Findings on the water–energy–land–food nexus performance relevance level.
Between 2007 and 2023, the performance relevance level of the water–energy–land–food (WELF) nexus exhibited a stable upward trend. By 2023, this metric had risen by 10.810% compared to its 2007 level. This consistent growth suggests that the interdependencies among WELF nexus systems have become more significant and better aligned over time. The rise in relevance may reflect the cumulative effects of national policies promoting integrated resource planning, technological advancements in resource efficiency, and growing awareness of the systemic nature of sustainability challenges.
Over the entire study period, the average WELF performance relevance level was 0.497. This measure started at its lowest in 2007 (0.469), indicating weak system interlinkages at the beginning of the period. By 2023, the average had increased to 0.520, reflecting strengthened connections and growing coherence in how provinces manage resource systems. This temporal trend highlights the gradual, yet measurable, shift in resource governance toward more nexus-oriented thinking.
From 2013 onward, the regional performance relevance levels consistently exceeded the long-term average of 0.497. This indicates that, after a period of relatively weak integration, provinces began to demonstrate stronger interrelationships between the four resource sectors. The year 2013 appears to mark a turning point, potentially corresponding with national strategies such as the Ecological Civilization framework and increased attention to climate-resilient development. This shift suggests that more provinces are recognizing and responding to the co-benefits and trade-offs embedded in the WELF nexus.
Across the 30 provinces and municipalities analyzed, the average performance relevance level was 0.497. However, this average masks wide disparities. The lowest score was observed in Shanghai (0.258), a major urban and industrial center with highly externalized resource dependencies, while the highest score was in Heilongjiang (0.678), a province with relatively strong internal coherence among agriculture, land use, and water-energy systems. These disparities reflect the influence of geographic context, development pathways, and policy emphasis on regional resource coordination.
Heilongjiang demonstrated the strongest performance relevance (0.678), followed by Sichuan (0.650), Yunnan (0.583), Hunan (0.575), and Henan (0.574). These provinces, many of which are agriculturally significant or located in central/western China, likely benefit from relatively integrated land–water–energy systems and a strong food production base. The fact that 56.67% of provinces were at or above the national average indicates a moderate level of convergence in some parts of the country and growing institutional capacity for integrated resource governance.
At the lower end of the spectrum, Shanghai had the lowest performance relevance level (0.258), followed by Beijing (0.298), Tianjin (0.318), Ningxia (0.338), and Qinghai (0.416). These results suggest different structural challenges. In mega-cities such as Shanghai, Beijing, and Tianjin, high dependence on imported resources and fragmented urban governance may limit cross-sector integration. In contrast, in western regions such as Ningxia and Qinghai, resource scarcity, uneven development, and weaker institutional coordination mechanisms could explain lower relevance levels.

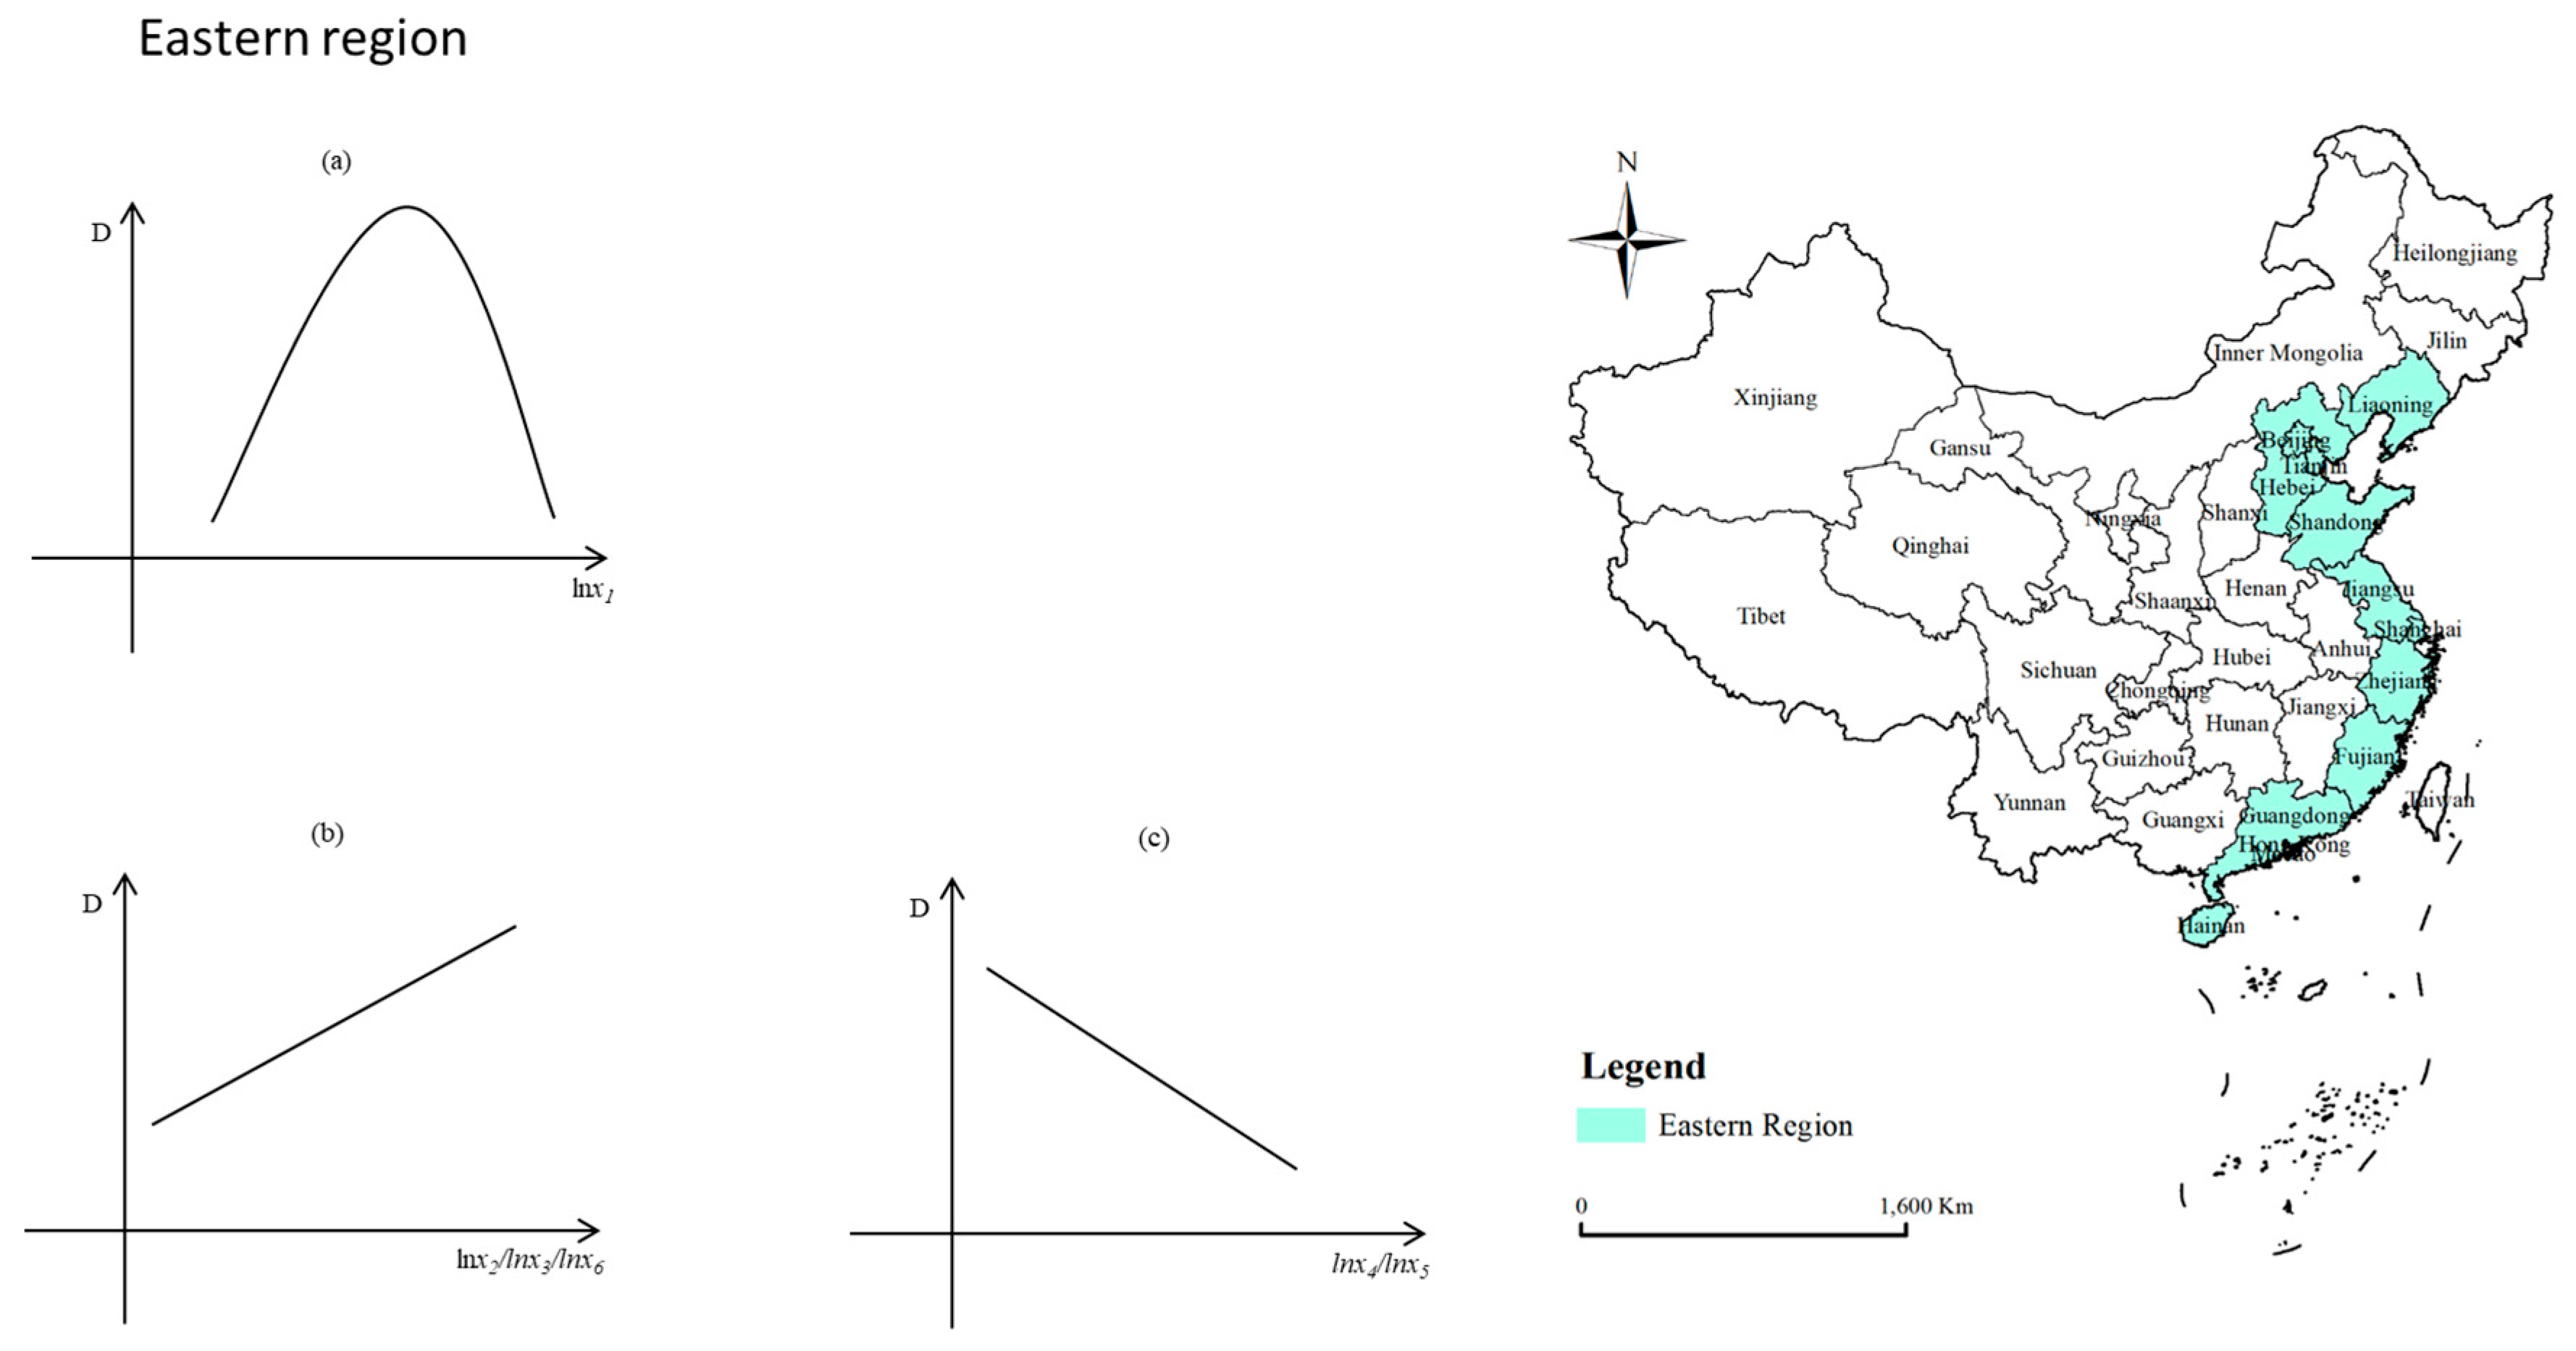
3.3. Empirical Analysis of Driving Factors Influencing the Relevance Level of WELF Nexus Performance

Benchmark Regression Results

Based on panel data from 30 provinces and municipalities in mainland China from 2007 to 2023, this study employed the fixed effects model (Model 10) to examine the driving factors of WELF performance relevance levels. The results are presented in Table 3. Columns (1) and (2), as well as columns (3) and (4), respectively, show the regression estimates as explanatory variables are gradually added.
Economic development level (lnx1) exhibits an inverted U-shaped relationship with the WELF performance relevance level. In the early stages of economic development, improvements in economic level are associated with an increase in the WELF performance relevance level. However, in the later stages, as economic development continues to advance, the performance relevance level begins to decline. This suggests that beyond a certain threshold, economic growth may lead to resource system fragmentation or increased externalization of resource dependencies, thereby weakening the integrated performance of the WELF nexus.
Higher levels of industrialization (lnx2), marketization (lnx3), and population density (lnx5) are associated with higher WELF performance relevance levels. This indicates that regions with more developed industrial and market systems, as well as denser populations, tend to have better alignment among WELF nexus—possibly due to stronger institutional capacity, more efficient resource allocation mechanisms, and greater pressure to integrate resource management.
Conversely, higher levels of human capital (lnx4) and stricter environmental regulation (lnx6) are associated with lower WELF performance relevance levels. This counterintuitive finding may reflect several underlying dynamics. First, there may be short-term trade-offs between pursuing stringent environmental control measures and achieving cross-sector resource coordination. For instance, strict regulations might prioritize compliance with environmental standards in isolated sectors (e.g., emissions reductions in energy or pollution control in water management), without fostering collaborative, integrated planning across the WELF domains. Second, in regions with higher human capital, advanced expertise and institutional capacity often lead to greater sectoral specialization. While this can improve efficiency within individual systems, it may also result in siloed decision-making and reduced interdepartmental coordination, undermining holistic nexus management. Furthermore, rigid regulatory frameworks—although essential for sustainability—may inadvertently limit the flexibility needed to adjust and optimize the interconnections among WELF nexus systems. As a result, despite greater resources and capabilities, such regions may struggle to achieve the dynamic integration that characterizes high WELF performance relevance. This highlights the importance of not only investing in human and institutional capacity but also ensuring governance structures that support cross-sectoral synergy and adaptive management (Figure 5).

3.4. Regional Inequality in the WELF Nexus

Considering that differences in regional endowments and economic development levels may affect the estimation results, this study divides the sample into three regions—Eastern, Central, and Western China—based on their levels of economic development for the purpose of further discussion. The specific results are presented in Table 4.
The impact of economic development level (lnx1) on the WELF performance relevance level follows an inverted U-shape. In the early stages of economic development, as economic growth increases, the WELF performance relevance level gradually rises. However, in the later stages of development, as the economic level continues to increase, the WELF nexus performance relevance level begins to decline. This suggests that after reaching a certain threshold of economic development, the coordination within the WELF nexus may weaken, possibly due to resource fragmentation or externalized dependencies.
Higher levels of industrialization (lnx2), marketization (lnx3), and environmental regulation (lnx6) are associated with higher WELF performance relevance levels. This indicates that regions with more developed industrial and market systems, along with stricter environmental controls, tend to exhibit better integration and alignment of the WELF nexus. These regions may have more effective institutional frameworks and policies that promote efficient resource management and sustainable development.
Higher levels of human capital (lnx4) and population density (lnx5) are associated with lower WELF performance relevance levels. This finding may suggest that regions with higher human capital and denser populations might experience increased specialization and sectoral focus, which could reduce the level of coordination between the interconnected resources of WELF. Additionally, higher population density may increase pressure on resources, further complicating integrated management and leading to lower nexus performance (Figure 6).
Economic development level (lnx1) and environmental regulation (lnx6) have no significant impact on the WELF performance relevance level. This suggests that, within the context of this study, changes in economic development or the stringency of environmental regulations do not directly affect the degree of integration within the WELF nexus at the regional level.
Higher levels of marketization (lnx3), human capital (lnx4), and population density (lnx5) are associated with higher WELF performance relevance levels. This indicates that the regions with more developed market economies, higher human capital, and denser populations tend to achieve greater alignment and integration of the water–energy–land–food nexus. These factors likely enhance the capacity of regions to manage resources more effectively through improved infrastructure, governance, and technological innovation.
Higher industrialization levels (lnx2) are associated with lower WELF performance relevance levels. This suggests that the regions with more advanced industrialization may face challenges in aligning the WELF nexus. Increased industrial activity may lead to resource fragmentation, where the interconnections between these sectors are weakened, or where industrial growth exacerbates pressures on environmental and resource systems (Figure 7).
Economic development level (lnx1) and environmental regulation (lnx6) have no impact on the WELF performance relevance level. This finding suggests that changes in economic development or the intensity of environmental regulations do not significantly influence the integration or coordination between WELF nexus at the regional level.
Higher levels of marketization (lnx3) and population density (lnx5) are associated with higher WELF performance relevance levels. This indicates that regions with more developed market economies and higher population densities tend to achieve better integration of the water–energy–land–food nexus. The greater market efficiency and higher population density may lead to more effective resource management and coordination, as these regions face greater pressures to optimize their resource systems.
Higher levels of industrialization (lnx2) and human capital (lnx4) are associated with lower WELF performance relevance levels. This suggests that the industrialized regions, which may focus more on sectoral growth rather than systemic integration, and the regions with higher human capital, where specialization may dominate, tend to experience a lower degree of coordination among the WELF nexus (Figure 8).

3.5. Robustness Test

To further validate the robustness of the above regression results, this study conducted a robustness check by replacing the explanatory variables. The specific results are presented in Table 5. Specifically, all explanatory variables are lagged by one period, and the regression is re-run. From Table 5, it can be seen that the significance and direction of most of the coefficients remain consistent with the results from the baseline regression. This indicates, to some extent, the reliability of the conclusions drawn from the baseline regression.

4. Discussions and Implications

This study presents a comprehensive evaluation of the WELF nexus performance across Chinese provinces and examines the spatial patterns of regional inequality that influence the country’s low-carbon transition. The findings underscore several important themes with significant policy and academic implications.
Our analysis reveals pronounced regional disparities in WELF nexus performance, driven by differences in resource endowments, economic structures, technological capacities, and governance effectiveness. Coastal and more industrially advanced provinces, such as Jiangsu, Zhejiang, and Guangdong, demonstrate higher levels of resource integration and efficiency, largely due to stronger institutional coordination, greater access to clean technologies, and a well-developed infrastructure. In contrast, inland and western provinces—such as Gansu, Xinjiang, and Guizhou—often struggle with fragmented resource management, lower levels of investment in low-carbon technologies, and greater dependence on carbon-intensive industries.
These disparities are not just reflections of economic inequality, but also indicators of differentiated resilience and adaptive capacity under a national low-carbon transition [22,23]. Regions with strong nexus performance are more likely to absorb the pressures of decarbonization, while poorly performing regions risk facing compounded vulnerabilities, including energy insecurity, food supply instability, land degradation, and water stress. Without targeted support, the national push toward carbon neutrality could inadvertently reinforce existing development gaps [37].
This study also highlights critical trade-offs and synergies within the WELF nexus. For instance, efforts to expand renewable energy infrastructure (e.g., hydropower and biomass) may conflict with land-use and water availability goals, especially in ecologically fragile or water-scarce regions [38]. Similarly, agricultural modernization can improve food productivity and reduce emissions but may increase water and energy demand [6,7,8]. These trade-offs underline the need for integrated planning approaches that consider systemic feedbacks, rather than siloed sectoral interventions [26].
However, the analysis also identifies potential synergies—for example, improved irrigation efficiency reduces both water and energy consumption; sustainable land management enhances carbon sequestration while supporting food security [39]. Regions that actively manage these synergies tend to perform better in the nexus index, suggesting a strong case for cross-sectoral governance mechanisms and incentive structures [40].
A one-size-fits-all approach to the low-carbon transition is inadequate given the diversity of regional conditions [31,32]. Tailored policy frameworks that address region-specific constraints and leverage local advantages are essential [22]. For example, western provinces may require targeted investment in clean energy infrastructure and capacity-building for integrated resource management [17,18,19]. Institutional fragmentation remains a major barrier to effective nexus governance [5]. Enhancing vertical and horizontal coordination among WELF nexus—particularly at the provincial and municipal levels—can help align goals, reduce policy conflicts, and improve resource-use efficiency [41]. Technological solutions such as precision agriculture, smart grids, and water-saving technologies can significantly improve nexus efficiency [33,34]. Policymakers should expand fiscal and financial incentives to support green innovation, especially in underperforming regions [42]. The low-carbon transition must be socially just and regionally inclusive [28]. Redistributive mechanisms, such as ecological compensation schemes, regional development funds, and carbon revenue sharing, can help less-developed regions transition without bearing disproportionate costs [4,5].
The findings also offer important implications for advancing energy justice and strengthening multi-level governance within the WELF nexus framework. The observed regional disparities in performance and coordination highlight the need for a more equitable allocation of resources and targeted policy support, particularly for less-developed areas with constrained access to water, clean energy, or arable land. Promoting energy justice requires not only improving physical infrastructure but also ensuring that communities—especially in western and inland provinces—have fair opportunities to participate in and benefit from low-carbon transitions. At the same time, the complexity and interdependence of the WELF systems call for coordinated policy responses across administrative levels. Local governments must tailor implementation strategies to regional conditions, while central authorities should provide overarching guidance, fiscal incentives, and regulatory alignment to facilitate coherent and inclusive development. This multi-level governance approach is critical to enhancing resilience, reducing inequalities, and ensuring that sustainability transitions are both technically sound and socially just.
Despite the usefulness of the coupling coordination model, this study faces several limitations related to data and methodology. First, the analysis relies on provincial-level panel data, which may mask important intra-regional disparities and localized dynamics within each province. Second, some indicators used to represent the WELF nexus are constrained by data availability and may not fully capture the complexity of each subsystem. Finally, while the coupling coordination model effectively illustrates the degree of interaction and harmony among systems, it does not establish causality or account for potential external shocks and policy interventions that may influence nexus performance. Future studies could address these limitations by incorporating finer-scale data, dynamic modeling techniques, and more comprehensive indicator systems.

5. Conclusions

China’s pathway to carbon neutrality will depend not only on technological advancement and macro-level climate targets, but also on how effectively its regions manage interdependent resources amid structural inequalities. By illuminating the spatial dimensions of the WELF nexus and its role in the low-carbon transition, this study provides a critical knowledge base for designing integrated, equitable, and sustainable development strategies. Only through such holistic approaches can China—and other nations facing similar challenges—achieve a just and resilient low-carbon future. Furthermore, developing scenario-based modeling approaches that simulate the effects of various low-carbon policies on WELF dynamics would be valuable for strategic planning. Such models could help assess trade-offs under different policy mixes and assist in prioritizing interventions.

Author Contributions

Conceptualization, Q.Y., H.C. and R.Z.; methodology, Q.Y. and R.Z.; software, Q.Y. and R.Z.; validation, Q.Y., H.C. and R.Z.; formal analysis, Q.Y., H.C. and R.Z.; investigation, Q.Y., H.C. and R.Z.; resources, Q.Y.; data curation, H.C.; writing—original draft preparation, Q.Y., H.C. and R.Z.; writing—review and editing, Q.Y., H.C. and R.Z.; visualization, Q.Y.; supervision, H.C.; project administration, Q.Y., H.C. and R.Z. All authors have read and agreed to the published version of the manuscript.

Funding

This research received no external funding.

Data Availability Statement

The raw data supporting the conclusions of this article will be made available by the authors on request.

Conflicts of Interest

The authors declare no conflicts of interest.

References

  1. Feenstra, M.; Özerol, G. Energy justice as a search light for gender-energy nexus: Towards a conceptual framework. Renew. Sustain. Energy Rev. 2021, 138, 110668. [Google Scholar] [CrossRef]
  2. Gaddam, S.J.; Sampath, P.V. Are multiscale water–energy–land–food nexus studies effective in assessing agricultural sustainability? Environ. Res. Lett. 2022, 17, 014034. [Google Scholar] [CrossRef]
  3. Yao, X.; Chen, W.; Song, C.; Gao, S. Sustainability and efficiency of water-land-energy-food nexus based on emergy-ecological footprint and data envelopment analysis: Case of an important agriculture and ecological region in Northeast China. J. Clean. Prod. 2022, 379, 134854. [Google Scholar] [CrossRef]
  4. Chen, X.; Chen, M. Energy, environment and industry: Instrumental approaches for environmental regulation on energy efficiency. Environ. Impact Assess. Rev. 2024, 105, 107439. [Google Scholar] [CrossRef]
  5. Das, A.; Sahoo, B.; Panda, S.N. Evaluation of Nexus-Sustainability and Conventional Approaches for Optimal Water-Energy-Land-Crop Planning in an Irrigated Canal Command. Water Resour. Manag. 2020, 34, 2329–2351. [Google Scholar] [CrossRef]
  6. Zhang, J.; Yang, Y.C.E.; Abeshu, G.W.; Li, H.; Hung, F.; Lin, C.-Y.; Leung, L.R. Exploring the food-energy-water nexus in coupled natural-human systems under climate change with a fully integrated agent-based modeling framework. J. Hydrol. 2024, 634, 131048. [Google Scholar] [CrossRef]
  7. Chen, H.; Wang, C. Assessing Environmental, Social, and Governance Risks in the Water, Energy, Land, and Food Nexus, Towards a Just Transition to Sustainable Energy in China. Land 2025, 14, 669. [Google Scholar] [CrossRef]
  8. Zheng, D.; An, Z.; Yan, C.; Wu, R. Spatial-temporal characteristics and influencing factors of food production efficiency based on WEF nexus in China. J. Clean. Prod. 2022, 330, 129921. [Google Scholar] [CrossRef]
  9. Heffron, R.J.; McCauley, D. The ‘just transition’ threat to our Energy and Climate 2030 targets. Energy Policy 2022, 165, 112949. [Google Scholar] [CrossRef]
  10. Zou, Y.; Wang, M. Does environmental regulation improve energy transition performance in China? Environ. Impact Assess. Rev. 2024, 104, 107335. [Google Scholar] [CrossRef]
  11. Dong, Y.; Zhang, Y.; Liu, S. The impacts and instruments of energy transition regulations on environmental pollution. Environ. Impact Assess. Rev. 2024, 105, 107448. [Google Scholar] [CrossRef]
  12. Elagib, N.A.; Al-Saidi, M. Balancing the benefits from the water–energy–land–food nexus through agroforestry in the Sahel. Sci. Total Environ. 2020, 742, 140509. [Google Scholar] [CrossRef] [PubMed]
  13. Favi, S.G.; Adamou, R.; Godjo, T.; Giri, N.C.; Kuleape, R.; Trommsdorff, M. Agrivoltaic systems offer symbiotic benefits across the water-energy-food-environment nexus in West Africa: A systematic review. Energy Res. Soc. Sci. 2024, 117, 103737. [Google Scholar] [CrossRef]
  14. Gao, Y.; Zhang, H.; Shi, X.; Wang, Y. Coupling Coordination Analysis of the Water–Land–Energy–Food–Carbon Nexus: A Case Study of Beijing. J. Urban Plan. Dev. 2025, 151, 05025016. [Google Scholar] [CrossRef]
  15. Zhang, R.; Worden, S.; Xu, J.; Owen, J.R.; Shi, G. Social stability risk assessment and economic competitiveness in China. Humanit. Soc. Sci. Commun. 2022, 9, 309. [Google Scholar] [CrossRef]
  16. Gazal, A.A.; Jakrawatana, N.; Silalertruksa, T.; Gheewala, S.H. Water-energy-land-food nexus for bioethanol development in Nigeria. Biomass Convers. Biorefinery 2024, 14, 1749–1762. [Google Scholar] [CrossRef]
  17. Heffron, R.J. Applying energy justice into the energy transition. Renew. Sustain. Energy Rev. 2022, 156, 111936. [Google Scholar] [CrossRef]
  18. Ibrahim, M.D.; Ferreira, D.C.; Daneshvar, S.; Marques, R.C. Transnational resource generativity: Efficiency analysis and target setting of water, energy, land, and food nexus for OECD countries. Sci. Total Environ. 2019, 697, 134017. [Google Scholar] [CrossRef]
  19. Jiang, T.; Zhang, R.; Zhang, F.; Shi, G.; Wang, C. Assessing provincial coal reliance for just low-carbon transition in China. Environ. Impact Assess. Rev. 2023, 102, 107198. [Google Scholar] [CrossRef]
  20. Keson, J.; Silalertruksa, T.; Gheewala, S.H. Land suitability class and implications to Land-Water-Food Nexus: A case of rice cultivation in Thailand. Energy Nexus 2023, 10, 100205. [Google Scholar] [CrossRef]
  21. Akbar, H.; Nilsalab, P.; Silalertruksa, T.; Gheewala, S.H. An inclusive approach for integrated systems: Incorporation of climate in the water-food-energy-land nexus index. Sustain. Prod. Consum. 2023, 39, 42–52. [Google Scholar] [CrossRef]
  22. Chapman, A.; Shigetomi, Y.; Ohno, H.; McLellan, B.; Shinozaki, A. Evaluating the global impact of low-carbon energy transitions on social equity. Environ. Innov. Soc. Transit. 2021, 40, 332–347. [Google Scholar] [CrossRef]
  23. Amadei, B. A systems approach to the sustainability–peace nexus. Sustain. Sci. 2021, 16, 1111–1124. [Google Scholar] [CrossRef]
  24. Banerjee, A.; Schuitema, G. How just are just transition plans? Perceptions of decarbonisation and low-carbon energy transitions among peat workers in Ireland. Energy Res. Soc. Sci. 2022, 88, 102616. [Google Scholar] [CrossRef]
  25. Kitessa, B.D.; Ayalew, S.M.; Gebrie, G.S.; Teferi, S.T. Optimization of urban resources efficiency in the domain of water–energy–food nexus through integrated modeling: A case study of Addis Ababa city. Water Policy 2022, 24, 397–431. [Google Scholar] [CrossRef]
  26. Burke, M.J. Energy-Sufficiency for a Just Transition: A Systematic Review. Energies 2020, 13, 2444. [Google Scholar] [CrossRef]
  27. Li, Y.; Zhang, R. A Review of Water-Energy-Food Nexus Development in a Just Energy Transition. Energies 2023, 16, 6253. [Google Scholar] [CrossRef]
  28. Wang, X.; Zhang, R.; Jiang, T. Energy justice and decarbonization: A critical assessment for just energy transition in China. Environ. Impact Assess. Rev. 2024, 105, 107420. [Google Scholar] [CrossRef]
  29. Yang, K.; Han, Q.; Yang, D.; De Vries, B. Exploring the Relationship Between Land Use and the Food-Water-Energy Nexus: Insights From A Systematic Literature Review. Land Degrad. Dev. 2025, 36. [Google Scholar] [CrossRef]
  30. Lucca, E.; El Jeitany, J.; Castelli, G.; Pacetti, T.; Bresci, E.; Nardi, F.; Caporali, E. A review of water-energy-food-ecosystems Nexus research in the Mediterranean: Evolution, gaps and applications. Environ. Res. Lett. 2023, 18, 083001. [Google Scholar] [CrossRef]
  31. Mansour, F.; Al-Hindi, M.; Yassine, A.; Najjar, E. Multi-criteria approach for the selection of water, energy, food nexus assessment tools and a case study application. J. Environ. Manag. 2022, 322, 116139. [Google Scholar] [CrossRef] [PubMed]
  32. Prinsloo, F.C.; Schmitz, P.; Lombard, A. System dynamics characterisation and synthesis of floating photovoltaics in terms of energy, environmental and economic parameters with WELF nexus sustainability features. Sustain. Energy Technol. Assess. 2023, 55, 102901. [Google Scholar] [CrossRef]
  33. Carley, S.; Konisky, D.M. The justice and equity implications of the clean energy transition. Nat. Energy 2020, 5, 569–577. [Google Scholar] [CrossRef]
  34. Ni, Y.; Chen, Y. Does the implementation sequence of adaptive management countermeasures affect the collaborative security of the water-energy-food nexus? A case study in the Yangtze River Economic Belt. Ecol. Indic. 2024, 163, 112090. [Google Scholar] [CrossRef]
  35. Okumu, B.; Kehbila, A.G.; Osano, P. A review of water-forest-energy-food security nexus data and assessment of studies in East Africa. Curr. Res. Environ. Sustain. 2021, 3, 100045. [Google Scholar] [CrossRef]
  36. Sall, M.T.; Diop, P.; Wellens, J.; Seck, M.; Chopart, J.L. A Framework for IWRM in the Water-Energy-Food Nexus for the Senegal River Delta. In Climate Change and Water Resources in Africa; Diop, S., Scheren, P., Niang, A., Eds.; Springer International Publishing: Berlin/Heidelberg, Germany, 2021; pp. 145–170. [Google Scholar] [CrossRef]
  37. Tang, M.; Li, Z.; Hu, F.; Wu, B. How does land urbanization promote urban eco-efficiency? The mediating effect of industrial structure advancement. J. Clean. Prod. 2020, 272, 122798. [Google Scholar] [CrossRef]
  38. Wang, X.; Lo, K. Just transition: A conceptual review. Energy Res. Soc. Sci. 2021, 82, 102291. [Google Scholar] [CrossRef]
  39. Yu, Y.; Li, K.; Duan, S.; Song, C. Economic growth and environmental pollution in China: New evidence from government work reports. Energy Econ. 2023, 124, 106803. [Google Scholar] [CrossRef]
  40. Cao, Y.; Mi, W.; Zhang, R. Provincial ESG performance in China: Evolution trends and the role of environmental regulation. Environ. Impact Assess. Rev. 2024, 107, 107570. [Google Scholar] [CrossRef]
  41. Ringler, C.; Bhaduri, A.; Lawford, R. The nexus across water, energy, land and food (WELF): Potential for improved resource use efficiency? Curr. Opin. Environ. Sustain. 2013, 5, 617–624. [Google Scholar] [CrossRef]
  42. Yuan, M.; Zheng, N.; Yang, Y.; Liu, C. Robust optimization for sustainable agricultural management of the water-land-food nexus under uncertainty. J. Clean. Prod. 2023, 403, 136846. [Google Scholar] [CrossRef]
Figure 1. Three-dimensional kernel density estimation plot of WELF nexus performance level.
Land 14 01343 g001
Figure 2. Three-dimensional kernel density estimation plot of WELF nexus performance relevance level.
Land 14 01343 g002
Figure 3. WELF nexus performance level and performance relevance trends. Note: figure (a) is WELF nexus performance level trend and figure (b) is WELF nexus performance relevance level trend.
Land 14 01343 g003
Figure 4. WELF nexus performance change over the past 17 years.
Land 14 01343 g004aLand 14 01343 g004b
Figure 5. Driving factors of WELF performance relevance levels across China. Note: (a) is the relationship between lnx1 and WELF performance relevance; (b) is the relationship between lnx2, lnx3, lnx5 and WELF performance relevance; (c) is the relationship between lnx4, lnx6 and WELF performance relevance.
Land 14 01343 g005
Figure 6. Driving factors of WELF performance relevance levels in Eastern China. Note: (a) is the relationship between lnx1 and WELF performance relevance; (b) is the relationship between lnx2, lnx3, lnx6 and WELF performance relevance; (c) is the relationship between lnx4, lnx5 and WELF performance relevance.
Land 14 01343 g006
Figure 7. Driving factors of WELF performance relevance levels in Central China. Note: (a) is the relationship between lnx1, lnx6 and WELF performance relevance; (b) is the relationship between lnx3, lnx4, lnx5 and WELF performance relevance; (c) is the relationship between lnx2 and WELF performance relevance.
Land 14 01343 g007
Figure 8. Driving factors of WELF performance relevance levels in Western China. Note: (a) is the relationship between lnx1, lnx6 and WELF performance relevance; (b) is the relationship between lnx3, lnx5 and WELF performance relevance; (c) is the relationship between lnx2, lnx4 and WELF performance relevance.
Land 14 01343 g008
Table 1. Evaluation index system of the water–energy–land–food nexus.
DimensionsIndicatorsDirection
WaterWater resources per capitaPositive
Water consumption per capitaNegative
Industrial water consumptionNegative
Agricultural water useNegative
EnergyEnergy consumption per unit of GDPNegative
Energy consumption growth rateNegative
Proportion of clean energy consumptionPositive
Proportion of coal energy consumptionNegative
LandArable landPositive
Woodland areaPositive
Land for transportationPositive
Land transfer rateNegative
FoodFood production per capitaPositive
Fluctuations in food productionPositive
Grain productionPositive
Non-grain yieldsPositive
Table 2. Descriptive statistics for core variables.
Variable SymbolVariable MeaningSample SizeMeanStandard DeviationMinimumMaximum
CDegree of coupling (performance level)5100.840.180.170.99
DCoupling coordination (performance relevance level)5100.500.100.200.72
X1Economic development level51052,862.5132,669.147778.00200,278.00
X2Industrialization level51041.568.3914.9161.96
X3Market-oriented level5107.961.933.3612.86
X4Human capital level5102714.40980.70904.006964.00
X5Population density5109695.485933.031330.9029,304.95
X6Environmental regulation51055.1719.546.00124.00
Table 3. Benchmark regression results.
VariablesExplained Variable: Performance Relevance Level
(1)(2)(3)(4)
lnx10.962 ***0.824 ***1.162 ***1.189 ***
(0.125)(0.119)(0.123)(0.124)
lnx12−0.048 ***−0.044 ***−0.057 ***−0.059 ***
(0.006)(0.006)(0.006)(0.006)
lnx2 0.023 **0.260 **0.260 **
(0.011)(0.013)(0.013)
lnx3 0.149 ***0.187 ***0.186 ***
(0.017)(0.017)(0.017)
lnx4 −0.069 ***−0.071 ***
(0.011)(0.011)
lnx5 0.014 ***0.015 ***
(0.005)(0.005)
lnx6 −0.012 *
(0.007)
Constant−4.357 ***−3.822 ***−5.358 ***−5.466 ***
(0.674)(0.631)(0.648)(0.649)
Sample size510510510510
R20.4220.4950.5210.522
Year fixed effectsControlControlControlControl
Region fixed effectsControlControlControlControl
Note: *, **, and *** represent significance at the 10%, 5%, and 1% levels, respectively; the values in parentheses are the robust standard errors.
Table 4. Heterogeneity analysis.
VariablesExplained Variable: Performance Relevance Level
Eastern Region
(1)
Central Region
(2)
Western Region
(3)
lnx11.028 ***0.558−0.092
(0.191)(0.540)(0.255)
lnx12−0.052 ***−0.0260.013
(0.009)(0.025)(0.012)
lnx20.066 ***−0.217 ***−0.397 ***
(0.018)(0.030)(0.042)
lnx30.101 **0.118 ***0.155 ***
(0.043)(0.037)(0.022)
lnx4−0.133 ***0.105 ***−0.041 **
(0.015)(0.026)(0.018)
lnx5−0.061 ***0.052 ***0.065 ***
(0.008)(0.008)(0.006)
lnx60.028 ***−0.005−0.003
(0.009)(0.011)(0.010)
Constant−3.645 ***−3.2790.827
(1.015)(2.893)(1.366)
Sample size187136187
R20.6680.5830.580
Note: **, and *** represent significance at the 5%, and 1% levels, respectively; the values in parentheses are the robust standard errors.
Table 5. Robustness test results.
VariablesExplained Variable: Performance Relevance Level
(1)(2)(3)(4)
lnx10.989 ***0.847 ***1.180 ***1.212 ***
(0.131)(0.125)(0.129)(0.130)
lnx12−0.050 ***−0.045 ***−0.058 ***−0.060 ***
(0.006)(0.006)(0.006)(0.006)
lnx2 0.026 **0.029 **0.029 **
(0.012)(0.013)(0.013)
lnx3 0.148 ***0.187 ***0.186 ***
(0.017)(0.018)(0.018)
lnx4 −0.069 ***−0.071 ***
(0.011)(0.011)
lnx5 0.015 ***0.016 ***
(0.005)(0.005)
lnx6 −0.012 *
(0.007)
Constant−4.477 ***−3.934 ***−5.452 ***−5.586 ***
(0.708)(0.663)(0.678)(0.680)
Sample size480480480480
R20.4260.4990.5260.527
Year fixed effectsControlControlControlControl
Region fixed effectsControlControlControlControl
Note: *, **, and *** represent significance at the 10%, 5%, and 1% levels, respectively; the values in parentheses are the robust standard errors.
Disclaimer/Publisher’s Note: The statements, opinions and data contained in all publications are solely those of the individual author(s) and contributor(s) and not of MDPI and/or the editor(s). MDPI and/or the editor(s) disclaim responsibility for any injury to people or property resulting from any ideas, methods, instructions or products referred to in the content.

