
A Study on the Optimization of Ecological Spatial Structure Based on Landscape Risk Assessment: A Case Study of Wensu County, Xinjiang, China


Abstract
1. Introduction
2. Study Area and Data Sources
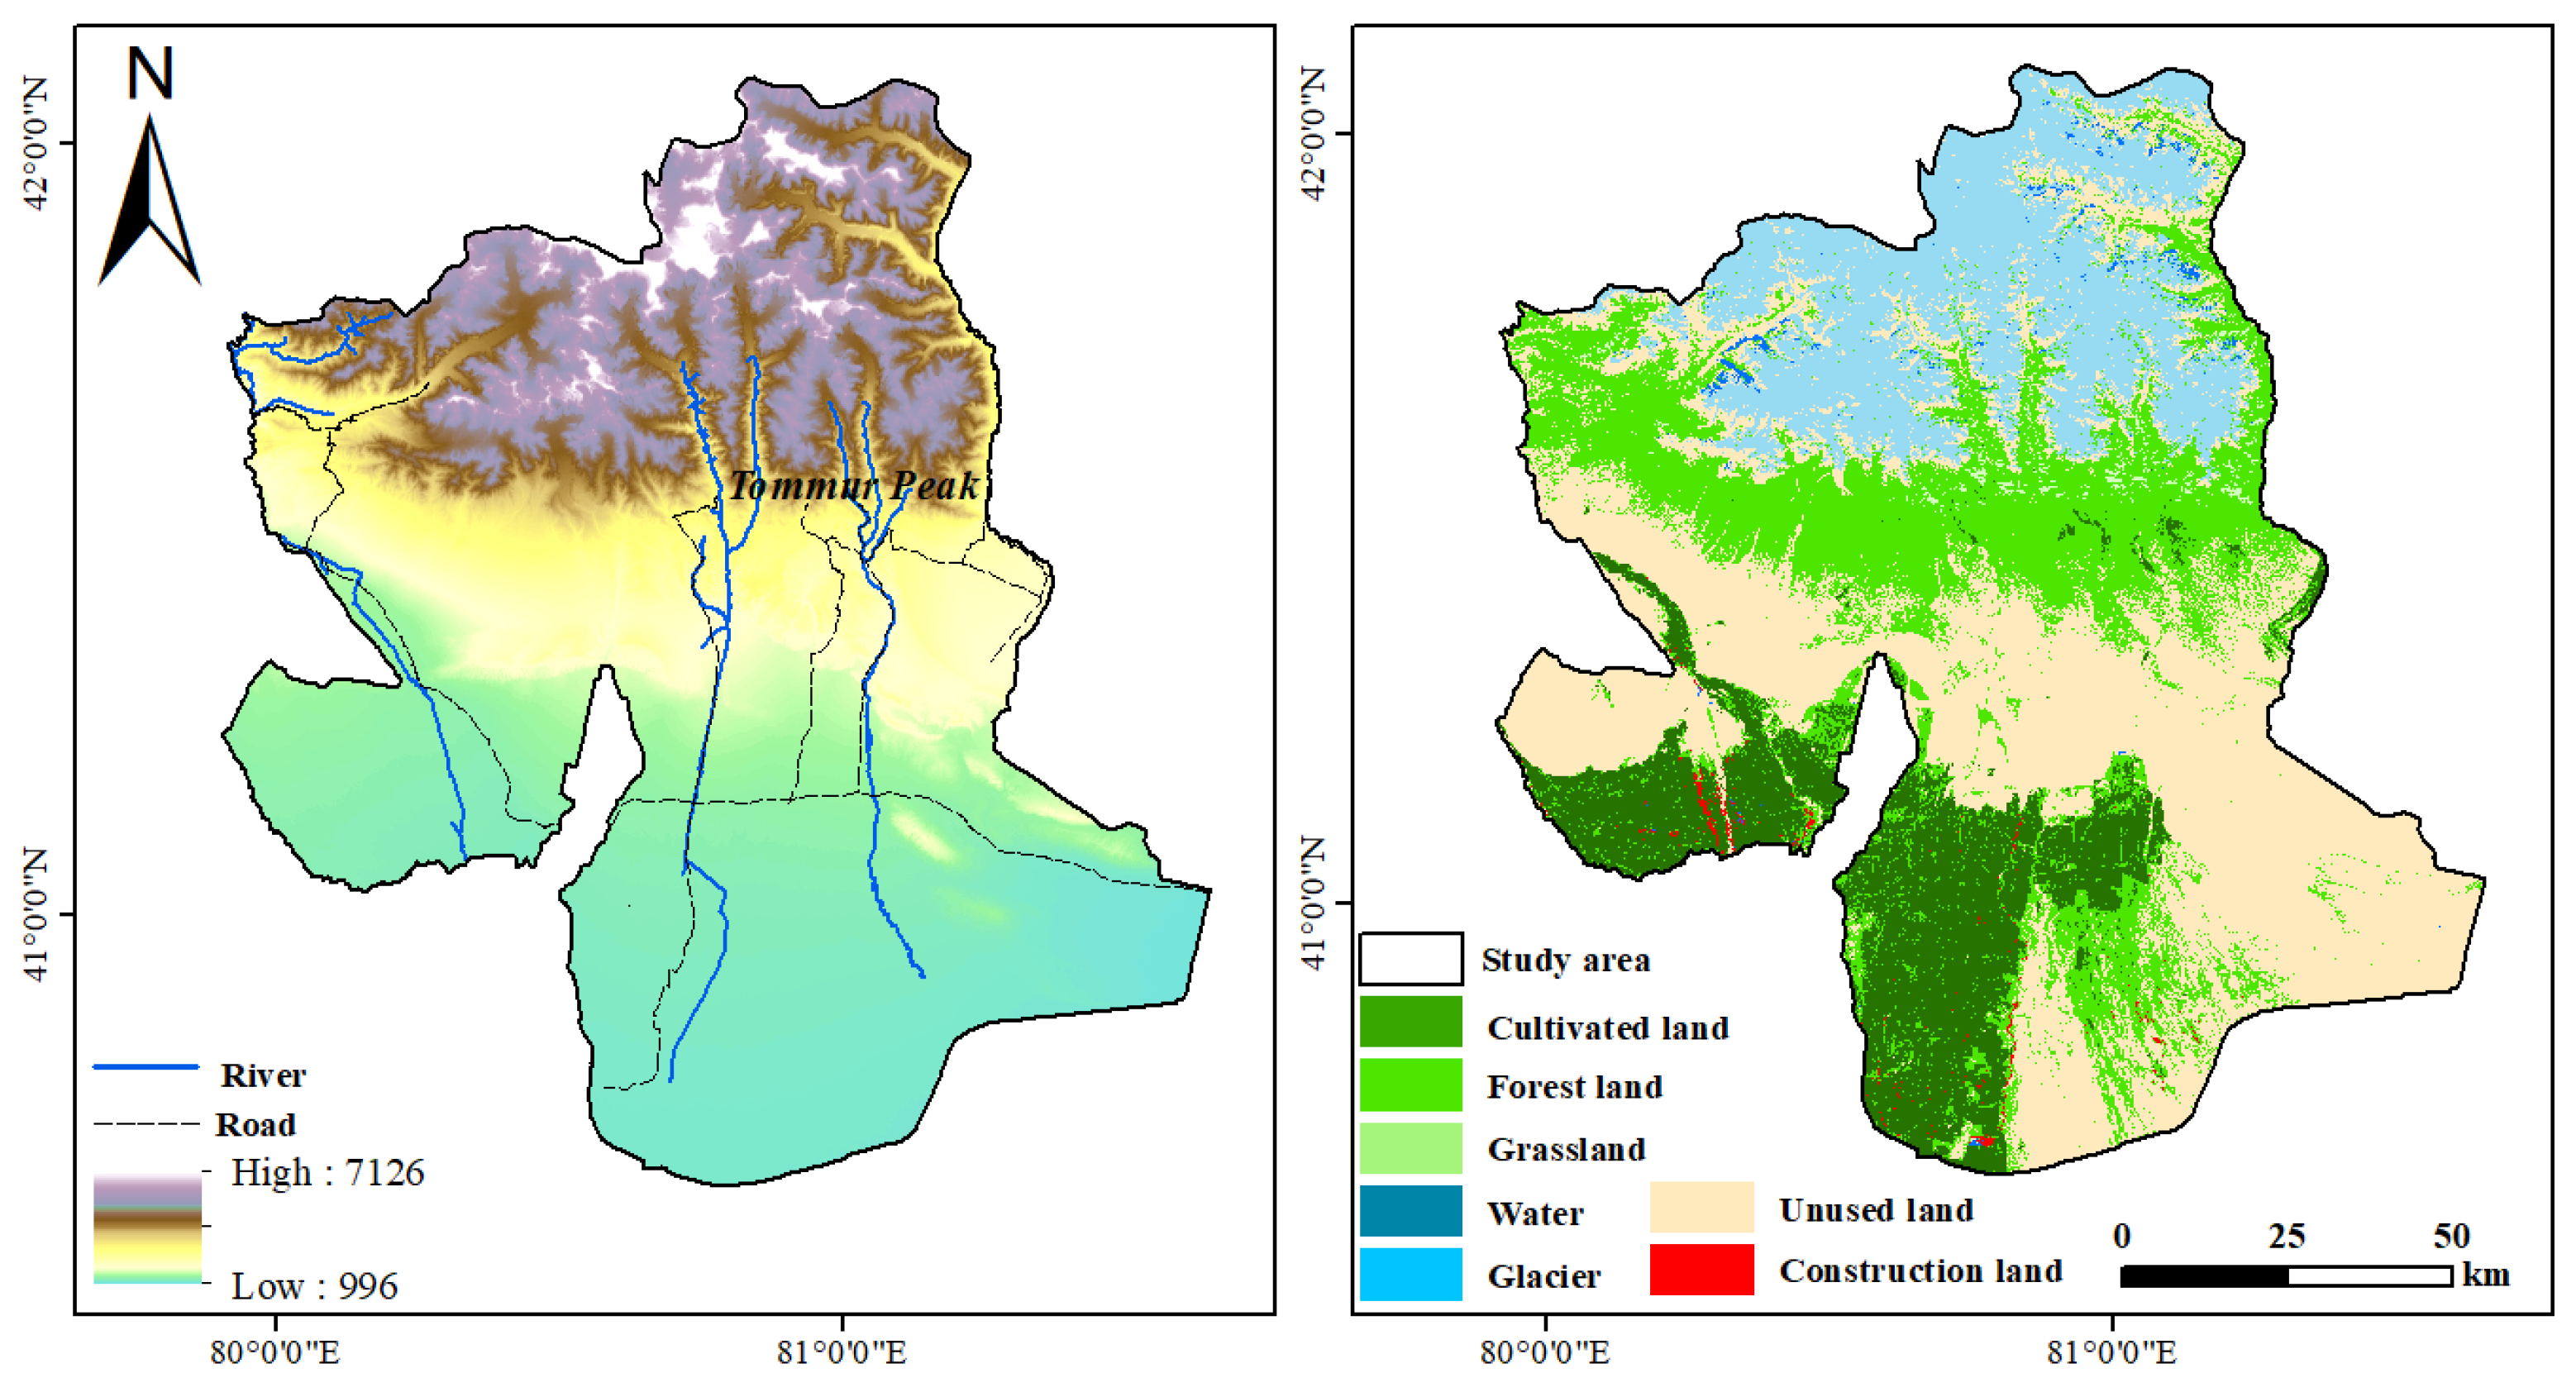
2.1. Study Area
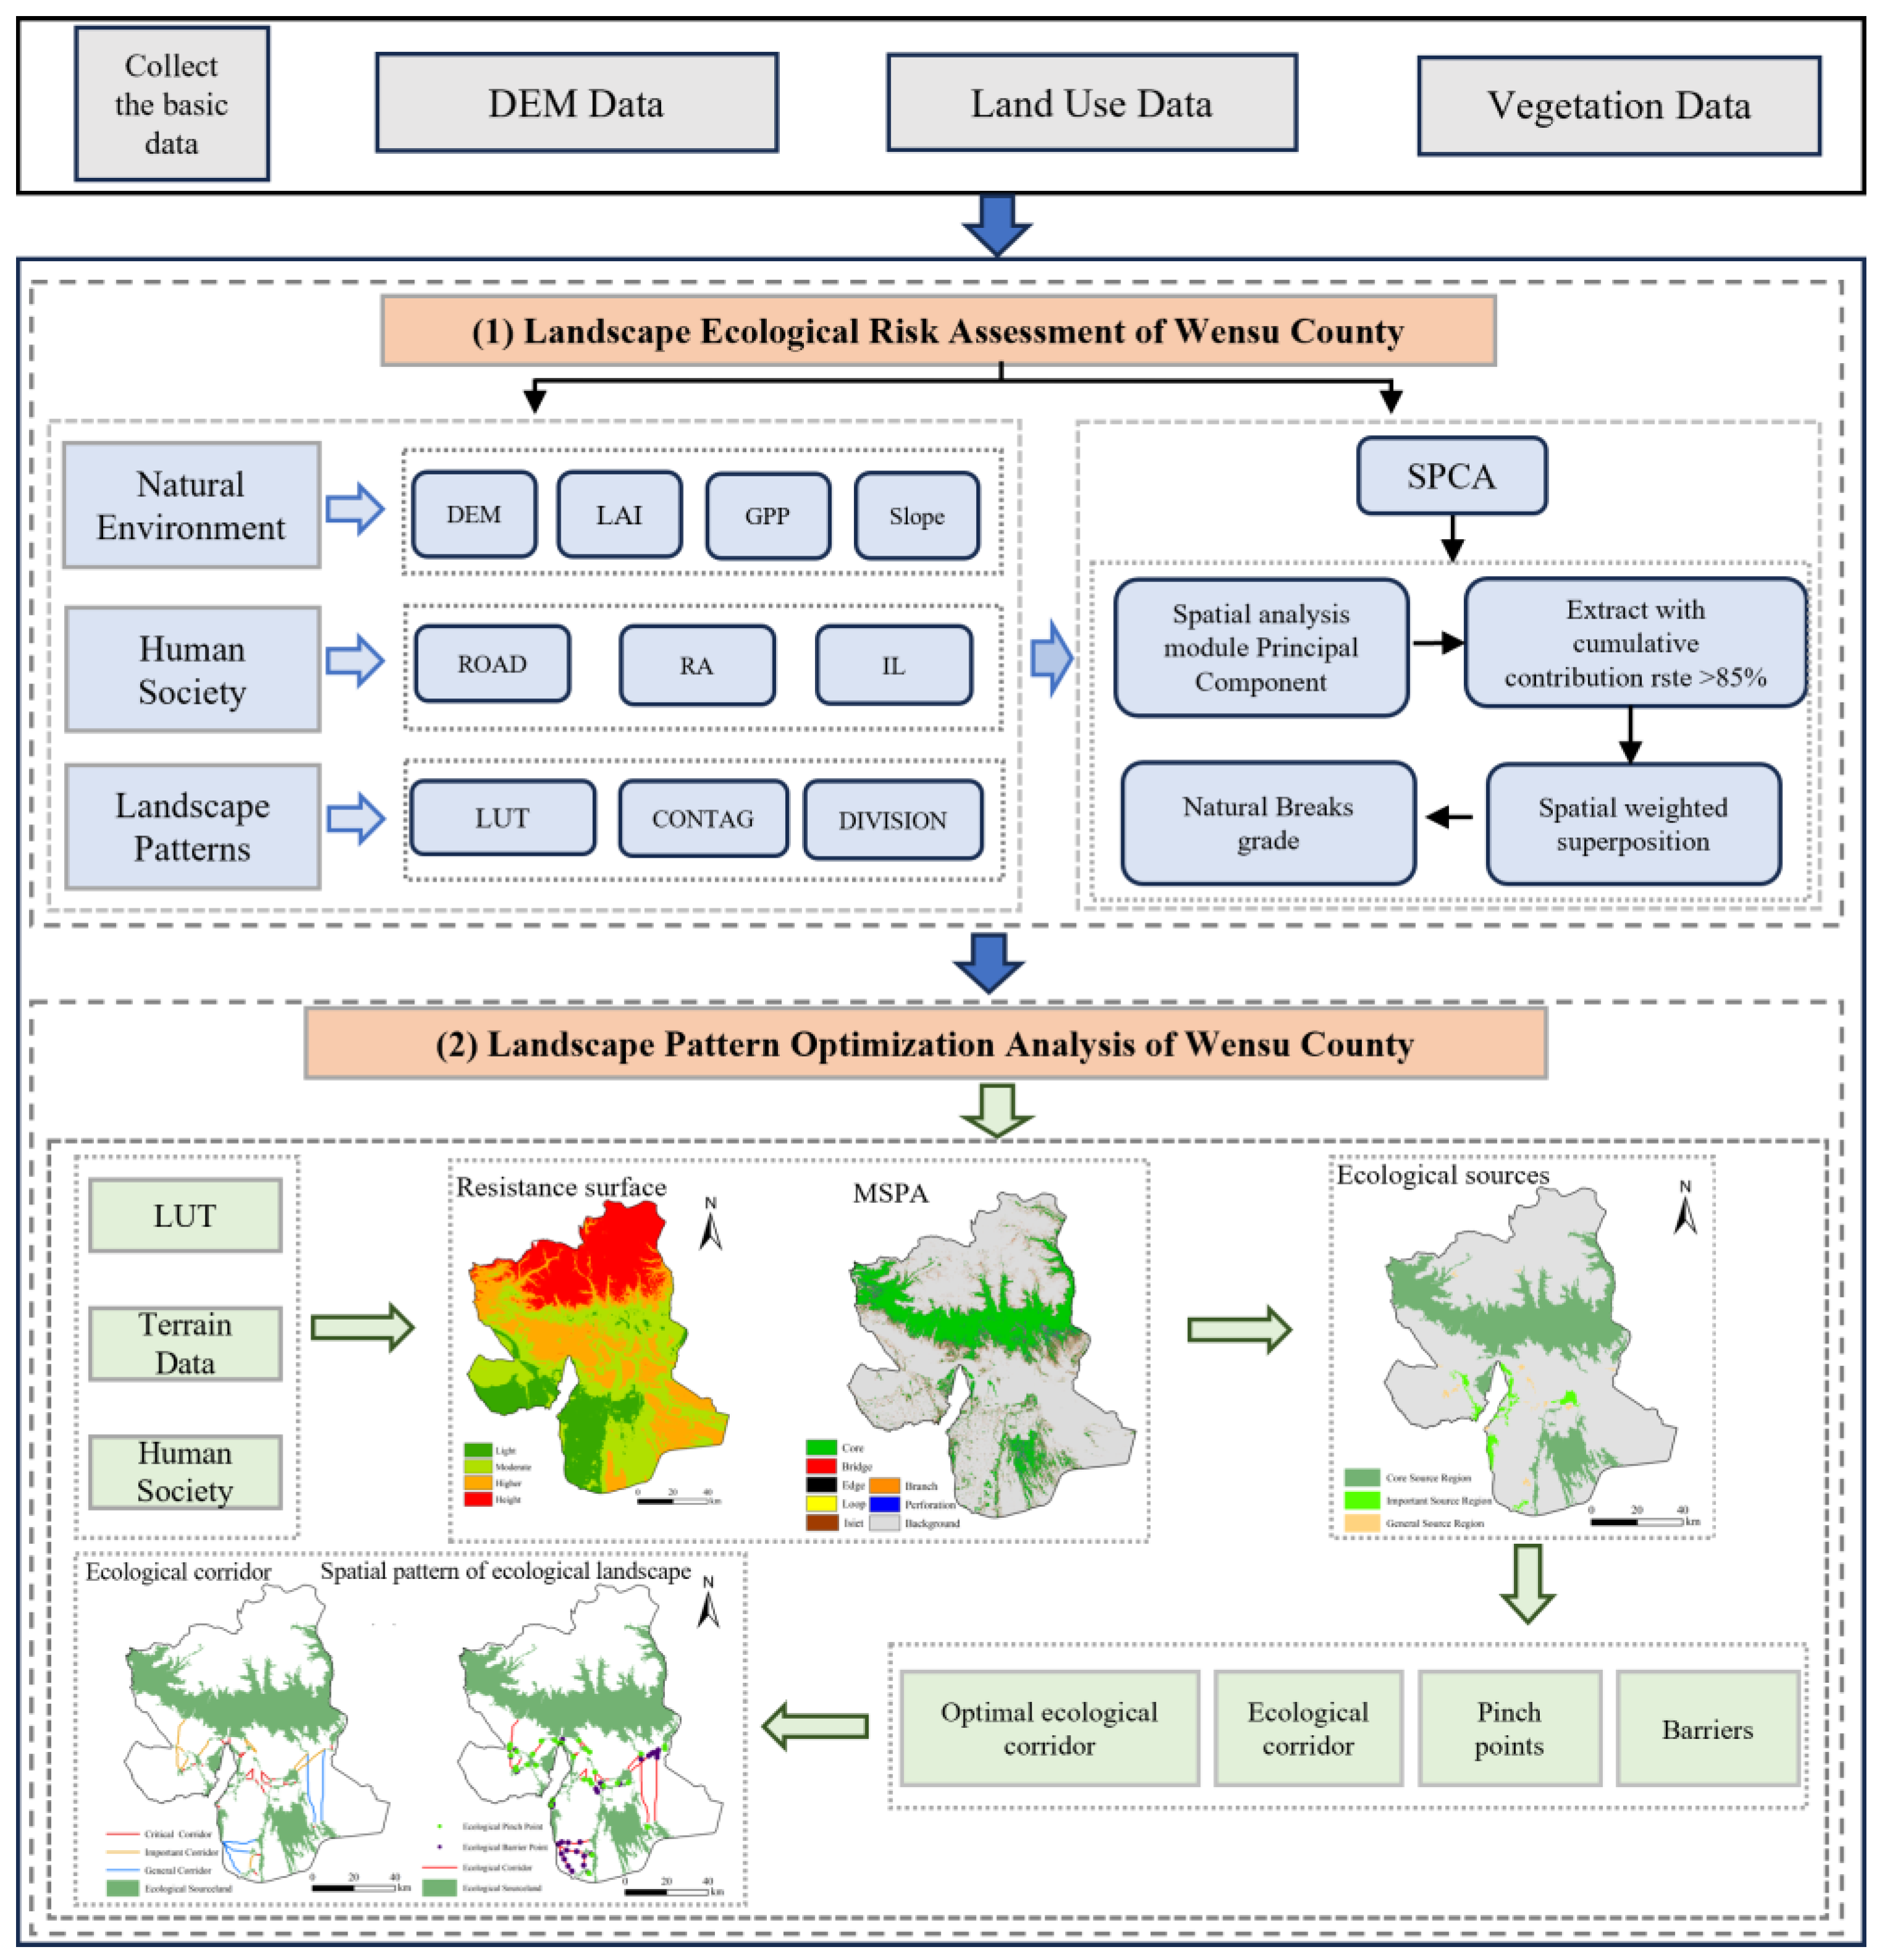
2.2. Methodology
2.3. Data Sources
2.4. Selection of Landscape Ecological Risk Indicators
2.4.1. Natural Environment Indicators

| Dimension | Indicator | Risk Level | Classification Criteria | Reference |
|---|---|---|---|---|
| Natural Environment | DEM (m) | 1 | <1200 | (Chen et al., 2023) [32] |
| 2 | 1200–1900 | |||
| 3 | 1900–2000 | |||
| 4 | >2000 | |||
| Slope (°) | 1 | <8 | (Tang and Song, 2006) [33] | |
| 2 | 8–15 | |||
| 3 | 15–25 | |||
| 4 | >25 | |||
| Gross Primary Productivity | 4 | 0–2 | (Xie et al., 2019) [34] | |
| 3 | 2–6 | |||
| 2 | 6–8 | |||
| 1 | >8 | |||
| Leaf Area Index (LAI) | 1 | 0–7 | (Tian et al., 2023) [35] | |
| 4 | 7–15 | |||
| 3 | 15–24 | |||
| 2 | >24 | |||
| Human Society | Distance to Water Bodies (m) | 4 | 0–1000 | (Wang et al., 2016) [31] |
| 3 | 1000–2000 | |||
| 2 | 2000–3000 | |||
| 1 | >3000 | |||
| Distance to Industrial Sites | 4 | 0–3500 | (Zhang et al., 2021) [36] | |
| 3 | 3500–7000 | |||
| 2 | 7000–10,000 | |||
| 1 | >10000 | |||
| Distance to Roads | 4 | 0–500 | (Gao et al., 2023) [37] | |
| 3 | 500–1500 | |||
| 2 | 1500–2500 | |||
| 1 | >2500 | |||
| Distance to Residential Areas | 4 | 0–3078 | (Gao et al., 2023) [37] | |
| 3 | 3078–6003 | |||
| 2 | 6003–17,706 | |||
| 1 | >17,706 | |||
| Landscape Pattern | Land Use Type | 1 | Forest, shrubland, sparse forest, other forest, high-cover grassland, lakes | (Wang et al.,2023) [38] |
| 2 | Paddy fields, medium-cover grassland, rivers, marshland, reservoirs/ponds | |||
| 3 | Dry farmland, low-cover grassland, beaches, bare land | |||
| 4 | Other construction land, urban land, rural settlements | |||
| Contagion Index (CONTAG) | 4 | 0–17.45 | (Jian et al., 2014) [39] | |
| 3 | 17.45–45.90 | |||
| 2 | 45.90–69.80 | |||
| 1 | 69.80–96.74 | |||
| Landscape Division Index | 1 | 0–0.15 | (Gao et al., 2023) [37] | |
| 2 | 0.15–0.35 | |||
| 3 | 0.35–0.61 | |||
| 4 | >0.61 |
2.4.2. Human Society Indicators
2.4.3. Landscape Pattern Indicators
2.4.4. Calculation of Landscape Ecological Risk Values
2.5. Landscape Pattern Optimization
2.5.1. Identifying and Optimizing Ecological Source Areas
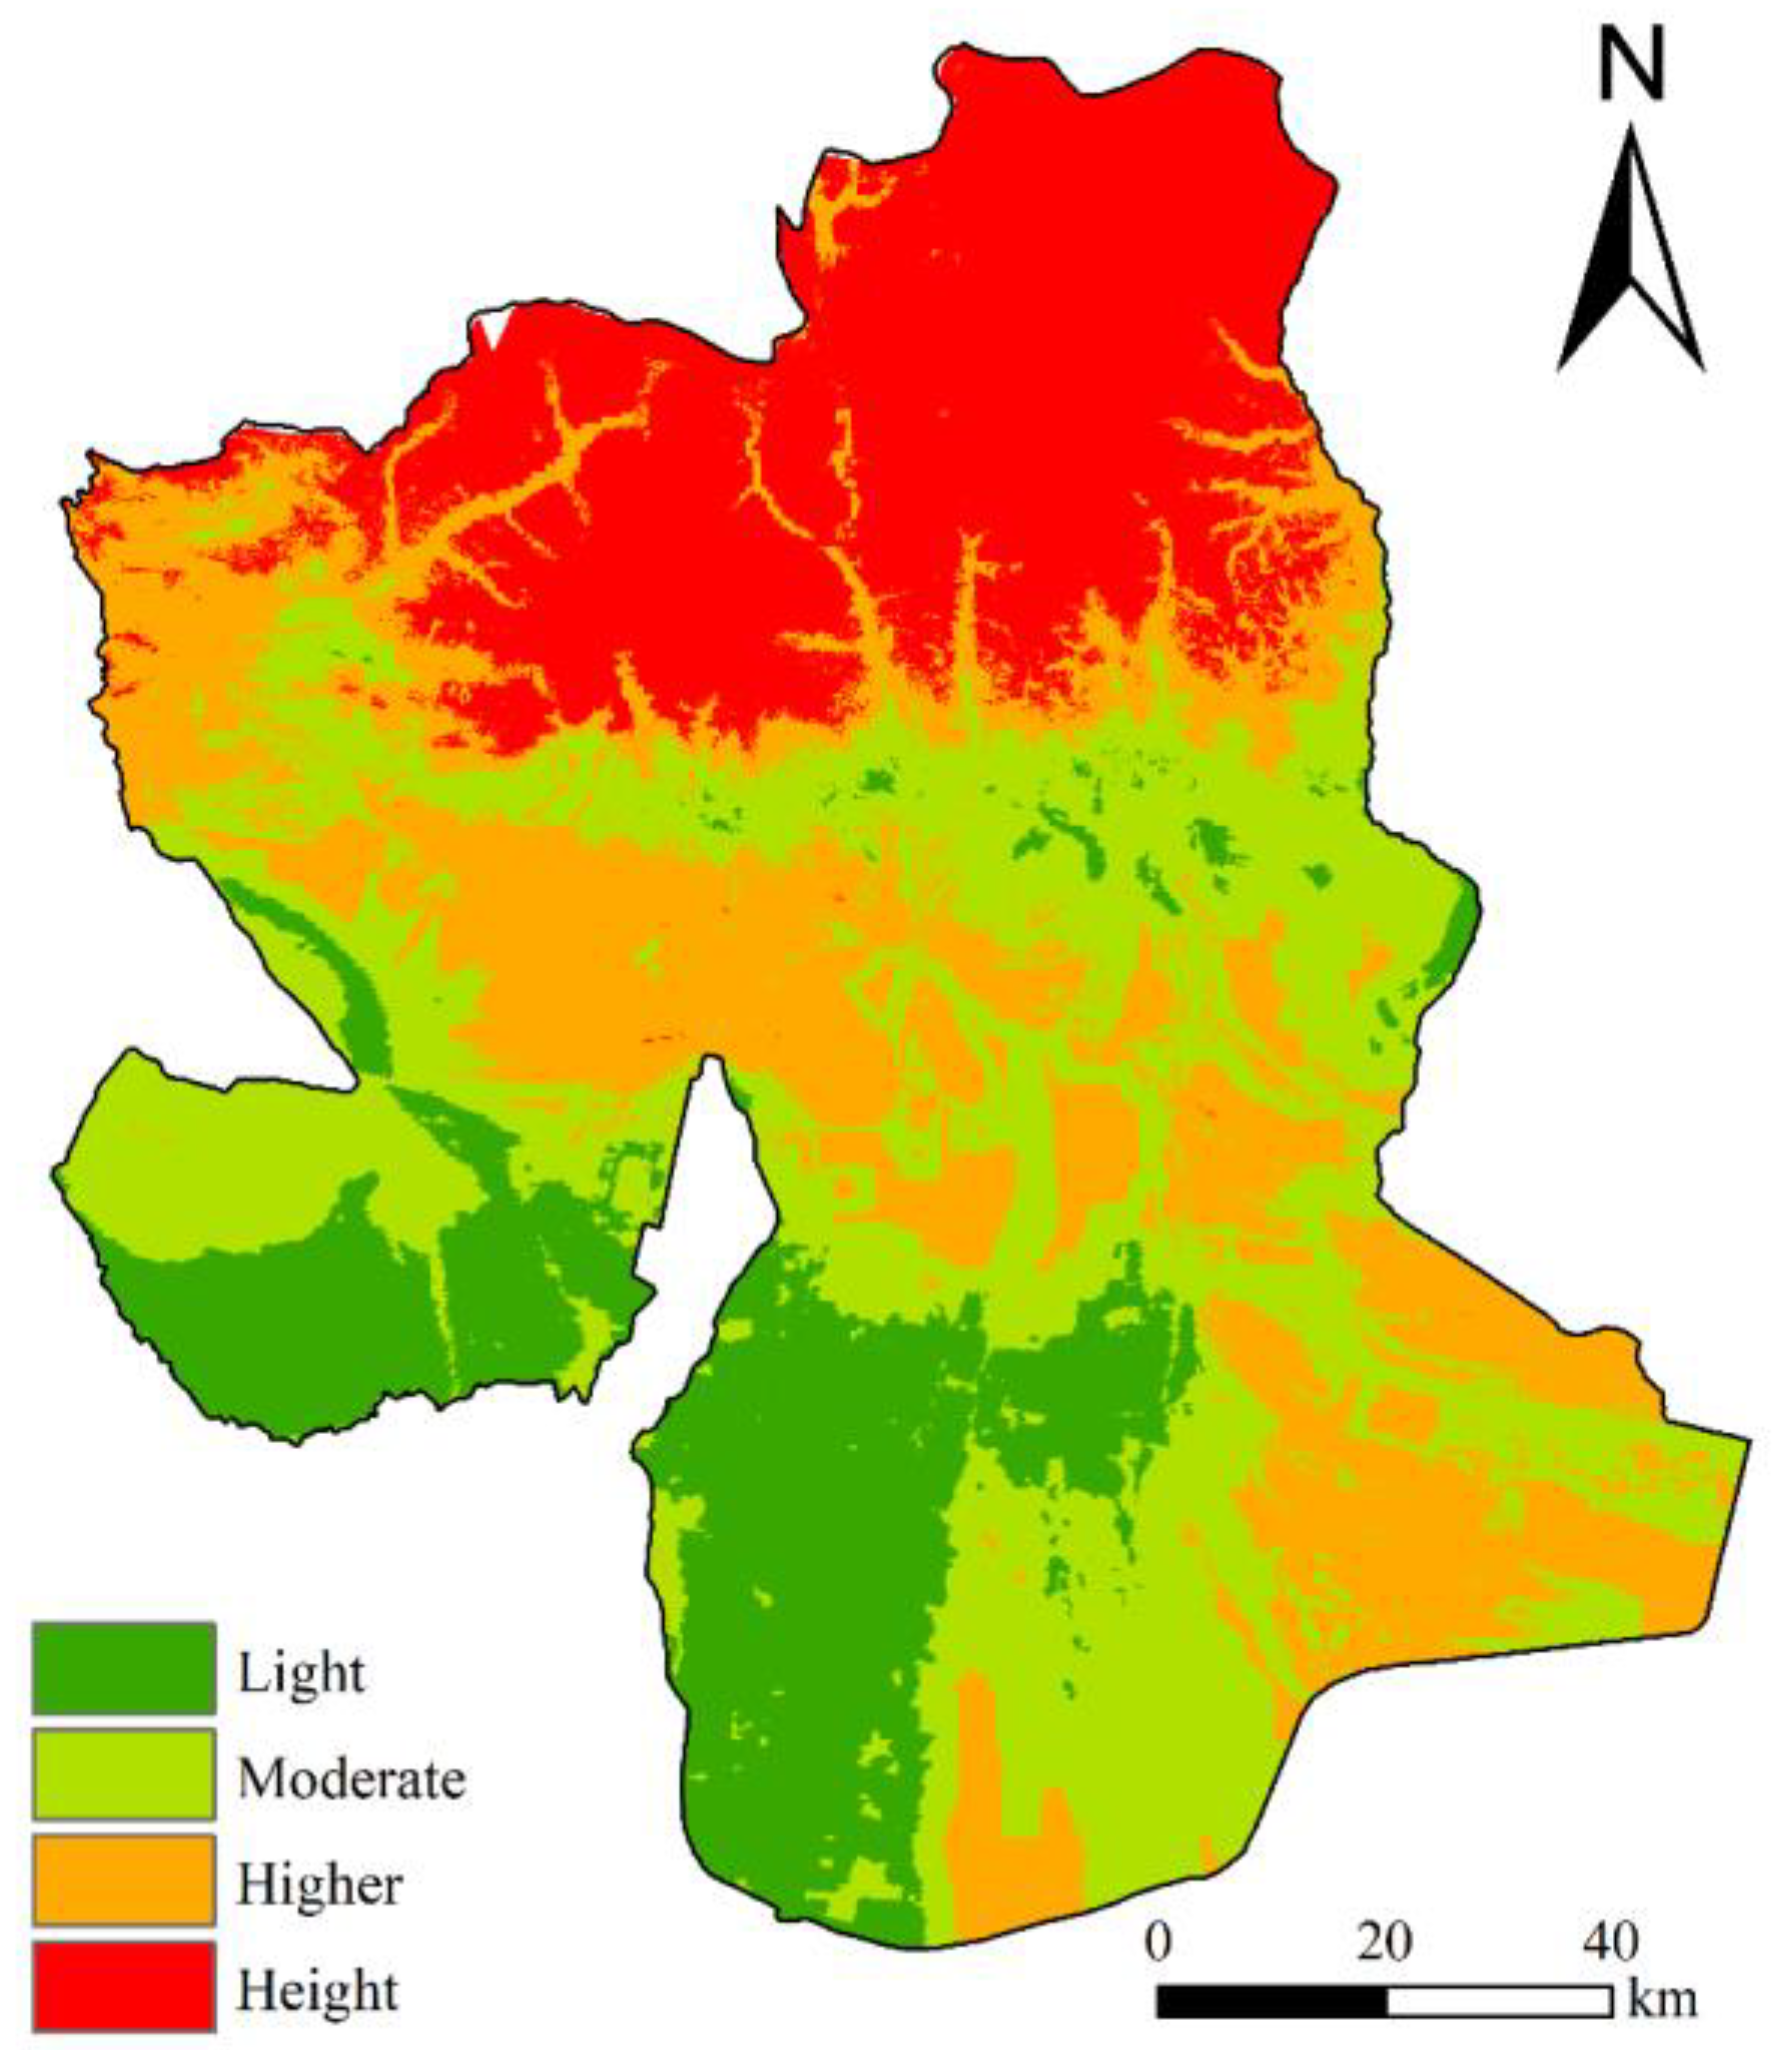
2.5.2. Construction of the Integrated Ecological Resistance Surface
2.5.3. Construction of Ecological Corridors
2.5.4. Identification of Ecological Nodes
3. Results and Analysis
3.1. Landscape Ecological Risk Assessment in Wensu County
3.1.1. Three-Dimensional Landscape Ecological Risk Assessment: Natural Environment–Human Society–Landscape Pattern
3.1.2. Landscape Ecological Risk Evaluation
3.2. Landscape Pattern Optimization in Wensu County
3.2.1. Identification of Ecological Source Areas in Wensu County
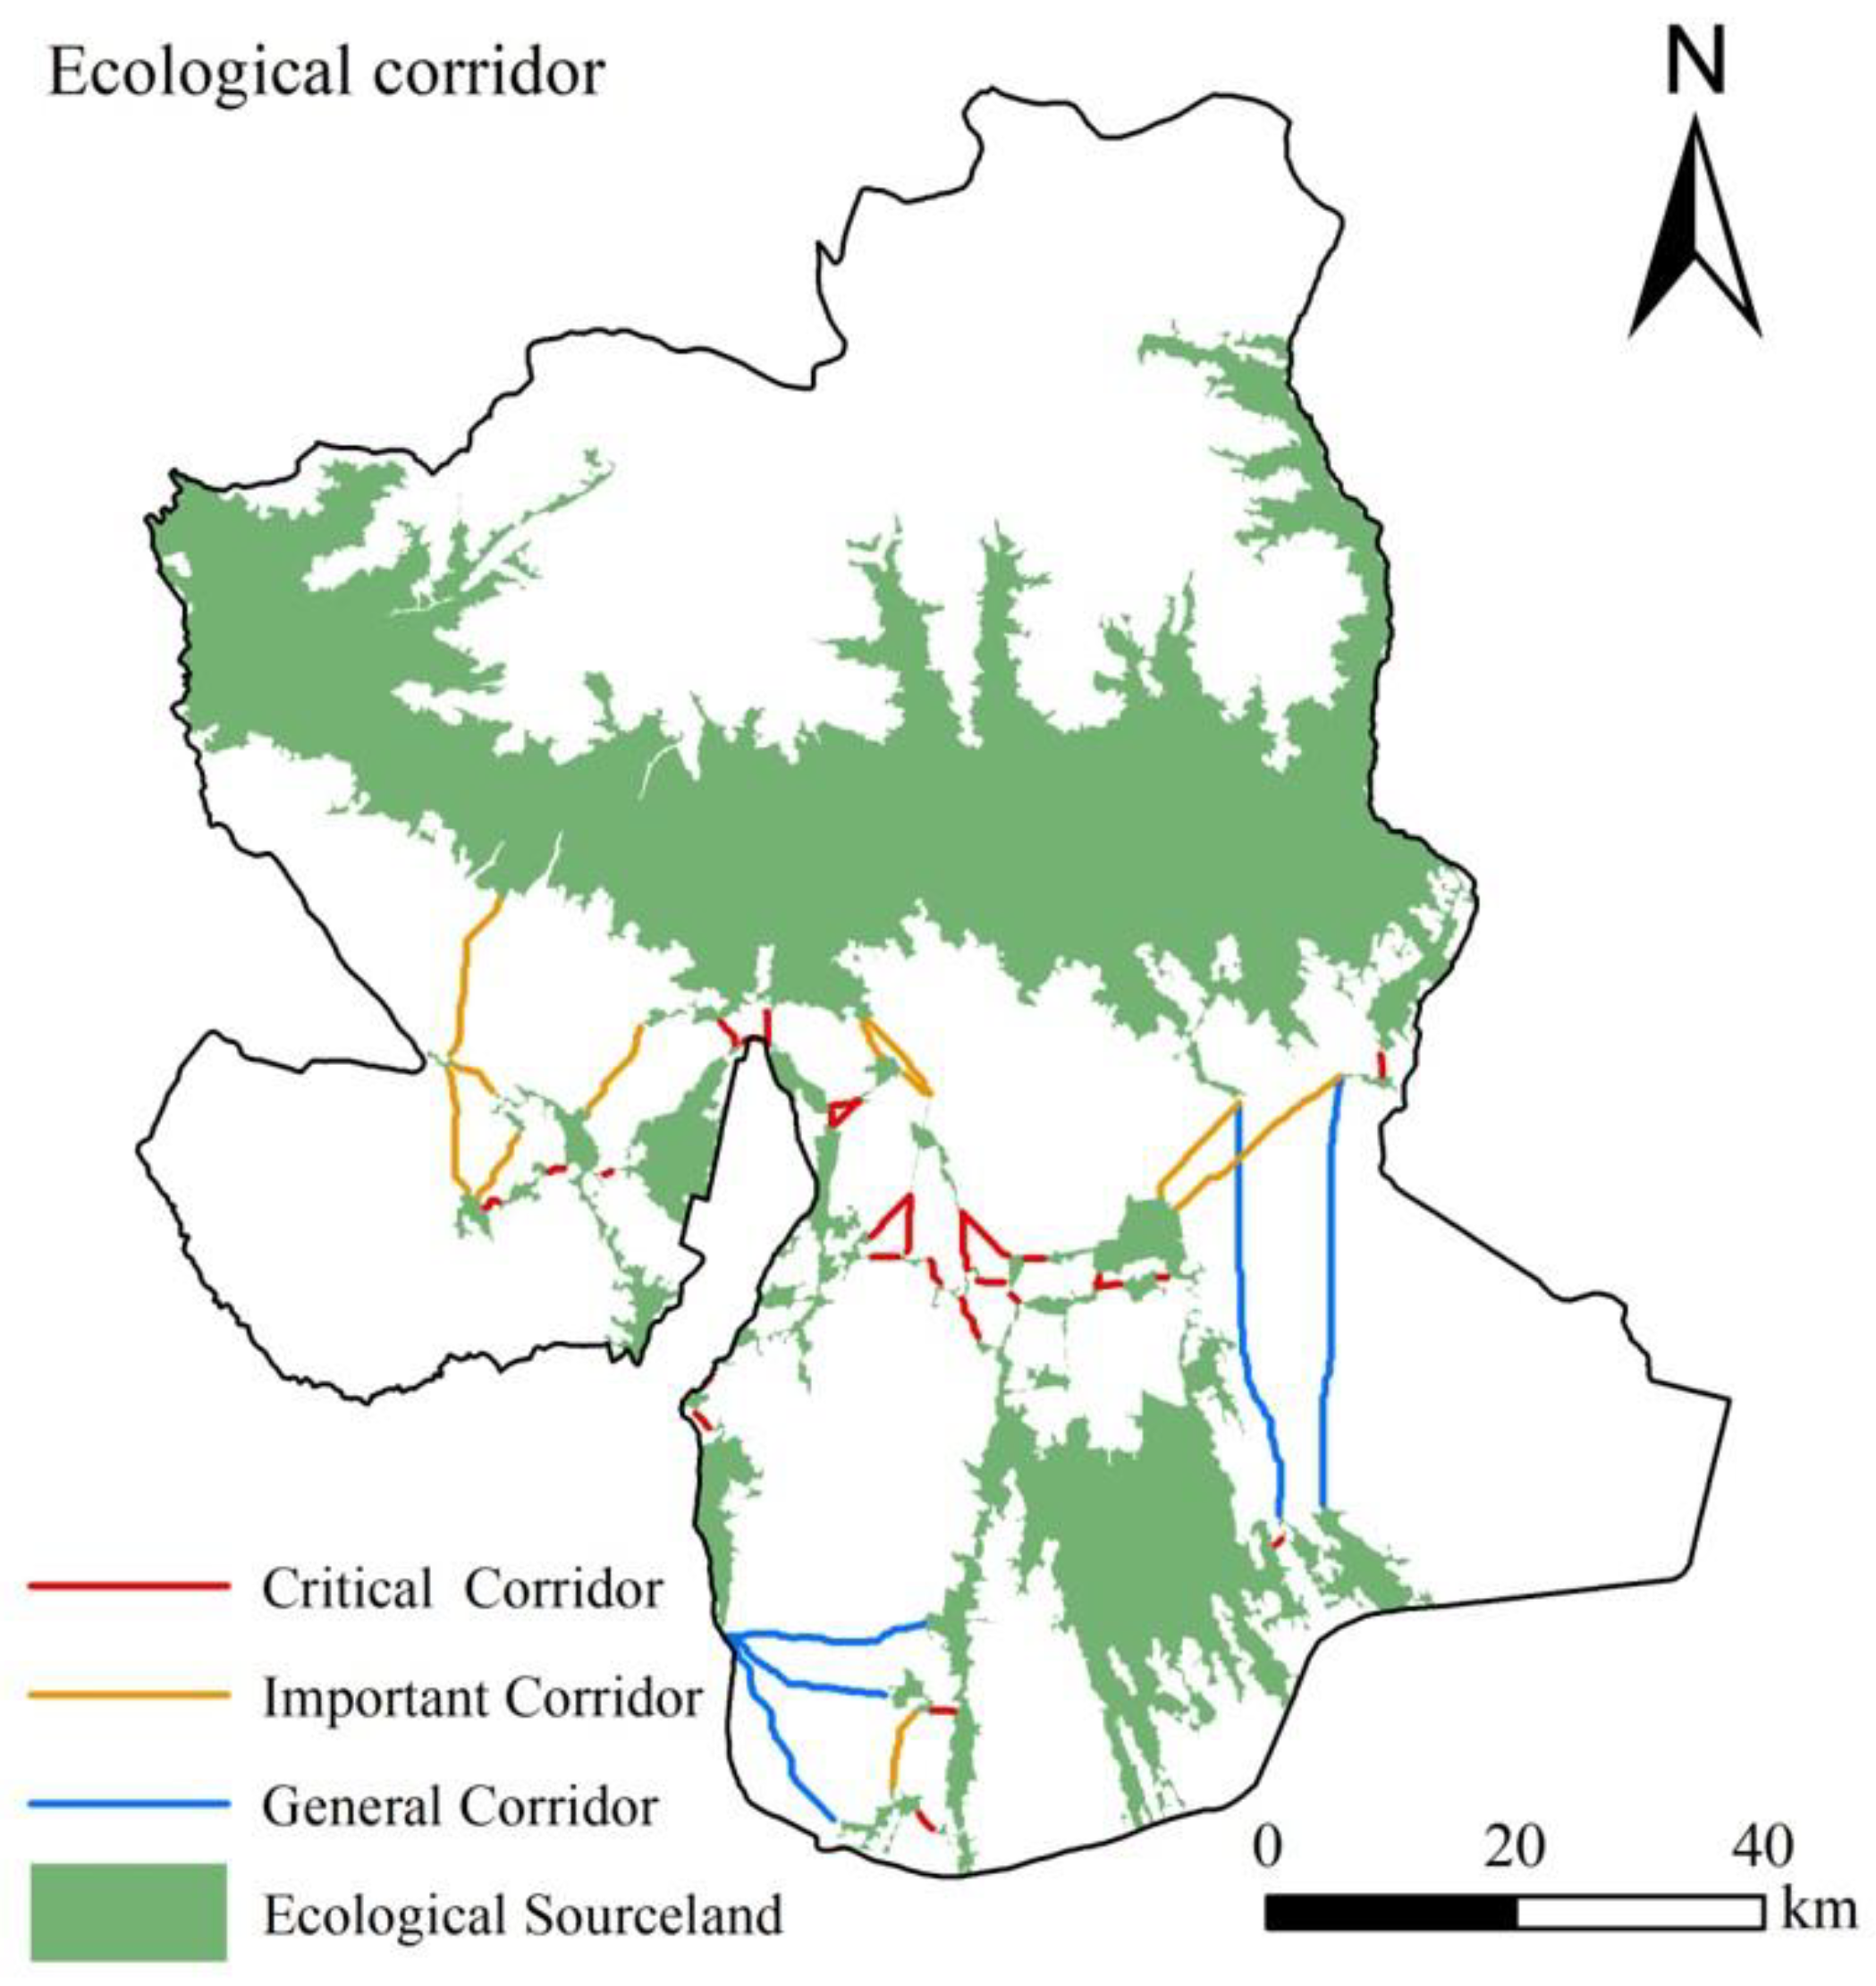
3.2.2. Construction of Ecological Corridors in Wensu County
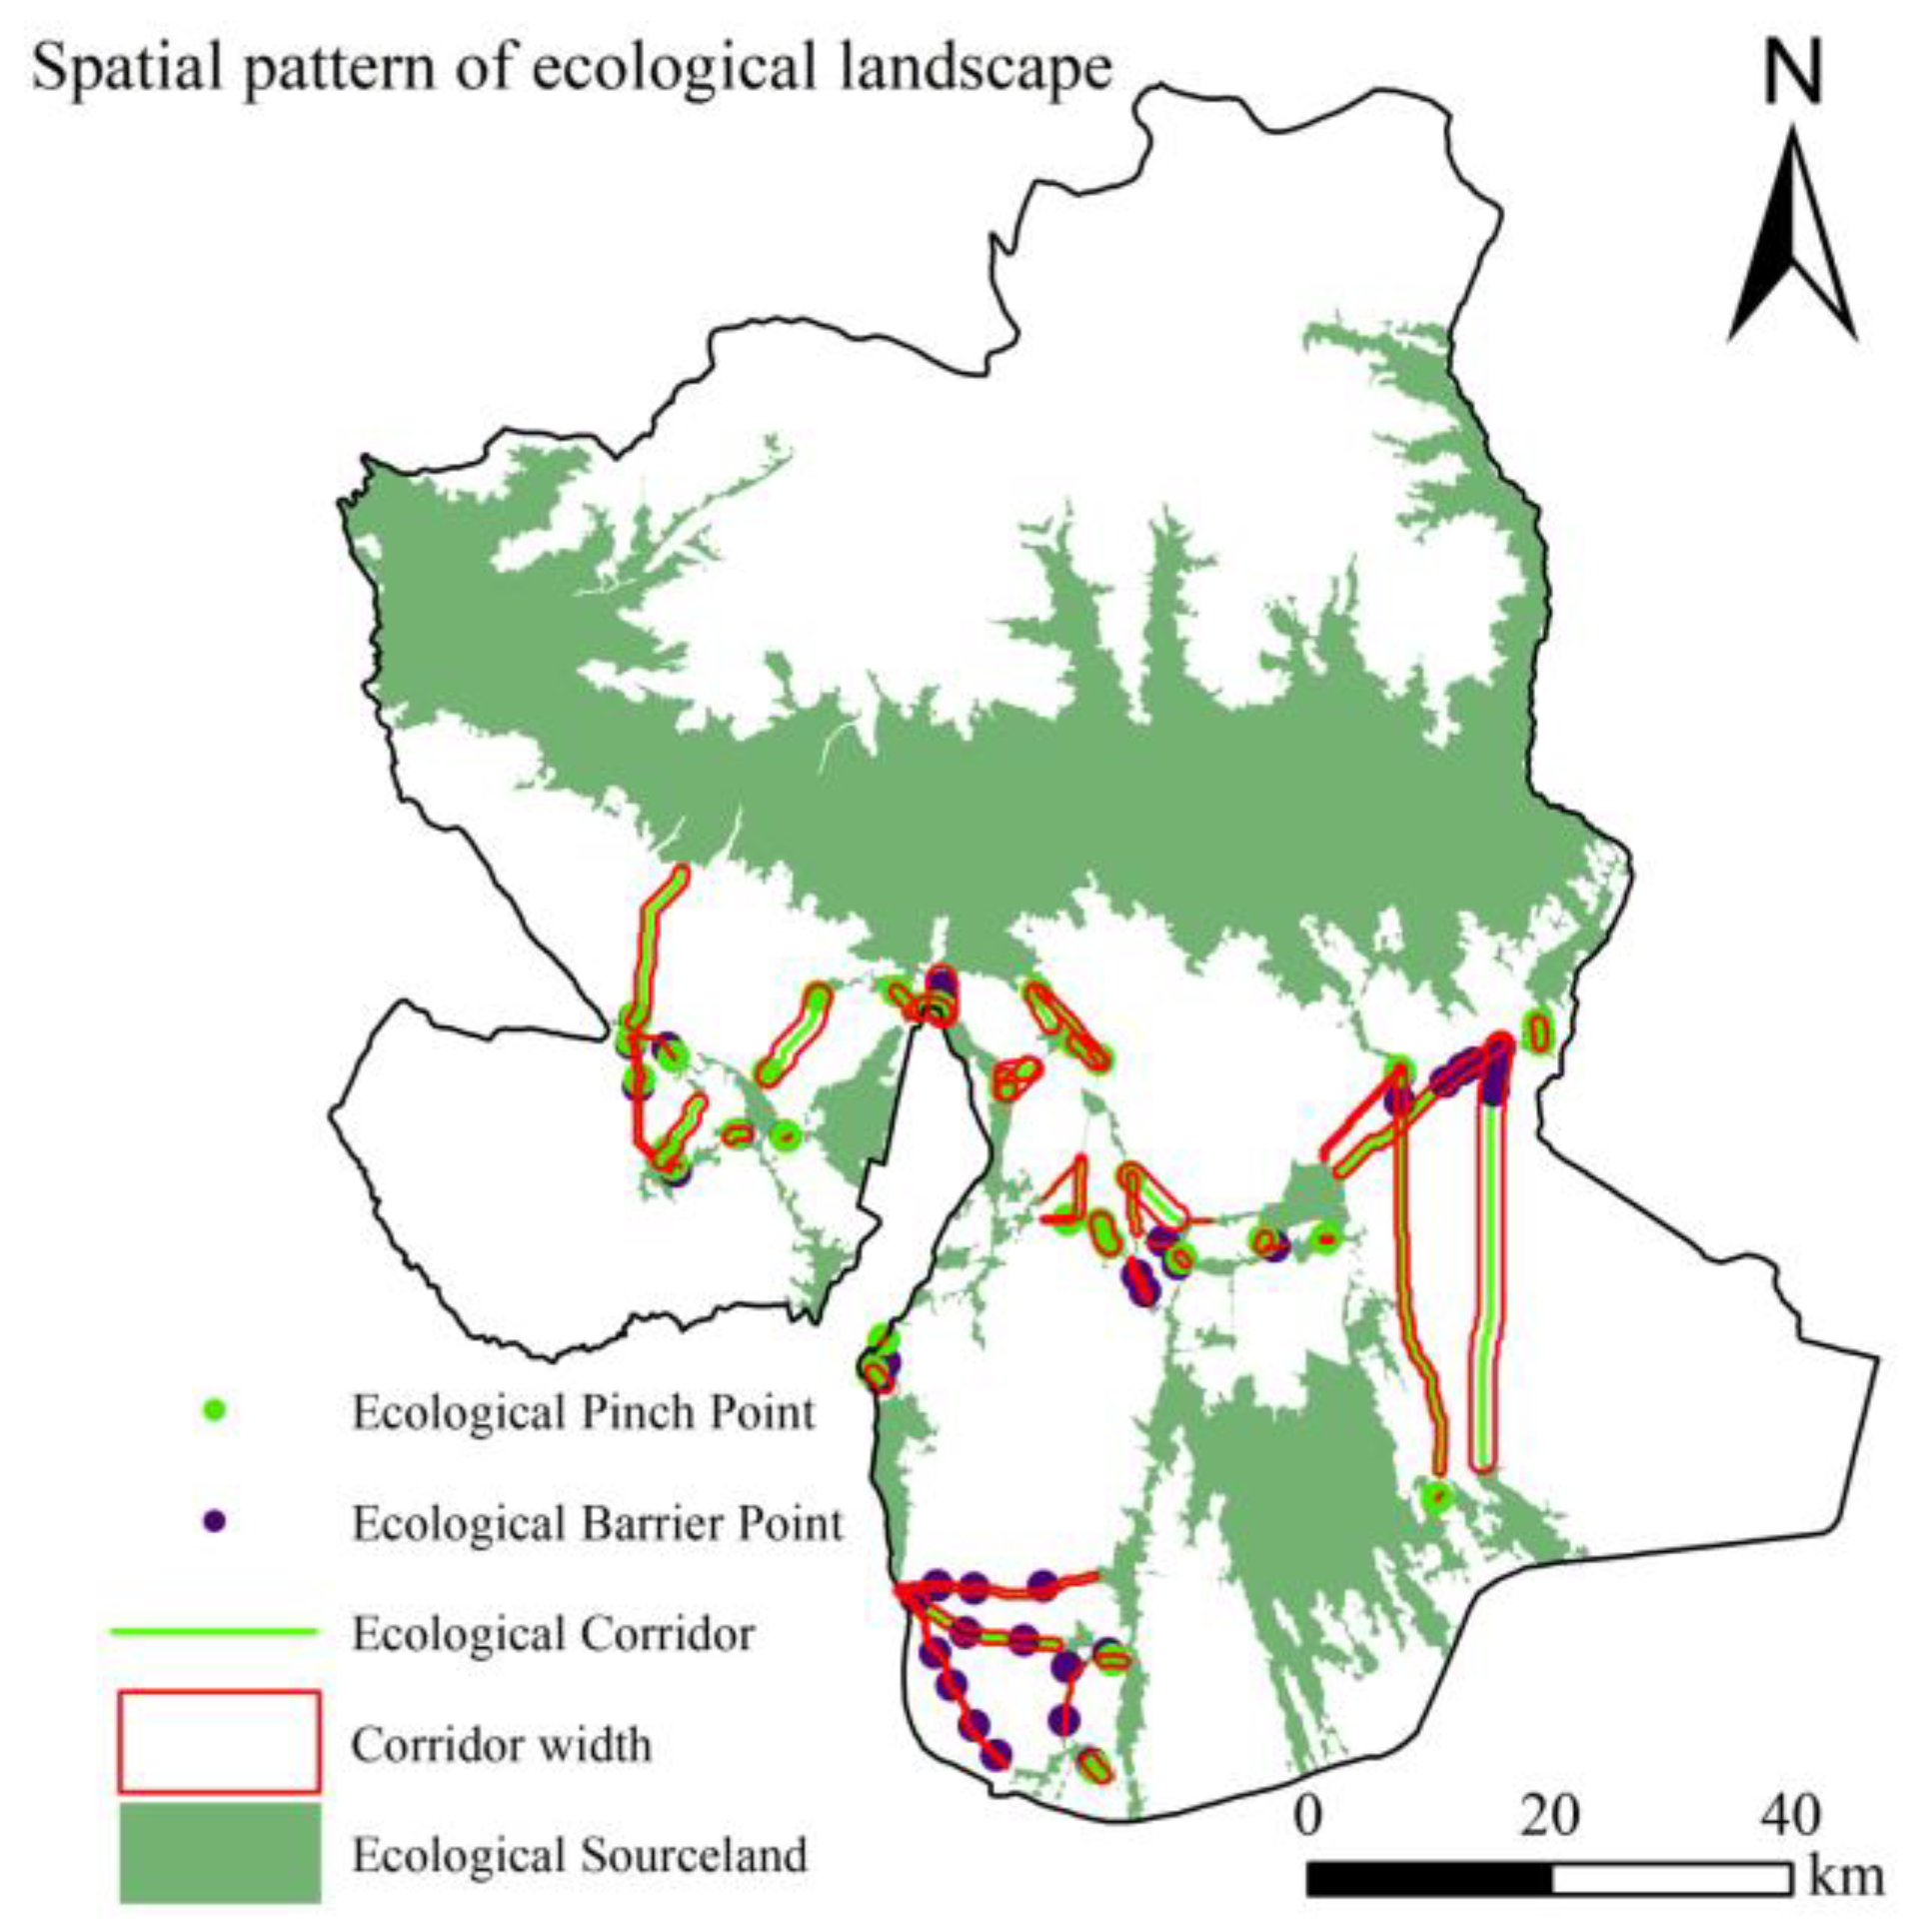
3.2.3. Identification of Ecological Pinch Points and Barriers in Wensu County
3.2.4. Evaluation of Landscape Optimization Effectiveness
4. Discussion
5. Conclusions
Author Contributions
Funding
Data Availability Statement
Conflicts of Interest
References
- Li, H.; Peng, J.; Liu, Y.; Hu, Y. Urbanization impact on landscape patterns in Beijing City, China: A spatial heterogeneity perspective. Ecol. Indic. 2017, 82, 50–60. [Google Scholar] [CrossRef]
- Laurance, W.F.; Clements, G.R.; Sloan, S.; O’connell, C.S.; Mueller, N.D.; Goosem, M.; Venter, O.; Edwards, D.P.; Phalan, B.; Balmford, A. A global strategy for road building. Nature 2014, 513, 229–232. [Google Scholar] [CrossRef]
- Li, F.; Wang, R.; Paulussen, J.; Liu, X. Comprehensive concept planning of urban greening based on ecological principles: A case study in Beijing, China. Landsc. Urban Plan. 2005, 72, 325–336. [Google Scholar] [CrossRef]
- Zhao, C.; Wu, S.Y.; Yang, L.; Wu, Y.X.; Xiao, P.N.; Xu, J.; Liu, Y.J. Evaluating ecological conservation effectiveness of security patterns under multiple scenarios: A case study of Hubei Province. Ecol. Indic. 2024, 166. [Google Scholar] [CrossRef]
- Gong, D.H.; Huang, M.; Ge, Y.; Zhu, D.Y.; Chen, J.F.; Chen, Y.; Zhang, L.; Hu, B.S.; Lai, S.H.; Lin, H. Revolutionizing ecological security pattern with multi-source data and deep learning: An adaptive generation approach. Ecol. Indic. 2025, 173. [Google Scholar] [CrossRef]
- Hou, Y.; Burkhard, B.; Müller, F. Uncertainties in landscape analysis and ecosystem service assessment. J. Environ. Manag. 2013, 127, S117–S131. [Google Scholar] [CrossRef] [PubMed]
- Jin, X.; Wei, L.; Wang, Y.; Lu, Y. Construction of ecological security pattern based on the importance of ecosystem service functions and ecological sensitivity assessment: A case study in Fengxian County of Jiangsu Province, China. Environ. Dev. Sustain. 2021, 23, 563–590. [Google Scholar] [CrossRef]
- McRae, B.H.; Dickson, B.G.; Keitt, T.H.; Shah, V.B. Using circuit theory to model connectivity in ecology, evolution, and conservation. Ecology 2008, 89, 2712–2724. [Google Scholar] [CrossRef] [PubMed]
- Wu, Y.; Han, Z.; Meng, J.; Zhu, L. Circuit theory-based ecological security pattern could promote ecological protection in the Heihe River Basin of China. Environ. Sci. Pollut. Res. 2023, 30, 27340–27356. [Google Scholar] [CrossRef]
- Qin, X.L.; Ling, H.B.; Shan, Q.J.; Zhang, G.P.; Yan, J.J.; Gong, Y.M.; Xu, J.; Meng, X.D. Construction of ecological security patterns in typical arid regions based on the synergy of efficient ecological water utilization and environmental quality enhancement. Catena 2025, 249, 108713. [Google Scholar] [CrossRef]
- Yushanjiang, A.; Zhang, F.; Yu, H.; Kung, H.-t. Quantifying the spatial correlations between landscape pattern and ecosystem service value: A case study in Ebinur Lake Basin, Xinjiang, China. Ecol. Eng. 2018, 113, 94–104. [Google Scholar] [CrossRef]
- Zhao, Y.; Kasimu, A.; Liang, H.; Reheman, R. Construction and restoration of landscape ecological network in urumqi city based on landscape ecological risk assessment. Sustainability 2022, 14, 8154. [Google Scholar] [CrossRef]
- Qiao, E.L.; Reheman, R.; Zhou, Z.X.; Tao, S.Y. Evaluation of landscape ecological security pattern via the “pattern-function-stability” framework in the Guanzhong Plain Urban Agglomeration of China. Ecol. Indic. 2024, 166, 112325. [Google Scholar] [CrossRef]
- Zhang, H.; Xue, L.; Wei, G.; Dong, Z.; Meng, X. Assessing vegetation dynamics and landscape ecological risk on the mainstream of Tarim River, China. Water 2020, 12, 2156. [Google Scholar] [CrossRef]
- Zhao, H.; Xu, X.; Tang, J.; Wang, Z.; Miao, C. Spatial pattern evolution and prediction scenario of habitat quality in typical fragile ecological region, China: A case study of the Yellow River floodplain area. Heliyon 2023, 9, e14430. [Google Scholar] [CrossRef]
- Yan, J.X.; Li, J.; Yao, X.D.; Li, Q.; Zheng, Z.Q.; Li, G.; Qi, G.P.; Ma, W.W.; Song, M.; Gao, P.C. Ecological security pattern construction based on landscape ecological risk assessment in the Yellow River basin. Front. Environ. Sci. 2025, 13, 1514599. [Google Scholar] [CrossRef]
- Cao, C.; Zhu, X.; Liu, K.; Liang, Y.; Ma, X. Satellite-Observed Arid Vegetation Greening and Terrestrial Water Storage Decline in the Hexi Corridor, Northwest China. Remote. Sens. 2025, 17, 1361. [Google Scholar] [CrossRef]
- Wang, Y.; Pan, J. Building ecological security patterns based on ecosystem services value reconstruction in an arid inland basin: A case study in Ganzhou District, NW China. J. Clean. Prod. 2019, 241, 118337. [Google Scholar] [CrossRef]
- Cao, C.; Luo, Y.T.; Xu, L.P.; Xi, Y.Y.; Zhou, Y.M. Construction of ecological security pattern based on InVEST-Conefor-MCRM: A case study of Xinjiang, China. Ecol. Indic. 2024, 159, 111647. [Google Scholar] [CrossRef]
- Wu, Y.; Gu, C.; Zhang, Y. Towards sustainable management of urban ecological space: A zoning approach hybridized by ecosystem service value and ecological risk assessment. Land 2022, 11, 1220. [Google Scholar] [CrossRef]
- Li, Q.X.; Ma, B.; Zhao, L.W.; Mao, Z.X.; Liu, X.L. Study on Spatial and Temporal Changes in Landscape Ecological Risks and Indicator Weights: A Case Study of the Bailong River Basin. Sustainability 2024, 16, 1915. [Google Scholar] [CrossRef]
- Jia, Q.; Jiao, L.; Lian, X.; Wang, W. Linking supply-demand balance of ecosystem services to identify ecological security patterns in urban agglomerations. Sustain. Cities Soc. 2023, 92, 104497. [Google Scholar] [CrossRef]
- Zhao, H.; Zhai, X.; Li, S.; Wang, Y.; Xie, J.; Yan, C. The continuing decrease of sandy desert and sandy land in northern China in the latest 10 years. Ecol. Indic. 2023, 154, 110699. [Google Scholar] [CrossRef]
- Li, J.-X.; Chen, Y.-N.; Xu, C.-C.; Li, Z. Evaluation and analysis of ecological security in arid areas of Central Asia based on the emergy ecological footprint (EEF) model. J. Clean. Prod. 2019, 235, 664–677. [Google Scholar] [CrossRef]
- Sonter, L.J.; Ali, S.H.; Watson, J.E. Mining and biodiversity: Key issues and research needs in conservation science. Proc. R. Soc. B 2018, 285, 20181926. [Google Scholar] [CrossRef]
- Wang, S.; Xu, Q.L.; Yi, J.H.; Wang, Q.H.; Ren, Q.H.; Li, Y.Y.; Gao, Z.H.; Li, Y.; Wu, H.S. An Ecological Risk Assessment of the Dianchi Basin Based on Multi-Scenario Land Use Change Under the Constraint of an Ecological Defense Zone. Land 2025, 14, 868. [Google Scholar] [CrossRef]
- Ren, Q.; He, C.; Huang, Q.; Shi, P.; Zhang, D.; Güneralp, B. Impacts of urban expansion on natural habitats in global drylands. Nat. Sustain. 2022, 5, 869–878. [Google Scholar] [CrossRef]
- Wang, K.; Zheng, H.; Zhao, X.; Sang, Z.; Yan, W.; Cai, Z.; Xu, Y.; Zhang, F. Landscape ecological risk assessment of the Hailar River basin based on ecosystem services in China. Ecol. Indic. 2023, 147, 109795. [Google Scholar] [CrossRef]
- Yu, H.; Gu, X.; Liu, G.; Fan, X.; Zhao, Q.; Zhang, Q. Construction of regional ecological security patterns based on multi-criteria decision making and circuit theory. Remote Sens. 2022, 14, 527. [Google Scholar] [CrossRef]
- Wei, W.; Shi, P.-J.; Lei, L.; ZHOU, J.-J.; XIE, B.-B. Eco-risk analysis of oasis region based on landscape structure and spatial statistics method—A case study of Wuwei and Minqin oases. J. Nat. Resour. 2014, 29, 2023–2035. [Google Scholar]
- Wang, Q.; Fu, M.; Wei, L.; Han, Y.; Shi, N.; Li, J.; Quan, Z. Urban ecological security pattern based on source-sink landscape theory and MCR model: A case study of Ningguo City, Anhui Province. Acta Sci. Circumstantiae 2016, 36, 4546–4554. [Google Scholar]
- Chen, Y.; Li, X.; Wang, Y.; Yao, X.; Zou, Y.; Xu, B. Construction of ecological security pattern in Ili River Valley from the perspective of scale integration: A case study of Zhaosu County. Acta Ecol. Sin. 2023, 43, 8181–8192. [Google Scholar]
- Tang, G.A.; Song, J. Comparison of slope classification methods in slope mapping from DEMs. J. Soil Water Conserv. 2006, 192, 157–160. [Google Scholar]
- Xie, X.; Li, A.; Jin, H.; Tan, J.; Wang, C.; Lei, G.; Zhang, Z.; Bian, J.; Nan, X. Assessment of five satellite-derived LAI datasets for GPP estimations through ecosystem models. Sci. Total Environ. 2019, 690, 1120–1130. [Google Scholar] [CrossRef]
- Tian, L.; Wu, X.; Tao, Y.; Li, M.; Qian, C.; Liao, L.; Fu, W. Review of remote sensing-based methods for forest aboveground biomass estimation: Progress, challenges, and prospects. Forests 2023, 14, 1086. [Google Scholar] [CrossRef]
- Zhang, X.; Dong, T.; Du, H.; Liao, C.; Wang, F. Optimization of landscape pattern in Fujiang River Basin based on landscape ecological risk assessment. Acta Ecol. Sin. 2021, 41, 3940–3951. [Google Scholar]
- Gao, X.; Song, Z.-Y.; Li, C.-X.; Tang, H.-Z. Landscape pattern optimization in baiyangdian basin based on landscape ecological risk assessment. J. Ecol. Rural Environ. 2023, 39, 174–183. [Google Scholar]
- Wang, Y.; Zhang, F.; Li, X.; Johnson, V.C.; Tan, M.L.; Kung, H.-T.; Shi, J.; Bahtebay, J.; He, X. Methodology for mapping the ecological security pattern and ecological network in the arid region of Xinjiang, China. Remote. Sens. 2023, 15, 2836. [Google Scholar] [CrossRef]
- Peng, J.; Liu, Y.; Pan, Y.; Zhao, Z.; Song, Z.; Wang, Y. Study on the correlation between ecological risk due to natural disaster and landscape pattern-process: Review and prospect. Adv. Earth Sci. 2014, 29, 1186. [Google Scholar]
- Li, L.; Xu, D.; Cheng, X.; Li, X.; Yu, H. Groundwater quality assessment in Northern Anhui based on multi-layer weighted principal component analysis. Resour. Sci. 2015, 37, 61–67. [Google Scholar]
- Neel, M.C. Patch connectivity and genetic diversity conservation in the federally endangered and narrowly endemic plant species Astragalus albens (Fabaceae). Biol. Conserv. 2008, 141, 938–955. [Google Scholar] [CrossRef]
- Fan, J.; Wang, Y.; Zhou, Z.; You, N.; Meng, J. Dynamic ecological risk assessment and management of land use in the middle reaches of the Heihe River based on landscape patterns and spatial statistics. Sustainability 2016, 8, 536. [Google Scholar] [CrossRef]
- Han, H.; Cai, G.; Chen, S.; Xu, J.; Long, C. Comparison of ecosystem services value of karst poor villages in southwest China. J. Northeast Agric. Sci. 2020, 45, 84–89. [Google Scholar]
- Huang, X.; Wu, C.; You, H.; Xiao, W.; Zhong, S. Construction of rural landscape ecological corridor in water network plain area based on MCR Model. Trans. Chin. Soc. Agric. Eng. 2019, 35, 243–251. [Google Scholar]
- Wei, H.; Zhu, H.; Chen, J.; Jiao, H.; Li, P.; Xiong, L. Construction and optimization of ecological security pattern in the loess plateau of China based on the minimum cumulative resistance (MCR) model. Remote Sens. 2022, 14, 5906. [Google Scholar] [CrossRef]
- Wu, Q.; Cao, Y.; Zhang, Y.J.; Su, D.; Fang, X.Q. Linking ecosystem services trade-offs, human preferences and future scenario simulations to ecological security patterns: A novel methodology for reconciling conflicting ecological functions. Appl. Geogr. 2025, 176, 103534. [Google Scholar] [CrossRef]
- Pouzols, F.M.; Moilanen, A. A method for building corridors in spatial conservation prioritization. Landsc. Ecol. 2014, 29, 789–801. [Google Scholar] [CrossRef]
- Tang, X.L.; Cai, L.S.; Du, P.Z. Spatiotemporal Evolution and Driving Forces of Production-Living-Ecological Space in Arid Ecological Transition Zone Based on Functional and Structural Perspectives: A Case Study of the Hexi Corridor. Sustainability 2024, 16, 6698. [Google Scholar] [CrossRef]
- Pan, R.Y.; Yan, J.J.; Xia, Q.Q.; Jin, X.F. Enhancing Ecological Security in Ili River Valley: Comprehensive Approach. Water 2024, 16, 1867. [Google Scholar] [CrossRef]
- Zhang, L.L.; Liu, Q.Y.; Wang, J.; Wu, T.; Li, M.Y. Constructing ecological security patterns using remote sensing ecological index and circuit theory: A case study of the Changchun-Jilin-Tumen region. J. Environ. Manag. 2025, 373, 123693. [Google Scholar] [CrossRef]


| Resistance Level | Cumulative Resistance Value |
|---|---|
| 1 | 0~391 |
| 2 | 391~1192 |
| 3 | 1192~2295 |
| 4 | 2295~4537 |
| Principal Component | Eigenvalue | Variance Contribution (%) | Cumulative Contribution (%) |
|---|---|---|---|
| 1 | 3.62 | 32.88 | 32.88 |
| 2 | 1.73 | 15.76 | 48.63 |
| 3 | 1.21 | 11 | 59.63 |
| 4 | 1.03 | 9.34 | 68.98 |
| 5 | 0.8 | 7.25 | 76.23 |
| 6 | 0.72 | 6.5 | 82.73 |
| 7 | 0.64 | 5.82 | 88.55 |
| 8 | 0.55 | 5 | 93.54 |
| 9 | 0.34 | 3.08 | 96.63 |
| 10 | 0.2 | 1.84 | 98.47 |
| 11 | 0.17 | 1.53 | 100 |
| MSPA | Area (km2) | Percentage/% |
|---|---|---|
| Core | 2777.5 | 19.38 |
| Bridge | 105.38 | 0.73 |
| Isiet | 153.58 | 1.07 |
| Edge | 417.14 | 2.91 |
| Perforation | 119.49 | 0.83 |
| Branch | 165.07 | 1.15 |
| Loop | 54.31 | 0.37 |
| Before Optimization | After Optimization | Change Rate | |
|---|---|---|---|
| Least-Cost Path (LCP) | 0.0382 | 0.0785 | 105.23 |
| Integral Index of Connectivity (IIC) | 0.0365 | 0.0690 | 89.04 |
Disclaimer/Publisher’s Note: The statements, opinions and data contained in all publications are solely those of the individual author(s) and contributor(s) and not of MDPI and/or the editor(s). MDPI and/or the editor(s) disclaim responsibility for any injury to people or property resulting from any ideas, methods, instructions or products referred to in the content. |
© 2025 by the authors. Licensee MDPI, Basel, Switzerland. This article is an open access article distributed under the terms and conditions of the Creative Commons Attribution (CC BY) license (https://creativecommons.org/licenses/by/4.0/).
Share and Cite
Li, Q.; Yan, J.; Cheng, J.; Xu, Y.; Gong, Y.; Zhang, G.; Ling, H.; Pan, R. A Study on the Optimization of Ecological Spatial Structure Based on Landscape Risk Assessment: A Case Study of Wensu County, Xinjiang, China. Land 2025, 14, 1323. https://doi.org/10.3390/land14071323
Li Q, Yan J, Cheng J, Xu Y, Gong Y, Zhang G, Ling H, Pan R. A Study on the Optimization of Ecological Spatial Structure Based on Landscape Risk Assessment: A Case Study of Wensu County, Xinjiang, China. Land. 2025; 14(7):1323. https://doi.org/10.3390/land14071323
Chicago/Turabian StyleLi, Qian, Junjie Yan, Junhui Cheng, Yan Xu, Yincheng Gong, Guangpeng Zhang, Hongbo Ling, and Ruyi Pan. 2025. "A Study on the Optimization of Ecological Spatial Structure Based on Landscape Risk Assessment: A Case Study of Wensu County, Xinjiang, China" Land 14, no. 7: 1323. https://doi.org/10.3390/land14071323
APA StyleLi, Q., Yan, J., Cheng, J., Xu, Y., Gong, Y., Zhang, G., Ling, H., & Pan, R. (2025). A Study on the Optimization of Ecological Spatial Structure Based on Landscape Risk Assessment: A Case Study of Wensu County, Xinjiang, China. Land, 14(7), 1323. https://doi.org/10.3390/land14071323