1. Introduction
In contemporary urban planning and public health discourse, equitable access to sports facilities is increasingly recognized as a cornerstone of sustainable and just cities. Numerous studies have shown that the presence and proper distribution of such facilities plays a crucial role in enhancing physical and mental well-being, promoting social cohesion, and improving the overall quality of life for urban populations [
1]. As cities continue to grow in scale and complexity, especially in the Global South, ensuring spatial justice in the allocation of urban services including sports infrastructure has emerged as a pressing policy concern.
A key challenge faced by many urban regions is the imbalance in the spatial distribution of sports facilities, which can exacerbate health disparities and social inequalities [
2]. While some areas enjoy sufficient access, others remain underserved, leading to unequal opportunities for physical activity and community engagement. International benchmarks suggest that a minimum per capita sports space of 2 m
2 is desirable in urban contexts [
3]. However, this standard is seldom met in many cities of developing countries, where infrastructure development has often lagged behind population growth and urban sprawl.
In this regard, the combination of geographic information system (GIS) and spatial multi-criteria decision analysis (SMCDA) methods has gained attention as an innovative tool in urban management. The GIS method, with its capability to analyze spatial data and provide a comprehensive view of distribution patterns, enables the identification of areas in need of sports facilities [
4]. On the other hand, SMCDA methods, considering multiple criteria such as the population density, accessibility, implementation costs, and environmental considerations, facilitate the decision-making process [
5]. This combination not only provides optimal solutions for the location–allocation of sports facilities but also enhances spatial equity.
Despite this growing body of knowledge, there remains a need for context-specific models that adapt these methodologies to the unique socio-spatial challenges of particular cities. In this context, Tehran, a megacity with notable demographic and geographical complexities, provides a compelling case for applying a GIS-SMCDA-based approach to sports facility planning. The city is characterized by significant spatial inequalities; while the northern districts are relatively well-served, the southern areas suffer from acute under-provision of sports infrastructure. For instance, the per capita sports space in Tehran is estimated at less than 0.5 m
2 overall, and even lower in districts such as district 18, which also lack proximity to natural recreational spaces such as the Alborz Mountains. This unequal distribution not only impairs public health contributing to the rise of non-communicable diseases such as diabetes, hypertension, and cardiovascular issues [
6] but also undermines social justice by deepening existing socio-economic disparities [
7]. Studies by organizations such as the Centers for Disease Control and Prevention (CDC) have shown that better access to sports facilities can increase public participation in physical activity by up to 25% [
8].
Previous studies indicate that this approach is highly effective in the optimal location of infrastructure in various fields such as healthcare [
9,
10], culture and education [
11,
12], accessibility and public services [
13,
14], shopping centers [
15,
16], energy [
17,
18], and crisis management [
19,
20]. In this regard, several studies [
21,
22] have emphasized that easy and convenient access to sports facilities, such as sports fields, stadiums, and parks, can increase individuals’ willingness to engage in physical activity. Additionally, the research by Ahmadi et al. [
23], Giles-Corti and Donovan [
24], and Hallmann et al. [
25] has shown that the increase in sports facilities, easy access to these centers, and better proximity to other urban uses can lead to greater participation in physical activities and improved life satisfaction among community members. Furthermore, the studies by McGrath et al. [
26] and Zohrevandian et al. [
27] have also emphasized the importance of the proper distribution and optimal location of sports facilities. Based on this, it can be concluded that easy access for citizens to these facilities plays a crucial role in achieving a healthy and sustainable society. In this study, the term sports facilities refers to both public and private facilities, as all types contribute to the overall spatial accessibility and support the goal of improving public health and social equity.
Tehran, as the capital of Iran, with its unique geographical, economic, and demographic characteristics, requires more precise planning in the development of sports infrastructure. The population density, air pollution, spatial limitations, and unequal distribution of facilities are challenges that make this issue even more critical. The southern areas of the city, due to their higher population and infrastructure limitations, suffer the most from the disproportionate distribution of sports facilities. Meanwhile, the northern areas, despite having a smaller population, have more facilities. Therefore, the main goal of this research is to propose a novel approach for the optimal allocation of sports facilities in Tehran. This approach, utilizing a combination of GIS and SMCDA methods, aims to identify suitable areas for the establishment or development of sports facilities. The innovation of this research lies in the simultaneous use of a spatial analysis and multi-criteria decision-making techniques to address a multi-dimensional problem in the allocation of sports facilities. This method can also serve as a model for other metropolitan cities in the country.
The remainder of this paper is structured as follows.
Section 2 describes the materials and methods used in the study.
Section 3 presents the results.
Section 4 provides a discussion of the findings, and
Section 5 concludes the paper with final remarks and implications.
3. Results
The analysis of the ANN, which was conducted to examine the spatial pattern of existing sports centers in Tehran (
Figure 3), provided meaningful and noteworthy results. Based on the nearest neighbor ratio of 0.582584, it is evident that sports facilities are clustered in specific areas of the city. This ratio, being less than 1, indicates that the average distance to the nearest neighbors observed is shorter than the distance that would be expected in a random distribution. The Z-score value of −12.900898 is highly negative and indicates a significant deviation from randomness. This Z-score falls in the statistically significant region on the left side of the normal distribution curve, clearly confirming the clustered distribution of sports facilities.
On the other hand, the p-value of 0.000000 indicates that the probability of this pattern being random is almost zero. This value suggests that the observed pattern is statistically significant and cannot be attributed to chance. Critical values further confirm that for a 99% confidence level, the observed Z-score, which is much less than −2.58, proves the high significance of the clustered pattern. The bell-shaped curve accompanying this analysis illustrates three types of spatial patterns—clustered, random, and dispersed. In this analysis, the highly negative Z-score and the nearest neighbor ratio being less than 1 clearly indicate that the distribution of sports facilities in Tehran is clustered.
This clustering indicates the concentration of these locations in specific areas of the city, which could be influenced by factors such as the population density, socio-economic distribution, and access to resources. The results show that some areas of Tehran have better access to sports facilities, while others are deprived of these amenities. Therefore, this analysis highlights the spatial inequality in the distribution of sports facilities. Based on this, identifying areas lacking sports amenities and planning for the establishment of new facilities in these areas can contribute to greater spatial equity. Additionally, conducting further studies to identify the factors influencing the spatial concentration of these facilities can assist in more informed decision-making in urban development.
Table 2 shows the weights of the criteria and sub-criteria. The analysis of the criteria weights for sports facility site selection shows that the compatibility criterion, with a weight of 0.45, has the greatest impact on the selection of locations. This indicates that the alignment of a location with other urban land uses plays a key role in decision-making. Among the sub-criteria in this section, the population density (0.25) and distance from educational centers (0.18) hold greater importance. This suggests that sports facilities should be located in areas with high population density rates to maximize their utilization, and the distance from educational centers can also help increase the usage of these facilities. In addition to the compatibility criterion, the infrastructure criterion, with a weight of 0.35, highlights the importance of access to urban services and amenities. In this section, the distances from public transport stations (0.20) and medical centers (0.18) have the highest weights. These findings suggest that the ease of access to sports facilities for citizens, as well as the ability to provide emergency services, when necessary, are key factors in site selection. The environmental criterion, with a weight of 0.20, also plays an important role in the site selection process. Within this category, the earthquake risk (0.45) and flood risk (0.35) are identified as two key factors. This emphasizes the importance of minimizing natural risks when locating sports facilities, as constructing such facilities in areas prone to earthquakes or floods can pose serious risks to users. Overall, the weighting of criteria reflects a balanced approach to decision-making, considering urban compatibility, environmental risk reductions, and access to key infrastructure. The prioritization of the compatibility criterion with the urban fabric, over environmental and infrastructural criteria, indicates a focus on social needs and maximizing the use of sports facilities.
Finally, the CR in this analysis indicates the level of consistency and logical soundness in the decision-making process. The low CR values for various criteria, particularly the compatibility (0.008), environmental (0.002), and infrastructure (0.005) criteria, suggest that the judgments made were sufficiently coherent, and the selections were made based on a valid and accurate analytical method. The low CR values confirm that the pairwise comparisons made between the criteria and sub-criteria were highly reliable, and the weights assigned to each criterion were trustworthy and dependable.
The compatibility criteria map (
Figure 4) for the location of sports facilities reveals that the high-potential areas (brown color) are mainly situated near cultural, educational, recreational, and commercial centers, as well as residential zones. In contrast, the low-potential areas (blue color) are mostly located on the outskirts of the city, in industrial areas, or in regions with low population density. The distribution of values in the maps indicates that central urban areas, due to their distance from commercial and educational centers, are more conducive to the establishment of sports facilities, while the outskirts and industrial areas, due to their distances from service centers and negative environmental impacts, have the lowest potential. Additionally, in the population density map, the densely populated urban areas are marked in brown, indicating that these areas, due to the high numbers of potential users, are the most favorable for the development of sports facilities. In contrast, the sparsely populated areas, which are mostly scattered on the outskirts of the city, have the lowest scores. Moreover, the distance map from the existing sports centers shows that the areas that have so far lacked sports centers, if other favorable conditions are met, have a higher potential for the construction of new facilities.
The environmental criteria map (
Figure 5) for the locations of sports facilities reveals that the high-potential areas (brown color) are predominantly located in regions with better safety in terms of their earthquake and flood risks, suitable slopes, and favorable distances from water sources. On the other hand, the low-potential areas (blue color) are mostly scattered in high-risk and geographically unsuitable zones. In the earthquake risk map, the low-potential areas are primarily concentrated in seismically active regions, where the risks posed by earthquakes make the establishment of sports facilities inadvisable. In contrast, the safer regions, shown in brown on the map, indicate a higher potential for sports facility development. The flood risk map highlights that the low-potential areas are located in floodplains and along riverbanks, while the higher-potential areas are situated in elevated zones away from water flow paths. The slope map shows that the areas with gentle slopes, marked in brown, are ideal locations for building sports centers, as they are easier and more cost-effective to develop. Conversely, the steep and mountainous areas, shown in blue, have lower potential due to the challenges of construction and higher costs. Furthermore, the distance from water sources map indicates that areas with an appropriate distance from water bodies, which are less prone to environmental hazards and soil erosion, offer better conditions for the development of sports facilities.
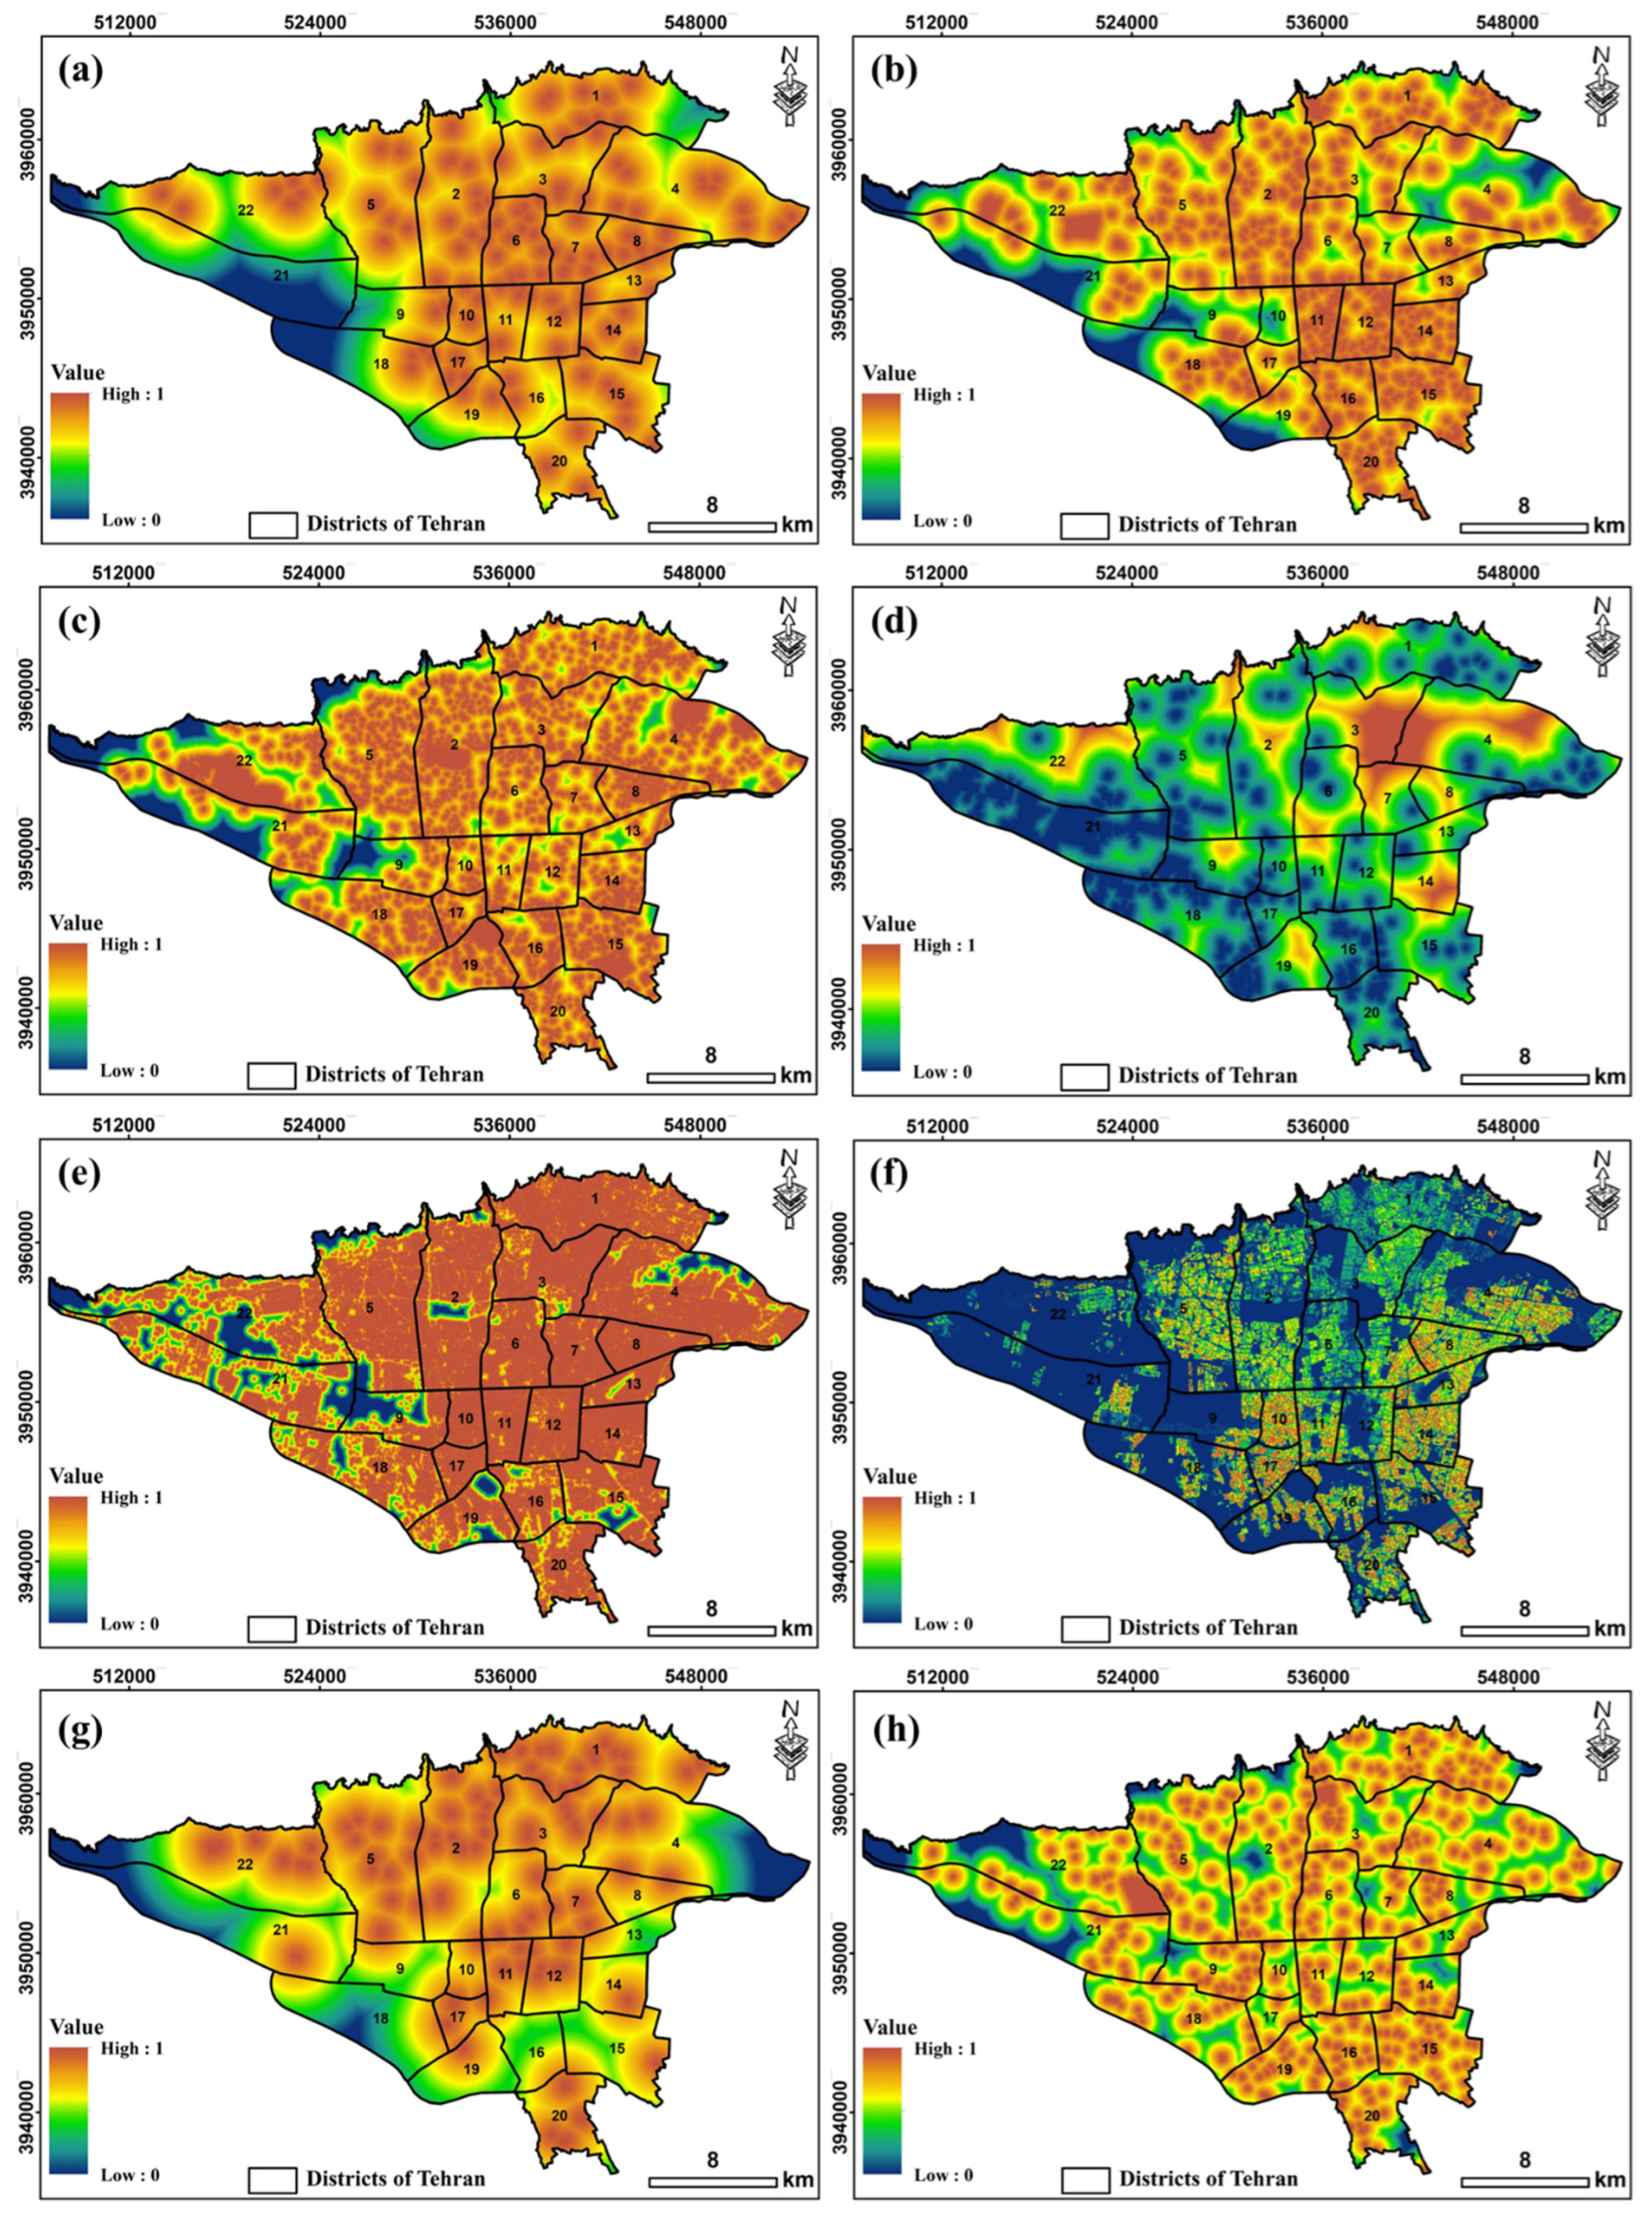
The infrastructure criteria map (
Figure 6) indicates that the high-potential areas (brown color) are predominantly located near fire stations, police stations, medical centers, pharmacies, fuel stations, parking, public transport stations, highways, main streets, and airports. In contrast, the low-potential areas (blue color) are concentrated in remote zones with limited access to these essential infrastructures. The distances from fire stations and police stations enhance the safety of sports facilities, while access to medical centers and pharmacies is crucial for providing necessary medical services. Additionally, the distances from public transport stations, highways, and main streets facilitate easy access for users, while areas far from these routes have lower potential due to difficulties in movement and transportation. Access to parking and fuel stations also increases user convenience, and airports can play a significant role in the development of international sports activities. Therefore, the best locations for establishing sports facilities are those with better access to safety, healthcare, and transportation infrastructure.
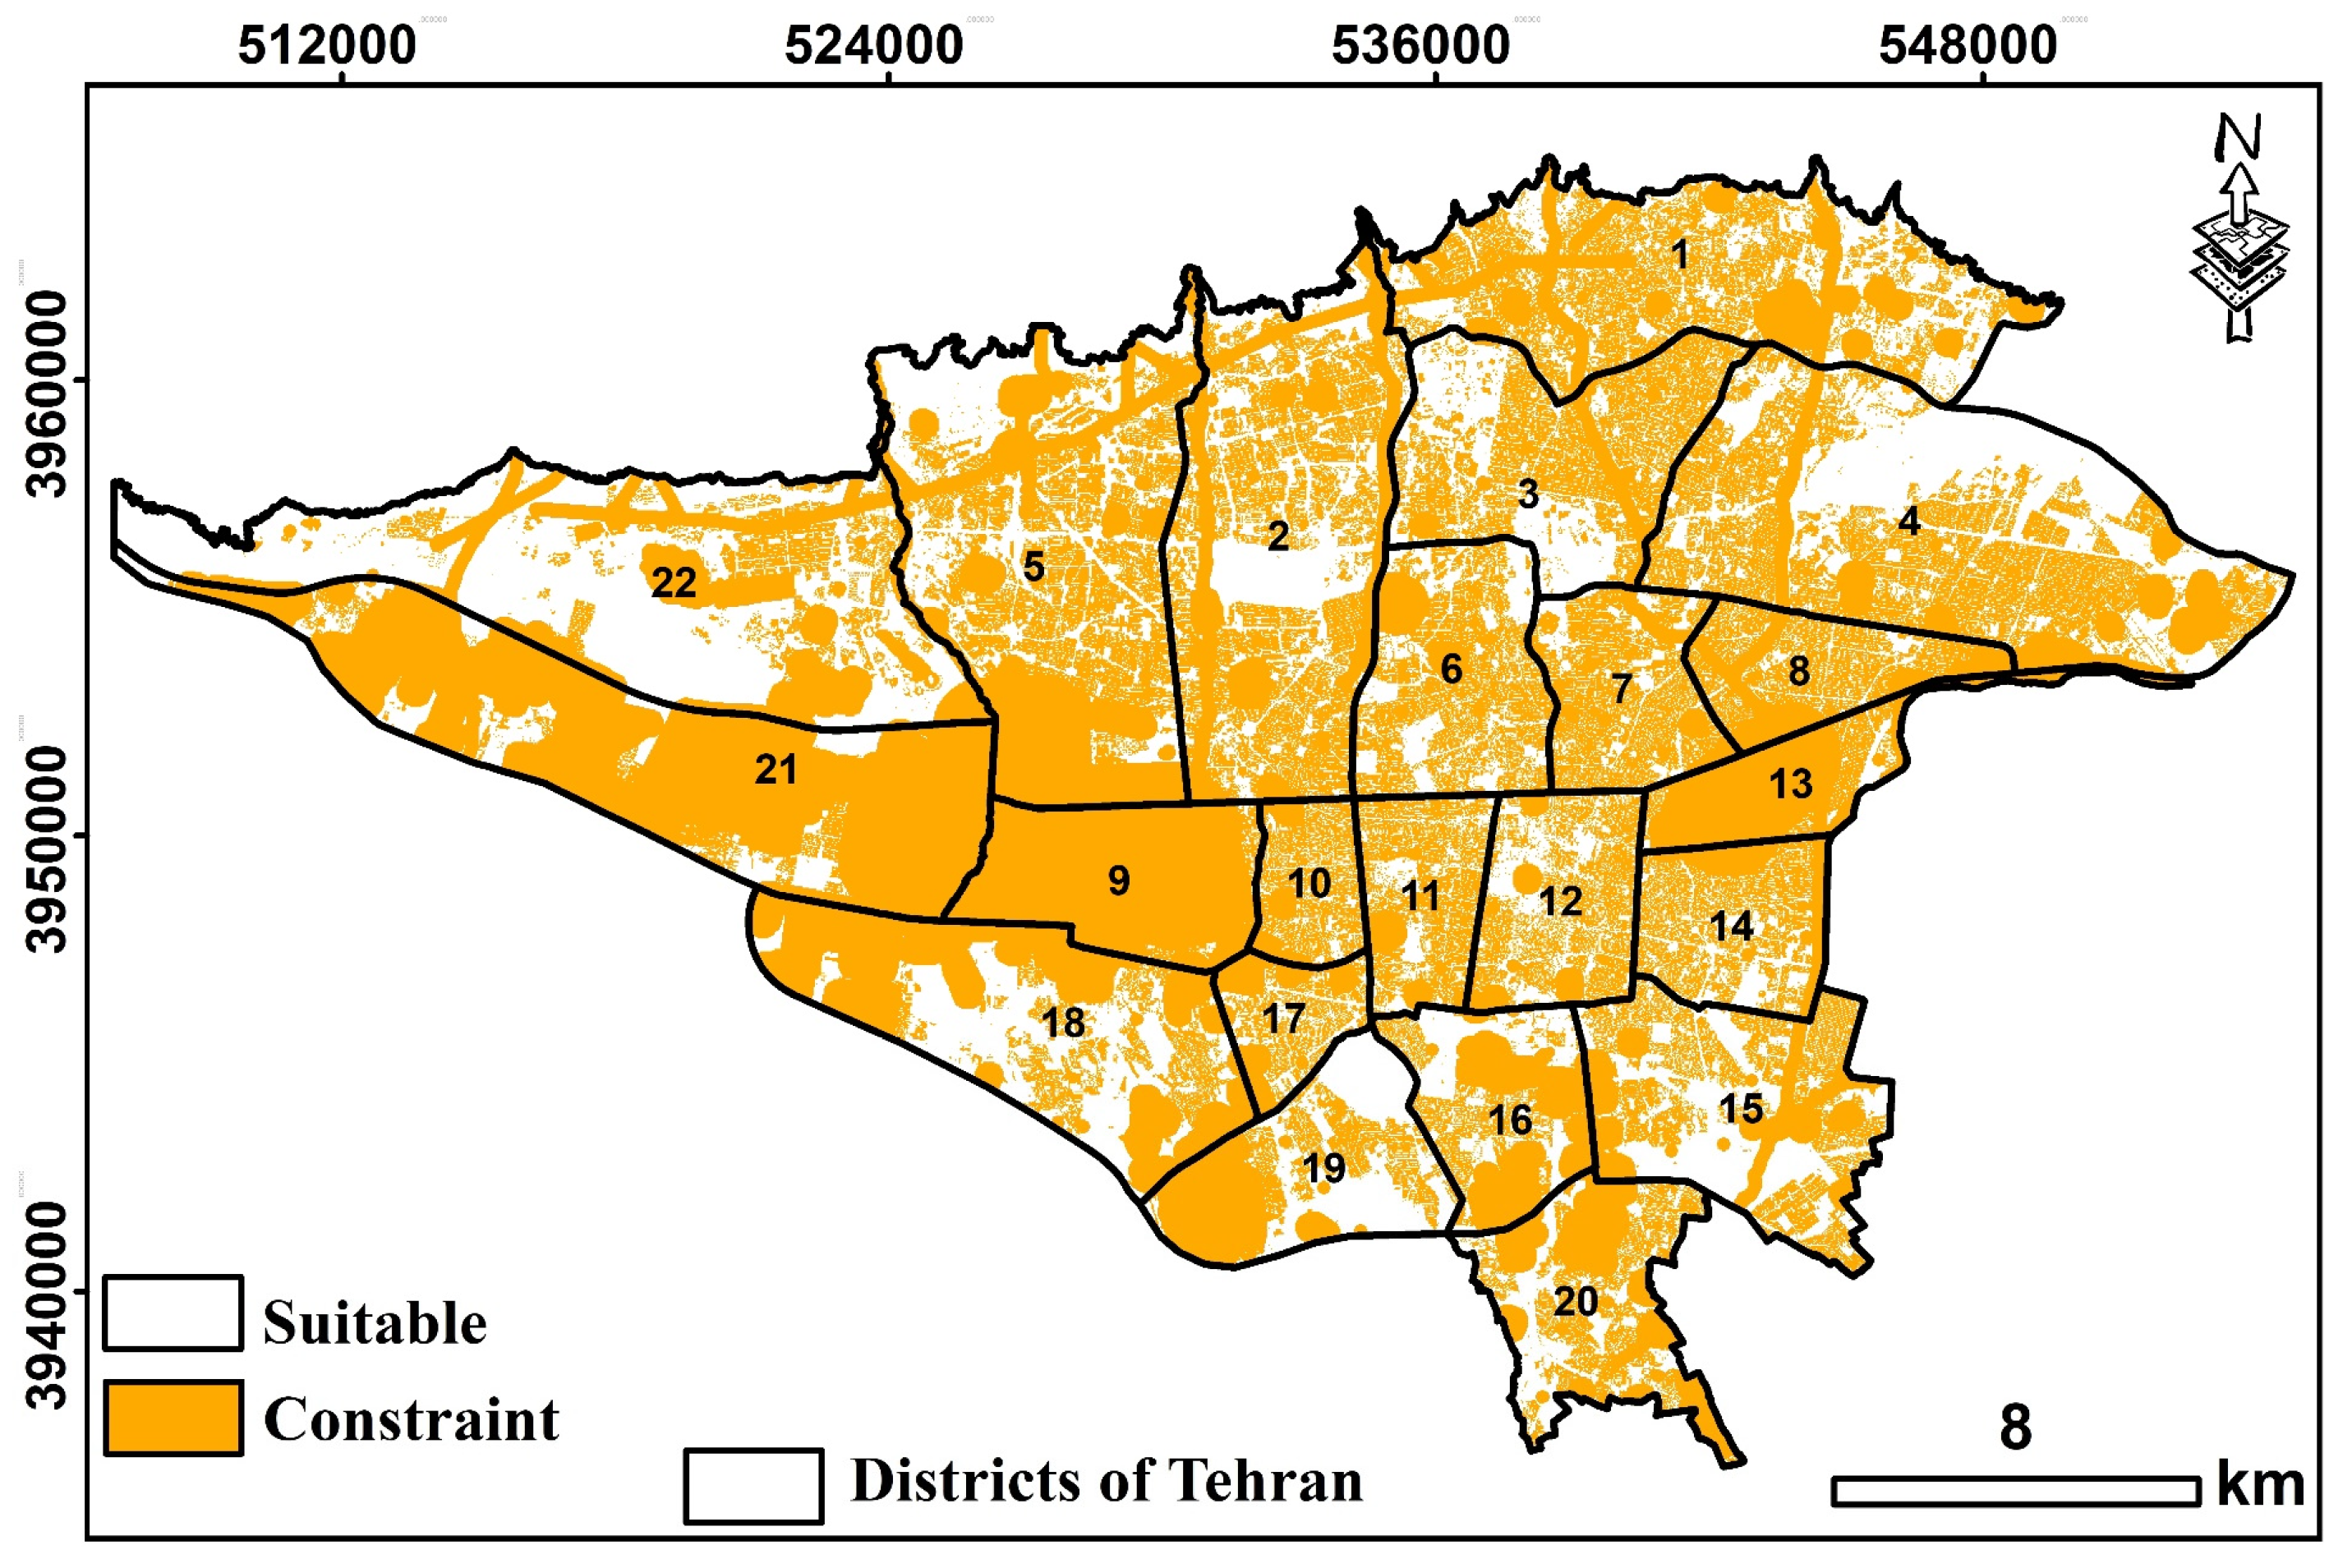
The map of the spatial distribution of the constraints for sports facility construction shown in
Figure 7 illustrates that a significant portion of Tehran is affected by spatial constraints, particularly in the peripheral areas in the western, southern, and eastern parts of the city, highlighted in orange. The areas with constraints cover an area of 398 square kilometers, which accounts for 65% of the total study area. This indicates that only 35% of the city is suitable for development. Regions 9, 18, 21, and 22 in the western and southwestern parts, as well as regions 15 and 19 in the south, exhibit the highest levels of limitations, which may stem from environmental factors, inadequate infrastructure, or incompatible land uses. In contrast, the central areas such as regions 6, 11, and 12 have fewer constraints and are more suitable for development. This distribution pattern suggests that urban peripheries, due to various reasons such as the density of incompatible land uses, environmental constraints, and lack of necessary infrastructure, are less appropriate for new developments. On the other hand, the central areas, due to better access to facilities and infrastructure, have higher potential. The extent of these constraints highlights the need for careful planning and urban interventions to improve conditions in underprivileged areas and enhance suitable land uses in restricted zones.
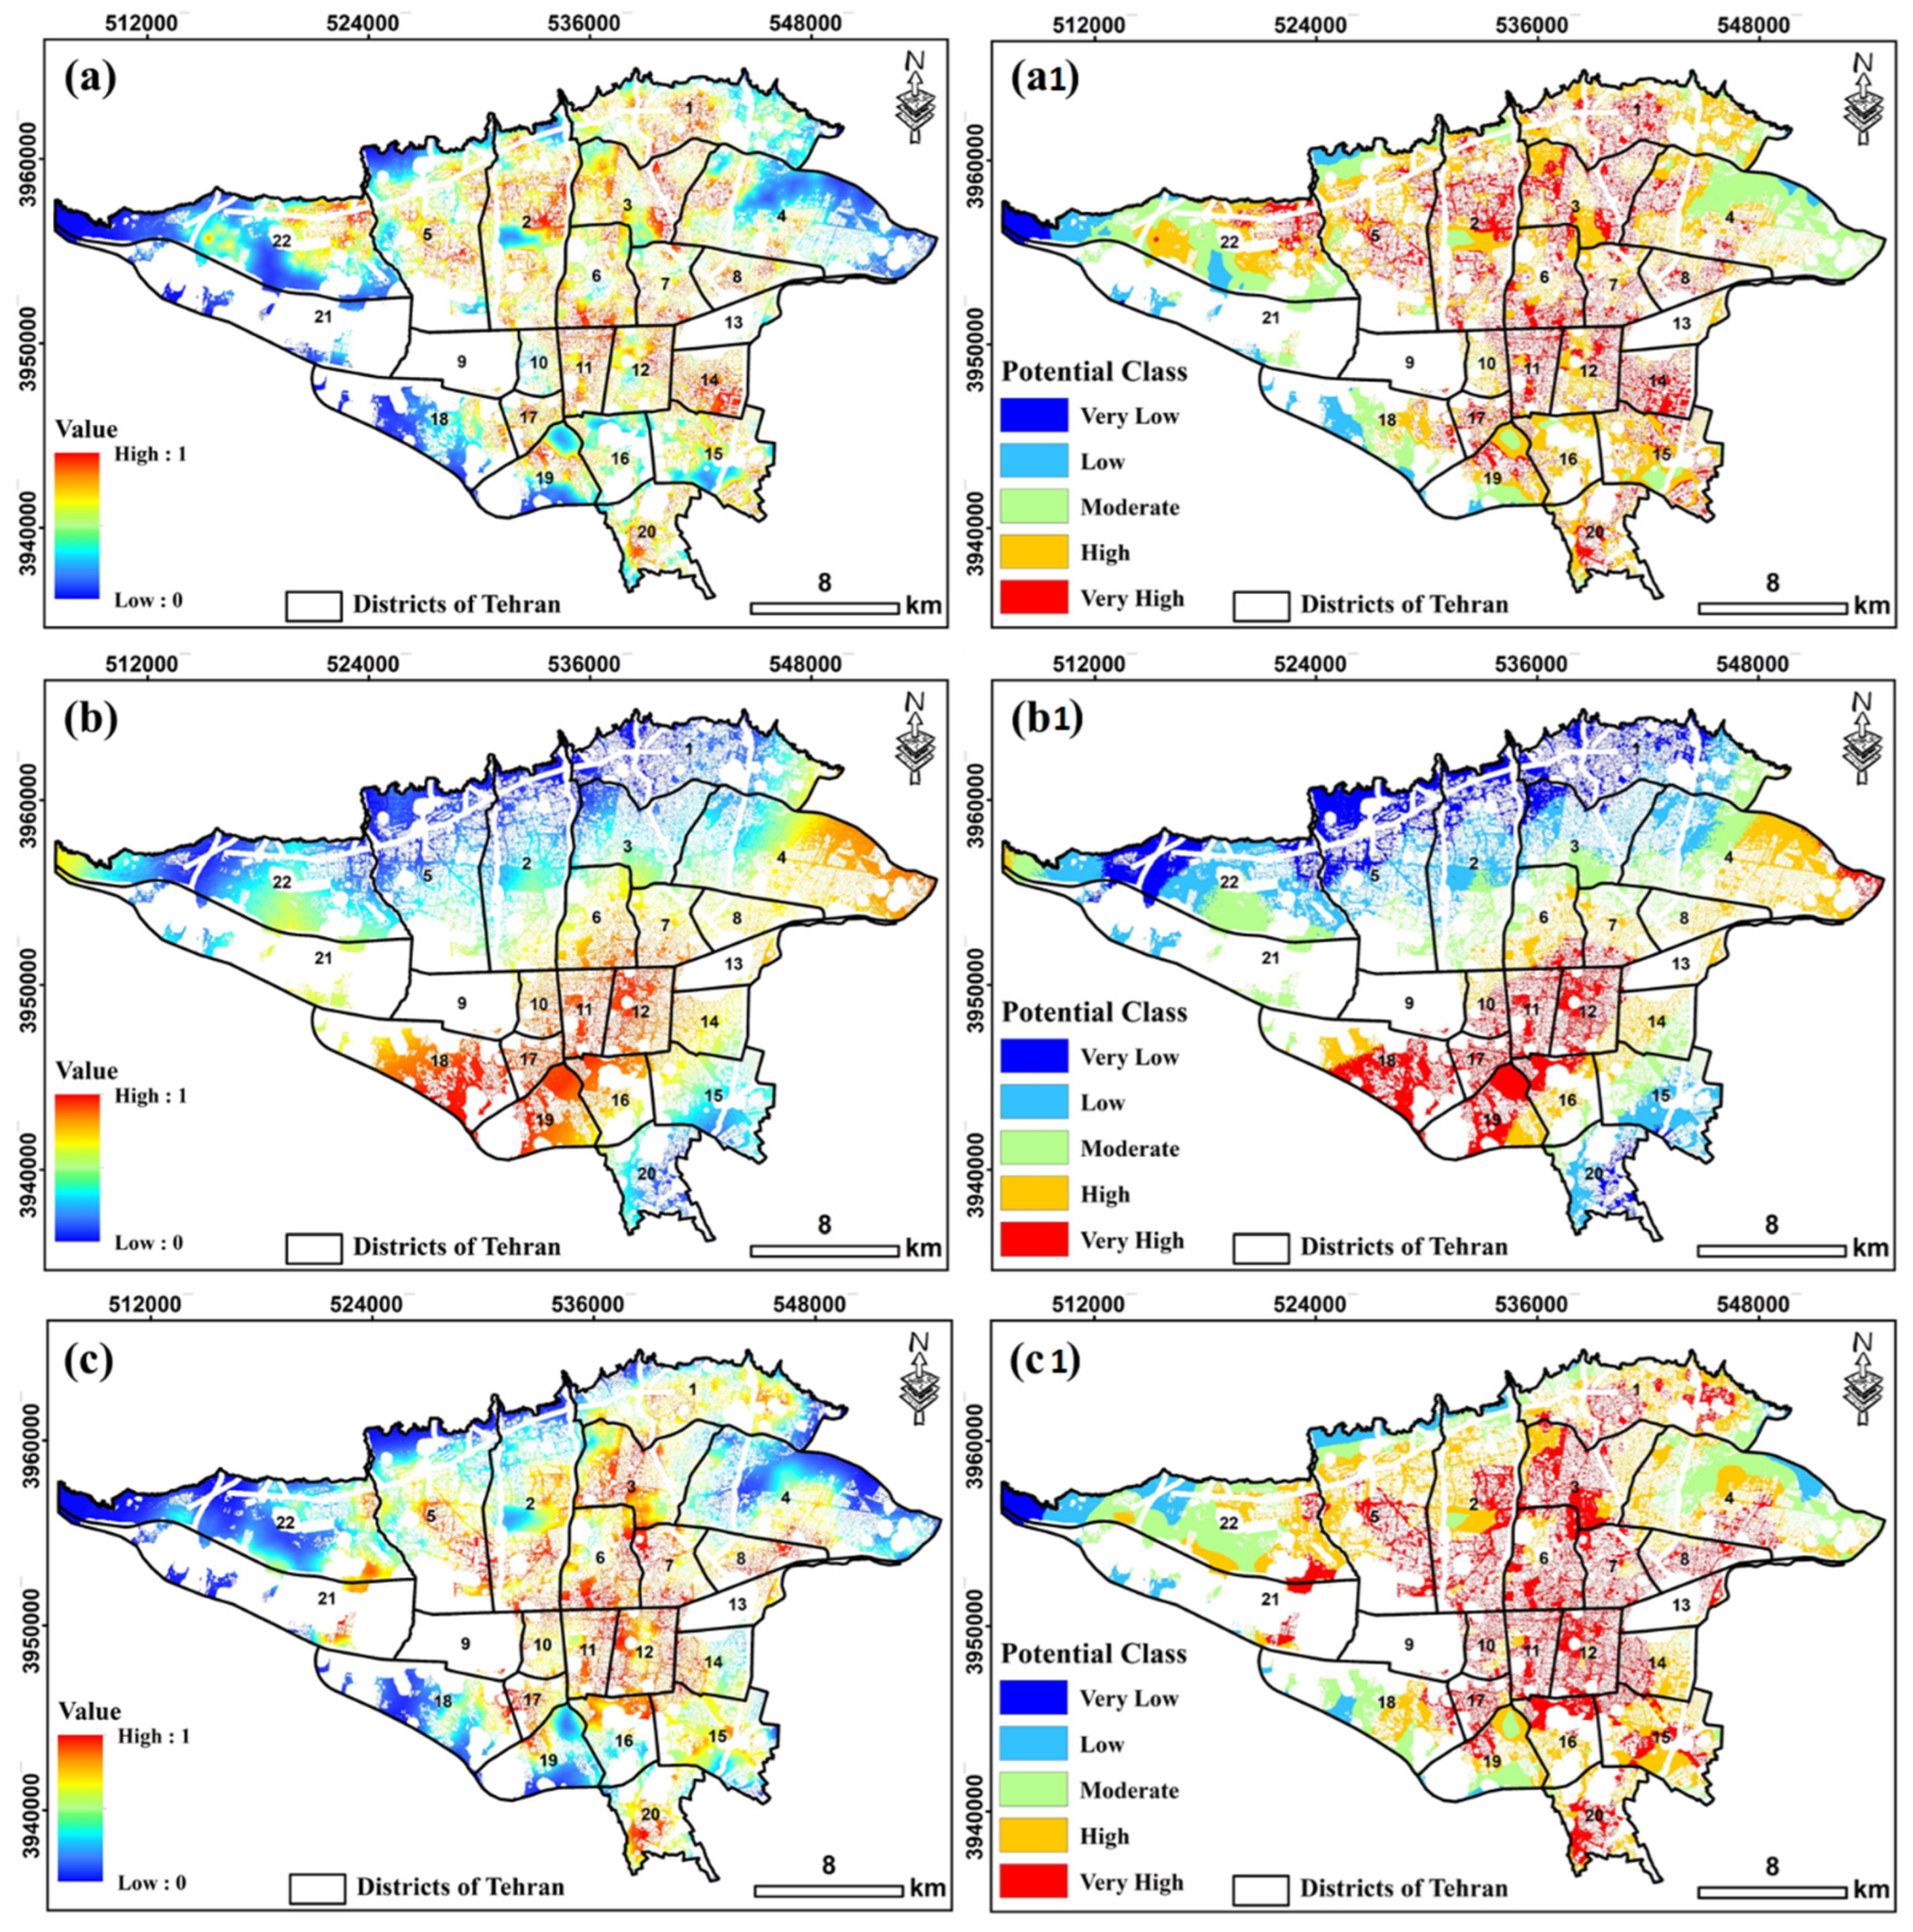
The standardized and classified maps for compatibility, environmental, and infrastructure criteria are presented in
Figure 8. These maps are categorized into five suitability levels based on the suitability index as very low (0.0–0.2), low (0.2–0.4), moderate (0.4–0.6), high (0.6–0.8), and very high (0.8–1.0). The analysis of potential allocation maps for optimal sports facility placement in Tehran reveals a clear spatial pattern in the distribution of suitability classes across the city. In all three maps (compatibility, environmental, and infrastructure), the northern and northwestern areas of the city (especially districts 1, 2, 5, and 22) are predominantly classified in the very low to low potential classes (blue), indicating significant constraints in these regions. Conversely, the central and southern areas (such as districts 10, 11, 12, 16, and 17) are mostly classified in the high and very high potential classes (red), particularly in the infrastructure map, which highlights better access to facilities and the transportation network.
The compatibility map (
Figure 8a) shows that the highest potential areas (red color) are concentrated in central and southern districts, such as districts 10, 11, 16, 17, and 19, while the northern and western districts, including 1, 2, 5, 21, and 22, have the lowest potential. This indicates that densely populated urban areas with adequate infrastructure are better suited for sports facility development. The environmental map (
Figure 8b) reveals that very low and low potential classes are more widespread in the north and northwest (e.g., districts 1, 2, and 21) due to the steep slopes, high river density, and proximity to active fault lines. Conversely, southern areas such as districts 15, 16, and 19 exhibit higher potential, likely due to their gentler slopes, optimal distance from rivers and fault lines, and overall favorable environmental conditions for sports facility development. Finally, the infrastructure map (
Figure 8c) indicates that the central and southeastern districts (e.g., 12, 14, 15, and 16) have the highest potential, whereas the northern (1, 2, and 5) and western (21 and 22) districts show lower potential due to weak infrastructure. This distribution suggests that sports facility development should be prioritized in the central and southern areas, considering multiple factors, while the northern districts, due to environmental constraints and limited infrastructure access, are less suitable for such developments.
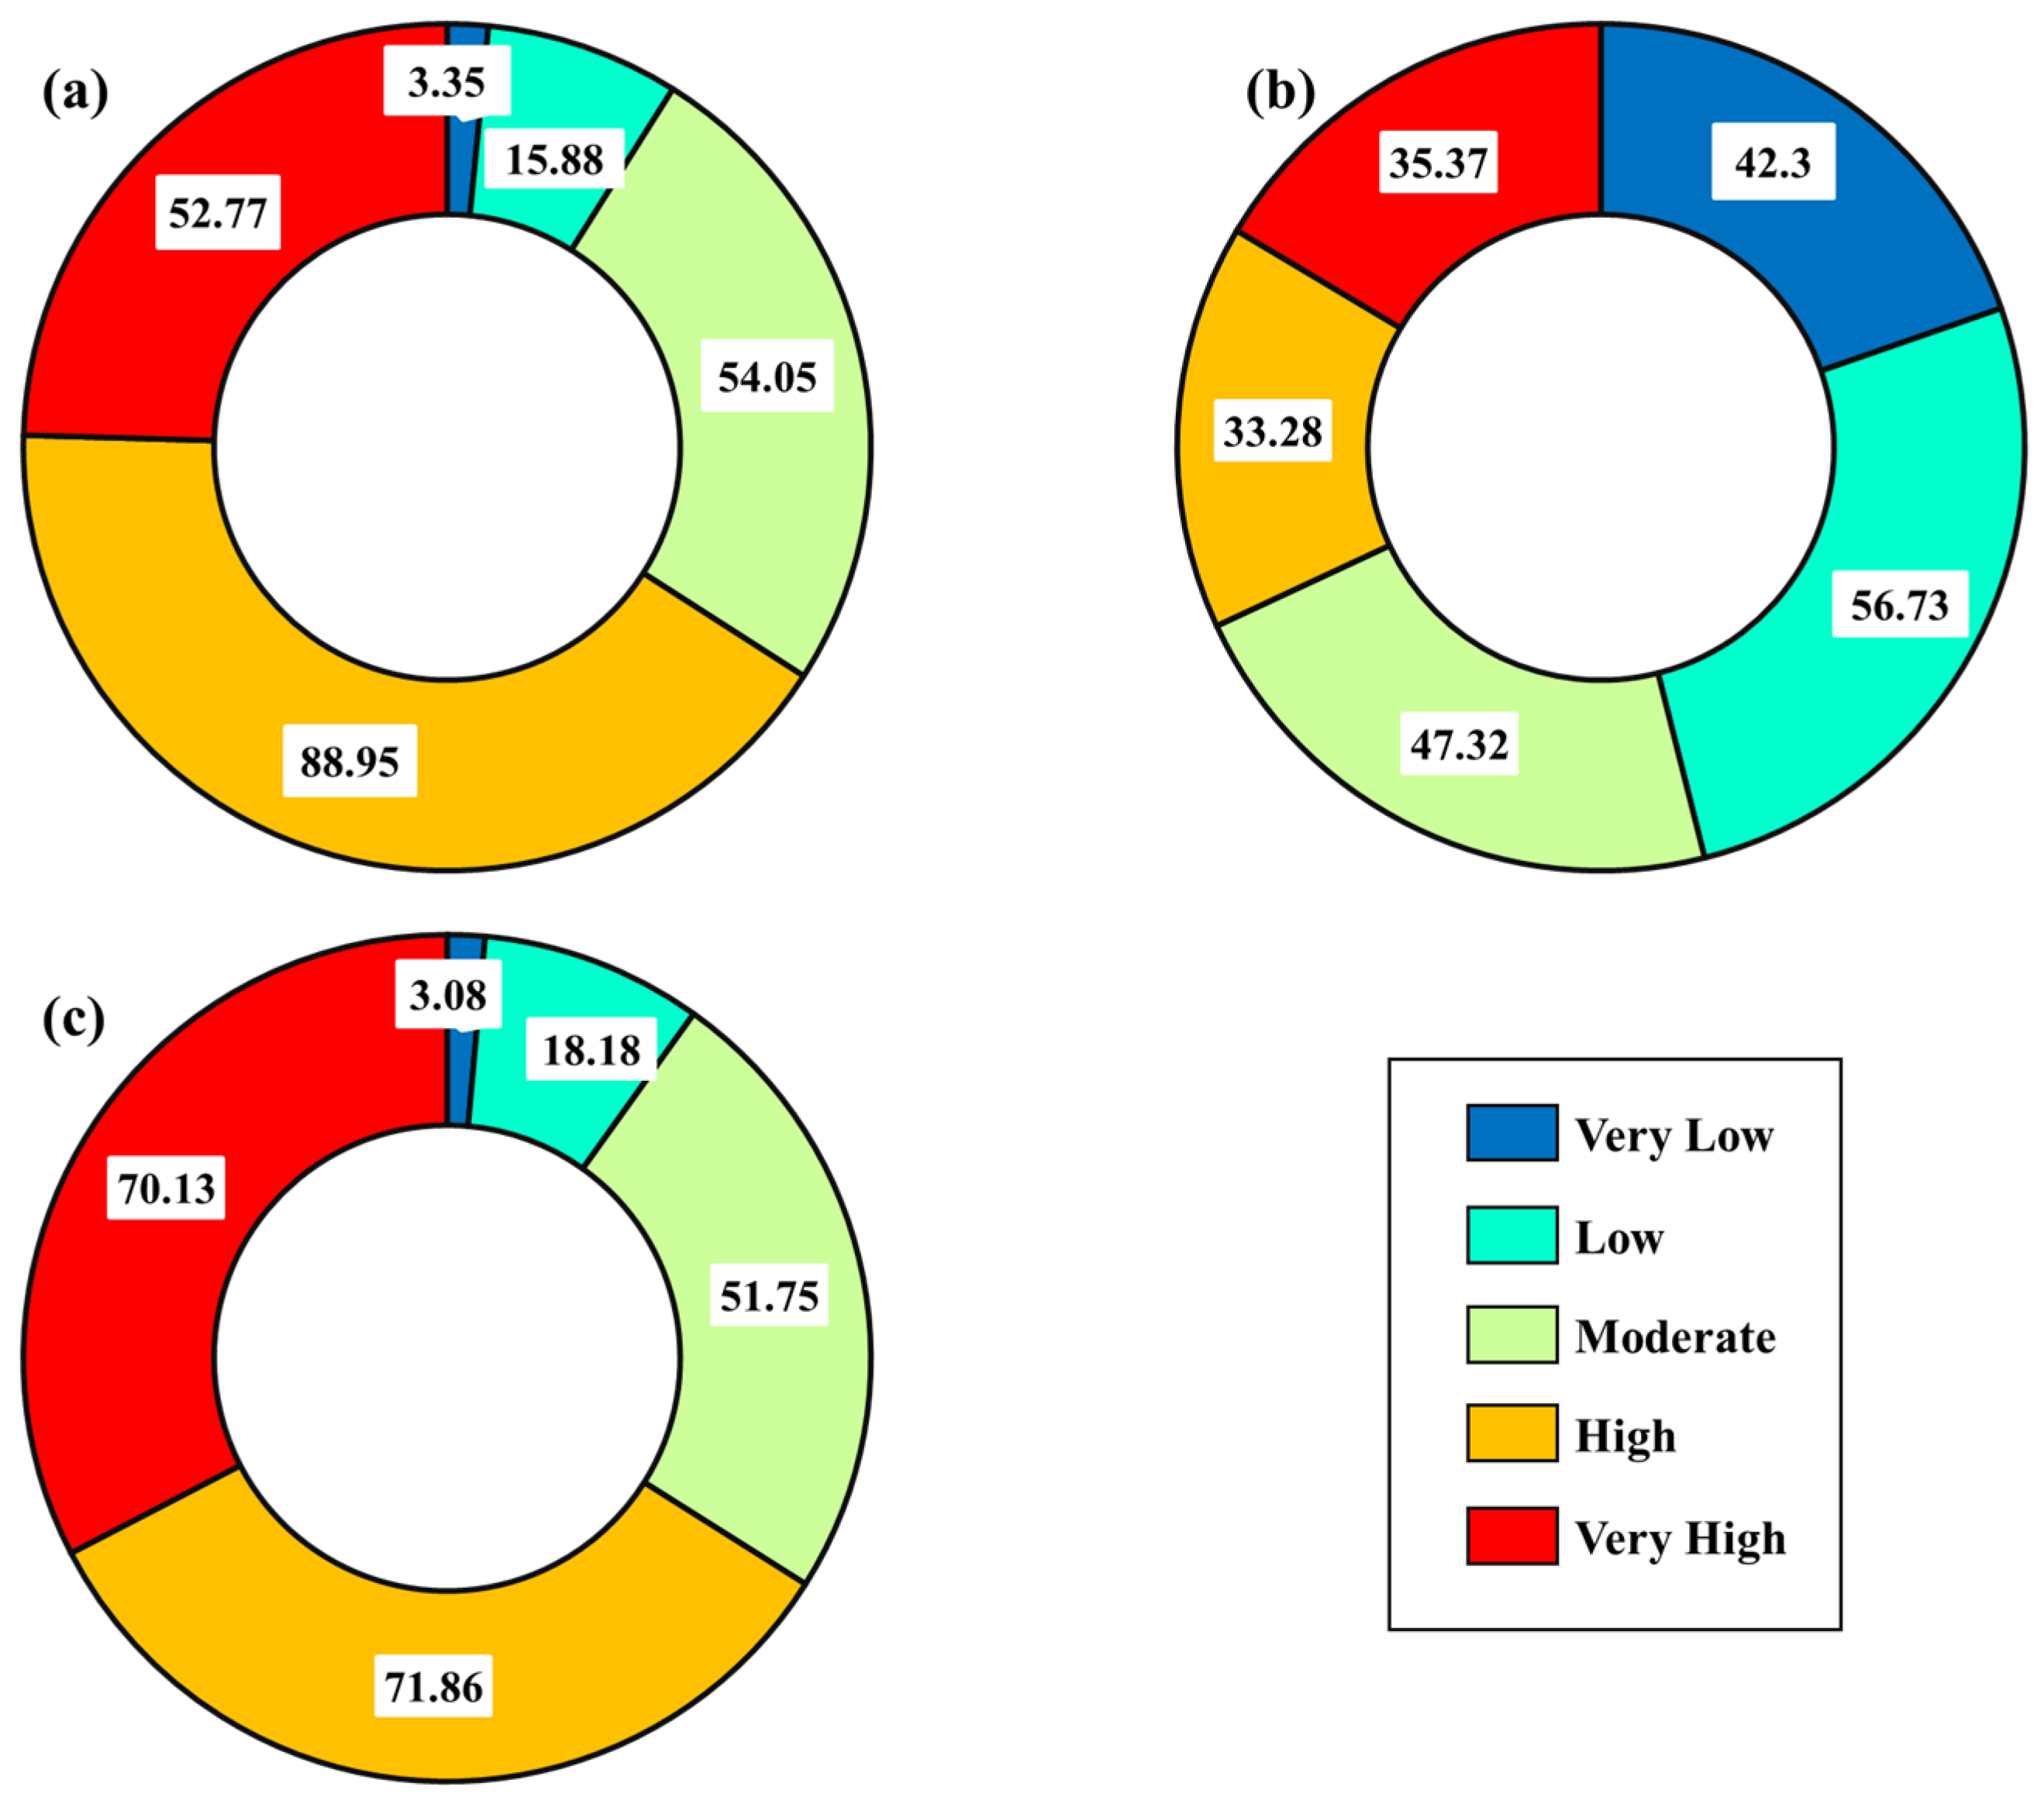
The analysis of the areas of the different classes in the compatibility, environmental, and infrastructural criteria reveals a varied distribution of sports facility development potential across Tehran (
Figure 9). In the compatibility criterion (
Figure 9a), the largest areas belong to the high potential class (88.95 km
2) and the moderate potential class (54.05 km
2), indicating that a significant portion of the city has favorable conditions for establishing sports facilities. In contrast, the very low class covers a very small area (3.35 km
2). In the environmental criterion (
Figure 9b), the distribution is more balanced; the very low potential class (42.3 km
2) and the very high potential class (35.37 km
2) suggest that while some areas are highly unsuitable, others are highly suitable for development. Additionally, the moderate potential class, covering 56.73 km
2, holds the largest share, reflecting a relatively even spatial distribution of environmental factors in the city. In the infrastructural criterion (
Figure 9c), the very high (70.13 km
2) and high potential (71.86 km
2) classes account for most of the area, indicating widespread access to adequate infrastructure. In contrast, the very low class has the smallest share (3.08 km
2), suggesting that only a few areas suffer from severe infrastructure deficiencies for sports facility development. Overall, the infrastructural factors present more favorable conditions for development compared to the other two criteria, while the environmental factors exhibit a more uneven distribution, and the compatibility remains at a high level of suitability.
The analysis of the final potential map for sports facility development in Tehran reveals a distinct spatial distribution pattern across different suitability classes. According to the normalized map (
Figure 10a), the northern and western parts of the city predominantly exhibit low potential values (blue colors), while the central and southern areas show higher potential in certain sections. In the classified map (
Figure 10b), the very low potential class (blue color) can be mainly observed in the northern and some western areas, indicating significant limitations for sports facility development in these regions. In contrast, the high and very high potential classes (orange and red colors) are more widely distributed in the central and parts of the southern and southeastern areas, likely due to higher population density, better infrastructure accessibility, and favorable environmental conditions. Examining
Figure 10c, the moderate potential class covers the largest area, with 69.14 km
2, indicating that a substantial portion of the city holds moderate potential for sports facility development. Following this, the high (67.26 km
2) and very high (48.58 km
2) potential classes demonstrate that nearly half of the city has favorable conditions for development. Conversely, the very low (3.18 km
2) and low (26.84 km
2) potential classes occupy the smallest areas, suggesting that the highly unsuitable areas for sports facility development are limited. At the district level, the central and southern districts (such as districts 10, 11, 16, and 17) exhibit higher potential due to their high population density and better access to urban infrastructure. In contrast, the northern districts (such as districts 1 and 2) and certain western areas (such as district 22) display lower potential values, likely due to topographical constraints, environmental limitations, and lower population density. Overall, the spatial distribution of potential classes indicates that the central and southern areas have the highest suitability for sports facility development, whereas the northern and certain western regions face greater constraints in this regard.
In the final stage, a validation process was incorporated into the research to assess the accuracy of the spatial modeling results (
Figure 11). This validation included a visual inspection of satellite images, field visits, and a comparison with the proposed model’s results. Based on the provided map, the spatial analysis of the selected locations for optimal sports facility allocation indicates that the areas with very high potential (marked in red) are primarily concentrated in the central and densely populated urban regions of Tehran. These areas offer favorable conditions for sports facility development in terms of population density; accessibility to the road network; and proximity to key land uses such as educational centers, public spaces, and residential zones. Additionally, the satellite imagery analysis confirms that the selected locations provide adequate space for the construction of sports complexes in terms of size and physical characteristics. Many of these sites are situated in underutilized land or open urban spaces, allowing for efficient land use. Furthermore, their proximity to major transportation routes facilitates easy access for citizens, which can contribute to greater public participation in sports activities.
In addition to the visual and spatial validation, a quantitative evaluation of the model was conducted using two performance indicators—the proportion of existing sports facilities located in each suitability class and the corresponding prediction rate [
46] (
Table 3). This approach provided a more objective measure of the model’s effectiveness in identifying optimal locations. The results of this assessment demonstrate a strong correlation between the model’s predictions and the actual distribution of sports facilities. Notably, 45% of the existing facilities were located in the very high suitability class, which also recorded the highest prediction rate of 1.99. This indicates a strong spatial match and confirms that the model successfully prioritizes the most appropriate areas for development. The high suitability class further supports this trend, containing 37% of the existing facilities and achieving a prediction rate of 1.17.
Together, these two classes account for over 80% of the current sports facility locations, validating the model’s ability to identify and prioritize highly viable zones. Equally significant is the model’s capacity to accurately exclude less suitable areas. The low and very low classes include only 1% and 0% of the existing facilities, respectively, with prediction rates near zero. This demonstrates the model’s reliability not only in identifying optimal areas but also in effectively minimizing false positives in unsuitable zones. Overall, the high concentration of existing facilities in top-ranking suitability classes, combined with the strong prediction rates, confirms the robustness of the spatial model. It reflects a well-calibrated and evidence-based methodology that can be confidently used to support future decision-making for sports facility site planning and urban development.
4. Discussion
The integration of different maps and models for evaluating the optimal allocation of sports facilities in a specific region can help optimize the decision-making process and identify the most suitable locations for the establishment of these facilities. Properly locating sports facilities by considering multiple criteria such as compatibility with urban land uses, environmental conditions, and access to infrastructure allows for the maximum utilization of these spaces and enhances the effectiveness of urban investments. This process is particularly important in areas that require the integration of various social, economic, and environmental factors. One of the main challenges in this regard is the fair and efficient distribution of sports facilities in accordance with the demographic and spatial needs of the city. For instance, areas with high population density require more sports infrastructure, while areas prone to environmental hazards such as flooding or earthquakes need to be carefully selected for facility development. Among the compatibility criteria, the population density and residential areas are of greater importance and weight. These factors play a crucial role in determining the optimal locations for sports facilities, as densely populated areas tend to have a higher demand for such amenities. Among the environmental criteria, the earthquake risk has been identified as a key factor, ensuring that sports facilities are located in areas less prone to earthquakes. Regarding the infrastructural criteria, accessibility to public transportation has shown significant importance, as easy access to these facilities encourages greater public participation. Furthermore, the compatibility criteria have been found to be more influential than environmental and infrastructural criteria in the decision-making process for site selection. This suggests that ensuring harmony with existing urban land use and demographic patterns is more critical than environmental constraints or infrastructural considerations when determining the optimal allocation of sports facilities. The findings of this study align with and expand upon previous research in the field. For instance, studies such as those by Higgs et al. [
47] and Namazi et al. [
8] similarly emphasized the importance of compatibility and population density in determining optimal locations for urban facilities. Other studies have employed multi-criteria approaches and GIS-based models to assess spatial equity and accessibility, yet many have not integrated a set of infrastructural, environmental, and compatibility criteria as comprehensive as that used in this research. Moreover, unlike some prior studies that primarily focused on technical optimization, this study also highlights social considerations such as spatial justice and equity in underserved areas. This broader approach contributes to a more holistic understanding of sports facility planning in urban settings.
The AHP method, as one of the most widely used techniques in multi-criteria decision-making, has gained significant importance among researchers and specialists. This method enables the precise weighting of criteria and prioritization of options through pairwise comparisons. Due to its hierarchical structure, the AHP allows decision-makers to evaluate different criteria at various levels and determine their relative weights. Unlike some decision-making methods that require complex mathematical processing, the AHP provides a clear and logical framework, enabling the simultaneous analysis of both qualitative and quantitative criteria [
48]. One of the key advantages of this method is the validation of results through the calculation of the CR, which allows for checking the accuracy and coherence of the judgments made [
49]. A low CR value indicates high consistency in pairwise comparisons and the reliability of the results. Furthermore, the AHP method performs optimally in complex decision-making processes that require combining spatial and non-spatial data, especially when integrated with the GIS method, and provides the ability to select the most optimal option based on the calculated weights for the criteria.
GIS methods are widely used in evaluation and optimal allocation projects. These systems are particularly effective when there is a need to analyze spatial and geographic data. One of the main advantages of the GIS method is its ability to integrate various data and criteria, including social, environmental, infrastructural, and economic factors, into a unified system [
50]. This data integration, especially in complex projects involving multi-criteria assessments of suitable locations for sports facilities, can help clarify the results and improve decision-making. Alongside the GIS method, SMCDA methods are also recognized as important tools for sports facility location planning. These models have the ability to analyze and evaluate different criteria within a geographic framework and can assist in identifying optimal locations for developing sports facilities. Especially in areas with specific geographical features and environmental or infrastructural challenges, SMCDA methods can, using spatial and geographic data, determine the best locations for constructing these facilities.
One of the key goals of this study beyond the technical optimization of facility locations was to contribute to social equity and spatial justice. While the model applies spatial and infrastructural criteria, a special emphasis was placed on identifying underserved and disadvantaged communities by including indicators such as high population density levels and a lack of existing sports infrastructure. This allowed the model to prioritize areas, particularly in the southern districts of Tehran, which are socioeconomically less advantaged. By directing new facility development toward these regions, the proposed approach actively promotes more equitable access to sports services and helps reduce urban disparities. Therefore, the GIS-SMCDA integration used in this study is not only a technical tool but also a means of operationalizing social justice in urban planning.
The varying levels of suitability identified across Tehran’s urban landscape can be explained by spatial inequalities in demographic distribution, infrastructure access, and environmental safety. For example, the central and southern districts with higher population densities and limited existing sports infrastructure were deemed more suitable due to both demand-based criteria and equity considerations. In contrast, environmentally sensitive zones such as floodplains or areas near fault lines scored lower, regardless of demand. These differences reveal a causal interaction among the criteria; for instance, the combination of a high population density and poor infrastructure magnifies the need and increases the priority for facility development. Moreover, urban planning issues such as unbalanced land use patterns, historical investment gaps, and irregular service distributions have contributed to the current spatial disparities. Recognizing and addressing these underlying causes is essential for sustainable and equitable sports facility planning.
This research faces challenges and limitations that should be addressed in future studies. One of the biggest challenges is the accuracy and reliability of spatial data used in GIS evaluations for locating sports facilities. Data such as land use maps, transportation networks, and satellite images may be affected by factors such as seasonal changes or technological limitations, which could reduce the accuracy of the analyses. Additionally, expert opinions were used for weighting criteria in this study, which could lead to inconsistencies and errors in prioritizing the factors. These subjective evaluations might influence the results of the potential analysis for sports facility development. It should also be noted that the WLC method assumes linear and additive relationships among criteria, which may oversimplify real-world spatial dynamics. In reality, complex and non-linear interactions may exist between variables (e.g., population density and service accessibility). Future studies are recommended to explore alternative decision models, such as fuzzy logic or machine learning-based approaches, to better capture these complexities.
In addition, it is essential that special attention be given to the economic and social dimensions of sports facility development in future research. Analyses such as cost-benefit simulations and assessments of citizen engagement with sports facilities and the social and cultural impacts of these centers can play a significant role in accurately evaluating the potential of different areas for developing such spaces. Furthermore, integrating various models, including economic, social, and environmental analyses, is recommended to provide a comprehensive framework for the allocation of sports facilities, ensuring that all influencing factors are considered simultaneously. Additionally, conducting sensitivity analyses and examining uncertainties in the location selection process can help reduce errors arising from inaccurate data or expert judgments, thereby enhancing the decision-making accuracy. Finally, advanced simulations and spatial optimization models can contribute significantly to a more precise evaluation of suitable areas for establishing sports facilities and creating a balanced and efficient network of such amenities at the urban and regional levels.


