Abstract
This study, taking Anhui Province as a case study, systematically evaluated the spatiotemporal differentiation characteristics of six ecosystem services (biodiversity maintenance, water yield, carbon fixation, vegetation net primary productivity (NPP), soil retention, and crop production) from 2000 to 2020 through the integration of multi-stakeholder decision-making preferences and the Marxan model. Four conservation scenarios (ecological security priority, social benefit orientation, minimum cost constraint, and balance synergy) were established to explore the spatial optimization pathways of ecological protection zones under differentiated policy objectives. The findings indicated that: (1) The ecosystem services in Anhui Province exhibited a “low north and high south” spatial gradient, with significant synergies observed in natural ecosystem services in the southern Anhui mountainous areas, while the northern Anhui agricultural areas were subjected to significant trade-offs due to intensive development. (2) High service provision in the southern Anhui mountainous areas was maintained by topographic barriers and forest protection policies (significant NPP improvement zones accounted for 50.125%), whereas soil–water services degradation in the northern Anhui plains was caused by agricultural intensification and groundwater overexploitation (slight soil retention degradation covered 24.505%, and water yield degradation areas reached 29.766%). Urbanization demonstrated a double-edged sword effect—the expansion of the Hefei metropolitan area triggered suburban biodiversity degradation (significant degradation patches occupied 0.0758%), while ecological restoration projects promoted mountain NPP growth, highlighting the necessity of synergizing natural recovery and artificial interventions. (3) Multi-scenario planning revealed that the spatial congruence between the ecological security priority scenario and traditional ecological protection redlines reached 46.57%, whereas the social benefit scenario achieved only 12.13%, exposing the inadequate responsiveness of the current conservation framework to service demands in densely populated areas. This research validated the technical superiority of multi-objective systematic planning in reconciling ecological protection and development conflicts, providing scientific support for optimizing ecological security patterns in the Yangtze River Delta region.
1. Introduction
As the core output form of natural capital, ecosystem services (ESs) are recognized as the foundation for sustainable socioeconomic development through their material supply, regulatory support, and cultural heritage functions [1,2,3]. However, the IPBES (2019) Global Assessment Report revealed significant degradation in approximately 75% of terrestrial ecosystem services and 66% of marine ecosystem services due to human activities. This ongoing deterioration poses direct threats to regional ecological security and long-term human well-being [4]. Against this backdrop, the scientific identification and delineation of ES conservation areas have emerged as core strategies for natural capital management to achieve spatial regulation of critical service flows. Internationally, the construction of ES conservation area networks has been explicitly prioritized in the IUCN’s “Post-2020 Biodiversity Framework” as a global biodiversity conservation initiative [5,6]. In policy implementation, China’s “ecological protection redlines” system enforces rigid control over key services like soil–water conservation and carbon sequestration, while the EU’s “Green Infrastructure Strategy” connects cross-regional service supply nodes, demonstrating the feasibility of ES-oriented protected area planning [7]. These practices indicate that the precise identification and integration of high service supply and high degradation risk areas into protection systems can not only alleviate ecological deficits but also enhance the coupling between conservation policies and human well-being demands, which has become a focal area in interdisciplinary ecological and geographical research [8].
Traditional ecosystem service (ES) hotspot mapping, conducted by identifying spatial clusters of high service supply intensity [9] (e.g., the Getis-Ord Gi* index method), provides a visual basis for prioritizing conservation areas. However, such methods are fundamentally categorized as “single-objective static optimization,” which fails to incorporate multiple decision-making preferences such as conservation costs, social benefit conversion rates, and supply sustainability. For instance, in ecologically fragile yet economically underdeveloped regions, although ES supply intensity is relatively low, the unit conservation costs may be significantly lower compared with high ES intensity areas [10]. Similarly, certain areas exhibit high ES flows but yield limited actual social benefits due to sparse beneficiary populations or management inefficiencies. This complexity necessitates that the delineation of conservation areas transcends single ES intensity thresholds and transitions toward “dynamic spatial optimization under multidimensional constraints” [11].
The systematic conservation planning tool Marxan has emerged as a core technical solution to address the aforementioned challenges due to its algorithmic flexibility and parameter customizability [12,13]. Its key functionalities are reflected in: (1) By constructing composite objective functions incorporating ES conservation targets (e.g., carbon storage ≥ X tons), cost layers (e.g., land opportunity costs), and spatial constraints (e.g., connectivity thresholds), Marxan generates optimal solution sets that simultaneously satisfy ecological–social–economic requirements [14]. (2) Decision makers can produce protection area scenarios reflecting different policy orientations (e.g., ecological conservation-dominant, social benefit-maximizing, or cost-minimizing types) by adjusting target weightings (e.g., prioritizing carbon sequestration or flood control), modifying cost accounting rules (e.g., incorporating community participation costs), or setting zoning restrictions (e.g., no-development zones), thereby quantifying the trade-off relationships. (3) Through its simulated annealing algorithm based on multiple iterations, Marxan outputs “selection frequency” heatmaps to identify key areas sensitive to objective functions. High-frequency zones are recognized as consensus protection areas across scenarios, while low-frequency zones reveal decision preference divergences, providing foundations for adaptive management. Existing case studies demonstrate Marxan’s significant advantages in multi-scale ES conservation planning [15]. For instance, Hui et al. identified optimal protection schemes at grid scale in the Loess Plateau by integrating ecological status and economic efficiency through Marxan and the Comprehensive Ecosystem Service Performance (CESP) index [16]. Li et al. incorporated decision preferences into ES conservation delineation, using water-related ESs in the Dawen River Basin to map spatial ranges of protected areas under multiple scenario trade-offs [17]. These practices validate Marxan’s irreplaceability in balancing scientific rigor and policy feasibility.
In summary, this study employs the systematic conservation planning tool Marxan to conduct multi-constrained ecological protection area identification in Anhui Province. By applying Marxan to Anhui’s complex socio-ecological system, this study aims to establish a replicable framework for balancing ecological security and sustainable development in rapidly urbanizing regions.
2. Materials and Methods
2.1. Overview of the Study Area
This study aims to integrate multidimensional parameters such as ecosystem services and social demands through Marxan to explore more inclusive and dynamically adaptive adjustments for protected areas. Anhui Province (114°54′–119°37′ E, 29°41′–34°38′ N), located in the hinterland of China’s eastern population economic high-density zone, covers a total area of 140,100 km2 and administers 16 prefecture-level cities (Figure 1). As the only province in the Yangtze River Delta urban agglomeration spanning both the Yangtze and Huai River basins [18], Anhui Province exhibits transitional ecological characteristics between northern and southern China [19], making it an ideal high-resolution research target for analyzing ecological protection zone optimization mechanisms under intensive urbanization. Its core research significance manifests in four dimensions: (1) Sensitivity of Ecological Transition Zones: Anhui encompasses diverse ecological units, including the Dabie Mountains (a crucial water conservation area in East China), the southern Anhui mountainous region (part of the globally significant biodiversity hotspot Huangshan–Huaiyu Mountain corridor), and the Chaohu Lake Basin (the largest freshwater lake in the lower Yangtze). These areas demonstrate pronounced gradients in ecosystem services (ESs), ranging from mountain carbon sequestration to plain-based grain production. However, rapid built-up area expansion since 2000 has elevated ecological space fragmentation indices significantly above the Yangtze River Delta average, highlighting intense spatial conflicts between conservation and development; (2) Policy Focus on Cross-boundary Collaborative Protection: Serving as a core component of the Yangtze River Delta’s green ecological barrier and a key implementation zone for the Yangtze Economic Belt’s “joint protection strategy,” Anhui hosts the Xin’an River eco-compensation pilot—China’s first trans-provincial watershed compensation mechanism [20]. While its “water quality bet agreement” enables Anhui–Zhejiang collaborative governance, existing protected area layouts remain challenged by the administrative fragmentation of ecological integrity, necessitating systematic planning tools to overcome institutional barriers; (3) Spatial Mismatch Between ES Supply and Demand: Despite ranking first in per-unit ES supply (quantified via the InVEST model) across the Yangtze River Delta, Anhui’s capital Hefei metropolitan area exhibits high ES consumption, creating a spatial imbalance between “high-supply zones (western Anhui)” and “high-demand zones (central and northern Anhui)”.
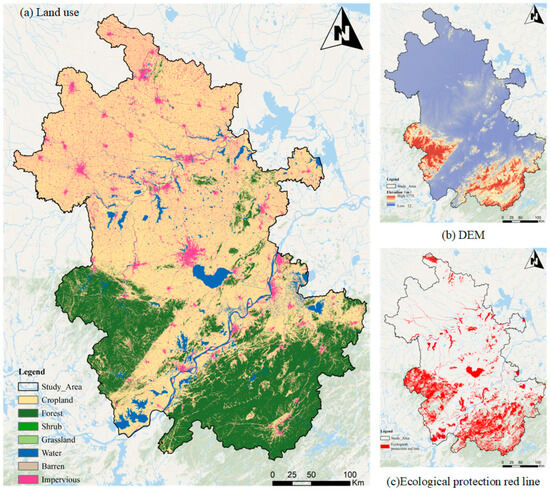
Figure 1.
(a) Spatial distribution of land use; (b) geographical characteristics of the study area; (c) ecological protection red line.
This disparity demands a paradigm shift from traditional “in situ conservation” to holistic spatial interventions encompassing “supply-side optimization, flow-path maintenance, and demand-side regulation,” where Marxan’s cost–benefit modules can provide quantitative support. From north to south, the province sequentially transitions through the Huaibei Plain (elevation 20–50 m), Jianghuai Hills (50–200 m), Dabie Mountains (peak elevation 1774 m), Yangtze River Plain (10–30 m), and southern Anhui Mountains (highest peak: Lotus Peak at 1864 m). Its biomes blend the characteristics of the warm-temperate deciduous broad-leaved forests in North China and the subtropical evergreen broad-leaved forests in Central China, reflecting marked transitional biogeographical features. Over the past two decades, extensive and disorderly human activities have led to widespread habitat degradation and declining ecosystem functionality across the region.
2.2. Data Source and Processing
The data used in this study include land use, topography, meteorology, and socio-economic data. (1) Meteorological observation data mainly consist of radiation, precipitation, and temperature, sourced from the “China Regional High Spatiotemporal Resolution Surface Meteorological Element Driving Dataset”; (2) Land use data from 2000 to 2020 are derived from the Wuhan University CLCD dataset (https://zenodo.org/record/5210928, accessed on 22 April 2023), with a spatial resolution of 30 m; (3) Elevation data for DEMs are obtained from ASTER GDEM, with a spatial resolution from the Chinese Academy of Sciences’ Data Center for Resources and Environmental Sciences (https://www.resdc.cn/, accessed on 25 April 2023); (4) Soil data are based on the China Soil Data Set (v1.2) using HWSD, with a resolution of 1000m; (5) Other data include statistical yearbooks and boundary data for the study area, where the statistical yearbook data cover the statistical yearbooks of the study area from 2000 to 2020 and some county-level statistical bulletins, and the boundary data are sourced from the National Geographic Information Resource Catalog Service System (http://www.webmap.cn/, accessed on 22 April 2023). All data were uniformly resampled to 30 m using the resampling function on the ArcGIS10.8 platform and standardized to a WGS_1984_UTM_Zone_50N coordinate system.
2.3. Study Technical Path and Method
The main research framework of this study integrates the InVEST and Marxan models to systematically identify priority conservation zones in Anhui Province aligned with multi-stakeholder interests. Initially, dominant ecosystem services (biodiversity maintenance, water yield, carbon fixation, net primary productivity, soil retention, and crop production) were quantitatively assessed using the InVEST (Integrated Valuation of Ecosystem Services and Tradeoffs) model, CASA (Carnegie-Ames-Stanford Approach) model, and Revised Universal Soil Loss Equation (RUSLE). Subsequently, multi-scenario spatial optimizations were conducted by configuring cost constraints within the Marxan model to delineate priority conservation zones.
Ecosystem services are widely categorized into four main groups—provisioning, regulating, supporting, and cultural services—as established by the Millennium Ecosystem Assessment (MEA). In this study, the six selected ecosystem service indicators correspond explicitly to these broader categories, specifically: Provisioning services, represented by Crop Production (CP), directly reflecting food provision capacity. Regulating services, including Water Yield (WY), Carbon Fixation (CF), and Soil Retention (SR). These indicators measure key regulatory processes, such as hydrological regulation, climate regulation through carbon sequestration, and erosion control. Supporting services, reflected by Net Primary Productivity (NPP) and Biodiversity Maintenance (BM), highlighting fundamental ecosystem processes that underpin overall ecosystem functionality and integrity, such as nutrient cycling and habitat provision. Cultural services were not explicitly quantified in this study, primarily due to limitations in data availability and modeling approaches, which could be addressed in future research. Clarifying these relationships enhances the interpretability of our findings within the widely accepted MEA ecosystem service framework and facilitates the integration of our results into broader conservation planning discourses. The InVEST model, developed by the Natural Capital Project, is a spatially explicit modeling tool used to quantify and map ecosystem service flows based on land use and biophysical processes. In this study, it was specifically employed to calculate services including water yield, carbon fixation, biodiversity maintenance, soil retention, and crop production.
The Marxan model, developed by the University of Queensland and Conservation International, was adopted as the computational engine for systematic conservation planning (SCP). It utilizes a simulated annealing algorithm to optimize protected area selection under ecological, economic, and social constraints, systematically minimizing economic costs and spatial conflicts while satisfying biodiversity conservation objectives through the iterative computation of spatial objective functions.
Specifically, our methodological workflow comprises four main steps: (1) Data Acquisition and Preprocessing: The acquisition and preprocessing of datasets, including meteorological, soil, vegetation, land use, and socioeconomic data, followed by the quantitative assessment of ecosystem services. (2) Scenario Development and Model Specification: Four distinct conservation scenarios were established—ecological security priority, social benefit optimization, minimal cost allocation, and balanced conservation—to represent diverse stakeholder preferences and objectives. The specific modeling tools and frameworks applied included the Ecological Security Index (ESI), beneficiary population analysis, and Human Footprint Index (HFI). (3) Spatial Optimization: The study area was discretized into planning units (10 km2 each), and tiered conservation targets (20%, 30%, and 40% ecosystem service preservation thresholds) were implemented via Marxan optimization modeling. The conservation targets of 20%, 30%, and 40% used in this study were determined based on widely adopted benchmarks in the systematic conservation planning literature and international ecological conservation guidelines. For example, previous studies employing the Marxan model for systematic conservation planning commonly set conservation targets ranging from 20% to 40% to effectively balance ecological integrity, economic feasibility, and social acceptability [12,13,16]. Additionally, global conservation initiatives such as the Convention on Biological Diversity (CBD) have historically advocated protecting at least 17% to 30% of terrestrial ecosystems, which recent conservation discussions propose increasing towards higher benchmarks (up to approximately 40%) to halt biodiversity loss and enhance ecosystem service delivery. Thus, the targets of 20%, 30%, and 40% in this research align with both scientific practices and current international conservation policy trends. 4) Validation and Strategy Formulation: The optimized conservation outputs were validated against Anhui Province’s ecological protection redlines, facilitating the formulation of actionable and scientifically supported conservation strategies (Figure 2).
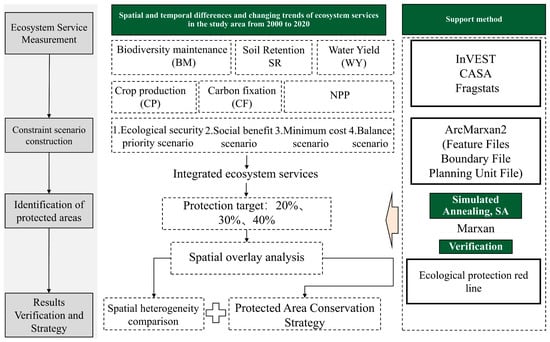
Figure 2.
Research technology route.
2.3.1. Ecological Security Priority Scenario
The ecological security priority scenario incorporates spatial constraints based on ecosystem service intensity gradients, prioritizing zones with elevated Ecological Security Index (ESI) values. Regional ecological security inherently requires dual fulfillment: maintaining ecosystem health while providing essential services for human well-being and sustainable development. Consequently, the ESI integrates two foundational components—ecosystem service capacity and ecosystem health status [16].
Anhui Province’s complex geological vulnerability necessitates comprehensive ecological assessments. Six critical ecosystem services were selected for their stabilizing roles in ecological balance [3,20]: Crop Production (CP), Water Yield (WY), Soil Retention (SR), Biodiversity Maintenance (BM), Carbon Fixation (CF), and Net Primary Productivity (NPP). These were quantified using the InVEST model, CASA model, and revised universal soil loss equation (RUSLE), with outputs normalized for cross-dimensional comparability. An ecosystem health assessment evaluates systemic resilience through two dimensions: structural integrity (spatial configuration of ecological elements) and functional quality (biophysical condition). This dual-aspect framework captures an ecosystem’s capacity to maintain self-regulatory processes and recover from disturbances. Recognizing the co-equal importance of structure, quality, and services in security evaluation, we developed an integrated ESI metric building upon established methodologies:
where the Ecological Security Index (ESI) represents a dimensionless composite metric integrating three fundamental ecosystem attributes: structural configuration (S), functional quality (Q), and service provision capacity (ES). These components were operationalized through standardized indicators:
Ecosystem Service Measurement Methods
- (1)
- Carbon Fixation
The carbon storage calculation in the InVEST model integrates four major carbon pools (aboveground biomass, belowground biomass, soil organic matter, and dead organic matter), with the computational principle governed by the following equation [3]:
Among these, represents the total carbon stock in the study area, denotes the aboveground biomass carbon stock, refers to the belowground biomass carbon stock, represents the soil carbon stock, and represents the dead organic carbon stock. The carbon density for different land use types and soil types is primarily derived from the relevant literature on the study area.
- (2)
- Water Yield
Building upon the InVEST model’s simulation framework for land–atmosphere interface water cycling processes, this study employs a hydrological process model to delineate precipitation redistribution mechanisms [3]. The core algorithm integrates geospatial heterogeneity characteristics to quantify net water resource supply potential at the grid-cell scale. The technical framework establishes a dynamic “input-storage-output” equilibrium model by coupling terrain features (slope aspect and flow accumulation pathways), meteorological parameters (precipitation intensity and evaporative demand), and vegetation attributes (canopy interception and root water uptake). The critical biophysical drivers include atmospheric water vapor influx, soil water retention capacity, and vegetation transpiration efficiency. A region-specific parameter calibration ensures model applicability to Anhui Province. The governing equations are formulated as follows:
where represents the annual water yield (mm) for each grid unit within the watershed, denotes the annual actual evapotranspiration (mm) for grid unit , and represents the annual precipitation (mm) for grid unit .
- (3)
- Soil Retention
The InVEST soil retention module utilizes the Universal Soil Loss Equation (USLE) to evaluate soil conservation capacity within Anhui Province’s ecosystems [20]. This module integrates four critical datasets: (1) topographic data (digital elevation models), (2) vegetation dynamics (land cover/NDVI), (3) precipitation records, and (4) soil physicochemical properties. The governing equation is expressed as:
In the equation: R represents the rainfall erosion factor [MJ·mm/(hm2·h·a)]; K is the soil erodibility factor [t·hm2·h/(hm2·MJ·mm)]; LS is the slope length and slope factor; C is the vegetation cover and management factor, which takes the value of 0~1; and P is the engineering measure factor, which takes the value of 0~1. The parameters related to P and C refer to the existing studies in this area [11,20] (Table 1); and SR is Soil Retention (t/(hm2·a)).

Table 1.
P value and C value of different land use types.
- (4)
- Biodiversity Maintenance
Referring to the guidelines for delineating ecological conservation redlines and relevant studies, we quantitatively assess the biodiversity maintenance service capacity index in the study area using the Net Primary Productivity (NPP) method. The calculation formula is as follows [3]:
In the equation: represents the index of biodiversity maintenance service capacity, NPP stands for annual net primary productivity of vegetation, denotes annual precipitation, corresponds to annual temperature, and represents the altitude factor.
- (5)
- Crop production
According to relevant studies, a significant linear relationship exists between crops and NDVI (Normalized Difference Vegetation Index). By utilizing NDVI data, this research approximately allocates the grain yield in the study area to croplands. The calculation formula is as follows [3,21,22]:
In the equation: represents the grain yield allocated to the ith cropland grid; denotes the total grain production across different cities in the study area; refers to the NDVI value of the ith cropland grid; and represents the total NDVI value of croplands in various cities within the study area.
Ecosystem Services Health
- (1)
- Ecosystem service structure
Ecosystem structure is used to describe the complexity of ecosystems, which is determined by the heterogeneity and connectivity of landscapes. This study calculates ecosystem structure through a series of landscape indicators, characterizing landscape heterogeneity, connectivity, and important land connectivity. A weighted coefficient model was used for grassland and forest calculations. According to previous research, since both landscape heterogeneity and connectivity have a significant impact on ecosystem structure and cannot substitute for each other, equal weights were assigned, set at 0.35 [17]. The weight for important land patch connectivity is 0.3. The calculation formula is as follows:
In the formula, landscape connectivity (LC) includes area-weighted average patch fractal dimension (AWMPFD) and landscape fragmentation index (FN1). Landscape heterogeneity (LH) includes the Shannon diversity index (SHDI), modified Simpson diversity index (MSIDI), and spread index (CONTAG). The fragmentation indices (FN2, FN3) and patch connectivity indices (CONNECT1, CONNECT2) correspond to forest and grassland, respectively.
- (2)
- Quality of ecosystem services
Net primary productivity (NPP) is the product of the interaction between vegetation and external environmental factors [23,24]. It is not only a key variable in characterizing vegetation vitality but also reflects the quality of terrestrial ecosystems, forming an essential part of the surface carbon cycle. Given that the carbon budget of vegetation is closely related to ecosystem production and processes, quantitatively assessing the carbon sequestration capacity of ecosystems is a crucial method for determining ecosystem quality. This study uses the CASA model to calculate NPP to represent ecosystem quality and standardizes it to a scale of 0–1. The method for calculating NPP is as follows:
where APAR(x, y, t) represents the photosynthetically active radiation (MJ·m2·month−1) absorbed by the pixel at spatial position (x, y) in month t, and ε(x, y, t) refers to actual light energy utilization (MJ·m2·month−1) of the pixel at position (x, y) in month t (g C·MJ−1).
where SOL(x, y, t) represents the total solar radiation energy (MJ·m−2) of the pixel at position (x, y) in month t, and FAPAR(x, y, t) refers to the fraction of the incident photosynthetic effective radiation assimilated by vegetation.
2.3.2. Social Benefit Scenario
This scenario sets spatial constraints based on the social importance of ecosystem services, prioritizing areas with high social significance. In this study, the cumulative beneficiary population is used to represent the social importance of ecosystem services [25,26], grounded in established theories of ecosystem service flow and spatial interdependencies. Specifically, upstream ecosystems often provide crucial regulating and provisioning services—such as fresh water supply, flood control, sediment retention, and nutrient cycling—that significantly influence downstream human communities and economic activities. Thus, areas with larger cumulative downstream populations typically signify a greater dependence on these upstream ecosystem services; therefore, they experience higher derived social benefits from maintaining ecosystem functions and services upstream [16,25,26,27]. For instance, water yield from upstream forests regulates water availability and quality for downstream agriculture and urban consumption, while upstream soil retention directly reduces downstream sedimentation, mitigating flood risks and enhancing water quality. Such spatial relationships have been widely demonstrated in the ecosystem service literature, emphasizing the necessity to consider downstream populations when prioritizing ecosystem service conservation and spatial planning [16,26,27]. The impact area is defined as the downstream region receiving ecosystem services from upstream pixels, with the formula being:
In the formula, represents the importance of ecosystem services in pixel i, represents the physical quantity of ecosystem services in pixel i, and represents the number of ecosystem service beneficiaries in pixel i.
The cumulative beneficiary population is used as an indicator to represent the social importance of ecosystem services, based on the concept that ecosystems located upstream typically provide regulating and provisioning services (such as water supply, flood regulation, and soil retention) that directly benefit the populations located downstream through hydrological and ecological flows [16,25]. Therefore, a greater cumulative downstream population indicates higher potential social benefits derived from the upstream ecosystem services.
2.3.3. Minimum Cost Scenario
This scenario sets spatial constraints based on the minimum protection cost, prioritizing areas with lower protection costs [16,27]. The study uses the Human Footprint Index (HFI), which reflects human activity and economic development levels, to calculate protection costs. The Human Footprint Index (HFI) is calculated using multiple anthropogenic factors reflecting the intensity of human activities and associated conservation costs. Specifically, the HFI calculation integrates five key indicators: (1) POP (population density) calculated as the number of inhabitants per km2, sourced from the Resources and Environmental Science Data Platform (https://www.resdc.cn/, accessed on 25 April 2023). (2) Road (road accessibility index) represented by road density according to the road linear data of the study area provided by the Resource and Environmental Science Data Platform. ArcGIS kernel density analysis was used to calculate this. (3) GDP (economic development intensity) measured as GDP per unit area (CNY/km2), sourced from the Resources and Environmental Science Data Platform (https://www.resdc.cn/, accessed on 25 April 2023). (4) NLI (Nighttime Light Index) indicating urbanization and development levels, derived from nighttime satellite images provided by the DMSP/OLS dataset, with pixel values standardized from 0 (dark) to 63 (brightest). (5) Land use (intensity of land use) expressed as a dimensionless index based on land use categories and weighted according to the degree of human impact (urban built-up areas have the highest weight and are assigned a value of 1, agricultural land has a medium weight of 0.8, forest and shrubs have a value of 0.2, water areas have a value of 0, unused land has a value of 0.6, and grassland has a value of 0.4). In order to facilitate the calculation, the above five indicators are normalized. The calculation formula is as follows:
2.3.4. Balance Scenario
This scenario integrates the spatial constraints of the aforementioned three scenarios, aiming to minimize protection costs while maintaining regional ecological security and ensuring the social benefits of ecosystem services [16]. Given that the impacts of the three scenarios are balanced and cannot replace each other, this study uses ArcGIS10.8 software to assign equal weights to the three scenarios for spatial overlay, resulting in the outcome of a comprehensive collaborative scenario.
3. Results
3.1. Temporal and Spatial Evolution of Ecosystem Services
Based on the evaluation of the ecosystem services in Anhui Province from 2000 to 2020, this study reveals marked correlations between the spatial heterogeneity of six ecosystem service types and regional physiographic conditions coupled with anthropogenic disturbance intensity (Figure 3).
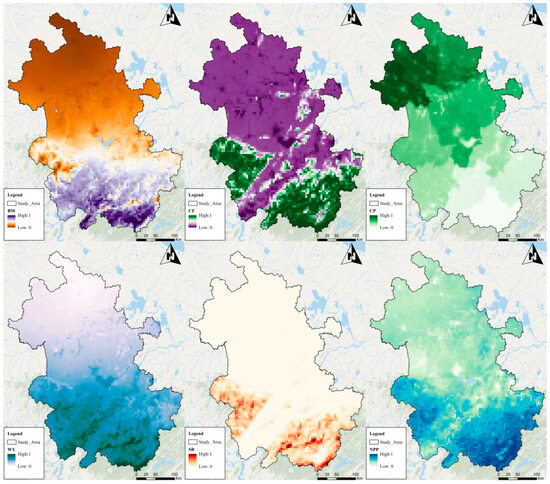
Figure 3.
Spatial and temporal pattern of ecosystem service function (including five types of indicators in the measurement of ecosystem service function and NPP in the quality of ecosystem service).
Biodiversity maintenance (BM), water yield (WY), carbon fixation (CF), net primary productivity (NPP), and soil retention (SR) exhibit a distinct latitudinal gradient characterized by lower values in the northern plains and higher values in the southern mountainous regions, primarily attributable to superior forest coverage and ecological integrity within the Dabie and southern Anhui mountain ranges. Conversely, crop production (CP) demonstrates an inverse spatial pattern, with high-value clusters concentrated in the traditional agricultural zones of the Huaibei Plain and Jianghuai Hills, evidencing spatial incompatibility between agricultural intensification and ecological conservation. Spearman’s rank correlation analysis further elucidates significant trade-off relationships (p < 0.01) between CP and other ecosystem services, likely stemming from the agricultural homogenization of land cover and chemical interference in ecological processes. The strong synergistic effects among BM, WY, CF, NPP, and SR collectively underscore the multifunctional benefits conferred by natural ecosystems such as forests and wetlands (Figure 4).
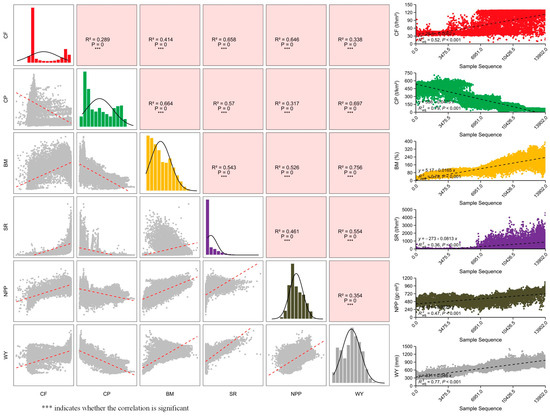
Figure 4.
Correlation coefficient of ecosystem services in the study area and trend of sample point distribution.
Piecewise linear regression models uncover heterogeneous temporal trajectories (Figure 5): BM initially increased before 2002 followed by subsequent decline, potentially reflecting initial ecological dividends from the Grain for Green Program and later habitat fragmentation from urbanization. CF maintained remarkable stability (66.5–67.5 t/ha) over two decades, indicative of mature forests’ resilient carbon sequestration capacity. CP displayed a critical inflection from pre-2003 decline to sustained growth, temporally coinciding with agricultural subsidy implementation and high-standard farmland construction. Although NPP demonstrated overall growth, its decelerating trend post-2001 suggests emerging constraints from light–temperature–water resource synergies. SR exhibited accelerated improvement after 2019, presumably linked to cumulative ecological restoration effects and enhanced erosion control measures, while WY transitioned from annual decline to recovery post 2012, potentially associated with precipitation pattern shifts and water conservation forest development under climate change. These nonlinear evolutionary trajectories collectively illustrate the complex interplay of natural and socioeconomic drivers within coupled human–environment systems (Table 2).
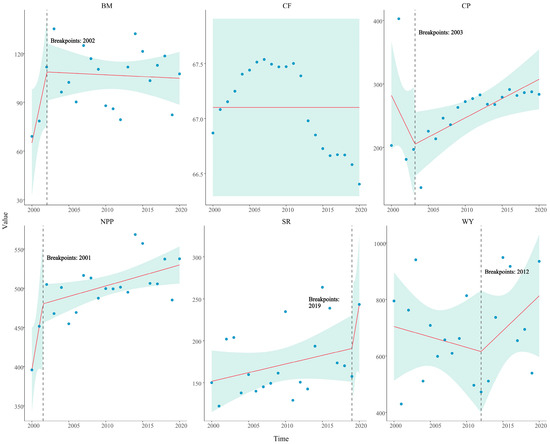
Figure 5.
Trends and inflection points of ecosystem service function from 2000 to 2020 (based on segmented linear regression model).
Table 2.
Results of segmented linear regression model.
3.2. Spatial Trends of Ecosystem Services
An integrated analysis employing Sen’s slope estimation and Mann–Kendall’s trend tests elucidates the pronounced spatial heterogeneity and driving mechanisms underlying six ecosystem service trajectories in Anhui Province (2000–2020). For biodiversity maintenance (BM), degradation exhibits distinct urban–rural gradients: peri-urban zones like the Hefei metropolitan area manifested 0.0758% significantly degraded patches through habitat fragmentation and ecological corridor disruption from construction sprawl. The northern Anhui plains’ 41.112% mildly degraded areas correlate with landscape homogenization from intensive agriculture, while 35.216% mildly improved and 15.900% significantly enhanced regions across central-southern Anhui likely benefit from ecological restoration initiatives like the Grain for Green Program and protected area networks. Notably, the Huangshan–Tianmushan biodiversity hotspot demonstrated maximal improvement, underscoring mountain forest ecosystems’ foundational role in BM (Table 3).
Table 3.
Proportion of ecosystem service change types in Anhui Province from 2000 to 2020.
Carbon fixation (CF) exhibited remarkable spatiotemporal stability, with 98.307% of regions maintaining equilibrium, attributable to the mature subtropical evergreen broadleaf forests in southern Anhui. However, the 1.302% significantly degraded peri-urban patches reveal direct carbon sink losses from forest encroachment during urbanization, exemplified by northwestern Hefei’s ecological land conversion. Crop production (CP) demonstrates a bipolar spatial differentiation: 64.083% significantly improved areas in the Huaibei Plain reflect agricultural modernization benefits, whereas 15.799% degraded zones near urban centers (10.661% mild + 5.138% severe degradation) highlight detrimental cropland conversion impacts, particularly Hefei’s irreversible agro-ecosystem service losses during its expansion as a national innovation hub (Figure 6).
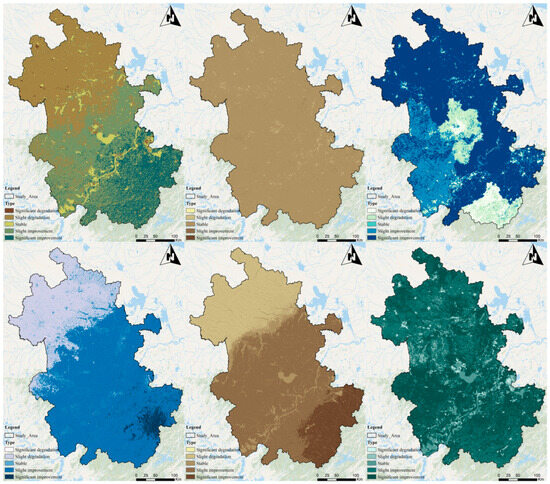
Figure 6.
Trends in ecosystem services from 2000 to 2020.
Soil retention (SR) and water yield (WY) dynamics exhibit a geographically driven north–south divergence. SR’s 12.666% significantly improved core zones in the southern mountains combine steep terrain and enhanced vegetation to suppress erosion, contrasting with 24.505% mildly degraded northern plains vulnerable to seasonal rainfall and tillage-induced soil loss. WY’s partition along the Huaihe–Yangtze divide (29.766% mild degradation in central Anhui vs. 66.121% mild improvement in the south) mirrors the topographic hydrologic controls—enhanced water conservation from orographic precipitation in the Dabie Mountains versus groundwater overdraft-driven degradation in the northern plains.
Net primary productivity (NPP) demonstrates extensive improvement (88.09% enhanced areas), signaling provincial ecosystem quality enhancement. The 50.125% significantly improved zones in the Dabie and southern mountains likely benefit from optimized forest structure and CO2 fertilization, while the 4.339% mildly degraded northern plains suggest potential soil organic depletion from agricultural intensification. Crucially, the spatial coupling between NPP improvement and BM/SR enhancement (correlation coefficient > 0.7) verifies vegetation recovery’s pivotal role in synergistic ecological functionality.
3.3. Spatial Characterization of Conservation Scenarios
This study systematically elucidates multi-objective spatial differentiation in ecological conservation zoning across Anhui Province through four protection scenarios incorporating differentiated decision preferences (Figure 7). The normalized results for each scenario were divided uniformly into four intervals (0–0.25, 0.25–0.50, 0.50–0.75, and 0.75–1.00; Table 4) to facilitate comparative analysis. These intervals are arbitrarily set for illustrative purposes, aiming primarily to clearly visualize spatial prioritization differences and similarities among the four conservation scenarios. The consistent grading ensures comparability across scenarios, enabling the intuitive interpretation of scenario-specific conservation priorities and their relative spatial distributions.
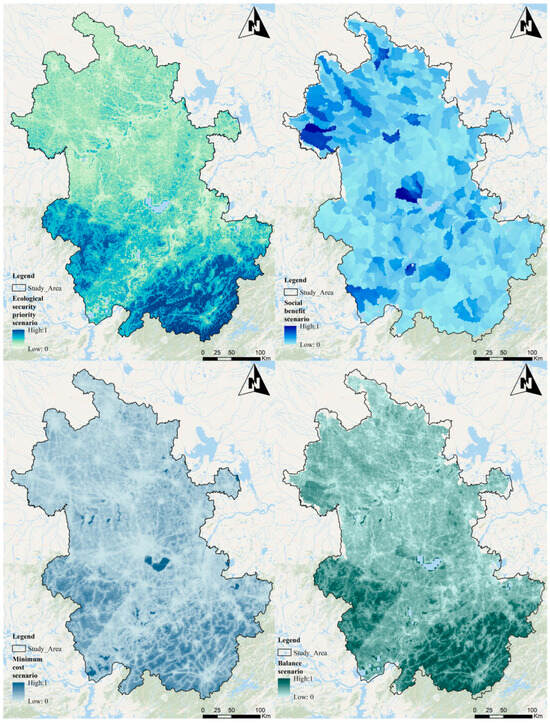
Figure 7.
Spatial characterization of conservation scenarios.
Table 4.
Statistical distribution of grades in different scenarios.
Under the ecological security priority scenario, high-priority zones (9.383% of total area) are concentrated in the western Dabie Mountains and the Huangshan–Jiuhuashan ecological barrier, demonstrating spatial anchoring effects from their dual capacities in ecosystem integrity and critical service flow provision. The relatively high zones (16.855%) form transitional corridors along the Jianghuai watershed, connecting montane and hilly ecological source areas, while low-priority areas (73.831% combined) dominate the Huaibei Plain, reflecting landscape homogenization and functional degradation from intensive agriculture.
The Social Benefit Scenario reveals distinct human–nature coupling characteristics: Fuyang region and the Hefei metropolitan area emerge as core reserves (0.8% high priority) through beneficiary population agglomeration effects, where lower service flows achieve higher social welfare conversion efficiency (e.g., the marginal contributions of crop production to food security). Conversely, reduced prioritization in the Dabie–southern mountainous areas despite superior service provision highlights the “ecological supply-social demand” spatial mismatch paradox.
The minimum cost scenario quantifies protection cost gradients via Human Footprint Index (HFI) assessment: Mountainous regions with low HFI and land opportunity costs contain merely 2.367% high/relatively high reserves, primarily in undeveloped areas like the Guniujiang National Nature Reserve. Contrastingly, 78.418% low-priority designations in the Huaibei Plain and Yangtze River urban belt demonstrate multi-fold higher protection costs, evidencing urbanization’s spatial constraints on conservation feasibility.
The balanced scenario synthesizes ecological–social–economic viability through equal-weight constraints, generating key spatial adjustments from base ecological priorities: (1) the Fuyang–Bozhou agricultural belt elevates to relatively high (9.7% increase) for food security significance; (2) the Hefei economic zone’s ecologically fragile periphery downgrades (12.3% low expansion) due to prohibitive protection costs; (3) the Dabie Mountain core achieves 35% patch density reduction through connectivity optimization. The resultant “pyramidal” hierarchy (high: 12.723%, relatively high: 17.012%, relatively low: 40.880%, low: 29.385%) demonstrates that multi-objective synergy requires flexible constraint thresholds and spatial compensation mechanisms for a Pareto improvement of conservation efficiency.
3.4. Analysis of Identification Results of Multi-Scenario Protected Areas Based on Marxan Model
Guided by a multi-objective optimization framework integrated with the Marxan spatial planning model, our four conservation scenarios demonstrate distinct spatial allocation characteristics of priority protected areas across Anhui Province (Figure 8). Under the ecological priority scenario, protected area expansion from 8426.26 km2 (20% target) to 20,141.63 km2 (40% target) reveals strong spatial anchoring: The Dabie Mountain region (national key ecological function zone) and Huangshan–Tianmushan biodiversity hotspot persistently form conservation nuclei, accounting for 58.3% and 31.7% of total protected area, respectively, closely associated with their superior carbon stocks (72.5 t/ha) and ecological security indices (0.86). The Jianghuai Hills transitional belt primarily functions as ecological corridors facilitating service flow transmission between montane and plain ecosystems (Table 5).

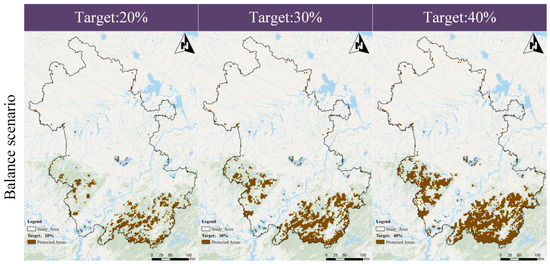
Figure 8.
Identification results of multi-scenario protected areas in the study area based on Marxan model.
Table 5.
Statistics of grade distribution under different scenarios.
The social benefit scenario exhibits dynamic “dispersion-agglomeration” spatial evolution: Expanding protection from 12,700.08 km2 to 25,068.90 km2 demonstrates how isolated patches in the northern agricultural zones (Fuyang, Suzhou) gradually connect with the Hefei metropolitan ecological nodes, forming trans-watershed “population–cropland” synergy networks. This nonlinear expansion pattern reflects the law of diminishing marginal conservation benefits—the initial phase prioritizes high social value peri-urban farmlands, while the later stages incorporate ecologically inferior but demographically significant areas, reducing conservation efficiency.
The minimum cost scenario unveils spatial bargaining between economic rationality and ecological value: Despite comparable protected areas (7989.51–19,621.21 km2) to ecological scenarios, its 42% higher Landscape Shape Index (LSI) indicates fragmented configurations. Detailed analysis reveals the preferential selection of high-elevation, low-human-footprint zones in the southern mountains while avoiding ecologically valuable but costly gentle slopes, consequently degrading ecological connectivity between core reserves.
The balanced scenario achieves spatial efficiency through multi-objective synergy: While maintaining comparable protected areas (8070.73–20,120.77 km2) to single-constraint scenarios, it enhances ecological corridor continuity through distance optimization, improving connectivity indices in the Dabie–southern mountain corridors. The strategic retention of high-social-value croplands in the Fuyang–Bozhou agricultural belt via “ecological island” designs mitigates the production–conservation conflicts. This spatial configuration significantly enhances ecological and social benefits while maintaining cost effectiveness, demonstrating the superiority of integrated optimization approaches.
4. Discussion
4.1. Comparing the Identification Results with the Ecological Protection Red Line
The ecological protection red line, established by the Chinese government, represents the spatial boundary designated for strict ecological protection, within which critical ecological functions and environmental resources are safeguarded through stringent management measures. Its primary significance lies in maintaining ecological security, protecting biodiversity, conserving vital ecosystem services, and mitigating the environmental impacts of economic and social activities. Thus, comparing our spatial identification results with the ecological protection red line enables us to evaluate the practical alignment of our model outputs with the existing policy frameworks, identify potential gaps in current conservation planning, and inform adjustments to achieve more comprehensive ecological protection (Figure 9).
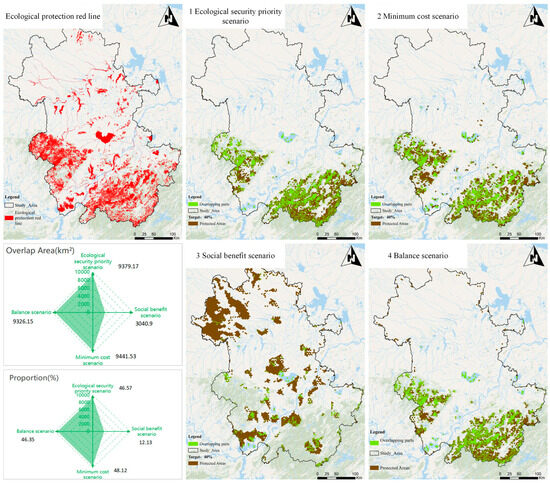
Figure 9.
Analysis of the identification results of multi-scenario protected areas in the study area based on the Marxan model and the spatial overlay analysis of ecological red lines in Anhui Province.
Under the ecological security priority scenario, 9379.17 km2 of protected areas (46.57% of the 40% conservation target) overlap with current redlines, predominantly within statutory reserves like the Dabie Mountain National Nature Reserve and Shengjin Lake International Important Wetland. This spatial alignment validates the redline system’s efficacy in safeguarding ecologically critical zones. However, 53.43% of non-overlapping areas (10,761.46 km2) cluster along the ecologically vulnerable Jianghuai watershed, indicating potential undersights in current redline demarcation regarding landscape connectivity nodes, such as the unprotected wetland transition zone in eastern Chaohu Basin (patch importance index: 0.38), warranting urgent conservation attention.
The minimum cost scenario exhibits the highest redline overlap (48.12%), reflecting latent economic rationality in policy implementation: 94.3% of redline areas demonstrate a significantly lower Human Footprint Index (HFI) than urbanized zones, aligning with model-identified low-cost conservation targets. Notably, 12.6% of overlapping areas (1189.33 km2) within redlines coincide with intensive human activity zones like the Anqing riverside economic belt, exposing the tensions between spatial regulatory rigidity and developmental pressures.
The balanced scenario’s 46.35% overlap (9326.15 km2) demonstrates multi-objective optimization’s capacity to reconcile ecological and socioeconomic needs: 15.2% of newly identified non-overlapping areas (10,794.62 km2) are concentrated in the Yinghe–Xifeihe agricultural–ecological complex of northern Anhui, where the high social importance of ecosystem services contrasts with a mere 8.3% redline coverage, underscoring traditional conservation systems’ neglect of multifunctional landscapes. The model outputs for this scenario revealed spatial overlap both with critical ecological zones (though not as extensive as the ecological security scenario) and with key service areas for people (though with lower intensity than the social benefit scenario). For instance, some mid-watershed regions in the results had simultaneously high biodiversity importance and high value for water supply to nearby communities—these were selected under the balanced scenario whereas they might be partially overlooked in single-priority scenarios. The strategy for a balanced scenario is to apply integrated land use measures in the multi-functional areas identified by the model. In practice, this could mean enforcing ecological protection status in portions of a landscape while also allowing sustainable use or agro-ecological practices that benefit local livelihoods in the surrounding matrix. By doing so, the strategy directly reflects the multi-scenario model outputs; it addresses the combined patterns of ecosystem service provision and human benefit highlighted in our results. This ensures that neither ecological integrity nor social–economic needs are neglected. In summary, under the balanced scenario, this study’s findings support a coordinated strategy that simultaneously bolsters ecosystem health and sustains community benefits in those areas where the model shows both priorities can co-exist.
The social benefit scenario’s minimal redline congruence (12.13%) carries profound policy implications: 78.4% of its 3040.9 km2 overlapping areas are located in the Dabie Mountain’s impoverished regions, while 87.87% of non-overlapping zones cluster in northern population centers like Fuyang’s croplands (contributing 14.2% provincial grain output) which are excluded from current redlines. This spatial dissonance reveals the systemic disconnection between conservation policies and regional sustainability goals—existing frameworks overly prioritize “wilderness protection” while inadequately addressing urbanizing populations’ demands for food security and flood regulation, potentially exacerbating conservation–development conflicts.
This study confirms that Anhui’s ecological redline system demonstrates scientific validity in protecting core ecological baselines (average 47.01% overlap, encompassing terrestrial/aquatic ecosystems, while terrestrial coverage likely exceeds 80%). However, critical gaps persist in safeguarding multifunctional landscapes and social benefit hotspots. Although some of the priority areas identified by our scenarios partially overlap with internationally recognized protected areas (e.g., UNESCO Biosphere Reserves) and nationally designated ecological protection areas in China, there remain critical gaps in the existing conservation frameworks. Our spatial analyses revealed significant ecological vulnerabilities, habitat fragmentation, and ecosystem service degradation occurring in the regions adjacent to or between currently protected areas, especially along ecological corridors and transition zones. Expanding conservation areas into these identified gap regions is crucial, as it would substantially enhance ecological connectivity, mitigate edge effects, and improve the resilience and stability of ecosystems against environmental disturbances such as climate change and human encroachment. Thus, the ecological necessity and added value of expanding conservation areas lie precisely in bridging these existing gaps, fostering more coherent landscape-level ecological integrity, and ensuring sustained ecosystem service delivery beyond the boundaries of current protected designations. We propose integrating Marxan’s multi-scenario planning into redline dynamic adjustments through differentiated conservation targets (e.g., 30% ecological core + 10% social priority zones) to synergistically enhance ecological integrity and human well-being.
4.2. Sustainable Development Strategies for Different Types of Ecological Reserves
This study proposes adaptive sustainable development strategies that align with the differentiated spatial characteristics and policy objectives of four conservation scenarios, aiming to harmonize ecological preservation with socioeconomic demands and transform protected area planning from static regulation to dynamic synergy.
Under the ecological security priority scenario, this study’s results showed that the proposed conservation areas strongly coincide with existing ecological protection areas (formerly ecological red line zones) and high-value ecosystems. For example, many priority zones under this scenario overlapped with biodiversity-rich forests and critical headwater regions identified in the spatial analysis. This pattern indicates that focusing on these areas would reinforce protection where ecosystem services are most abundant and currently under threat. The recommended strategy is to strengthen and expand protections in these overlapping high-value zones, such as by establishing new reserves or ecological corridors that connect to current ecological protection areas. By doing so, the strategy directly addresses the spatial overlap patterns observed in the results, safeguarding regions that the model found to be both environmentally critical and already partly protected, and helps halt further ecosystem service degradation in these core ecological zones.
In the social benefit scenario, the model prioritized the areas that maximize ecosystem services for human well-being, revealing a clear urban–rural ecological gradient in the results. Notably, conservation and restoration hotspots were identified around densely populated valleys and peri-urban fringes where services like flood regulation, air quality, and recreation benefit large communities. The study found that these areas are experiencing ecosystem service stress, especially at the rural–urban interface where rapid development has degraded green space. Targeted sustainable development strategies are needed along this gradient. For instance, implementing urban green belts, restoring wetlands upstream of cities, and promoting eco-friendly farming in surrounding rural areas directly respond to the degradation trends identified. By improving ecosystem services in the zones flagged by the mode—such as buffering cities from floods or enhancing pollination in agricultural belts—this strategy explicitly ties to this study’s findings. It addresses service shortfalls in both urban and rural areas, ensuring that conservation efforts deliver tangible social benefits where they are needed most according to the scenario output.
The minimum cost conservation scenario was characterized by selecting areas that achieve ecosystem goals with the least economic and social cost. The study’s multi-scenario analysis indicated that this approach concentrated on degradation zones that are cheaper to restore, for example, already degraded lands, low-productivity farmlands, or sparsely populated scrublands. These areas showed significant ecosystem service deficits in the results (such as soil erosion or poor water retention), yet they offer high potential gains if restored, all while minimizing conflicts with intensive land uses. The recommended strategy thus focuses on leveraging these low opportunity cost areas for large-scale restoration and protection. Specifically, efforts like reforestation or grassland rehabilitation should target the identified degraded slopes and deforested patches highlighted by the model. This direct coupling of strategy to this study’s findings means that we invest in places where ecological uplift is high relative to cost. By aligning with the ecosystem service degradation patterns uncovered (e.g., severe soil and water service decline in certain zones), the strategy addresses environmental problems head-on while keeping socioeconomic costs minimal—exactly as the minimum cost scenario envisages.
The balanced scenario integrated ecological, social, and economic objectives, and this study’s results showed it covers a mix of areas from the other three scenarios in moderate proportions. The model outputs for this scenario revealed spatial overlap both with critical ecological zones (though not as extensive as the ecological security scenario) and with key service areas for people (though with lower intensity than the social benefit scenario). For instance, some mid-watershed regions in the results had simultaneously high biodiversity importance and high value for water supply to nearby communities—these were selected under the balanced scenario whereas they might be partially overlooked in single-priority scenarios. The strategy for a balanced scenario is to apply integrated land use measures in the multi-functional areas identified by the model. In practice, this could mean enforcing ecological protection status in portions of a landscape while also allowing sustainable use or agro-ecological practices that benefit local livelihoods in the surrounding matrix. By doing so, the strategy directly reflects the multi-scenario model outputs: it addresses the combined patterns of ecosystem service provision and human benefit highlighted in our results. This ensures that neither ecological integrity nor social–economic needs are neglected. In summary, under the balanced scenario, this study’s findings support a coordinated strategy that simultaneously bolsters ecosystem health and sustains community benefits in those areas where the model shows both priorities can co-exist.
Considering that ecological protection areas typically impose strict regulations, the potential conflicts with nearby residents and urban development pressures must be carefully evaluated. Our analysis explicitly addressed the relationship between urbanization and ecosystem service degradation, highlighting that rapid urban expansion—particularly in metropolitan areas such as Hefei—has caused habitat fragmentation and biodiversity loss in peri-urban and transitional zones. Additionally, infrastructure development, including highways and railways, was found to further exacerbate ecosystem fragmentation, restricting wildlife movement, and impairing ecological connectivity, as revealed by spatial analyses conducted in this study. Thus, integrating urbanization and infrastructure evaluations into conservation planning is critical. We propose future conservation measures to include the establishment of buffer zones around protected areas, eco-corridor creation to mitigate fragmentation, and the promotion of eco-friendly infrastructure designs (such as wildlife crossings or green bridges). This integrated approach can effectively balance conservation objectives with urban and infrastructure development needs, reducing conflicts and ensuring both ecological and socioeconomic sustainability.
4.3. Shortcomings and Prospects
This study investigates the spatial optimization pathways for ecological protected areas under multi-objective constraints using systematic conservation planning tools, yet certain limitations warrant further exploration in future research. Theoretically, while integrating multidimensional goals such as ecological security, social benefits, and economic costs, the characterization of nonlinear interaction mechanisms among ecosystem services remains incomplete. Current models assume spatiotemporally static trade-off and synergy relationships between services, failing to adequately reflect dynamic feedback processes under climate change and policy interventions, which may undermine the long-term adaptability of conservation planning. Methodologically, the Marxan model quantifies spatial connectivity through simplified metrics like boundary length cost, which struggles to capture the true efficiency of ecological flow transmission within complex landscape patterns. Additionally, the homogenized treatment of planning units at a 10 km2 scale may obscure the influence of microhabitat heterogeneity on conservation priorities, potentially leading to localized protection gaps or redundancies. Practically, while proposing differentiated conservation strategies, this study lacks an in-depth analysis of stakeholder dynamics—such as local government decision making preferences and community participation willingness—and their impacts on implementation, which could limit the practical translation of planning outcomes into policy effectiveness.
Although ecosystem services clearly provide significant economic and social values—such as provisioning resources, regulating environmental processes, and supporting human livelihoods—it is equally critical to recognize the underlying importance of species-level biodiversity. Biodiversity at the species level supports ecosystem resilience and functionality, directly affecting the stability and long-term sustainability of ecosystem services. Specifically, diverse species assemblages can enhance ecosystem productivity, nutrient cycling efficiency, and resilience to environmental disturbances. Hence, integrating species-level biodiversity considerations into ecosystem service evaluations and conservation planning, as emphasized by the recent ecological and environmental economics literature, is essential for achieving comprehensive and sustainable management outcomes [5,6,8]. Future studies and conservation strategies should, therefore, explicitly address biodiversity conservation alongside ecosystem service protection, to ensure a balanced approach that maintains both ecological integrity and service delivery.
While our study utilized the Marxan model due to its robustness and capability to handle multi-objective spatial optimization problems, alternative methodologies exist for identifying and interpreting conservation target areas. For instance, traditional ecosystem service hotspot analyses (such as the Getis-Ord Gi* method) primarily focus on identifying high service intensity clusters but often fail to integrate conservation costs and multiple stakeholder preferences. Another commonly used approach, the Zonation model, systematically ranks landscape units based on biodiversity value but can sometimes lack explicit considerations of economic and social constraints. Compared with these approaches, Marxan offers distinct advantages: it integrates ecological, economic, and social criteria simultaneously within its optimization framework, enabling explicit trade-off analyses. Moreover, Marxan’s iterative and adaptive spatial optimization algorithm can efficiently balance conservation objectives with cost effectiveness, providing practical conservation solutions readily translatable into policy making. Thus, the originality and strength of the Marxan model lie in its ability to comprehensively integrate multiple conservation targets, stakeholder demands, and cost constraints, a flexibility that alternative methods typically lack [28].
5. Conclusions
This study elucidates the spatiotemporal differentiation mechanisms of ecosystem services, revealing that natural geographic patterns and human activities jointly shape a “mountainous synergy–plain trade-off” service supply model. The study found the following:
(1) In the southern Anhui mountainous regions, forest ecosystems support high service provision through the multifunctional coupling of carbon sequestration, water conservation, and soil retention. Conversely, intensive agriculture and peri-urban expansion in the northern Anhui plain drive habitat fragmentation and ecosystem service degradation.
(2) Biodiversity maintenance (BM) exhibits urban–rural gradient degradation, where urban sprawl induces habitat fragmentation in peri-urban zones, while the Grain for Green Program promotes ecological restoration in mountainous areas. Carbon fixation (CF) demonstrates long-term stability in southern Anhui (98.307% of areas show no significant change), though localized carbon sink losses occur near urbanized areas. Crop production (CP) displays spatial polarization: agricultural intensification enhances yields in the Huaibei Plain, while cropland conversion near cities degrades services. Soil retention (SR) and water yield (WY) are topography-dominated, with vegetation recovery suppressing erosion in southern Anhui’s steep slopes, whereas agricultural activities exacerbate soil water losses in the northern plains. Net primary productivity (NPP) shows widespread improvement (88.09% of regions), and its strong spatial coupling with BM and SR confirms vegetation restoration’s synergistic benefits for multifunctional ecosystems. These findings highlight how natural geographic constraints and human activity jointly shape ecosystem service patterns, providing scientific foundations for zoned management.
(3) Multi-scenario protected area configurations reveal distinct priorities: The ecological security priority scenario anchors protection in the Dabie–southern Anhui ecological barriers (46.57% overlap rate) but overlooks social benefits in the northern agricultural zones. The social benefit scenario prioritizes food security in densely populated areas (87.87% non-overlapping zones), exposing the inadequate coverage of “human well-being hotspots” in current systems. The balanced scenario achieves multi-objective Pareto improvements through corridor compensation and flexible zoning mechanisms under cost effectiveness constraints.
Author Contributions
Conceptualization, L.Z. and X.G.; methodology, X.G.; software, X.Z. (Xinran Zhang); validation, X.G. and X.Z. (Xinran Zhang); formal analysis, X.Z. (Xinmu Zhang); investigation, X.G.; resources, X.Z. (Xinran Zhang); data curation, L.Z.; writing—original draft preparation, L.Z.; writing—review and editing, X.G.; visualization, L.Z.; supervision, X.Z. (Xinmu Zhang); project administration, K.G. and X.G.; funding acquisition, X.G. All authors have read and agreed to the published version of the manuscript.
Funding
Supported by Protection and Development Strategies for the Cultural Landscape of Traditional Villages in Huizhou Based on Complex Adaptive Systems (Project No.: ZJTRSKT2024006); and Research on the Optimization of the Territorial Spatial Pattern in Northern Anhui Based on Land Use Change (HYB20230208).
Data Availability Statement
The data presented in this study are available on request from the first author.
Conflicts of Interest
The authors declare no conflicts of interest.
References
- Bennett, E.M.; Peterson, G.D.; Gordon, L.J. Understanding relationships among multiple ecosystem services. Ecol. Lett. 2009, 12, 1394–1404. [Google Scholar] [CrossRef] [PubMed]
- Cai, W.; Wu, T.; Jiang, W.; Peng, W.; Cai, Y. Integrating Ecosystem Services Supply-Demand and Spatial Relationships for Intercity Cooperation: A Case Study of the Yangtze River Delta. Sustainability 2020, 12, 4131. [Google Scholar] [CrossRef]
- Yu, H.; Jiang, J.; Gu, X.; Cao, C.; Shen, C. Using dynamic Bayesian belief networks to infer the effects of climate change and human activities on changes in regional ecosystem services. Ecol. Indic. 2025, 170, 113023. [Google Scholar] [CrossRef]
- Bongaarts, J. IPBES, 2019. Summary for policymakers of the global assessment report on biodiversity and ecosystem services of the Intergovernmental Science㏄olicy Platform on Biodiversity and Ecosystem Services. Popul. Dev. Rev. 2019, 45, 680–681. [Google Scholar] [CrossRef]
- Hudson, L.N.; Newbold, T.; Contu, S.; Hill, S.L.; Lysenko, I.; De Palma, A.; Phillips, H.R.; Alhusseini, T.I.; Bedford, F.E.; Bennett, D.J.; et al. The database of the PREDICTS (Projecting Responses of Ecological Diversity In Changing Terrestrial Systems) project. Ecol. Evol. 2017, 7, 145–188. [Google Scholar] [CrossRef]
- Goulet, C.; de Garine-Wichatitsky, M.; Chardonnet, P.; de Klerk, L.M.; Kock, R.; Muset, S.; Suu-Ire, R.; Caron, A. An operational framework for wildlife health in the One Health approach. One Health 2024, 19, 100922. [Google Scholar] [CrossRef]
- Lovell, S.T.; Taylor, J.R. Supplying urban ecosystem services through multifunctional green infrastructure in the United States. Landsc. Ecol. 2013, 28, 1447–1463. [Google Scholar] [CrossRef]
- Yu, H.; Xiao, H.; Gu, X. Integrating species distribution and piecewise linear regression model to identify functional connectivity thresholds to delimit urban ecological corridors. Comput. Environ. Urban Syst. 2024, 113, 102177. [Google Scholar] [CrossRef]
- Wang, Y.; Gu, X.; Yu, H. Spatiotemporal variation in the Yangtze River Delta Urban agglomeration from 1980 to 2020 and future trends in ecosystem services. Land 2023, 12, 929. [Google Scholar] [CrossRef]
- Wang, C.; Li, W.; Sun, M.; Wang, Y.; Wang, S. Exploring the formulation of ecological management policies by quantifying interregional primary ecosystem service flows in Yangtze River Delta region, China. J. Environ. Manag. 2021, 284, 112042. [Google Scholar] [CrossRef]
- Yu, H.R.; Gu, X.C.; Liu, G.H.; Fan, X.; Zhao, Q.; Zhang, Q. Construction of Regional Ecological Security Patterns Based on Multi-Criteria Decision Making and Circuit Theory. Remote Sens. 2022, 14, 527. [Google Scholar] [CrossRef]
- Domisch, S.; Kakouei, K.; Martínez-López, J.; Bagstad, K.J.; Magrach, A.; Balbi, S.; Villa, F.; Funk, A.; Hein, T.; Borgwardt, F.; et al. Social equity shapes zone-selection: Balancing aquatic biodiversity conservation and ecosystem services delivery in the transboundary Danube River Basin. Sci. Total Environ. 2019, 656, 797–807. [Google Scholar] [CrossRef] [PubMed]
- Watts, M.E.; Ball, I.R.; Stewart, R.S.; Klein, C.J.; Wilson, K.; Steinback, C.; Lourival, R.; Kircher, L.; Possingham, H.P. Marxan with Zones: Software for optimal conservation based land-and sea-use zoning. Environ. Model. Softw. 2009, 24, 1513–1521. [Google Scholar] [CrossRef]
- Esfandeh, S.; Kaboli, M.; Eslami-Andargoli, L. A Chronological review on application of MARXAN tool for systematic conservation planning in landscape. Int. J. Eng. Appl. Sci. 2015, 2, 6–17. [Google Scholar]
- Zhang, L.; Li, J. Identifying priority areas for biodiversity conservation based on Marxan and InVEST model. Landsc. Ecol. 2022, 37, 3043–3058. [Google Scholar] [CrossRef]
- Hui, L.; Wang, H.; Liu, J.; Ye, X.; Han, B.; Xia, Y.; Zhang, L.; Jiao, L. Identifying priority conservation areas based on systematic conservation planning analysis in the Loess Plateau, China. Glob. Ecol. Conserv. 2025, 58, e03495. [Google Scholar] [CrossRef]
- Li, K.; Hou, Y.; Fu, Q.; Randall, M.T.; Andersen, P.S.; Qiu, M.; Skov-Petersen, H. Integrating decision-making preferences into ecosystem service conservation area identification: A case study of water-related ecosystem services in the Dawen River watershed, China. J. Environ. Manag. 2023, 340, 117972. [Google Scholar] [CrossRef]
- Cai, W.; Gibbs, D.; Zhang, L.; Ferrier, G.; Cai, Y. Identifying hotspots and management of critical ecosystem services in rapidly urbanizing Yangtze River Delta Region, China. J. Environ. Manag. 2017, 191, 258–267. [Google Scholar] [CrossRef]
- Liang, H.; Li, W.; Zhang, Q.; Zhu, W.; Chen, D.; Liu, J.; Shu, T. Using unmanned aerial vehicle data to assess the three-dimension green quantity of urban green space: A case study in Shanghai, China. Landsc. Urban Plan. 2017, 164, 81–90. [Google Scholar] [CrossRef]
- Lai, X.; Yu, H.; Liu, G.; Zhang, X.; Feng, Y.; Ji, Y.; Zhao, Q.; Jiang, J.; Gu, X. Construction and Analysis of Ecological Security Patterns in the Southern Anhui Region of China from a Circuit Theory Perspective. Remote Sens. 2023, 15, 1385. [Google Scholar] [CrossRef]
- Li, J.W.; Dong, S.C.; Li, Y.; Wang, Y.S.; Li, Z.H.; Li, F.J. Effects of land use change on ecosystem services in the China-Mongolia-Russia economic corridor. J. Clean. Prod. 2022, 360, 132175. [Google Scholar] [CrossRef]
- Peng, J.; Hu, X.X.; Qiu, S.J.; Hu, Y.N.; Meersmans, J.; Liu, Y.X. Multifunctional landscapes identification and associated development zoning in mountainous area. Sci. Total Environ. 2019, 660, 765–775. [Google Scholar] [CrossRef] [PubMed]
- Huang, H.; Xue, J.; Feng, X.L.; Zhao, J.P.; Sun, H.W.; Hu, Y.; Ma, Y.T. Thriving arid oasis urban agglomerations: Optimizing ecosystem services pattern under future climate change scenarios using dynamic Bayesian network. J. Environ. Manag. 2024, 350, 119612. [Google Scholar] [CrossRef] [PubMed]
- Liu, X.P.; Pei, F.S.; Wen, Y.Y.; Li, X.; Wang, S.J.; Wu, C.J.; Cai, Y.L.; Wu, J.G.; Chen, J.; Feng, K.S.; et al. Global urban expansion offsets climate-driven increases in terrestrial net primary productivity. Nat. Commun. 2019, 10, 5558. [Google Scholar] [CrossRef]
- Blanco, J.; Bellón, B.; Fabricius, C.; de, O.R.F.; Pays, O.; Laurent, F.; Fritz, H.; Renaud, P.C. Interface processes between protected and unprotected areas: A global review and ways forward. Glob. Change Biol. 2020, 26, 1138–1154. [Google Scholar] [CrossRef]
- Bruen, M.; Hallouin, T.; Christie, M.; Matson, R.; Siwicka, E.; Kelly, F.; Bullock, C.; Feeley, H.B.; Hannigan, E.; Kelly-Quinn, M. A Bayesian Modelling Framework for Integration of Ecosystem Services into Freshwater Resources Management. Environ. Manag. 2022, 69, 781–800. [Google Scholar] [CrossRef]
- Kattge, J.; Bönisch, G.; Díaz, S.; Lavorel, S.; Prentice, I.C.; Leadley, P.; Tautenhahn, S.; Werner, G.D.A.; Aakala, T.; Abedi, M.; et al. TRY plant trait database-enhanced coverage and open access. Glob Chang Biol 2020, 26, 119–188. [Google Scholar] [CrossRef]
- Yu, H.; Xiao, H.; Gu, X. Impact of urban environmental matrices on bird diversity: Mediating effects and ecological thresholds. Appl. Geogr. 2025, 174, 103476. [Google Scholar] [CrossRef]
Disclaimer/Publisher’s Note: The statements, opinions and data contained in all publications are solely those of the individual author(s) and contributor(s) and not of MDPI and/or the editor(s). MDPI and/or the editor(s) disclaim responsibility for any injury to people or property resulting from any ideas, methods, instructions or products referred to in the content. |
© 2025 by the authors. Licensee MDPI, Basel, Switzerland. This article is an open access article distributed under the terms and conditions of the Creative Commons Attribution (CC BY) license (https://creativecommons.org/licenses/by/4.0/).