Article

Can the Coordinated Development of Land Urbanization and Population Urbanization Promote Carbon Emission Efficiency? A Multi-Scale Heterogeneity Analysis in China

1
College of Land and Environment, Shenyang Agricultural University, Shenyang 110866, China
2
National Engineering Research Center for Efficient Use of Soil and Fertilizer, Shenyang 110866, China
*
Author to whom correspondence should be addressed.
Land 2025, 14(7), 1317; https://doi.org/10.3390/land14071317
Submission received: 15 May 2025 / Revised: 12 June 2025 / Accepted: 19 June 2025 / Published: 20 June 2025

Abstract

Coordinating development of land urbanization and population urbanization (CDLUPU) to enhance carbon emission efficiency (CEE) is a critical challenge for developing countries experiencing accelerated urbanization. The coupled coordination model and super efficiency SBM are employed to estimate the levels of CDLUPU and CEE across 276 prefecture-level cities from 2010 to 2021. Furthermore, we utilize kernel density estimation and Spatial Durbin Model (SDM) to explore the spatio-temporal distribution characteristics and spatial effects. The results indicate that CDLUPU levels exhibited a sustained upward trend with diminishing regional disparities, whereas CEE displayed a pattern of initial growth followed by decline. Spatial analyses revealed a consistent gradient structure for both CDLUPU and CEE, characterized by radiation decay from southeastern coastal hubs toward interior hinterlands. CDLUPU exerts a significant positive direct impact and spatial spillover effect and indicates that the spillover effects on peripheral regions are substantially stronger than local effects. Regional heterogeneity analysis reveals that CDLUPU negatively affects CEE in eastern China, the Yangtze River Delta (YRD) is more pronounced, but it positively impacts central and western China, as well as Beijing–Tianjin–Hebei (BTH) and Chengdu–Chongqing (CY). Regarding indirect effects, eastern China shows significant positive impact on CEE, and similarly in the YRD. However, central China exhibits a negative effect, whereas BTH shows the opposite trend. Western China and CY show statistically insignificant results. This study offers policy insights for China to coordinate new urbanization strategy and achieve the “dual carbon goal”.

1. Introduction

The greenhouse effect, primarily triggered by excessive carbon dioxide emissions, has become a significant environmental challenge confronting humanity. Cities, as the primary hubs for human socio-economic activities, account for approximately 70% of global carbon emissions [1]. In China, rapid urbanization has been a pivotal driver of economic growth, propelling the country to become the world’s second-largest economy [2]. Meanwhile, this urbanization process has also led to a significant increase in energy consumption, becoming one of the primary contributors to carbon dioxide emissions [3]. According to the International Energy Agency (IEA), China accounted for approximately one-third of the global total in 2018, positioning it as the world’s largest carbon emitter [4]. China, as the largest developing nation, is confronted with the dual challenges of advancing urbanization and carbon reduction goals [2]. How to effectively reduce carbon emissions while ensuring steady economic development has emerged as an urgent mission for China [5].
Data from the Global Carbon Project (GCP) in 2016 shows that China’s carbon dioxide emission per unit of economic output reached 0.65 kg per dollar per year, a figure that is approximately 1.8 times higher than that of the United States and nearly triple that of the European Union [6]. To tackle global climate change, China announced at the 75th session of the United Nations General Assembly that it aims to reach peak carbon emissions before 2030 and carbon neutrality before 2060 (known as “the dual carbon goal”) [7,8]. Furthermore, the 14th Five-Year Plan explicitly outlines a targeted 18% reduction in carbon emissions per unit of GDP. Under this situation, carbon emission efficiency (CEE), as a key indicator for measuring the level of regional sustainable development, is usually defined as the economic output generated per unit of carbon emissions. Its core lies in achieving the maximum economic benefits with the minimum carbon emissions. As China progresses into a new stage of historical development, enhancing carbon emission efficiency (CEE) has emerged as crucial for realizing low-carbon transition goals.
Accelerated urbanization has resulted in significant developmental disparity between land urbanization (LU) and population urbanization (PU). The degree of coordinated development of land urbanization and population urbanization (CDLUPU) exerts a substantial influence on CEE [9,10]. Effectively balancing LU and PU continues to be a significant challenge for urbanization strategy in China. Since the reform and opening-up, China’s urbanization rate has surged from 17.9% in 1978 to 64.72% by 2021 [11]. Nevertheless, the disparity between LU and PU has become increasingly pronounced, with LU either outpacing or lagging PU, resulting in significant resource misallocation and environmental degradation [12,13]. Although urbanization has driven economic growth [14], the extensive development model has led to inefficient urban land use as well as the emergence of “hollow villages” and “ghost cities” [15,16]. This mismatch between rural population migration and urban spatial development exacerbates socio-economic and environmental issues [17], hindering the enhancement of CEE and the efficient progression of urbanization [18,19]. Previous studies on CDLUPU have focused on theoretical implications [20], evolution trends [21], driving mechanisms [22], and its impacts on residents’ living standards [23], regional economic [24] and carbon emissions [25]. Existing research has highlighted the widespread issue of uncoordinated urbanization in China [26]. Additionally, research has demonstrated the significant function of CDLUPU in optimizing the efficiency of resource allocation [23]. However, the effects of CDLUPU on CEE have received limited scholarly attention in the existing literature.
Relevant research on CEE primarily focuses on the definition of concepts, evaluation methods, influencing factors, and analytical approaches. Initially, some scholars defined CEE using a single factor perspective [27,28], such as the ratio of carbon emissions to economic output. However, such approaches ignore the interaction among energy consumption, economic output, and environmental factors. With the advancement of research, Zhou et al. proposed a total factor framework, which includes labor, capital, and other factors [29]. The precise quantification of CEE constitutes a fundamental step toward achieving carbon reduction targets [30]. Currently, there are mainly two measurement methods: Data Envelopment Analysis (DEA) and Stochastic Frontier Analysis (SFA). The SFA method requires the establishment of a specific production function, and this approach may introduce bias and is limited in addressing issues involving multi-index outputs [31]. Charnes et al. first introduced the DEA, which effectively overcomes the aforementioned limitations and has since been widely used in research examining how environmental factors influence energy efficiency [3,32]. Currently, the research primarily investigates the impact of various dimensions on CEE, including economic development level [33], industrial structure [34], technological advancement [35], energy structure [36], and new-type urbanization level [37]. Nevertheless, the connection between urbanization and CEE remains controversial, with studies reporting positive [38], negative [39,40], and nonlinear effects [41,42]. Some scholars have investigated the influencing factors of CEE from the perspectives of Central and Eastern European countries [43], developed countries [44], and developing countries [30], revealing that distinct factors exert varying degrees of influence on the carbon emission efficiency of different countries. Furthermore, urbanization encompasses multiple dimensions including population dynamics, land use, and economic development. However, existing studies have predominantly focused on the analyses of the relationship of LU [45] or PU [46] to CEE, which isolates the integrity and systematic nature of urbanization. Moreover, the majority of previous studies have mainly relied on national and provincial panel data, while investigations into the mechanisms through which urbanization impacts CEE at municipal and urban agglomeration levels remain relatively scarce.
To address these shortcomings, this study evaluates the CDLUPU and CEE for 276 prefecture-level cities by utilizing the coupled coordination model and super-efficiency SBM. Additionally, it explores the spatio-temporal characteristics and influencing mechanisms through spatial panel econometric models. The primary contributions are as follows: Firstly, this study begins by constructing an analytical framework from the CDLUPU perspective to investigate urbanization and CEE, systematically examining their intrinsic relationship while enriching understanding in CEE-related fields. Secondly, the interactive relationship between CDLUPU and CEE is revealed through empirical analysis, answering the question of whether CDLUPU can enhance CEE. Thirdly, this study further reveals significant heterogeneity among eastern, central, and western China, as well as within three major urban agglomerations. This enables more precise characterization of their interaction mechanisms, providing scientific reference for refining the new-type urbanization strategy and formulating carbon emission reduction measures.

2. Theoretical Mechanisms Framework

2.1. Direct Effect

Firstly, CDLUPU optimizes resource allocation efficiency by coordinating LU and PU development, mitigating “human–land separation”. On the one hand, it reduces extensive land expansion and prevents idle land caused by unplanned construction urban space expansion, curbing unnecessary energy expenditure and greenhouse gas outputs. On the other hand, it can mitigate the congestion costs associated with excessive population concentration. If PU progresses too rapidly while LU lags behind, it may lead to over-concentration of the population, generating negative externalities such as traffic congestion and housing shortages, and increasing overall energy consumption. Conversely, if LU advances too quickly and PU falls behind, it is likely to result in “ghost cities”, thereby reducing the utilization efficiency of infrastructure. CDLUPU enhances CEE by balancing the relationship between these two processes, optimizing urban scale, and reducing energy intensity per unit of output [47]. Secondly, CDLUPU promotes industrial transformation by facilitating the flow of production factors between urban and rural areas. Urbanization breaks regional constraints by population migration, promoting the spatial mobility of production factors. Simultaneously, an appropriate alignment between LU and PU can guide the spatial optimization of industrial layouts, fostering specialized division of labor and economies of scale while reducing energy consumption per unit of GDP. This facilitates the efficient allocation of surplus human resources and capital across industries, driving the transformation of the industrial structure toward service-oriented, high-tech, and low-energy-intensive yet high-output sectors. It also reduces reliance on high-energy-consuming and low-output industries, effectively lowering carbon emission intensity. The resultant industrial agglomeration and scale effects further boost regional economic output, thereby enhancing CEE [48]. Thirdly, CDLUPU enhances urban carbon sequestration capacity by optimizing public resource and service allocation. High-quality urbanization strengthens public services provision, improves the ecological environment, and mitigates energy consumption from transportation by optimizing urban transportation networks [49,50]. The coordinated urbanization process enhances the carbon sink capacity of cities and mitigates the urban heat island effect by expanding green space areas and encouraging the development of green buildings, thus contributing to the improvement of the CEE. Nevertheless, excessive population agglomeration and land development intensity may exceed regional ecological carrying capacity. For example, if the population density of a megacity exceeds its optimal scale, leading to traffic congestion, this can inflict dual harm on both the economy and the natural environment. Such outcomes not only negate the environmental benefits achieved through CDLUPU but also impede the enhancement of CEE.

2.2. Indirect Spillover Effect

Tobler’s first law of geography suggests that geographical characteristics and attributes exhibit significant spatial correlations, meaning that regions in closer proximity tend to have stronger economic, social, and environmental linkages [51]. The impact of CDLUPU on CEE extends beyond local boundaries, reaching neighboring regions through spatial spillover effects driven by both siphon effects and diffusion effects [52]. When the CDLUPU level of core cities is relatively high, their robust economic vitality and strong resource aggregation capacity may attract production factors such as labor and capital from surrounding regions, leading to the loss of development resources from peripheral areas. As core cities reach a certain stage of development, rising land costs or stricter environmental regulations may drive some industries and technologies to relocate to surrounding regions, thereby generating a spillover effect of technology, capital, and green governance models. CDLUPU can positively influence the CEE of neighboring areas through the following mechanisms: Cities with high CDLUPU levels possess advantages in green technology research and development, clean energy application, and other areas. Their successful practices can be transferred and disseminated to surrounding cities, creating a technology diffusion effect and infrastructure sharing effect, which in turn enhances the CEE of neighboring areas. For instance, Shanghai has effectively driven local economic growth and promoted the development of the Yangtze River Delta region through technology spillovers and industrial linkages [53].
However, the spatial spillover effect of CDLUPU can be negative, exerting an adverse impact on CEE in the surrounding areas. In pursuit of economic development, less developed regions might passively accommodate the energy-intensive and environmentally harmful industries relocated from developed regions, resulting in the formation of “pollution haven effects”. This results in the spread of local environmental pollution to neighboring cities, generating negative externalities [54,55]. Additionally, the siphon effects of developed cities and provincial capitals may cause the outflow of talent and capital from smaller cities in peripheral regions, weakening their capacity for low-carbon transformation and further exacerbating regional development disparities. For instance, the population outflow from western China presents a challenge to the sustainable urbanization development [56]. Although CDLUPU can facilitate the efficient allocation of production factors and public resources in space, its spatial spillover impact on CEE remains uncertain. In summary, it is necessary to further explore the interaction mechanisms between CDLUPU and CEE to provide differentiated policy recommendations for regional low-carbon urbanization development. The theoretical framework is presented in Figure 1.

3. Methods and Data

3.1. Research Methods

3.1.1. Super Efficiency SBM Model

Traditional methods for measuring CEE often rely on the inverse of the undesired outputs, which may distort their economic significance [57]. To address this limitation, Tone proposed an efficiency measure based on slack variables in 2001 [58]. In 2004, Tone further refined the SBM model by integrating carbon dioxide, sulfur dioxide, and other industrial pollutants commonly generated during production [59,60]. Zhou et al. enhanced the model through further increasing undesirable outputs [29]. This model excludes certain decision-making units (DMUs) and retains valid DMU values equal to or greater than 1 for comparison. Super efficiency SBM is particularly suitable for addressing non-radial relaxation variable problems, especially when the improvement ratio of input-to-output is not constant, as in the evaluation of energy efficiency. In contrast to traditional DEA models, the super efficiency SBM model can effectively account for slack variables and eliminate radial distortions. Based on these advancements, we utilize the super efficiency SBM model to measure the CEE. We assume a production system comprising n DMUs, with each DMU defined by three components: input, desirable output, and undesirable output, which are, respectively, X = [x1, …, xn] ∈   R m × n , Yg = [y1g, …, yng] ∈   R s 1 × n , Yb = [y1b, …, ynb] ∈     R s 2 × n . The formulation is as follows:
ρ = m i n 1 1 m i = 1 m S i ¯ x i o 1 + 1 S 1 + S 2 ( r = 1 S 1 S r g y r 0 g + j = 1 S 2 S r b y r 0 b )
S . t . x ¯ j = 1 , k n x i j λ j , y ¯ g j = 1 , k n y p j g λ j y ¯ b j = 1 , k n y q j b λ j λ j > 0 , x ¯ x k , y ¯ g y k g , y ¯ b y k b
where S = ( S ¯ ,   S g , S b ) denotes slack variables for inputs, desirable outputs and undesirable outputs; ρ is the efficiency value of the DMU; for DMU (x0, yg0, yb0), DMU is considered efficient only when ρ = 1, and slack variables meet the conditions when   S ¯ =   S g = S b = 0. Referring to the prior literature [61,62,63], we select labor, capital, and energy as input indicators. The output indicators include both regional gross domestic product (GDP) and carbon emissions. In accordance with data availability and existing studies, fixed capital stock is used as capital input, labor is indicated by the year-end total number of employees, and energy is captured by energy consumption. Desirable output is denoted by actual GDP, while carbon emissions are considered as undesirable output.

3.1.2. Coupling Coordination Model

The coupled coordination model is employed to analyze the level of coordinated development among entities, reflecting the mutual influence, interdependence, and degree of constraint between elements across two or more systems. We utilize this model to quantify the degree of coordinated development between LU and PU, and to assess the developmental status and comprehensive progress of both systems [64,65]. The formal expression is given by the formal equation:
D = L U × P U L U + P U 2 2 2 × α L U + β P U
where D represents the CDLUPU; D  [0, 1], with values approaching 1 signifying a higher level of coordination development between various systems. LU and PU represent the LU and PU level, respectively. The weight coefficients α and β meet α + β = 1. Given the equal importance of LU and PU, α = β = 0.5.

3.1.3. Estimation of Kernel Density

Kernel density estimation describes the probability distribution of random variables by generating continuous and smooth density curves [66,67]. This method is employed in this study to investigate the dynamic evolution of CDLUPU and CEE across 276 cities from 2010 to 2021; we employ Gaussian kernel density estimation. The probability density function is
f ( X ) = 1 n h i = 1 n K ( X i X ¯ h )
where   X i denotes observed values; X ¯ is the average value, n represents the number of samples, h is the bandwidth parameter, and K(·) is the Gaussian kernel function.

3.1.4. Spatial Auto-Correlation Analysis

Spatial auto-correlation is employed to examine the spatial dependence and heterogeneity among variables, as well as to identify whether there are patterns of agglomeration and the specific agglomeration patterns across the entire study area. This study integrates Global Moran’s I (I) to explore the spatial interactions among cities. The mathematical formulation is presented below:
I = n i = 1 n j = 1 n w i j ( D i D ¯ ) ( D j D ¯ ) ( i = 1 n j = 1 n w i j ) i = 1 n ( D i D ¯ ) 2
where n represents observation units, Di and Dj represent observed values of cities i and j, respectively, while D ¯ is the average value, wij is the weight matrix. The value range of I is from −1 to 1, where values approaching 1 indicate a strong positive spatial correlation; conversely, values nearing −1 reflect a pronounced negative spatial correlation. If I is 0, that is, there is an irregular random distribution in space.

3.1.5. The Spatial Panel Econometric Model

Spatial Durbin Model (SDM) is capable of accounting for both the Spatial Error Model (SEM) and the Spatial Lag Model (SLM) effects simultaneously. It not only accurately quantifies the direct impact of CDLUPU on CEE but also comprehensively evaluates the indirect and total effects generated through the spatial spillover mechanism, revealing the spatial spillover effects across geographical regions and exhibiting greater explanatory power compared with other regression models. Thus, this research employs the SDM, which is set as follows:
C E E i t = α i + ρ j = 1 n W i j C E E j t + β X i t + φ j = 1 n W i j X j t + μ i + δ t + U i t
U i t = λ W μ i + ε i
where C E E i t represents CEE; while Xit is explanatory variable; Wij signifies the weight matrix; ρ is the coefficient of spatial auto-coefficient; β is independent variable coefficient; φ is the spatial spillover effects; α i is the constant term; μ i and δ t are the individual-fixed and year-fixed, respectively; U i t is the random error term.

3.2. Variable Selection and Processing

3.2.1. Core Explanatory Variable

CDLUPU is the core explanatory variable in this study. The essence of LU lies in the expansion of urban built-up areas and the conversion of large-scale agricultural or unused land into construction land, which serves as a process that promotes the intensification of urban space and optimizes land structure. PU, on the other hand, entails not only the migration of people to cities but also the transformation of economic structures from agriculture to the secondary and tertiary sectors. This shift results in changes in people’s production methods, moving them away from agriculture toward industrial and service-oriented activities, and leading to corresponding improvements in living standards and quality of life. With reference to the relevant literature [68], LU comprehensive evaluated the level of LU by considering land scale, land input, and land output. PU is assessed based on three dimensions: population size, living standard, and industrial structure. Based on the aforementioned analysis, an objective index system for LU and PU is constructed (Table 1). To determine indicator weights, we employ the entropy method, which effectively avoids errors caused by subjective bias, making the results more objective. Firstly, all indicators are normalized using the following specific formula:
X i j = X i j m i n X i j m a x X i j m i n X i j
X i j = m a x X i j X i j m a x X i j m i n X i j
where Xij and X′ij respectively represent the original data and the data after standardization. After standardization of all indicators, the weight of different indicators were determined using the following method:
e j = 1 l n ( n ) t = 1 T ( X i j i = 1 n X i j l n X i j i = 1 n X i j ) , 0 e j 1
w j = 1 e j j = 1 m ( 1 e j )
S i = j = 1 m w j X i j
where n is the number of samples; m represents the number of indicators; and w j is the final weight. Then, the normalized indicators are multiplied by their corresponding weights summed to obtain the final data.

3.2.2. Control Variables

In order to minimize bias due to omitted variables, this study selected six control variables from various dimensions [43,69]. The existing literature indicates that the enhancement of regional economic levels (PGDP) is linked to civilizational advancement and heightened environmental awareness, both of which contribute to lower carbon emissions. Government intervention (GOV) is essential for addressing energy consumption and environmental challenges, playing a vital role in implementation of environmental regulations and the enforcement of emission standards. Industrial structure optimization (IND) is an effective strategy to enhance CEE. Technological innovation (TI) can significantly enhance energy utilization efficiency and promote the low-carbon transition of traditional industries, thereby improving CEE. Population size (POP) significantly influences CEE. The rise in population density escalates energy demand and carbon emissions. Opening up to the outside world (OPN) contributes to advanced technologies and increased energy consumption, which has a dual impact on the improvement of CEE. All variables underwent multicollinearity diagnostics, with their VIF values being less than 5 (VIF = 1.88).

3.3. Data Source and Processing

Considering data limitations, in order to avoid interfering with the results, this study excluded cities with severely insufficient data throughout the research period. Eventually, the panel data of this study consisted of 276 cities from 2010 to 2021, covering the majority of regions in China (omitting Tibet, Hong Kong, Macao, and Taiwan) and representing 82% of all prefecture-level cities nationwide. This ensures a representative sample. The data primarily came from the China City Statistical Yearbook, the China City Construction Statistical Yearbook, and statistical bulletins of provinces and cities. The missing data were imputed by using the linear interpolation method. Furthermore, this study applied logarithmic transformation to each variable in the empirical analysis, mitigating the volatility of the data and addressing the potential heteroscedasticity.

4. Results

This study establishes a dual-scale “overall trend-local differentiation” analytical framework to systematically examine the spatio-temporal evolution and multi-scale driving mechanisms of CDLUPU and CEE across China and its major subregions.

4.1. Temporal and Spatial Characteristics of CDLUPU and CEE

4.1.1. Temporal Characteristics of CDLUPU and CEE

As depicted in Figure 2, China’s CDLUPU exhibited a continuous upward trend, increasing from 0.225 in 2010 to 0.297 in 2021, with an overall growth of 32.48%. Specifically, eastern, central, and western China (Eastern China: Tianjin, Beijing, Hebei, Liaoning, Shanghai, Jiangsu, Zhejiang, Fujian, Shandong, Guangdong, Hainan; Central China: Shanxi, Heilongjiang, Jilin, Anhui, Jiangxi, Henan, Hubei, Hunan; Western China: Inner Mongolia, Guangxi, Yunnan, Guizhou, Sichuan, Chongqing, Shaanxi, Gansu, Qinghai, Ningxia, Xinjiang) all showed sustained growth, with growth rates of 35.82%, 32.16%, and 27.61%, respectively. Eastern China had the highest average CDLUPU value at 0.300, surpassing the national average of 0.261. In comparison, central and western China recorded values of 0.239 and 0.237, respectively. This phenomenon can be ascribed to the fact that eastern China boasts a developed economy, strong employment absorption capacity, and a high level of alignment between population and land resources. Conversely, central and western China, which are recipients of industrial transfers from eastern China, face fragile ecosystems that constrain land expansion. Additionally, population outflow in these areas results in a relatively low CDLUPU.
In Figure 3, the average value of China’s CEE is 0.345, indicating an overall low level with substantial potential room for improvement. During the period from 2010 to 2021, CEE exhibited an overall downward trend with fluctuations. Specifically, CEE initially increased, reaching a peak of 0.383 in 2012, and then decreased to its lowest value of 0.315 in 2017, before rebounding to 0.330 by 2021. This could be attributed to the elimination of backward production capacity at the beginning of the 12th Five-Year Plan in 2012, which was intended to enhance energy utilization efficiency in the short term. The low point in 2017 may have resulted from some regions achieving their GDP targets and subsequently adopting an extensive development model. Over this period, it is remarkable that only eastern China observed an increase in CEE, while the other two regions experienced declines. Starting from 2017, the average CEE in eastern and central China demonstrated a fluctuating upward tendency, while western China reached a turning point in 2020, after which its CEE began to show an upward trend. The average CEE level in eastern China consistently exceeds both the national average and that of other regions, central China ranks second, followed by western China. This phenomenon can be ascribed to eastern China’s leading role in green technologies and the increasing proportion of the tertiary sector. In contrast, central and western China have a relatively higher proportion of heavy and high-carbon industries, resulting in a comparatively lower level of CEE.

4.1.2. Spatial Characteristics of CDLUPU and CEE

As depicted in Figure 4, China’s CDLUPU is characterized by a pronounced southeast–northwest gradient, with higher values predominantly concentrated in coastal areas and lower levels predominantly observed in inland regions. From 2010 to 2021, regions with higher CDLUPU values were mainly concentrated in eastern and southeastern coastal cities, such as Shenzhen, Guangzhou, and Shanghai. Over time, the number of high-value regions demonstrated a consistent upward tendency. In contrast, regions with lower CDLUPU values were primarily clustered in central and western areas, including cities like Nanyang, Liupanshui, and Yaan. The spatial pattern of CEE closely corresponds to that of CDLUPU, displaying a gradual decrease from coastal to inland regions. Specifically, cities in eastern and coastal areas of China generally presented higher CEE levels, such as Guangzhou, Shenzhen, and Jinan, whereas central and western China exhibited relatively lower CEE levels, for example, Wuhan and Zunyi. Significantly, the spatial scope of low-value regions expanded gradually. This phenomenon can be ascribed to the intrinsic vulnerability of the ecological environment in western China, where resource exploitation has exacerbated land degradation and created a vicious cycle. Conversely, the eastern coastal areas, serving as the forefront of reform and opening up, boast a robust economic foundation. Port cities with these regions hold strategic advantages for conducting international trade and exhibit a pronounced industrial agglomeration effect. Consequently, a spatial pattern characterized by “high levels in the southeast and low levels in the northwest” has emerged.

4.2. Analysis of Spatial Differences

As illustrated in Figure 5, the kernel density curves of CDLUPU predominantly exhibit peak values concentrated within the range of 0.2 and 0.3. This indicates a generally low level of CDLUPU nationwide. As the curve shifts to the right, the peak values gradually decline, and the number of peaks progressively diminishes. This suggests that CDLUPU exhibits an upward trend in China, signifying a weakening of multi-polar differentiation and a gradual reduction in regional disparities. The kernel density curves for eastern, central, and western China all demonstrate a tendency to shift to the right, while the differences among cities within each region remain relatively stable. Notably, western China displays wider peak distributions, reflecting more pronounced multi-polar disparities compared to eastern and central areas. Regarding CEE, the peak values are concentrated between 0.2 and 0.4, indicating that this range represents the dominant level of CEE in most cities. The peak value initially shifts to the left and subsequently moves to the right, with the trailing phenomenon being pronounced. This indicates that CEE has undergone a process of initial decline followed by recovery, presenting a phenomenon of multistage differentiation. Across eastern China, CEE demonstrated a gradual upward trajectory. However, certain cities displayed relatively higher CEE levels, contributing to an expansion of regional disparities. Notably, in central and western China, the values of CEE have a wider range and greater volatility, suggesting significant inter-regional variability characterized by heterogeneous spatial distribution patterns.

4.3. Empirical Analysis

4.3.1. Spatial Correlation Analysis

This study conducted spatial auto-correlation tests for CDLUPU and CEE employing four spatial weight matrices: the adjacency weight matrix (W I), geographical distance weight matrix (W II), economic distance weight matrix (W III), and economic geography-nested weight matrix (W IV). The Global Moran’s I statistics indicate that CDLUPU and CEE exhibit significant positive spatial correlations at the 1% level across all matrices, thereby confirming the existence of significant spatial dependence. The results are presented in Table A1 and Table A2 of Appendix A.

4.3.2. Baseline Regression Results

The influence mechanism of CDLUPU on CEE was investigated using spatial panel econometric models. Firstly, the optimal model was selected through a series of tests, and the results are presented in Table A3 of Appendix A. Four spatial weight matrices passed both the LM and R-LM test (p < 0.01). The results of Hausman test showed statistical significance (p < 0.01), indicating a preference for fixed effects in the model. Additionally, the results of the LR and Wald test confirmed that both individual and time fixed effects must be incorporated (p < 0.01), and the model would not degenerate into SLM or SEM (p < 0.01). Finally, the fixed effects dual-fixed Spatial Durbin Model (SDM) with the geographical distance weight matrix was selected for analysis. As presented in Table 2, the coefficient of CDLUPU (lnCDLUPU) exhibits a significant coefficient estimate of 0.126 at the 5% significance level, suggesting that CDLUPU has a significant positive impact on CEE. A 1% increase in CDLUPU could cause a 0.126% improvement in CEE. Furthermore, the spatial lag term Wx lnCDLUPU demonstrates a statistically significantly positive result at the 1% level, with a coefficient of 1.910, demonstrating a notable positive spatial spillover effect. Specifically, a 1% increase in CDLUPU will result in a 1.910% CEE growth in adjacent regions.

4.3.3. Decomposition of Spatial Spillover Effects

The presence of a spatial lag term in the dual fixed effects SDM shows that the spatial regression coefficients are only effective in terms of direction and significance. Therefore, this study employs the partial differential decomposition approach proposed by Lesage et al. to decompose the SDM regression [70]. As presented in Table 3, the direct effect of CDLUPU is significantly positive at the 5% level, with a coefficient of 0.138. It shows that a 1% increase in CDLUPU within the local region would raise CEE by 0.138%. Additionally, the indirect effect is statistically significant and positive at the 1% level, with a coefficient of 3.483, suggesting that a 1% increase in CDLUPU within the local region would result in a 3.483% increase in CEE for neighboring regions. This reflects that inter-regional collaborative development can significantly enhance neighboring regions’ CEE, primarily through enhanced resource allocation efficiency and interjurisdictional technology diffusion effects. The direct and indirect effects align with the theoretical framework proposed in this study.
Regarding the control variables, the PGDP exhibits different spatial effects on CEE. The direct effect is significantly positive at the 5% level, likely resulting from more developed regions possessing a greater capacity for investing in clean technology R&D investment and environmental regulation enforcement. However, the indirect effect is negative at the 1% level, indicating a negative spillover effect on neighboring regions. One possible reason may be the “siphon effect” in regions with a higher economic level, where production factors are concentrated in these areas, hindering industrial upgrading and energy efficiency improvements in adjacent cities. As for GOV, the direct effect coefficient is negative at the 1% significance level, which may stem from excessive administrative intervention distorting market mechanisms and suppressing green innovation. Conversely, the indirect effect is positive, likely propelled by environmental governance cooperation and cross-regional infrastructure development. The IND shows significantly negative direct and indirect effects, with coefficients of −0.226 and −1.729, respectively. These results suggest that elevated industrial activities lead to an increase in energy consumption and the transfer of carbon emissions to adjacent regions via pollution transfer mechanisms.

4.4. Endogeneity Test

Despite controlling for variables influencing CEE as comprehensively as possible in this study, endogeneity issues stemming from omitted variables cannot be entirely ruled out. Considering these factors and referring to relevant research, we introduced a one-period lag for all control variables to mitigate potential endogeneity concerns [71,72]. As shown in Table 4, the results reveal that the positive effect of CDLUPU on CEE remains significant, with its regression coefficient aligning with the benchmark regression results. This finding further substantiates the robustness of our research conclusion.

4.5. Robustness Test

This study mainly examines the robustness from the following three aspects: change the measure of the explained variables, shorten the sample period, and exclude municipalities [72]. Firstly, to mitigate potential biases from the estimation method, the explained variable was remeasured under the assumption of variable returns to scale (VRS), and the measurement results of this approach exhibit significant fluctuations. As shown in Table 5 (1), the regression results remain notably positive after altering the measurement method of the explained variable. Secondly, considering the influence of the novel coronavirus epidemic on urban activities, the sample period was shortened to 2013–2019. As indicated in Table 5 (2), the regression coefficient of CDLUPU remains significantly positive, verifying the credibility of the estimation results. Finally, taking into account the substantial disparities among cities, especially in regions characterized by higher economic and urbanization levels, which may potentially impact the empirical findings, this study excluded four municipalities. The results presented in Table 5 (3) demonstrate that CDLUPU continues to statistically enhance CEE, further validating the robustness of the previous conclusion.

4.6. Heterogeneity Analysis

4.6.1. Heterogeneity Analysis of Eastern, Central, and Western China

Given Chinese geographical expanse, there exist pronounced regional disparities in resource endowments, urbanization levels, and economic foundations. Following the regional classification from the National Bureau of Statistics and prior studies [73,74], this paper examines the spatial effects across eastern, central, and western China, with results presented in Figure 6. The spatial econometric analysis reveals significant regional heterogeneity by which CDLUPU affects CEE. The direct effect coefficient of CDLUPU is −0.228 in eastern China at the 5% significance level, while the indirect effect coefficient is 6.655, reaching significance at the 1% level. In central China, CDLUPU exhibits a direct effect coefficient of 0.206 and an indirect effect coefficient of −0.785 at the 10% significance level, For western China, CDLUPU demonstrates a significant positive direct effect at the 1% level, with a coefficient of 0.555, but no significant indirect effect.
The disparities in direct and indirect effects across regions are closely associated with the interplay of socioeconomic and natural factors, including regional economic development levels, urbanization stages, and policy orientations. In eastern China, the most economically developed region, the high-intensity economic activities driven by population agglomeration and land development have resulted in a continuously growing energy demand that exceeds urban ecological carrying capacity, offsetting the environmental benefits derived from their coordination [75]. Additionally, rapid urbanization has induced short-term mismatches between land expansion and population concentration, exacerbating marginal declines in energy efficiency, thus impeding the enhancement of local CEE [46]. However, as for the indirect effects, the eastern region possesses significant economic agglomeration advantages to disseminate technological innovations and green industry models to surrounding areas through industrial linkages and technology diffusion, effectively promoting the enhancement of CEE in adjacent regions. Although the direct effect is negative, its magnitude (−0.228) is far smaller than the positive indirect effect (6.655). Overall, the total effect of CDLUPU in the eastern China remains positive and significant, suggesting that its local inhibitory impact on CEE is still in an initial stage with slight intensity, while maintaining a net positive contribution to regional CEE enhancement.
In central China, currently undergoing a phase of industrialization and rapid urbanization [76], land-population allocation efficiency is being actively enhanced through industry–city integration policies. Benefiting from technology spillovers from eastern China, it enhances resource-intensive utilization to improve CEE. However, as the transitional zone for industrial transfer, some cities have formed a “pollution haven” effect when undertaking energy-intensive industries in eastern China, owing to lagging technological advancement, spreading emissions to adjacent areas [77]. In contrast, western China is characterized by relatively weak economic foundation and slower urbanization process, yet it offers substantial potential for land development and population migration, presenting a significant late-development advantage. Meanwhile, by leveraging the “Western Development” strategic policy, the region can actively foster green industries to replace the traditional high-carbon economic model, significantly enhancing local CEE. The indirect effect of CDLUPU in western China is statistically insignificant. One plausible explanation is that the scatter urban spatial structure and weak economic linkages hinder the spillover of benefits generated by local CDLUPU.

4.6.2. Heterogeneity Analysis of Urban Agglomerations

Additionally, this study selected the Beijing–Tianjin–Hebei (BTH), Yangtze River Delta (YRD), and Chengdu–Chongqing (CY) to perform heterogeneity analysis, with results presented in Figure 7. In the YRD, the direct negative effect of CDLUPU on CEE is significant, with a coefficient of −0.660, while the spatial spillover effect has a coefficient of 0.670 but is not statistically significant. This suggests that for every 1% increase in CDLUPU in YRD, the CEE within the region decreases by 0.66%, whereas it increases slightly in adjacent areas, albeit without statistical significance. In BTH, it exhibits a positive spatial spillover effect with a coefficient of 1.492, though its direct effect coefficient of 0.253 lacks statistical significance. This implies that for every 1% increase in CDLUPU in BTH, the CEE in neighboring regions increases by 1.492%, and there is also an increase in CEE within the region itself. Notably, the CY presents a unique pattern: its direct effect coefficient is 1.504 and is statistically significant, whereas the spatial spillover effect has a negative coefficient of −1.542, which is not statistically significant. This indicates that for every 1% increase in CDLUPU in CY, the CEE within the region increases by 1.504%, while the CEE in adjacent regions decreases.
The YRD, characterized by high economic integration, effectively facilitates frequent cross-regional flows of technology and capital. This enables green innovation technologies to spread across regions via industrial chains. However, intense inter-regional land resource competition impedes local CEE improvement, a phenomenon consistent with eastern China’s developmental pattern. Core cities such as Shanghai and Suzhou are confronted with saturated land development, where CDLUPU’s marginal contribution to local CEE decreases. In contrast, the BTH coordinated development strategy effectively drives low-carbon transitions in both local and surrounding areas. For instance, the relocation of non-capital functions from Beijing has led to the optimization of regional industrial structures, enhancing overall CEE [71]. The CY exhibits a significantly positive direct effect, and its magnitude is substantially greater than that in BTH. This further indicates that CY has a notably pronounced latecomer advantage resulting from the coordination of population and land. However, the imperfect interregional coordination mechanism and relatively weak economic connections with surrounding areas limit technology spillover and make it difficult to effectively form the spillover effect. This phenomenon is consistent with the spatial effect observed in western China.

5. Discussion

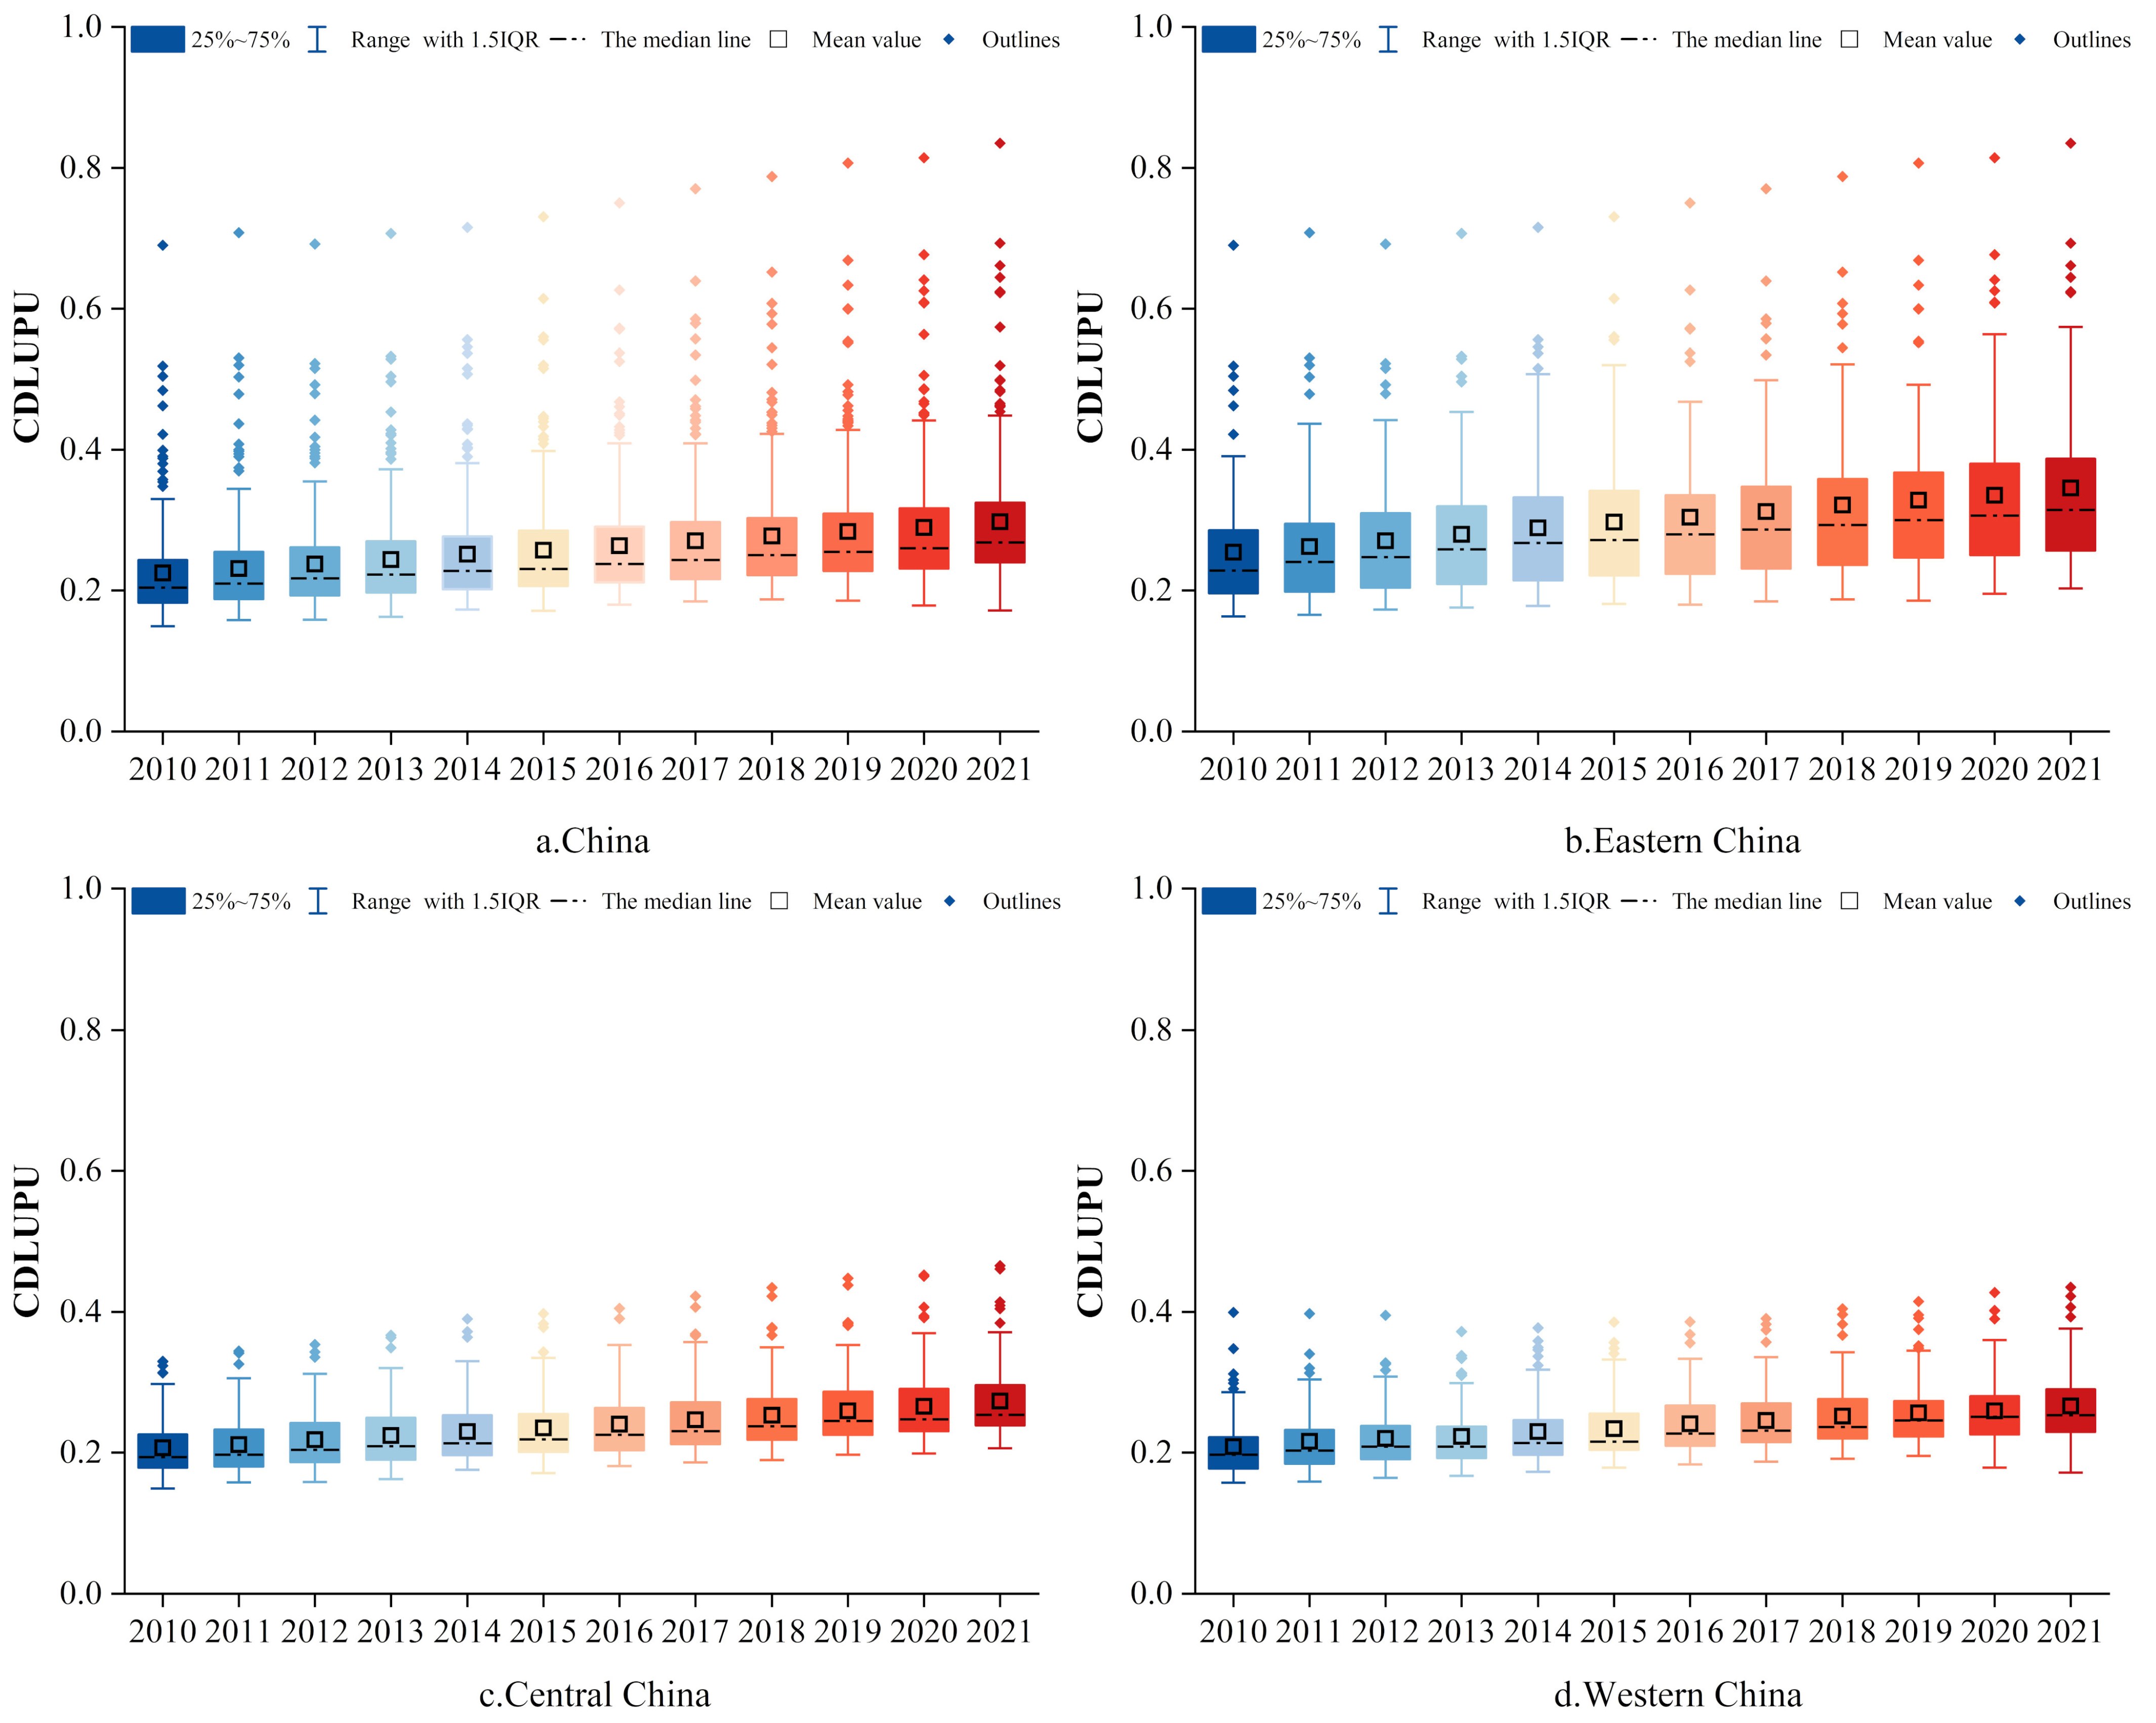
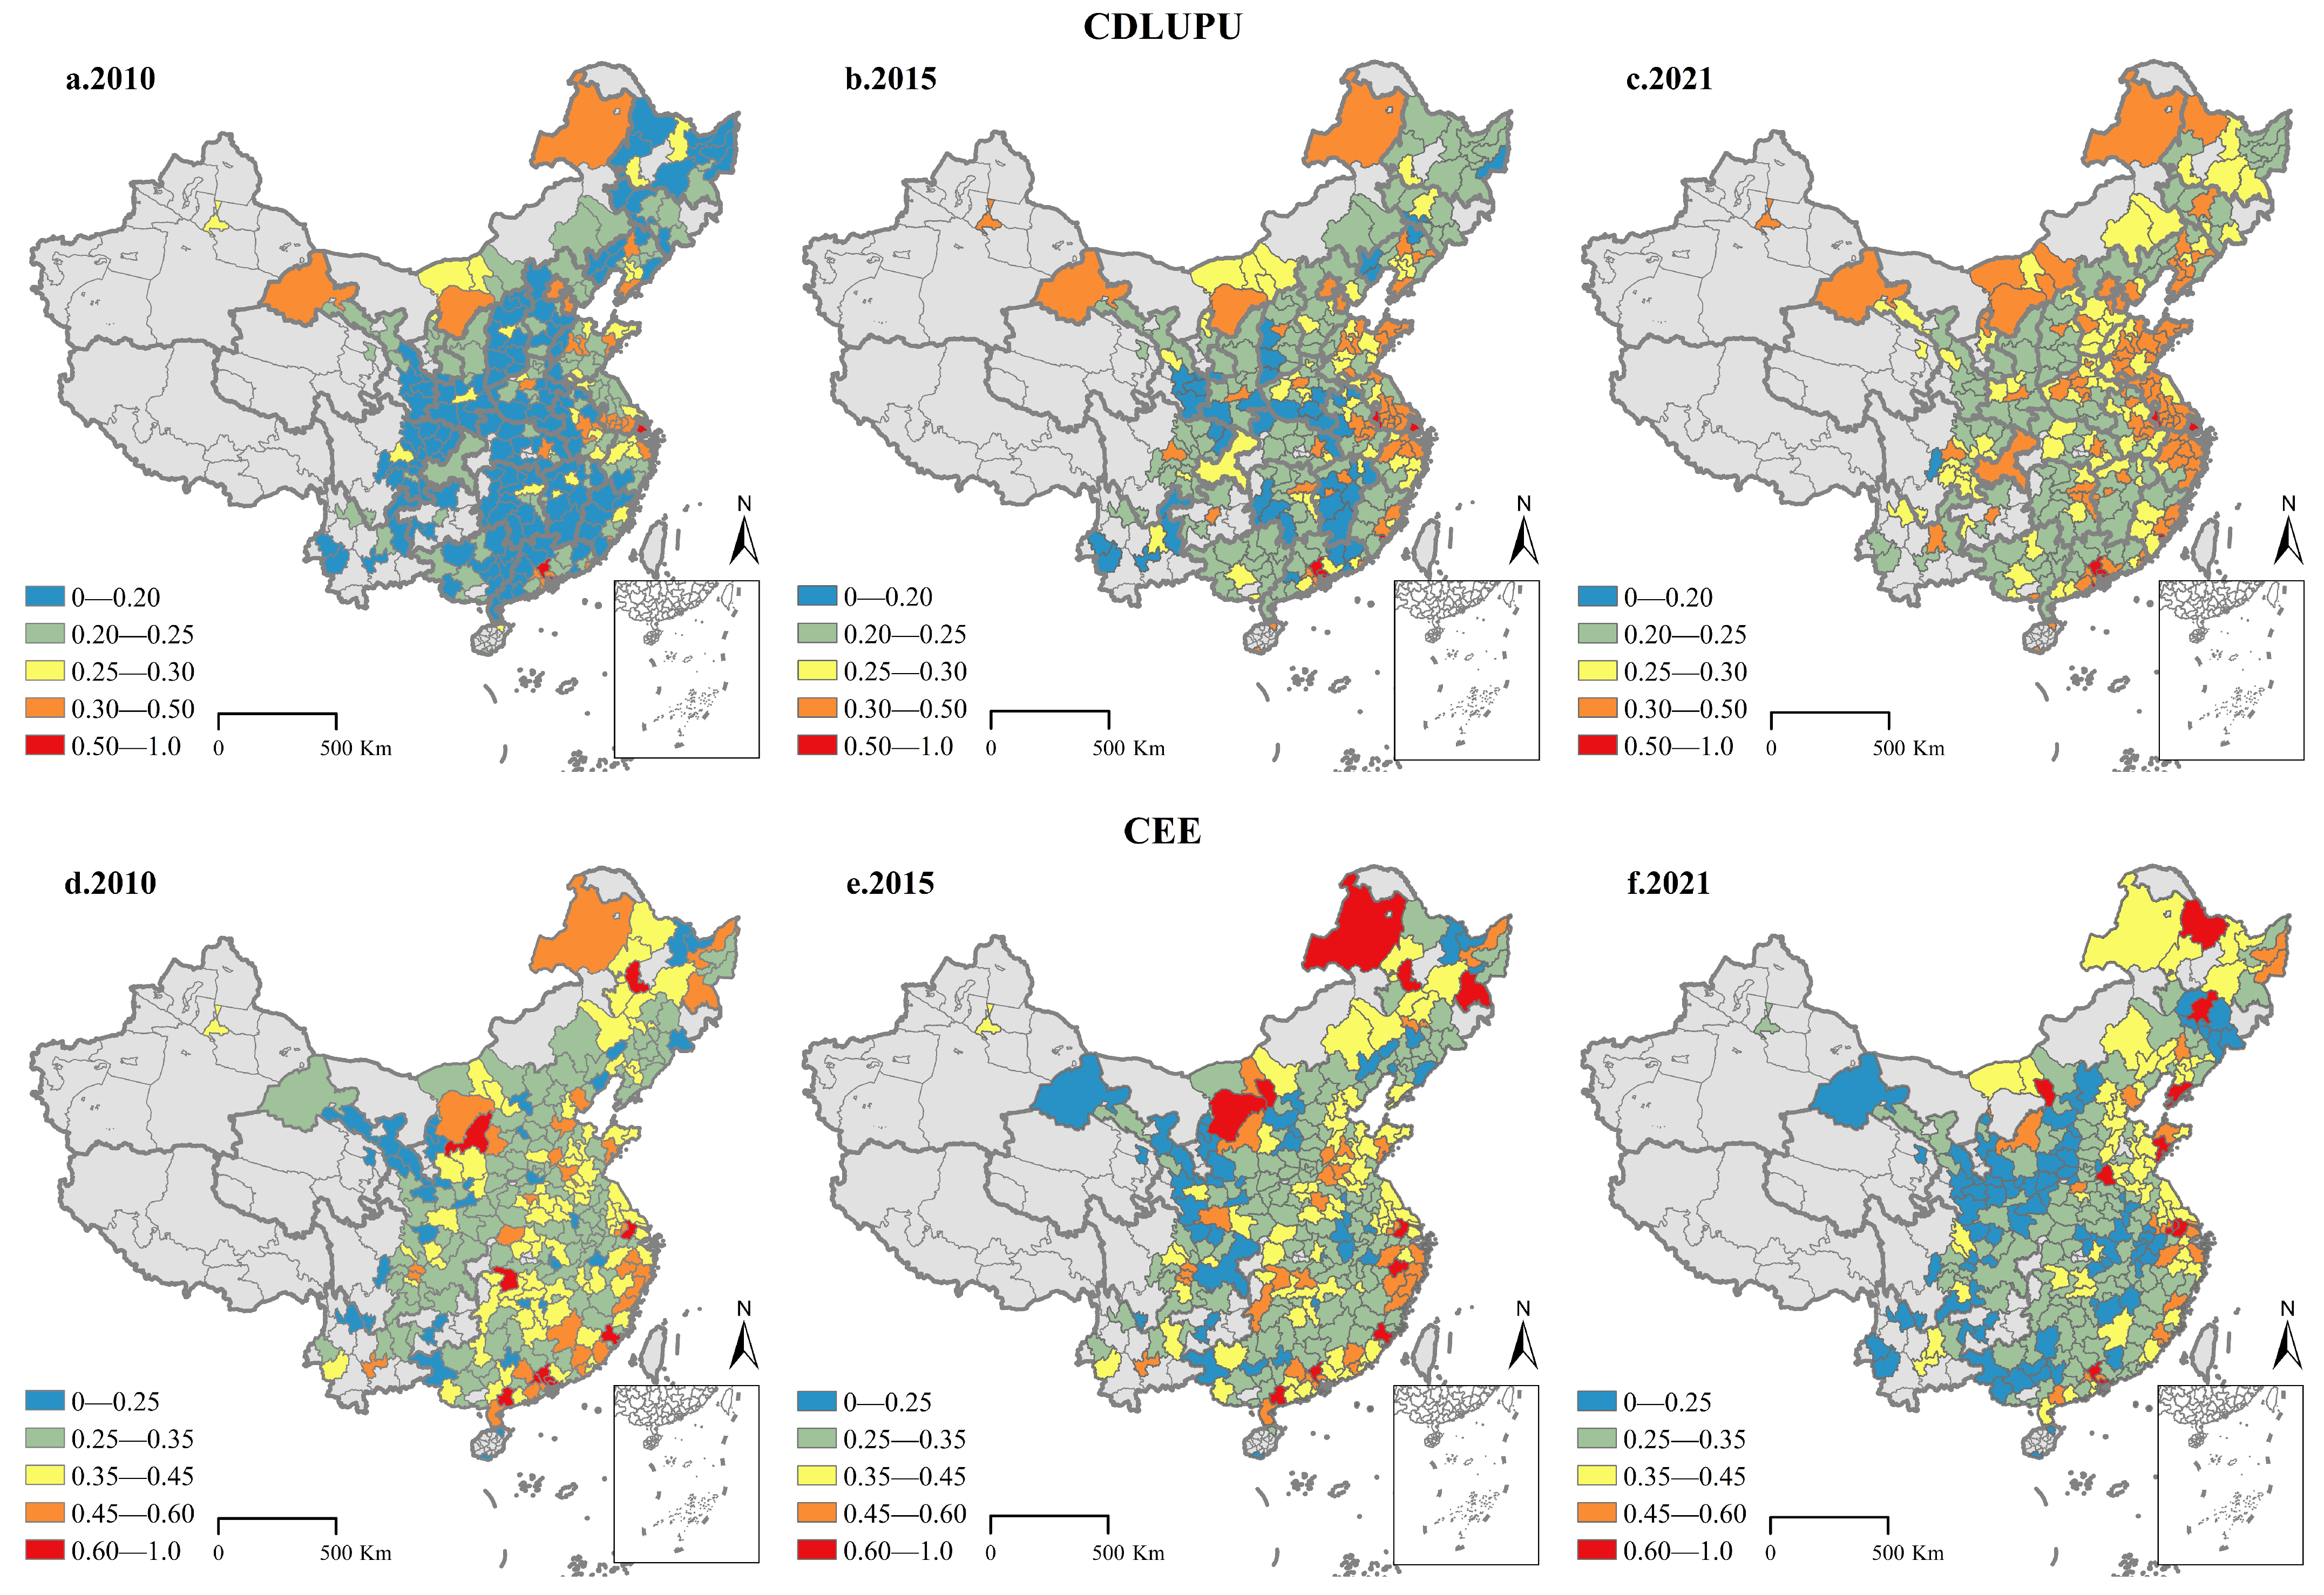
Through comprehensive and meticulous analysis, it is evident that from 2010 to 2021, the average level of CDLUPU in China has been on a continuous upward trajectory. In contrast, the average level of CEE has exhibited a pattern of rising initially and then declining. Overall, there is substantial room for improvement in both CDLUPU and CEE in China. Meanwhile, as can be readily observed from the preceding analysis, the average levels of CDLUPU and CEE in China’s eastern region have consistently been the highest, followed by the central region, and the western region has the lowest values. This finding aligns with the research conclusion of Sun and Liu [78]. This indicates that eastern China, benefiting from robust economic linkages and siphon effect, has attracted substantial inflows of both population and capital, thereby fostering a synergistic relationship between human activities and land use. Meanwhile, eastern China leads in developing green low-carbon industries, leveraging its technological advantages to enhance CEE. In contrast, central and western China exhibit relatively underdeveloped economic development, with populations concentrated in more advantageous areas, intensifying the imbalance between population distribution and land utilization. The significant disparity between LU and PU contributes to the lower CDLUPU levels in these regions. Additionally, the prevalence of resource-dependent cities and comparatively underdeveloped industrial structures in central and western China pose challenges to improving 
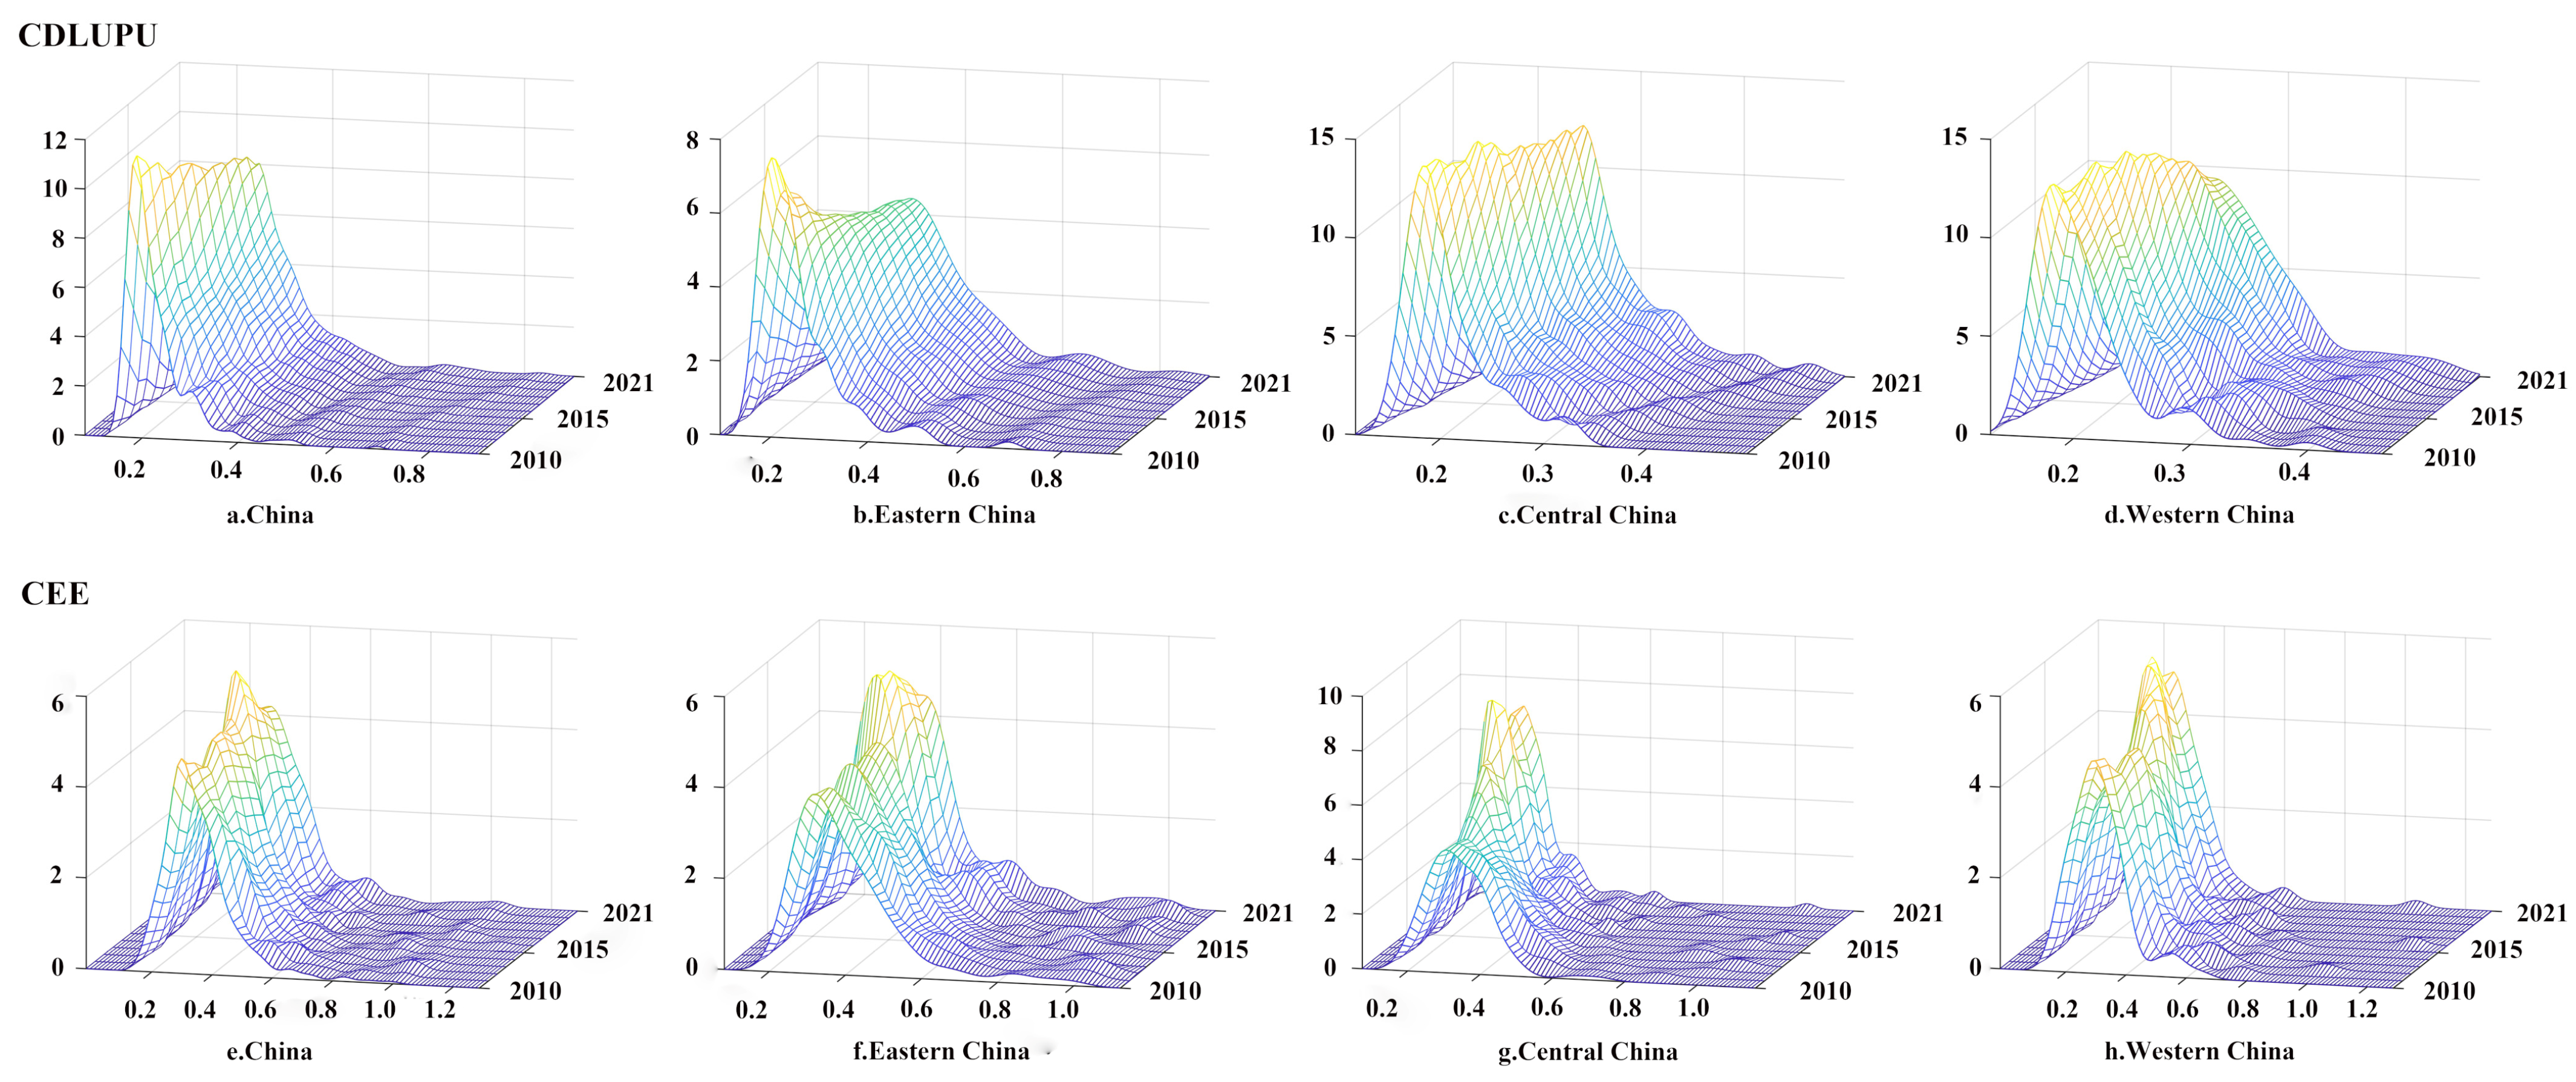
CEE. Nevertheless, kernel density analysis indicates that regional disparities in CDLUPU and CEE across regions are gradually narrowing.
During the study period, a strengthening spatial correlation between CDLUPU and CEE was observed. Spatial econometric analysis further reveals that CDLUPU serves as an effective mechanism for enhancing CEE. Notably, CDLUPU not only improves local CEE but also generates positive spatial spillover effects to neighboring regions through diffusion mechanisms such as industrial agglomeration and scale economies. Specifically, when a particular region exhibits a favorable development trend, its advantageous resources, including technology and capital, are disseminated to the surrounding areas, fostering low-carbon industries that achieve higher economic output with lower emissions, improving CEE. Notably, China’s vast territorial expanse results in significant regional disparities in urbanization stages, resource endowments, and economic levels [26]. This heterogeneity explains variations in research findings, and our heterogeneity analysis further corroborates this perspective. The eastern, central, and western China, along with the YRD, BTH, and CY, represent distinct urbanization phases. The differential interactions between CDLUPU and CEE across these regions are closely linked to their developmental stages and regional characteristics.
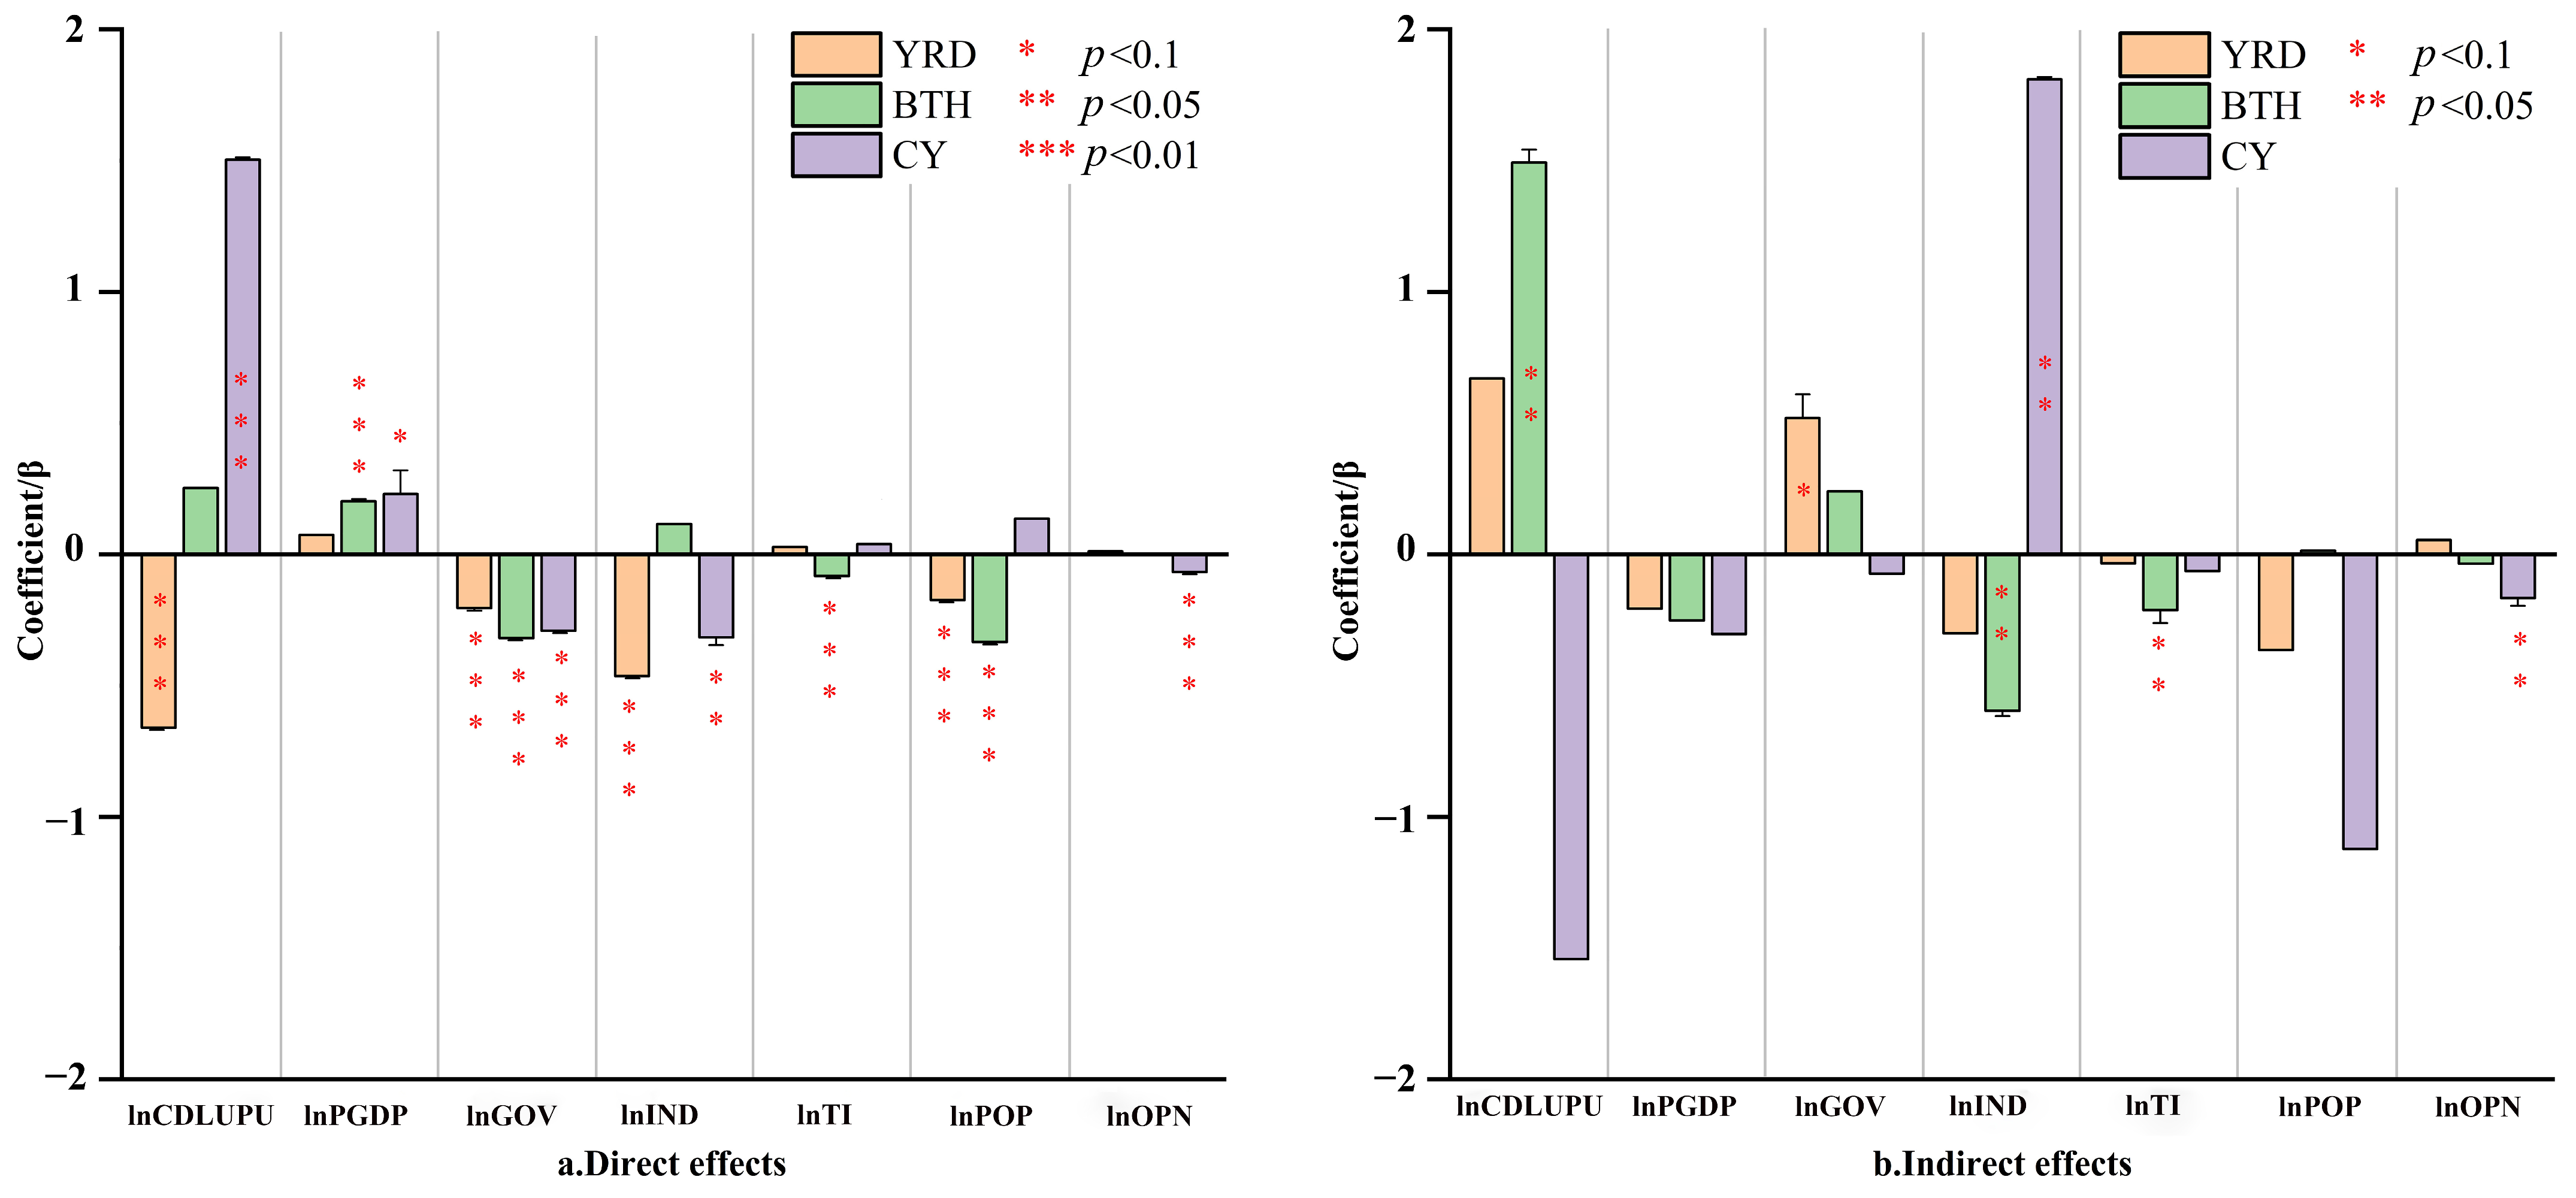
Furthermore, the analysis findings of the YRD and CY, respectively, confirm the spatial effects in eastern and western China. This reflects the specific characteristics exhibited by different urban agglomerations in light of their own development traits and geographical locations. Notably, the direct effect of eastern China and YRD demonstrate inhibitory characteristics, which are rooted in the nonlinear dynamics theory of urbanization. Even though the CDLUPU level in this region is higher than the average level of the study area, which is beneficial for facilitating the efficient allocation of factors, the land development intensity is approaching the threshold of ecological carrying capacity, and the marginal emission reduction benefits are diminishing [37]. Nevertheless, its relatively high indirect effect underscores the advantages of technology diffusion under the “core-periphery” structure [50].
Meanwhile, the central and western China achieve low-carbon development through leveraging government intervention to facilitate the integration of industry and urban planning, as well as establishing an ecological compensation mechanism. However, the “pollution haven” effect, which is triggered by the transfer of high-energy-consuming industries from the eastern China to central and western China, poses an obstacle to the overall low-carbon development of the region [10]. The analytical findings of the BTH and CY lend support to this. Notably, the BTH exhibits positive direct and indirect effects of CDLUPU, primarily attributed to the effective regional coordinated development strategy. During the development planning process, the BTH considers the economic benefits of surrounding areas, successfully achieving a virtuous cycle between urbanization and CEE coordination. This development paradigm offers a practical exemplar for other regions to reference.

6. Conclusions and Policy Implications

6.1. Conclusions

This study systematically investigates the spatio-temporal differentiation and dynamic evolution patterns of CDLUPU and CEE in 276 prefecture-level cities during the period 2010–2021. The spatial effect of CDLUPU on CEE is empirically analyzed using a spatial econometric model, with further heterogeneity tests considering regional economic development levels and urbanization processes. The conclusions are as follows:
(1)
Over the studied period, the CDLUPU levels across 276 cities manifested a sustained growth pattern, registering an overall increase of 32.48%. In contrast, the CEE exhibited a fluctuating trajectory, characterized by an initial upward trend, followed by a decline, and then a subsequent rebound. Notably, only eastern China is maintaining a consistent upward trend. Spatial analysis indicated substantial positive correlations for both indicators, as evidenced by progressively strengthening Moran’s I value. The regional disparities in CDLUPU remained relatively stable, while inter-regional differences in CEE demonstrated a gradual decrease.
(2)
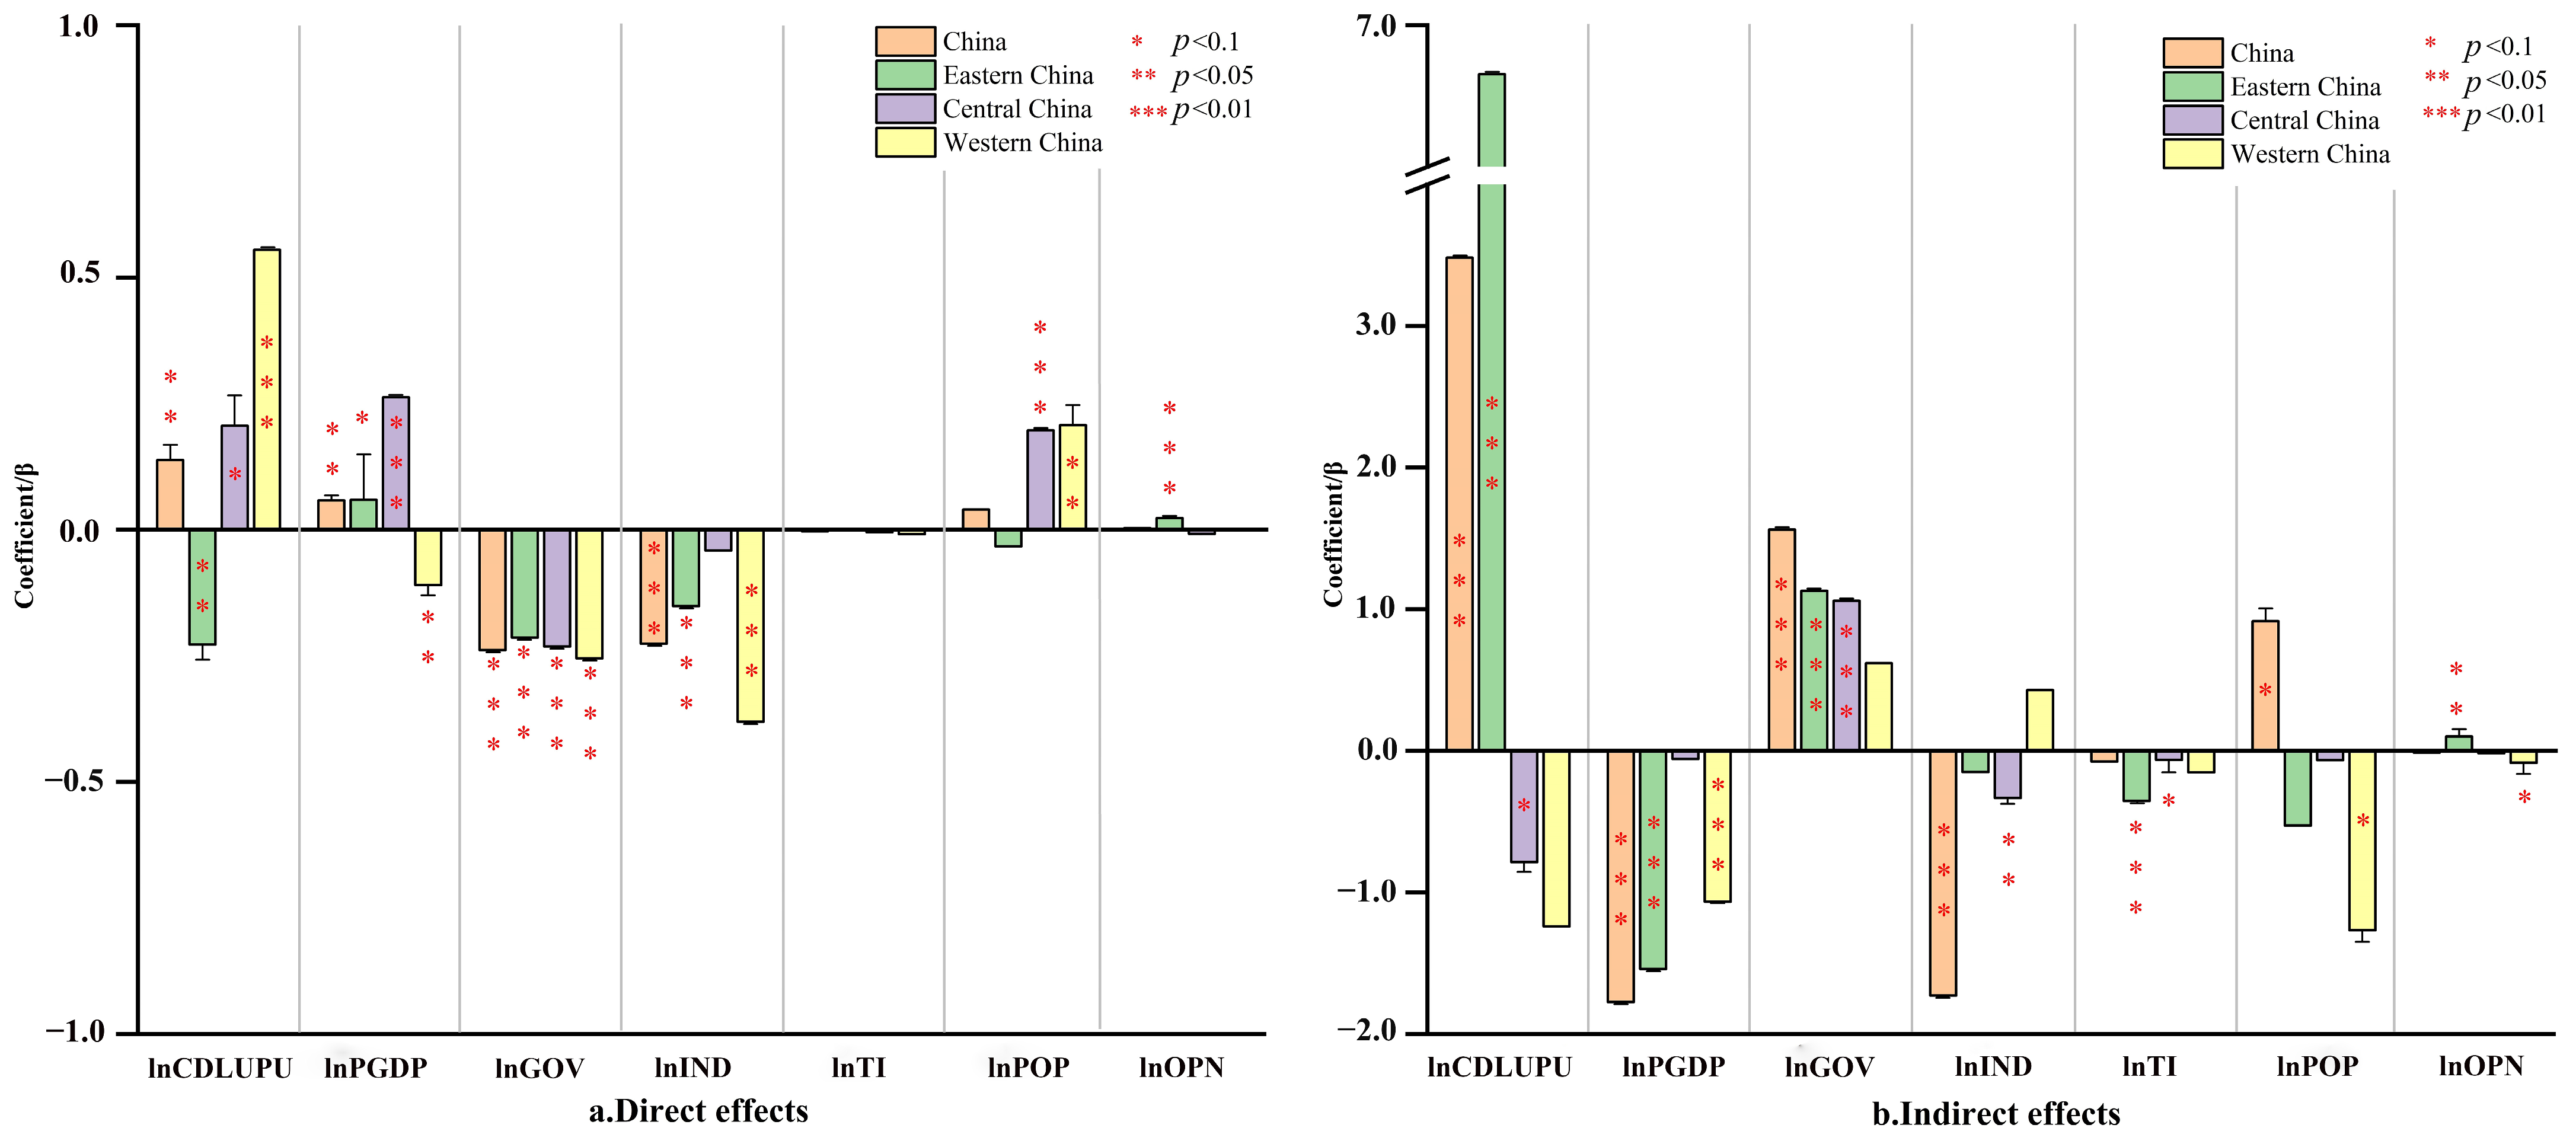
The empirical results demonstrate that CDLUPU exerts a notably positive impact on CEE. Specifically, the direct and indirect effects are both significantly positive, with coefficients of 0.138 and 3.483, respectively. The above results were validated through robustness tests and endogeneity analysis, suggesting that CDLUPU facilitates the improvement of CEE within the region and generates a positive spillover effect on surrounding regions.
(3)
Heterogeneity analysis indicates that CDLUPU negatively affects CEE in eastern China, more pronounced in YRD, but positively impacts CEE in central and western China, as well as in BTH and CY. As for indirect effects, eastern China exhibits significant positive effect on CEE, and the same holds true for the YRD. However, central China exhibits a negative effect, whereas the BTH shows an opposite trend. The spillover effects in western China and CY are statistically insignificant.

6.2. Policy Recommendations

Research findings indicate that LU and PU play a critical role in enhancing CEE through their coordinated development. To achieve the coordination and integration of LU and PU, differentiated development strategies should be adopted tailored to the characteristics of various urban development stages. For cities experiencing massive population inflows, priority should be given to advancing household registration system reforms, establishing dynamic infrastructure planning systems, and improving regulatory mechanisms centered on “people-oriented land allocation” to enhance the spatial matching efficiency between population and land resources. In contrast, for cities facing simultaneous population outflows and land expansion, a shift toward an optimized stock-based development model is necessary. This can be achieved by strictly controlling the addition of new construction land, promoting compact urban planning, and establishing evaluation systems for the coordinated development of land use and population. Specific measures include revitalizing idle and inefficient land use to foster a virtuous cycle between land-intensive utilization and improving CEE.
Given the heterogeneity in the underlying mechanisms, it is crucial to tailor policies according to different regional conditions. In eastern China, a shift from “incremental expansion” to “stock optimization” is imperative to address the diminishing marginal emission reduction benefits in the late stages of urbanization. Emphasis should be placed on enhancing technology diffusion and regional synergy. By leveraging urban agglomerations establishing green technology transfer platforms, it is possible to facilitate the diffusion of low-carbon technologies from core cities to surrounding regions, enhancing the overall improvement of CEE within the region. In central China, optimizing industrial transfer mechanisms and strengthening the synergy between government intervention and market incentives are essential. Simultaneously, accelerating technological progress and industrial upgrading will help avoid the “pollution haven” effect caused by the transfer of high-carbon industries, facilitating a win–win for economic growth and low-carbon development. Western China should fully leverage the “Western Development Strategy” policy and capitalize on the late-mover advantages of coordinated land and population urbanization. Strengthening ecological compensation and clean energy substitution is critical. Additionally, cross-regional collaboration should be enhanced through mechanisms such as carbon emission trading to resolve the spatial conflict of “local emission reduction and neighboring emission increase”, promoting regional collaborative carbon reduction.

6.3. Limitations and Prospects

Despite this study evaluating the spatio-temporal variations and differences between CDLUPU and CEE, as well as their influencing mechanisms, there are still limitations. Firstly, there is a lack of a comprehensive and perfect evaluation system for LU and PU to enhance both its scientificity and rationality. Secondly, where possible, real data obtained from field investigations should be utilized to further explore the mechanisms by which CDLUPU affects CEE and its regional heterogeneity across different areas. Additionally, constrained by data constraints, the analysis in this paper is limited to the period from 2010 to 2021, and the regression results for western cities may lack sufficient representativeness. Therefore, future research will focus on obtaining long-term panel databases to capture evolution patterns, enhance sample coverage and data quality in the western regions of China, and establish a more complete and systematic LU and PU index system, thereby improving the universality of research conclusions.

Author Contributions

Conceptualization, H.G. and Q.L.; software, Q.L.; validation, M.C. and B.W.; formal analysis, J.W.; investigation, H.G.; resources, H.G.; data curation, Q.L.; writing—original draft preparation, Q.L.; writing—review and editing, H.G.; visualization, C.H.; supervision, B.W.; project administration, H.G.; funding acquisition, H.G. methodology, J.W. All authors have read and agreed to the published version of the manuscript.

Funding

This research was supported by the Ministry of Education Humanities and Social Sciences General Research Project (grant number: 23A10157004), Liaoning Provincial Department of Education, Social Science Project, Study on the Decoupling Relationship between Land Use Efficiency and Carbon Emission and its Realization Path in Three Eastern Provinces in the Context of New Urbanization (grant number: JYTQN2024019), Liaoning Provincial Department of Science and Technology, Qingyuan County Ground Power Enhancement Science and Technology Mission, Liaoning Province (grant number: 2024JH5/10400158), Propaganda Department of Liaoning Provincial Committee of the Communist Party of China, “Xingliao Talent Program”, “Cultural Masters” and “Four Batch” Talents (grant number: XLYC2210046).

Data Availability Statement

Data will be made available on request.

Conflicts of Interest

The authors declare no conflicts of interest.

Appendix A

Table A1. Moran’s I index results for CDLUPU.
YearW IW IIW IIIW IV
Moran’s Ip ValueMoran’s Ip Value Moran’s Ip ValueMoran’s Ip Value
20100.347 ***0.0000.091 ***0.0000.530 ***0.0000.166 *** 0.000
20110.318 ***0.0000.082 ***0.0000.518 ***0.0000.157 *** 0.000
20120.323 ***0.0000.083 ***0.0000.529 ***0.0000.162 *** 0.000
20130.336 ***0.0000.086 ***0.0000.540 ***0.0000.167 *** 0.000
20140.342 ***0.0000.087 ***0.0000.543 ***0.0000.171 *** 0.000
20150.356 ***0.0000.092 ***0.0000.554 ***0.0000.180 *** 0.000
20160.369 ***0.0000.092 ***0.0000.566 ***0.0000.182 *** 0.000
20170.368 ***0.0000.095 ***0.0000.562 ***0.0000.189 *** 0.000
20180.365 ***0.0000.096 ***0.0000.563 ***0.0000.190 *** 0.000
20190.368 ***0.0000.099 ***0.0000.560 ***0.0000.196 *** 0.000
20200.359 ***0.0000.100 ***0.0000.556 ***0.0000.196 *** 0.000
20210.367 ***0.0000.103 ***0.0000.564 ***0.0000.200 *** 0.000
Notes: *** p < 0.01.
Table A2. Moran’s I index results for CEE.
YearW IW IIW IIIW IV
Moran’s Ip ValueMoran’s Ip Value Moran’s Ip ValueMoran’s Ip Value
20100.205 ***0.0000.063 ***0.0000.248 ***0.0000.099 ***0.000
20110.219 ***0.0000.061 ***0.0000.275 ***0.0000.096 ***0.000
20120.204 ***0.0000.058 ***0.0000.276 ***0.0000.091 ***0.000
20130.155 ***0.0000.043 ***0.0000.218 ***0.0000.060 ***0.000
20140.173 ***0.0000.055 ***0.0000.243 ***0.0000.077 ***0.000
20150.204 ***0.0000.064 ***0.0000.251 ***0.0000.092 ***0.000
20160.205 ***0.0000.062 ***0.0000.256 ***0.0000.089 ***0.000
20170.304 ***0.0000.092 ***0.0000.403 ***0.0000.132 ***0.000
20180.320 ***0.0000.097 ***0.0000.429 ***0.0000.145 ***0.000
20190.300 ***0.0000.097 ***0.0000.400 ***0.0000.130 ***0.000
20200.298 ***0.0000.094 ***0.0000.379 ***0.0000.121 ***0.000
20210.301 ***0.0000.092 ***0.0000.398 ***0.0000.119 ***0.000
Notes: *** p < 0.01.
Table A3. The result of the model selection.
Model TestModel IModel IIModel IIIModel IV
LM testLM365.832 ***1369.991 ***631.602 ***977.529 ***
R-LM7.660 ***290.552 ***40.670 ***111.878 ***
LM391.733 ***1141.330 ***598.063 ***951.695 ***
R-LM33.562 ***61.890 ***7.132 ***86.045 ***
Hausman testFE or RE79.77 ***39.03 ***44.14 ***48.65 ***
LR testLR ERR224.96 ***214.19 ***202.89 ***219.08 ***
LR LAG223.61 ***265.86 ***223.03 ***235.33 ***
LR ind127.03 ***55.11 ***120.99 ***96.06 ***
LR time4343.43 ***4347.09 ***4358.17 ***4451.57 ***
Wald testWald ERR41.14 ***54.61 ***42.48 ***71.72 ***
Wald LAG45.06 ***79.24 ***52.28 ***91.89 ***
Observations3312331233123312
Number of id276276276276
Notes: *** p < 0.01.
Table A4. Direct, indirect, and total effects in different regions.
VariablesEastern ChinaCentral ChinaWestern China
Direct EffectIndirect EffectTotal EffectDirect EFFECTIndirect EffectTotal EffectDirect EffectIndirect EffectTotal Effect
lnCDLUPU−0.228 **6.655 ***6.427 ***0.206 *−0.785 *−0.5800.555 ***−1.240−0.685
(0.03)(0.00)(0.00)(0.06)(0.07)(0.16)(0.00)(0.26)(0.54)
lnPGDP0.059 *−1.540 ***−1.480 ***0.262 ***−0.0580.204−0.110 **−1.065 ***−1.175 ***
(0.09)(0.00)(0.00)(0.00)(0.74)(0.22)(0.02)(0.01)(0.00)
lnGOV−0.214 ***1.131 ***0.917 ***−0.232 ***1.060 ***0.828 ***−0.255 ***0.6190.364
(0.00)(0.00)(0.01)(0.00)(0.00)(0.00)(0.00)(0.11)(0.33)
lnIND−0.152 ***−0.151−0.303−0.041−0.334 **−0.375 **−0.381 ***0.4280.047
(0.00)(0.74)(0.50)(0.28)(0.04)(0.02)(0.00)(0.34)(0.92)
lnTI0.000−0.353 ***−0.353 ***−0.005−0.063 *−0.068 **−0.009−0.153−0.161 *
(0.97)(0.00)(0.00)(0.61)(0.09)(0.05)(0.46)(0.11)(0.09)
lnPOP−0.033−0.528−0.5600.197 ***−0.0660.1310.207 **−1.268 *−1.061
(0.65)(0.33)(0.31)(0.00)(0.77)(0.54)(0.04)(0.08)(0.15)
lnOPN0.023 ***0.102 **0.125 **−0.008−0.017−0.025−0.001−0.084 *−0.085 *
(0.00)(0.05)(0.01)(0.19)(0.35)(0.14)(0.87)(0.08)(0.08)
Notes: *** p < 0.01, ** p < 0.05, * p < 0.1.
Table A5. Direct, indirect, and total effects in different urban agglomerations.
VariablesYRDBTHCY
Direct EffectIndirect EffectTotal EffectDirect EffectIndirect EffectTotal EffectDirect EffectIndirect EffectTotal Effect
lnCDLUPU−0.660 ***0.6700.0100.2531.492 **1.746 **1.504 ***−1.542−0.038
(0.00)(0.40)(0.99)(0.20)(0.05)(0.03)(0.00)(0.19)(0.98)
lnPGDP0.074−0.207−0.1330.202 ***−0.252−0.0500.230 *−0.304−0.074
(0.23)(0.35)(0.54)(0.00)(0.20)(0.81)(0.09)(0.60)(0.90)
lnGOV−0.205 ***0.520 *0.316−0.319 ***0.240−0.079−0.291 ***−0.074−0.365 *
(0.01)(0.09)(0.28)(0.00)(0.27)(0.70)(0.00)(0.78)(0.10)
lnIND−0.464 ***−0.301−0.764 ***0.115−0.596 **−0.481 *−0.316 **1.809 **1.493 *
(0.00)(0.32)(0.01)(0.12)(0.02)(0.07)(0.03)(0.01)(0.05)
lnTI0.028−0.034−0.006−0.082 ***−0.212 **−0.294 ***0.040−0.063−0.023
(0.38)(0.81)(0.97)(0.00)(0.05)(0.01)(0.17)(0.58)(0.84)
lnPOP−0.174 ***−0.364−0.538 **−0.334 ***0.014−0.3200.136−1.123−0.987
(0.00)(0.13)(0.03)(0.00)(0.97)(0.46)(0.50)(0.26)(0.36)
lnOPN0.0120.0550.067−0.003−0.035−0.038−0.067 ***−0.166 **−0.233 ***
(0.38)(0.37)(0.29)(0.84)(0.28)(0.27)(0.00)(0.03)(0.00)
Notes: *** p < 0.01, ** p < 0.05, * p < 0.1.

References

  1. Wang, Y.; Li, L.; Kubota, J.; Han, R.; Zhu, X.; Lu, G. Does urbanization lead to more carbon emission? Evidence from a panel of BRICS countries. Appl. Energy 2016, 168, 375–380. [Google Scholar] [CrossRef]
  2. Zhang, W.; Xu, Y.; Streets, D.G.; Wang, C. Can new-type urbanization realize low-carbon development? A spatiotemporal heterogeneous analysis in 288 cities and 18 urban agglomerations in China. J. Clean. Prod. 2023, 420, 138426. [Google Scholar] [CrossRef]
  3. Li, J.; Huang, X.; Kwan, M.-P.; Yang, H.; Chuai, X. The effect of urbanization on carbon dioxide emissions efficiency in the Yangtze River Delta, China. J. Clean. Prod. 2018, 188, 38–48. [Google Scholar] [CrossRef]
  4. Zhou, X.; Liang, Y.; Li, L.; Chai, D.; Gu, X.; Yang, L.; Duan, J. Analysis of spatial and temporal characteristics and influence mechanisms of carbon emissions in China’s, 1997–2017. J. Clean. Prod. 2024, 485, 144411. [Google Scholar] [CrossRef]
  5. Xing, P. Carbon emission efficiency of 284 cities in China based on machine learning approach: Driving factors and regional heterogeneity. Energy Econ. 2024, 129, 107222. [Google Scholar] [CrossRef]
  6. Zeng, L.; Lu, H.; Liu, Y.; Zhou, Y.; Hu, H. Analysis of Regional Differences and Influencing Factors on China’s Carbon Emission Efficiency in 2005–2015. Energies 2019, 12, 3081. [Google Scholar] [CrossRef]
  7. Xi, J. Speech at the General Debate of the 75th Session of the United Nations General Assembly. People’s Daily, 23 September 2020; p. 1. [Google Scholar] [CrossRef]
  8. Gu, H.; Ma, T.; Qian, F. County land use scenario simulation and carbon emission effect analysis using CLUE-S model. Trans. CSAE 2022, 38, 288–296. [Google Scholar] [CrossRef]
  9. Huang, J.; Han, W.; Zhang, Z.; Ning, S.; Zhang, X. The decoupling relationship between land use efficiency and carbon emissions in China: An analysis using the Socio-Ecological Systems (SES) framework. Land Use Policy 2024, 138, 107055. [Google Scholar] [CrossRef]
  10. Li, L.; Zhang, B.; Xia, Q.; Dong, J. Spatial effect of land resource misallocation on carbon emissions efficiency and its influence path: Empirical evidence from 108 cities in the Yangtze River Economic Belt. Resour. Sci. 2023, 45, 1059–1073. [Google Scholar] [CrossRef]
  11. Chen, S.; Yu, D. Spatio-temporal coupling and influencing factors of man-land relationship in the urbanization process of the Yangtze River Delta. World Reg. Stud. 2025, 34, 114–127. [Google Scholar] [CrossRef]
  12. Gu, H.; Li, J.; Wang, S. Multi-Scenario Simulation of Land Use/Cover Change and Terrestrial Ecosystem Carbon Reserve Response in Liaoning Province, China. Sustainability 2024, 16, 8244. [Google Scholar] [CrossRef]
  13. Zhang, Y.; Ren, J. Innovation in China’s new-type urbanization development path: From the perspective of human-land coordination. Mod. Econ. Res. 2017, 1, 28–32. [Google Scholar] [CrossRef]
  14. Dong, F.; Bian, Z.; Yu, B.; Wang, Y.; Zhang, S.; Li, J.; Su, B.; Long, R. Can land urbanization help to achieve CO2 intensity reduction target or hinder it? Evidence from China. Resour. Conserv. Recycl. 2018, 134, 206–215. [Google Scholar] [CrossRef]
  15. Gu, H.; Liu, Y.; Qian, F.; Wang, Q.; Dong, X. An Empirical Analysis of the Factors Affecting Farmer Satisfaction Under the China Link Policy. Sage Open 2021, 11, 21582440211023204. [Google Scholar] [CrossRef]
  16. Huang, X.; Li, H.; Zhang, X.; Zhang, X. Land use policy as an instrument of rural resilience—The case of land withdrawal mechanism for rural homesteads in China. Ecol. Indic. 2018, 87, 47–55. [Google Scholar] [CrossRef]
  17. Xie, Y.; Liu, Q.; Zhang, Y.; Pan, X.; Shao, M.; Hu, B. Coupling Coordination Relationship and Spatial Difference Between Population Urbanizationand Land Urbanizationin BeibuGulf Urban Agglomeration. Res. Soiland Wate Conserv. 2024, 31, 421–431. [Google Scholar] [CrossRef]
  18. Wu, Y.; Cui, Z.; Hu, C. Does the New Urbanization Influence Air Quality in China? Front. Environ. Sci. 2021, 9, 645010. [Google Scholar] [CrossRef]
  19. Ye, L.; Wu, A.M. Urbanization, Land Development, and Land Financing: Evidence from Chinese Cities. J. Urban Aff. 2014, 36, 354–368. [Google Scholar] [CrossRef]
  20. Chen, F.; Zhang, H.; Wu, Q.; Chen, W. A study on coordinate development between population urbanization and land urbanization in China. Hum. Geogr. 2010, 25, 53–58. [Google Scholar] [CrossRef]
  21. Xu, G.; Zheng, M.; Wang, Y.; Li, J. The Urbanization of Population and Land in China: Temporal Trends, Regional Disparities, Size Effect and Comparisons of Measurements. China Land Sci. 2022, 36, 80–90. [Google Scholar] [CrossRef]
  22. Wang, J. Analysis of coordinated development between land urbanization and population urbanization from the perspective of new-type urbanization. Agric. Econ. 2023, 6, 109–112. [Google Scholar] [CrossRef]
  23. Yang, L.; Chen, W.; Fang, C.; Zeng, J. How does the coordinated development of population urbanization and land urbanization affect residents’ living standards? Empirical evidence from China. Cities 2024, 149, 104922. [Google Scholar] [CrossRef]
  24. Zhang, Y.; Su, Z.; Li, G.; Zhuo, Y.; Xu, Z. Spatial-Temporal Evolution of Sustainable Urbanization Development: A Perspective of the Coupling Coordination Development Based on Population, Industry, and Built-Up Land Spatial Agglomeration. Sustainability 2018, 10, 1766. [Google Scholar] [CrossRef]
  25. Zhang, G.; Zhang, N.; Liao, W. How do population and land urbanization affect CO2 emissions under gravity center change? A spatial econometric analysis. J. Clean. Prod. 2018, 202, 510–523. [Google Scholar] [CrossRef]
  26. Jin, D.; Dai, L. Temporal and Spatial Characteristics and Driving Factors of Coordinated Development between Population Urbanization and Land Urbanization in China. China Land Sci. 2021, 35, 74–84. [Google Scholar] [CrossRef]
  27. Kaya, Y.; Yokobori, K. Environment, Energy and Economy: Strategies for Sustainability; United Nations University Press: Tokyo, Japan, 1997. [Google Scholar]
  28. Sun, J.W. The decrease of CO2 emission intensity is decarbonization at national and global levels. Energy Policy 2005, 33, 975–978. [Google Scholar] [CrossRef]
  29. Zhou, P.; Ang, B.W.; Han, J.Y. Total factor carbon emission performance: A Malmquist index analysis. Energy Econ. 2010, 32, 194–201. [Google Scholar] [CrossRef]
  30. Xiao, Y.; Ma, D.; Zhang, F.; Zhao, N.; Wang, L.; Guo, Z.; Zhang, J.; An, B.; Xiao, Y. Spatiotemporal differentiation of carbon emission efficiency and influencing factors: From the perspective of 136 countries. Sci. Total Environ. 2023, 879, 163032. [Google Scholar] [CrossRef]
  31. Ma, Y.; Zhang, Z.; Yang, Y. Calculation of carbon emission efficiency in China and analysis of influencing factors. Environ. Sci. Pollut. Res. 2023, 30, 111208–111220. [Google Scholar] [CrossRef]
  32. Charnes, A.; Cooper, W.W.; Rhodes, E. Measuring the efficiency of decision making units. Eur. J. Oper. Res. 1978, 2, 429–444. [Google Scholar] [CrossRef]
  33. Xiao, H.; Zhou, Y.; Zhang, N.; Wang, D.; Shan, Y.; Ren, J. CO2 emission reduction potential in China from combined effects of structural adjustment of economy and efficiency improvement. Resour. Conserv. Recycl. 2021, 174, 105760. [Google Scholar] [CrossRef]
  34. Zhou, D.; Wang, X. Research on coupling degree and coupling path between China’s carbon emission efficiency and industrial structure upgrade. J. Nat. Resour. 2019, 34, 2305. [Google Scholar] [CrossRef]
  35. Li, D.; Xu, H.; Zhang, S. Financial development, technological innovation, and carbon emission efficiency: Theoretical and empirical research. Inq. Into Econ. Issues 2018, 2, 169–174. [Google Scholar]
  36. Xie, Z.; Qin, Y.; Shen, W.; Rong, P. Efficiency and Impact Factors of Low Carbon Economic Development in China. Econ. Geogr. 2017, 37, 1–9. [Google Scholar] [CrossRef]
  37. Chen, W.; Wang, G.; Xu, N.; Ji, M.; Zeng, J. Promoting or inhibiting? New-type urbanization and urban carbon emissions efficiency in China. Cities 2023, 140, 104429. [Google Scholar] [CrossRef]
  38. Wu, X. Study on the Spatiotemporal Dynamic Effect of Carbon Emission Efficiency of Regional Urbanization in China. Reg. Econ. Rev. 2023, 1, 139–148. [Google Scholar] [CrossRef]
  39. Wang, X.; Cheng, Y. Research on the influencing mechanism of urbanization on carbon emission efficiency—Based on an empirical study of 118 countries. World Reg. Stud. 2020, 29, 503–511. [Google Scholar] [CrossRef]
  40. Zhang, T. The Impact of Urbanization on China’s Carbon Emission Efficiency—Theory and Empirical Study. Ph.D. Thesis, Chongqing University, Chongqing, China, 2016. [Google Scholar]
  41. Martínez-Zarzoso, I.; Maruotti, A. The impact of urbanization on CO2 emissions: Evidence from developing countries. Ecol. Econ. 2011, 70, 1344–1353. [Google Scholar] [CrossRef]
  42. Liu, J.; Wei, W. Impact of Urbanization Level and Endowment Disparity on Carbon Reduction Efficiency. China Popul. Resour. Environ. 2014, 24, 42–48. [Google Scholar] [CrossRef]
  43. Qin, Y.; Huang, R. Carbon emission efficiency and influencing factors in Central and Eastern European countries based on Super-SBM model. Clim. Change Res. 2024, 20, 581–592. [Google Scholar] [CrossRef]
  44. Dong, F.; Zhu, J.; Li, Y.; Chen, Y.; Gao, Y.; Hu, M.; Qin, C.; Sun, J. How green technology innovation affects carbon emission efficiency: Evidence from developed countries proposing carbon neutrality targets. Environ. Sci. Pollut. Res. 2022, 29, 35780–35799. [Google Scholar] [CrossRef] [PubMed]
  45. Liu, L.; Yang, S. Regional Heterogeneity Research on Effects of China’s Urbanization Process on Efficiency of Total Factor Carbon Emissions. Soc. Sci. Yunnan 2022, 2, 101–110. [Google Scholar] [CrossRef]
  46. Sun, W.; Huang, C. How does urbanization affect carbon emission efficiency? Evidence from China. J. Clean. Prod. 2020, 272, 122828. [Google Scholar] [CrossRef]
  47. Peng, W.; Su, X.; Kuang, C.; Yang, S.; Zhao, D.; Wei, X. The impact and spatial effects of the digital economy on carbon emission efficiency in the Changsha-Zhuzhou-Xiangtan metropolitan area. Acta Geogr. Sin. 2024, 79, 2915–2928. [Google Scholar] [CrossRef]
  48. Zhou, D.; Huang, Q.; Chong, Z. Analysis on the effect and mechanism of land misallocation on carbon emissions efficiency: Evidence from China. Land Use Policy 2022, 121, 106336. [Google Scholar] [CrossRef]
  49. Wang, Q.; Li, L.; Li, R. Uncovering the impact of income inequality and population aging on carbon emission efficiency: An empirical analysis of 139 countries. Sci. Total Environ. 2023, 857, 159508. [Google Scholar] [CrossRef] [PubMed]
  50. Li, X.; Deng, H.; Ma, J. Convergence and divergence of the coordinated development of the new urbanization process in the Yangtze River Economic Belt. Prog. Geogr. 2015, 34, 1409–1419. [Google Scholar] [CrossRef]
  51. Tobler, W.R. A Computer Movie Simulating Urban Growth in the Detroit Region. Econ. Geogr. 1970, 46, 234. [Google Scholar] [CrossRef]
  52. Yang, L.; Chen, W.; Zeng, J.; Pan, S. Regional differences in spatial determinants of land urbanization in China. Environ. Sci. Pollut. Res. 2023, 30, 119260–119274. [Google Scholar] [CrossRef]
  53. Li, J.; Chen, H.; Meng, H.; Huang, X.; Chuai, X.; Li, Y. The Impact of Regional Integration on Carbon Emissions in the Yangtze River Delta: A Multidimensional Perspective. Econ. Geogr. 2024, 44, 43–54. [Google Scholar] [CrossRef]
  54. He, S.; Shao, X. Spatial Clustering and Coupling Coordination of Population-Land-Economic Urbanization in Beijing-Tianjin-Hebei Region. Econ. Geogr. 2018, 38, 95–102. [Google Scholar] [CrossRef]
  55. Yan, J.; Deng, N.; Chen, B.; Zhang, X. Study on carbon footprint changes and influencing factors in Beijing-Tianjin-Hebei region under the“dual-carbon” goal. Acta Ecol. Sin. 2025, 45, 1275–1288. [Google Scholar] [CrossRef]
  56. Cheng, Y.; Liu, K.; Li, J.; Kang, Q.; Cui, P. Population flow pattern and urbanization effect in the municipal and county districts in China. J. Arid Land Resour. Environ. 2024, 38, 42–50. [Google Scholar] [CrossRef]
  57. Xie, Z.; Wu, R.; Wang, S. How technological progress affects the carbon emission efficiency? Evidence from national panel quantile regression. J. Clean. Prod. 2021, 307, 127133. [Google Scholar] [CrossRef]
  58. Tone, K. A slacks-based measure of efficiency in data envelopment analysis. Eur. J. Oper. Res. 2001, 130, 498–509. [Google Scholar] [CrossRef]
  59. Tone, K.; Sahoo, B.K. Degree of scale economies and congestion: A unified DEA approach. Eur. J. Oper. Res. 2004, 158, 755–772. [Google Scholar] [CrossRef]
  60. Li, H.; Li, W.; Yao, X. Spatial Characteristics and Dynamic Convergence Research on Provincial Total Factor Carbon Emissions Efficiency in China. Sci. Technol. Manag. Res. 2019, 39, 98–103. [Google Scholar] [CrossRef]
  61. Cheng, Z.; Li, L.; Liu, J.; Zhang, H. Total-factor carbon emission efficiency of China’s provincial industrial sector and its dynamic evolution. Renew. Sustain. Energy Rev. 2018, 94, 330–339. [Google Scholar] [CrossRef]
  62. Wang, K.; Wu, M.; Sun, Y.; Shi, X.; Sun, A.; Zhang, P. Resource abundance, industrial structure, and regional carbon emissions efficiency in China. Resour. Policy 2019, 60, 203–214. [Google Scholar] [CrossRef]
  63. Li, L.; Cai, Y.; Liu, L. Research on the Effect of Urbanization on China’s Carbon Emission Efficiency. Sustainability 2019, 12, 163. [Google Scholar] [CrossRef]
  64. Chen, P.; Shi, X. Dynamic evaluation of China’s ecological civilization construction based on target correlation degree and coupling coordination degree. Environ. Impact Assess. Rev. 2022, 93, 106734. [Google Scholar] [CrossRef]
  65. Li, W.; Wang, Y.; Xie, S.; Cheng, X. Coupling coordination analysis and spatiotemporal heterogeneity between urbanization and ecosystem health in Chongqing municipality, China. Sci. Total Environ. 2021, 791, 148311. [Google Scholar] [CrossRef]
  66. Quah, D.T. Empirics for growth and distribution: Stratification, polarization, and convergence clubs. J. Econ. Growth 1997, 2, 27–59. [Google Scholar] [CrossRef]
  67. Cheng, X.; Long, R.; Chen, H.; Li, Q. Coupling coordination degree and spatial dynamic evolution of a regional green competitiveness system—A case study from China. Ecol. Indic. 2019, 104, 489–500. [Google Scholar] [CrossRef]
  68. Lv, T.; Wu, C.; Li, H.; You, H.; Cai, X. The Coordination and Its Optimization About Population and Land of Urbanization:A Case Study of Nanchang City. Sci. Geogr. Sin. 2016, 36, 239–246. [Google Scholar] [CrossRef]
  69. Wang, S.; Gao, S.; Huang, Y.; Shi, C. Spatio-temporal evolution and trend prediction of urban carbon emission performance in China based on super-efficiency SBM model. Acta Geogr. Sin. 2020, 75, 1316–1330. [Google Scholar] [CrossRef]
  70. LeSage, J.; Pace, R.K. Introduction to Spatial Econometrics, 1st ed.; Chapman and Hall/CRC: Boca Raton, FL, USA, 2009. [Google Scholar] [CrossRef]
  71. Du, W.; Liu, X.; Liu, Y.; Xie, J. Digital Economy and carbon emission efficiency in three major urban agglomerations of China: A U-shaped journey towards green development. J. Environ. Manag. 2025, 373, 123571. [Google Scholar] [CrossRef]
  72. Liu, K.; Zhang, H.; Wang, L.; Zheng, W. Research on the Influencing Mechanism of New-type Urbanization on Land Use Carbon Emission Efficiency: Taking the Loess Plateau as an Example. China Land Sci. 2024, 38, 109–119. [Google Scholar]
  73. Wang, C.; Ibrahim, H.; Wu, F.; Chang, W. Spatial and temporal evolution patterns and spatial spillover effects of carbon emissions in China in the context of digital economy. J. Environ. Manag. 2025, 373, 123811. [Google Scholar] [CrossRef]
  74. Tian, L.; Wu, X. Urbanization, Technological Innovation and Regional Carbon Emission Performance. J. Tech. Econ. Manag. 2023, 8, 67–72. [Google Scholar] [CrossRef]
  75. Wu, J.; Bai, Z. Spatial and temporal changes of the ecological footprint of China’s resource-based cities in the process of urbanization. Resour. Policy 2022, 75, 102491. [Google Scholar] [CrossRef]
  76. Wang, Q.; Su, M. The effects of urbanization and industrialization on decoupling economic growth from carbon emission—A case study of China. Sustain. Cities Soc. 2019, 51, 101758. [Google Scholar] [CrossRef]
  77. Grether, J.; De Melo, J. Globalization and Dirty Industries: Do Pollution Havens Matter? National Bureau of Economic Research: Cambridge, MA, USA, 2003.
  78. Sun, X.; Liu, X. Spatiotemporal evolution and influencing factors of urban carbon emission efficiency in China: Based on heterogeneous spatial stochastic frontier model. Geogr. Res. 2023, 42, 3182–3201. [Google Scholar] [CrossRef]
Figure 1. Theoretical framework.
Land 14 01317 g001
Figure 2. Distribution of CDLUPU.
Land 14 01317 g002
Figure 3. Distribution of CEE.
Land 14 01317 g003
Figure 4. Spatial characteristic of CDLUPU and CEE.
Land 14 01317 g004
Figure 5. Kernel density estimation of CDLUPU and CEE.
Land 14 01317 g005
Figure 6. SDM results based on global and regional analysis.
Land 14 01317 g006
Figure 7. SDM results based on urban agglomerations.
Land 14 01317 g007
Table 1. Index evaluation system.
VariablesEvaluation IndicatorUnitWeight ValueIndicator Properties
Land urbanization (LU)Land scaleThe proportion of built-up areas%0.211+
Land inputEmployed persons per unit land aream2/person0.176+
Fixed assets investment per land yuan/m20.139+
Land outputPer land of the GDPyuan/m20.229+
The added value of secondary and tertiary industries per landyuan/m20.245+
Population urbanization (PU)Population scaleProportion of urban population%0.104+
Living standardPer capita disposable income of urban residentsyuan/person0.181+
Per capita green aream2/person0.586+
Industrial structureThe proportion of value-added from the secondary industry in GDP%0.068+
The proportion of value-add from the tertiary industry in GDP%0.061+
Table 2. Regression results of SDM.
Variables MainWx
lnCDLUPU0.126 **1.910 ***
(0.04)(0.00)
lnPGDP0.065 ***−1.032 ***
(0.01)(0.00)
lnGOV−0.245 ***0.970 ***
(0.00)(0.00)
lnIND−0.219 ***−0.863 ***
(0.00)(0.00)
lnTI−0.002−0.041
(0.72)(0.45)
lnPOP0.0350.509
(0.38)(0.11)
lnOPN0.004−0.009
(0.27)(0.75)
rho0.432 ***
(0.00)
sigma2_e0.018 ***
(0.00)
Notes: *** p < 0.01, ** p < 0.05.
Table 3. Direct, indirect, and total effects.
Variables Direct EffectIndirect EffectTotal Effect
lnCDLUPU0.138 **3.483 ***3.621 ***
(0.03)(0.00)(0.00)
lnPGDP0.058 **−1.773 ***−1.715 ***
(0.01)(0.00)(0.00)
lnGOV−0.239 ***1.561 ***1.322 ***
(0.00)(0.00)(0.00)
lnIND−0.226 ***−1.729 ***−1.955 ***
(0.00)(0.00)(0.00)
lnTI−0.003−0.075−0.078
(0.67)(0.43)(0.41)
lnPOP0.0400.915 *0.955 *
(0.31)(0.09)(0.08)
lnOPN0.003−0.011−0.008
(0.28)(0.82)(0.87)
Notes: *** p < 0.01, ** p < 0.05, * p < 0.1.
Table 4. Endogeneity test.
VariablesThe Control Variable Lags One Phase
CDLUPU0.319 ***
(0.0639)
Constant1.218 ***
(0.435)
Control variableYes
Fixed effectYes
Number of id276
Note: *** p < 0.01.
Table 5. Robustness test.
Variables Change the Measure of Dependent VariableShorten Sample PeriodExclude Municipalities
(1)(2)(3)
lnCDLUPU0.375 **0.221 ***0.135 **
(0.00)(0.01)(0.03)
Wx lnCDLUPU4.538 ***1.856 *1.660 ***
(0.00)(0.06)(0.00)
ρ0.347 ***0.516 ***0.403 ***
(0.00)(0.00)(0.00)
Control variableyesyesyes
Number of id276276276
Note: *** p < 0.01, ** p < 0.05, * p < 0.1.
Disclaimer/Publisher’s Note: The statements, opinions and data contained in all publications are solely those of the individual author(s) and contributor(s) and not of MDPI and/or the editor(s). MDPI and/or the editor(s) disclaim responsibility for any injury to people or property resulting from any ideas, methods, instructions or products referred to in the content.

