Article

From Global to Local: Testing the UNEP Environmental Vulnerability Index in a Coastal Korea Context

by
SaMin Han
Department of Landscape Architecture and Environmental Design, Mississippi State University, Box 9725, Mississippi State, MS 39762, USA
Land 2025, 14(6), 1297; https://doi.org/10.3390/land14061297
Submission received: 18 April 2025 / Revised: 16 June 2025 / Accepted: 17 June 2025 / Published: 18 June 2025
(This article belongs to the Special Issue Vulnerability and Resilience of Urban Planning and Design)

Abstract

As climate change intensifies, assessing vulnerability at territorial levels such as cities, countries, and regions is essential for effective adaptation planning. This study evaluates the applicability of the United Nations Environment Programme and South Pacific Applied Geoscience Commission’s Environmental Vulnerability Index (EVI) for coastal regions in South Korea. By adapting and localizing 50 international indicators and a Geographic Information System framework, this research developed a Korean Coastal Vulnerability Index and used spatial regression analysis to compare results to historical water-related disaster data from 2010 to 2019. The findings reveal that contrary to South Korea’s global classification of “extremely vulnerable”, most coastal counties appear relatively resilient when viewed through the localized model. Sub-index analyses indicate that ecological and anthropogenic damage factors show the strongest correlation with past disasters among the hazard, resistance, and damage categories. While the model’s explanatory power was modest (R2 = 0.017), the regression nonetheless provides meaningful insight into how global indices can reflect local vulnerability patterns. The regression results confirm that based on historical hazard records, the international model effectively predicts Korean coastal vulnerability. It demonstrates the potential of scaling down global models to fit national contexts, offering a replicable approach for countries lacking localized vulnerability frameworks. It advances climate adaptation research through methodological innovation, policy-relevant spatial analysis, and theoretical insights into the multidimensional nature of vulnerability. The results support more precise, data-driven resilience planning and promote international collaboration in climate risk management.

1. Introduction

Climate crises have been threatening many coastal communities and ecosystems around the world. Preparations for climate change and future uncertainty should begin by identifying vulnerable areas [1,2,3]. Resilience is defined as “the ability of a system, community, or society exposed to hazards to resist, absorb, accommodate, and recover from the effects of a hazard in a timely and efficient manner” [4] p. 3. Specifically, resilience in planning for a certain region means the ability to “prepare and plan for, absorb, recover from, and more successfully adapt to” future changes [5] p. 1. Vulnerability, often understood as the opposite of resilience, is defined as exposure to stresses such as climate change and future uncertainty [2,6].
However, the concept of vulnerability to climate change has undergone significant evolution in recent decades. Early frameworks focused predominantly on exposure and sensitivity to hazards; however, more recent scholarship and assessments such as the IPCC Sixth Assessment Report (AR6) define vulnerability as the propensity or predisposition to be adversely affected, encompassing both sensitivity and adaptive capacity [1]. The IPCC emphasizes that vulnerability is shaped not only by biophysical conditions but also by social, economic, and institutional contexts, thus highlighting the need for multidimensional and spatially explicit assessments that inform equitable adaptation strategies.
The EVI is the first comprehensive measurement tool to operate on a global scale. It was developed by the United Nations Environment Programme (UNEP) and South Pacific Applied Geoscience Commission (SOPAC) in 2004 to determine the relative vulnerability scores for 243 nations, as measured through 50 different indicators. In its application, each country was categorized into one of five risk levels: “resilient”, “at risk”, “vulnerable”, “highly vulnerable”, or “extremely vulnerable” [7] p. 7. This categorization drew global attention to climate change, highlighting that its impacts might vary substantially from one region to another [7].
Since the release of this index, many institutions and countries have become more aware of the future risks posed by climate change. For instance, Fajardo-Gonzalez et al., (2025) introduced the Multidimensional Vulnerability and Lack of Resilience Index (MVLRI), which uses data envelopment analysis to endogenously generate country-specific aggregation weights for 26 economic, social, and environmental indicators [8]. Unlike fixed-weight models, the MVLRI reflects each country’s unique profile of vulnerability and resilience, offering more tailored policy guidance and advancing the analytical depth of global climate risk assessments. On the sub-national level, particularly in the context of environmental justice, the US Climate Vulnerability Index (CVI) represents a state-of-the-art example of fine-scale vulnerability mapping. Developed by the Environmental Defense Fund and Texas A&M University, the CVI integrates 184 indicators at the census-tract level to highlight compounding risks related to housing, health, infrastructure, and exposure to environmental hazards. Its emphasis on cumulative vulnerability and climate equity is increasingly seen as a model for just adaptation planning [9].
Regarding coastal regions, where vulnerability is amplified by sea-level rise and socio-ecological exposure, researchers have underscored the importance of integrated frameworks for vulnerability assessment. Olivares-Aguilar et al., (2022) [10] reviewed methodologies for assessing climate vulnerability and cumulative environmental impacts in data-poor coastal regions. Their work highlights the utility of the IPCC’s Reasons for Concern framework in evaluating exposure to multiple climate-related risks, particularly in regions where ecosystems and human livelihoods are tightly coupled. Kasthala et al., (2023) [2] conducted a systematic review of 84 quantitative vulnerability assessment studies published between 1990 and 2020. They categorized methodologies into index-, clustering-, and GIS-based approaches and found that while socioeconomic vulnerability is the most commonly assessed dimension, environmental and spatial factors are often underrepresented due to data limitations. The study calls for greater methodological clarity and encourages the adoption of multidimensional, indicator-based frameworks that reflect the evolving IPCC definitions of risk and vulnerability.
Despite these advancements, several critical gaps remain in the current body of climate vulnerability assessment literature. First, while many studies have developed global or national indices, relatively few have directly downscaled and adapted such frameworks to the regional or municipal level. Second, most existing assessments have either focused on socioeconomic vulnerability alone or treated environmental indicators in isolation, failing to integrate diverse dimensions into a cohesive and spatially explicit framework. Finally, there remains a lack of empirical validation of vulnerability indices using actual historical disaster outcomes, which limits confidence in their real-world applicability and decision-making utility.
South Korea has experienced a growing frequency and severity of water-related disasters, including floods and coastal inundation, particularly in the context of climate change. Recent events such as the 2022 Seoul flood, the heaviest rainfall in 80 years that caused significant damage in the Gangnam district, and the 2023 monsoon floods, which resulted in at least 47 fatalities and over KRW 750 billion (approximately USD 590 million) in damages, underscore the increasing vulnerability of both urban and rural areas to extreme weather events [11]. Empirical studies have identified multiple flood-vulnerable municipalities across the country, highlighting the need for differentiated regional responses [12]. Additionally, coastal communities remain less resilient than inland areas, requiring integrated planning to reduce future risk [13]. These trends reflect the urgent need for localized, evidence-based vulnerability assessments that can inform climate adaptation and disaster risk reduction strategies.
In these contexts, this research applied the global UNEP and SOPAC indication system to analyze the climate vulnerability of coastal regions in South Korea. Additionally, this study verified the effectiveness of this system within the national setting by comparing the results to the past 10 years of hazard data. This scaled-down approach serves as a methodological case study providing ways to connect currently fragmented and biased projects on climate change preparation, for the benefit of those seeking to evaluate national vulnerability levels more efficiently than can be achieved with existing indication systems. The spatial regression method used herein also provides a framework for evaluating current indication systems. The vulnerability index for the Korean coastal cities studied here, which is the outcome of spatial modeling, will also be helpful to the Korean government by providing comparable vulnerability levels of the nation’s coastal counties. These evaluations and reflections will guide future research conducted by the Korean government and aid policymaking and the efficient allocation of resources. Finally, this multiscale study offers a valuable framework for international, national, and local collaboration, enhancing the effectiveness and precision of research and planning projects related to climate change adaptation.

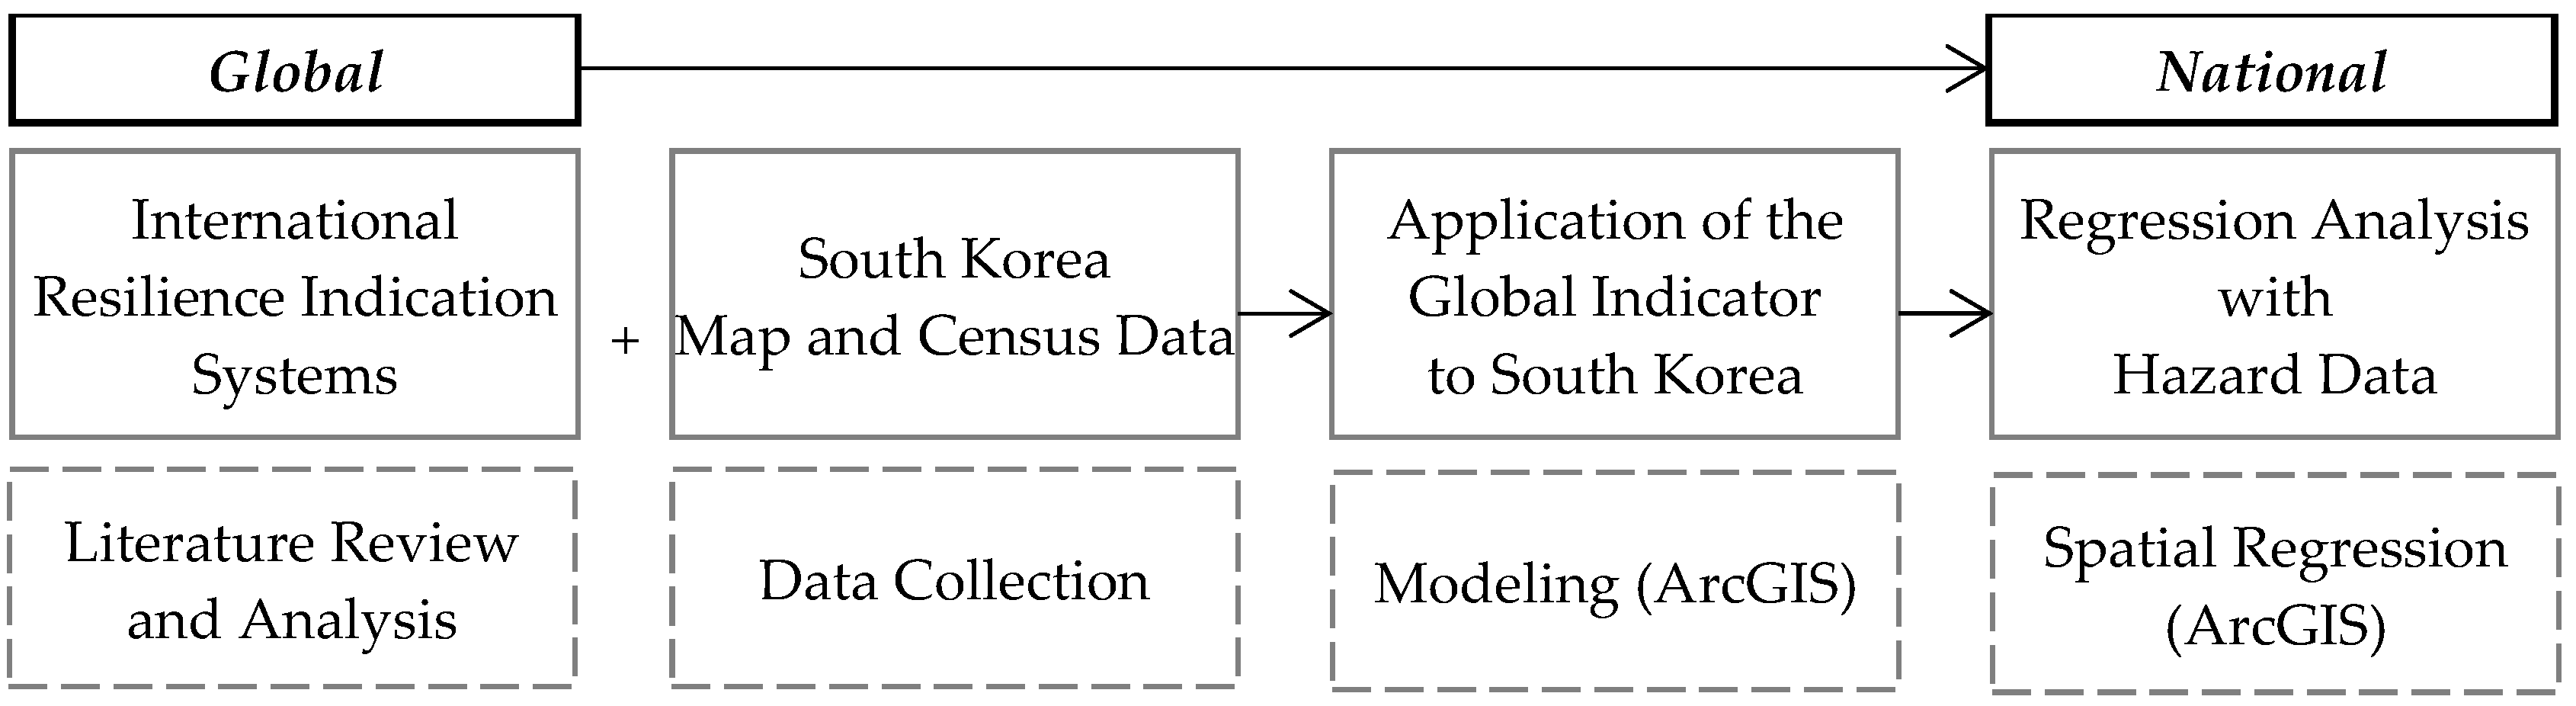
2. Material and Methods

The following processes and materials were used to determine whether the UNEP and SOPAC EVI (UNEP EVI) is effective in assessing and predicting the vulnerability of South Korea’s coastal regions. This study explored the international indication system, a pioneering global model. The research process encompassed the international framework, composition, equations, and criteria used to determine the final indexing of the subject nations. Spatial and census data for South Korean coastal cities were amassed as basic data, and historic hazard data were collected for the regression process (Figure 1).
In this paper, a coastal zone was defined based on the administrative boundaries of counties with direct geographic adjacency to the coastline. A total of 94 coastal counties (si, gun, and gu) were selected for analysis. The rationale for focusing solely on coastal administrative units was to align with the study’s objective of evaluating the climate vulnerability specific to coastal communities at heightened risk from sea-level rise and water-related hazards.
The majority of the raw data was sourced from the Korean Statistical Information Service [14] and e-National Index [15]. Additional data were procured from the websites of the Korea Meteorological Administration [16] and Ministry of Oceans and Fisheries [16], as well as other governmental sites. The study then evaluated the extent to which both the national and international indication models accounted for past hazard events spanning from 2010 to 2019.

2.1. UNEP and SOPAC Environmental Vulnerability Index

The UNEP EVI emerged from a 1999 global collaboration involving various national governments and private institutions. The primary goal of this index was to enhance public comprehension of environmental vulnerability and resilience and provide tangible assessments to 243 distinct nations [17]. Fifty indicators were utilized to provides analytical reports to the 243 nations.
UNEP and SOPAC conceptualized vulnerability as an amalgamation of three facets: inherent vulnerability, hazard risk, and acquired resilience. Consequently, the indicating system is derived from 50 indicators that encompass 32 hazard and 8 resistance facets, along with 10 additional facets related to damage [18]. These 50 indicators are further segmented into seven sub-indices addressing policy-relevant subjects: climate change, biodiversity, human health aspects, agriculture and fisheries, water, desertification, and exposure to natural disasters.
The indicators span a diverse range of variables, whether numerical, qualitative, uneven, or discontinuous. Each indicator’s scale is individually determined. Some indicator values retain their original form, while others undergo transformation into natural logarithms and are then scaled based on land area, population, boundary lines, or other pertinent numerical facets.
These numerical vulnerability levels culminate in an overarching national vulnerability index. Each national EVI is ascertained by either averaging or aggregating vulnerability facets, problem types, or sub-indices into five categories [18]. If the cumulative EVI ranges 365–999, a country is deemed “extremely vulnerable”. Nations scoring between 315 and 365 are categorized as “highly vulnerable”, scores between 265 and 315 are “vulnerable”, those between 215 and 265 are “at risk”, and those under 215 are “resilient” [7] p. 7. The world distribution of overall EVI scores was found to be roughly normally distributed, with 35 countries considered extremely vulnerable. These nations were as follows: Austria, Jamaica, Pakistan, Belgium, Japan, the Philippines, the Cook Islands, Kiribati, Singapore, India, Trinidad and Tobago, Israel, Lebanon, the United Kingdom, Italy, the Netherlands, and South Korea [7].

2.2. Application of the UNEP EVI to Coastal Cities in South Korea

The construction of the UNEP EVI-based Coastal Vulnerability Index (CVI) for South Korean coastal cities was conducted according to the following four-step methodological framework. First, indicators were collected and scaled in the same manner as outlined in the international model. For example, the raw data for indicators such as “11. Land Area”, “12. Country Dispersion”, and “13. Geographic Isolation” were measured and calculated in ArcGIS Pro 2.9 using the same intervals as the UNEP EVI. The approach was also applied to Indicators 14, 18, 24, 25, 26, 35, 37, 39, 42, 44, 45, and 46.
Second, for indicators where equivalent data from Korean governmental agencies were not available, this study substituted alternative data that aligned with the original definitions and objectives. This type of data was recalibrated the scaling intervals to match the format and range of the Korean data. For example, the UNEP EVI’s “6. Sea Temperatures” uses a 30-year ratio (1961–1990) of monthly means to assess average annual sea surface temperature deviations (unit: °C/year) over the preceding 5 years. However, the Korean coastal vulnerability indication system used the annual seawater temperature increase rate (unit: %) over the past 10 years (2001–2010), which was the only available related dataset for Korea.
In the case of “9. Tsunamis”, the original system considered information on the number of storm surges or tsunamis with run-ups higher than two meters above “the mean high-water spring (MHWS)” tide along 1000 km of coastline from 1900 to 2000. However, there have only been two major tsunamis causing damage in the last 100 years in South Korea, affecting most of the Korean Peninsula. Thus, a comparison among Korean counties was not applicable for these past data. This research used each county’s vulnerability level with regards to infrastructure protecting from typhoons in the past 10 years (2001–2010), as obtained from the Korean system, called VESTAP (instead of large tsunamis of record) to reflect the original meaning of the indicator. The indicators corresponding to this category were 1, 3, 4, 5, 6, 8, 9, 10, 15, 30, 31, 32, 34, 38, 40, 41, 43, 47, and 48.
The next category of data collection involved modification of the original indicators to fit local Korean conditions. For instance, for the indicator “49. Environmental Agreements”, UNEP and SOPAC used the number of environmental agreements to measure national stewardship or management ability related to the environment. However, in South Korea, environmental policy is largely centralized at the national level, with minimal variation across local governments. Thus, the CVI replaced this with the number of local public officials responsible for disaster management, as a proxy for administrative engagement with environmental issues. This category included Indicators 2, 17, 19, 20, 21, 22, 23, 27, 28, 29, 36, 49, and 50.
Lastly, certain indicators were excluded due to a lack of variation or misalignment with the Korean context. For example, for “7. Volcanoes”, the entirety of South Korea was calculated as being of the safest grade, according to the UNEP reference [19]. For “16. Shared Borders”, the international system held that the smaller the number of shared borders, the more resilient the area would be (pp. 97–101, ref. [7]). However, conflicts along borders between neighboring counties are very rare in South Korea. Rather, neighboring counties often complement each other’s resources and workforce, and thus, adjacent areas tend to be more resilient; thus, this indicator was omitted from the final CVI.
The following table compares the original indicators and application model for South Korea in terms of the calculation method (units) and scaling process (intervals) (Table 1).

2.3. Historical Water Disaster Data for Korean Coastal Counties
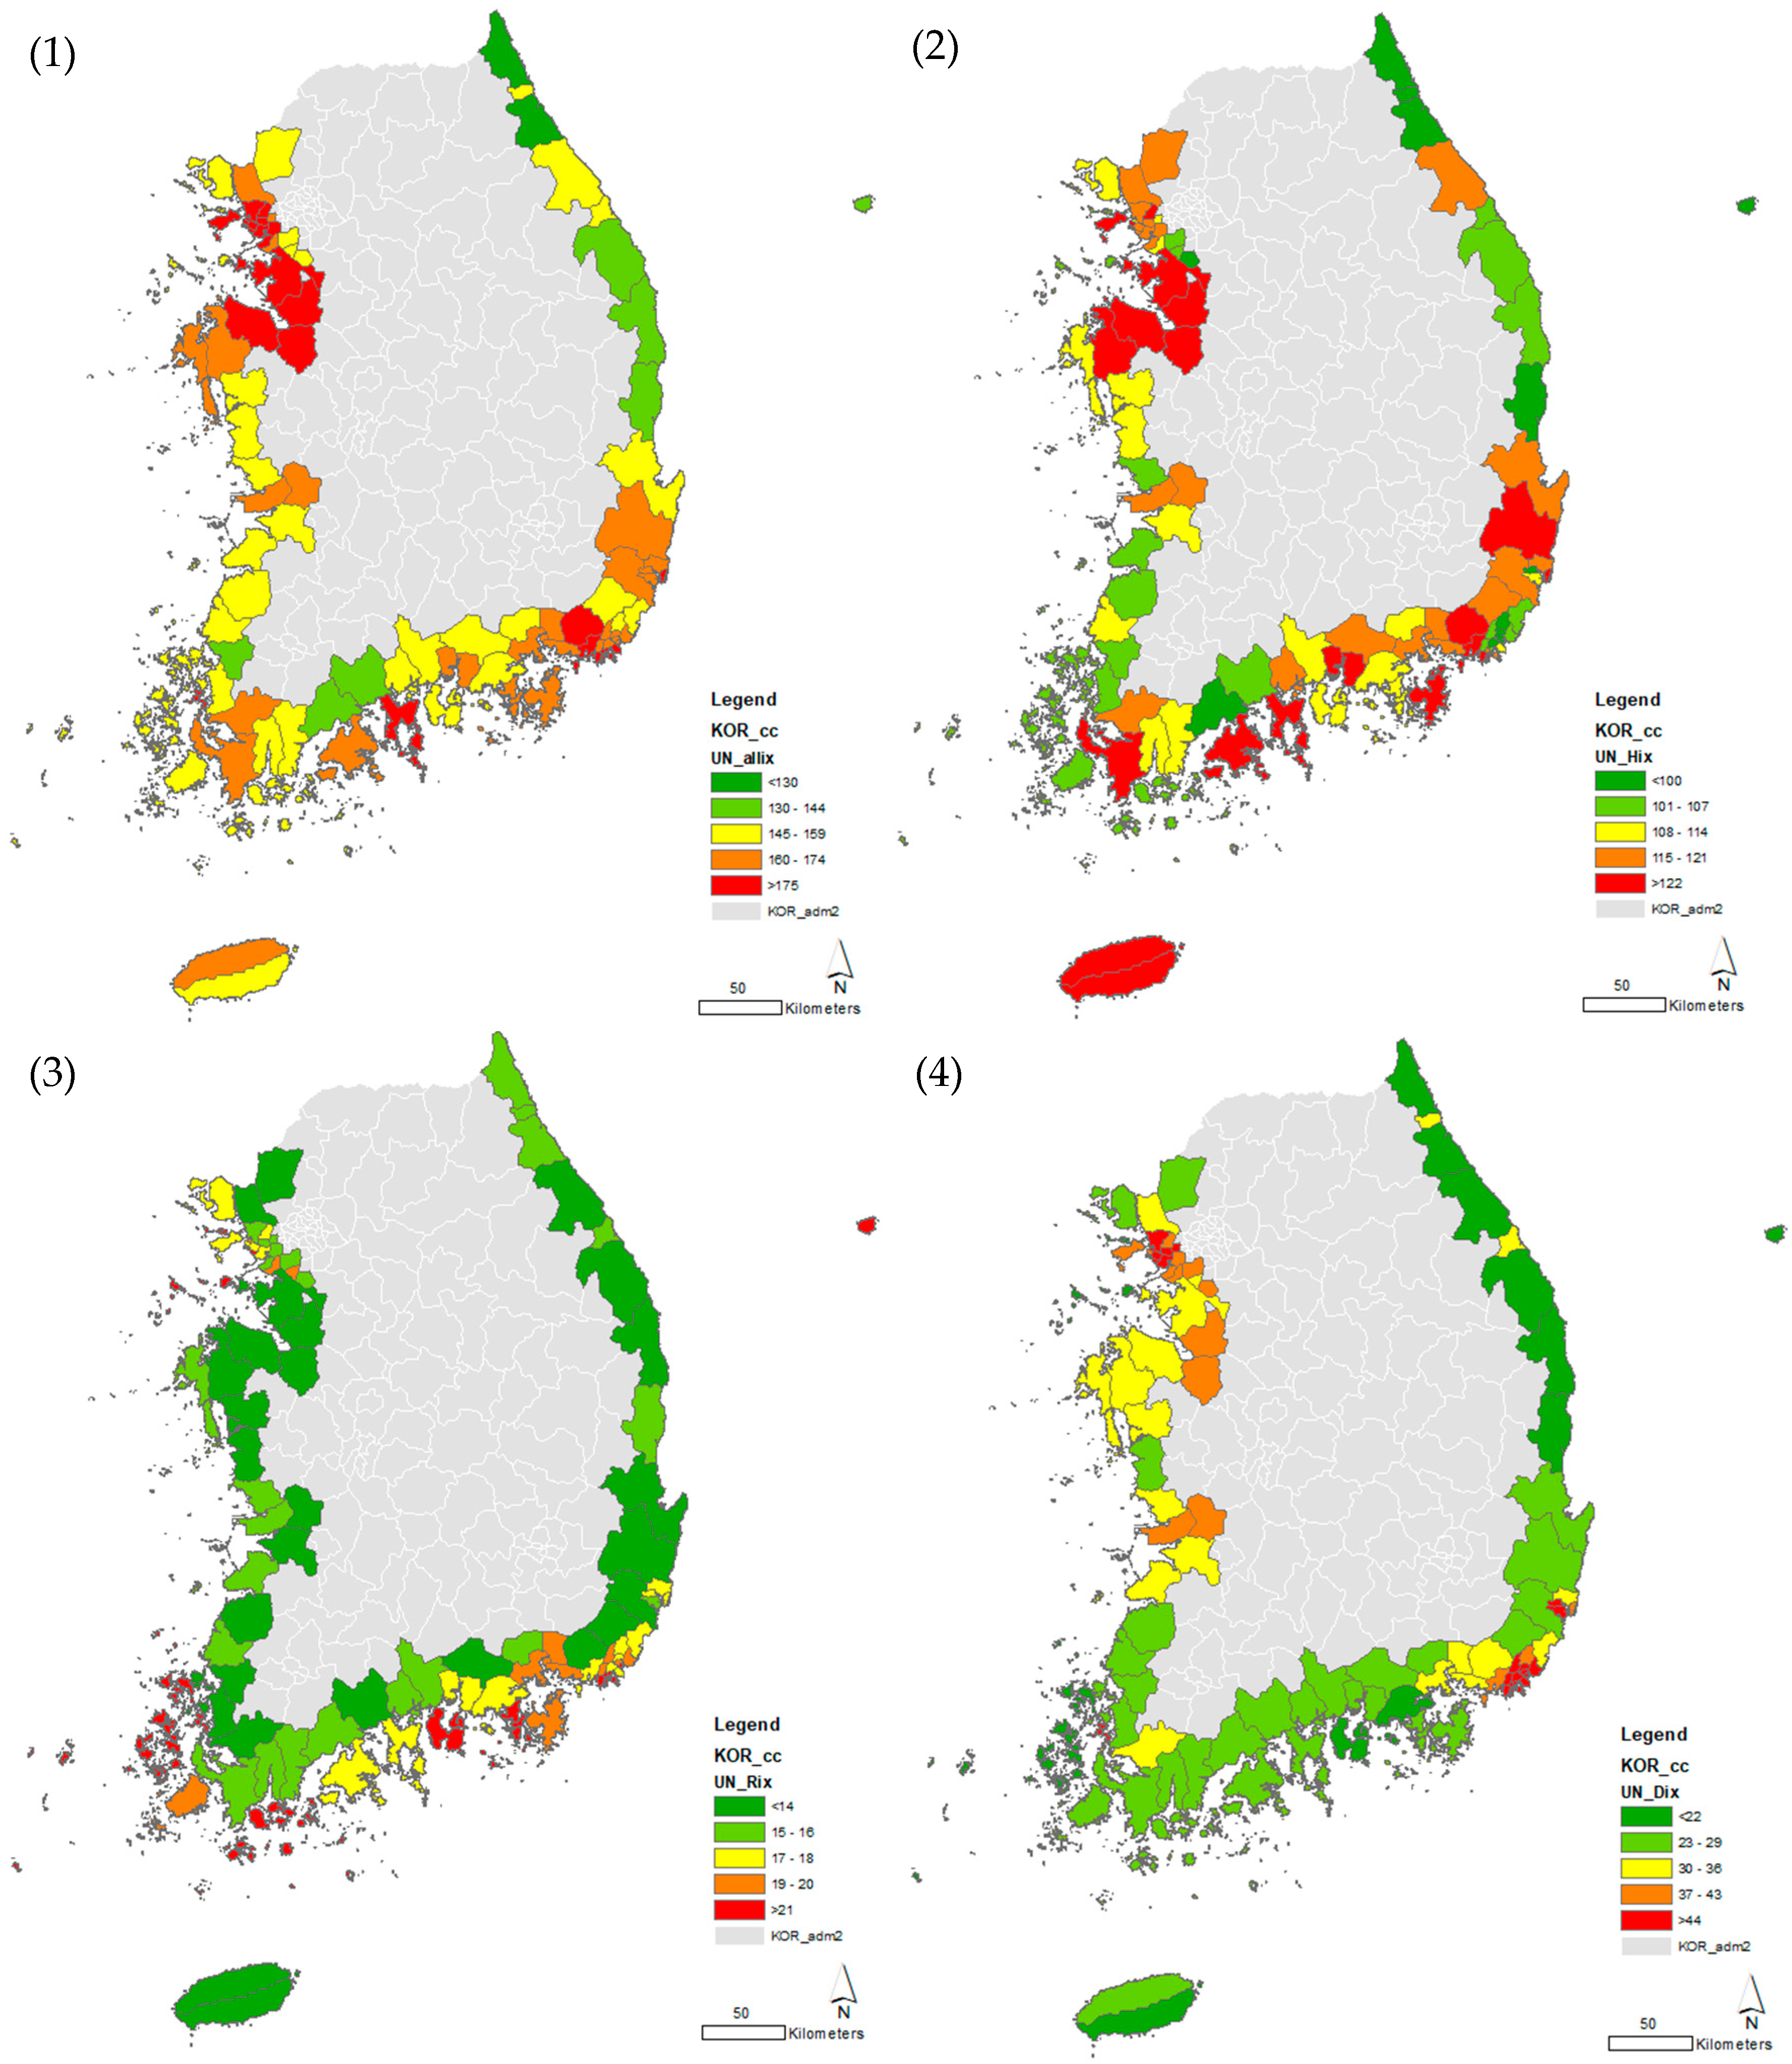
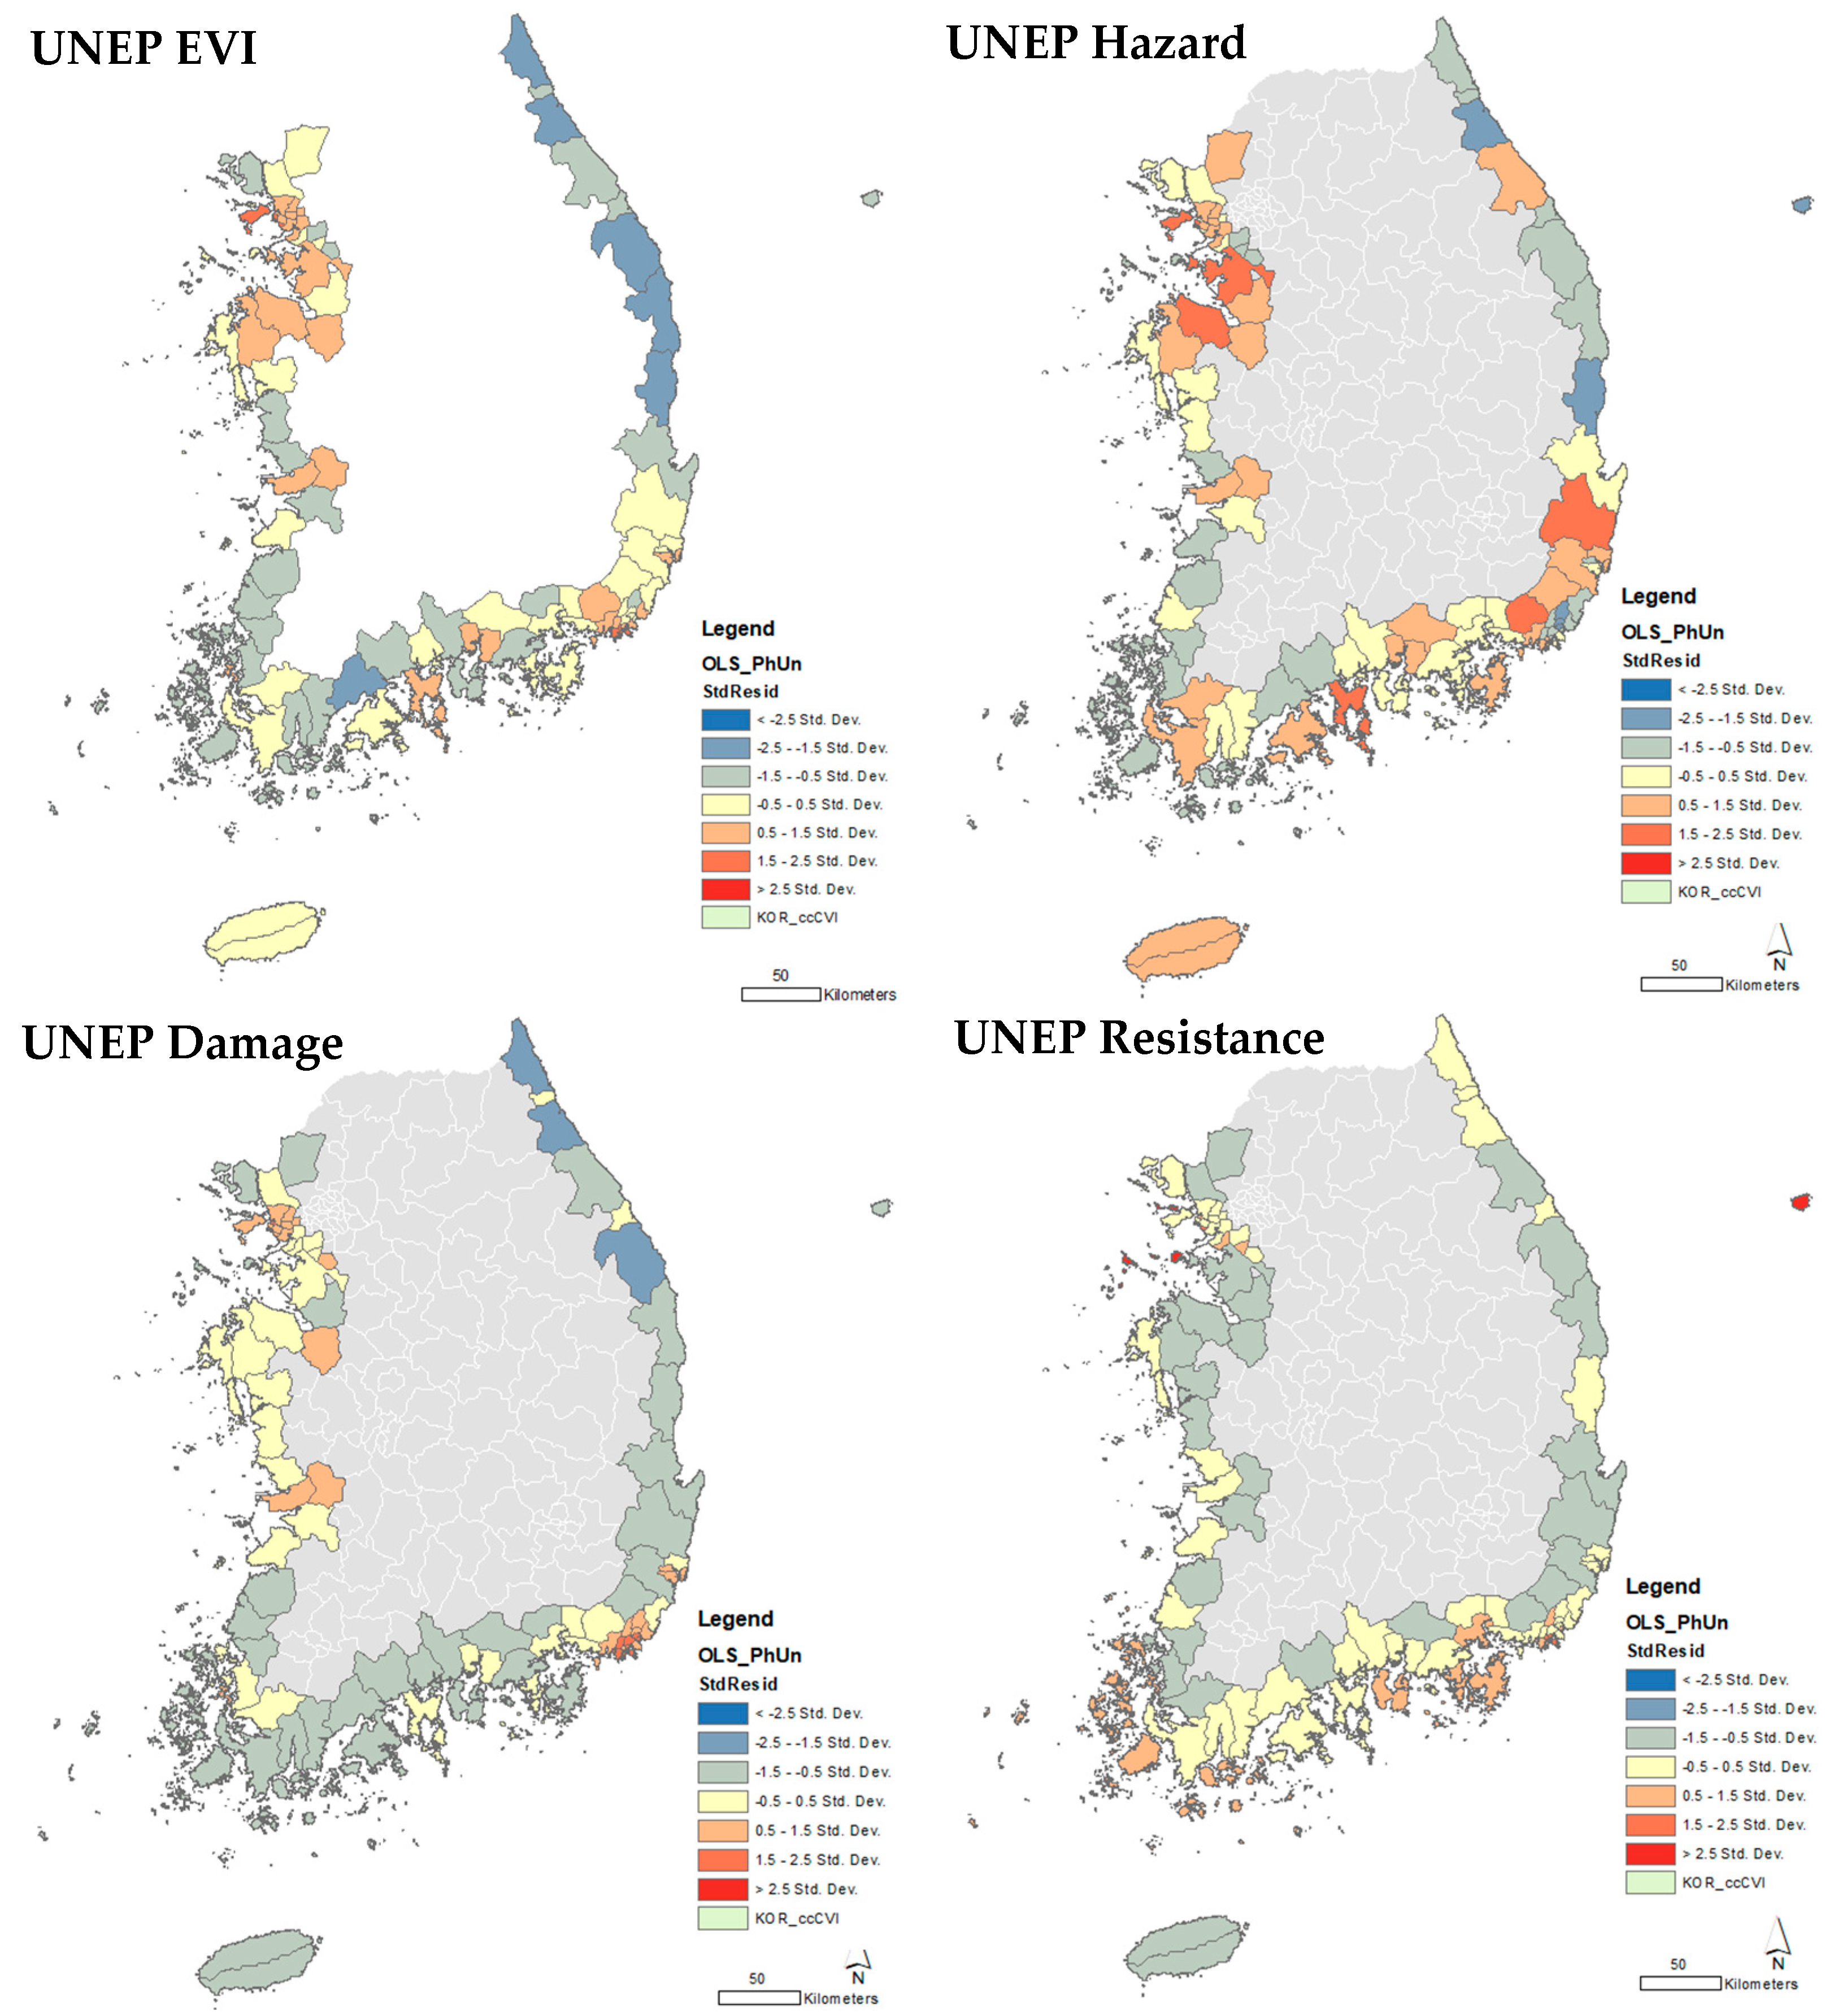
To ascertain the validity of the UNEP EVI in predicting Korean coastal vulnerability, this research explored records related to water disasters affecting the nation’s coastal areas, amassing data on inundated population numbers and property damage from 2010 to 2019. The number of individuals impacted by water disasters (unit: people) was sourced from the Disaster Statistical Yearbook maintained by the Ministry of Public Administration and Security and aggregated and incorporated into a map [20]. The quantum of property damage resulting from water disasters (unit: KRW 1000) was gleaned from the National Water Resource Management Comprehensive Information System [21]. The final water disaster map was crafted by multiplying the two datasets at the county level (see Figure 2).
To achieve this objective, a map of prior hazards was crafted using the Modeling Spatial Relationships Toolset in ArcGIS. Then, ordinary least squares (OLS) linear regression was employed to validate the relationships among the maps and gauge the relative vulnerability levels of the 94 Korean coastal counties.
Among the myriad features, the multiple R-squared value was predominantly used to compare the spatial relationships of the two models. R-squared values quantify model performance, signifying the degree of explanation or prediction of the model. Potential values span from 0 to 1, which can be construed as a prediction rate of 0–100% [22]. The R-squared value can then be interpreted as the level of congruence between the two maps. The OLS regression also furnished the coefficient value, which mirrored the relationship type and intensity between the explanatory and dependent variables. When the coefficient value was positive, the relationship was positive, and vice versa [22].
The dependent variable was the cumulative water-related disaster impact from 2010 to 2019, constructed by multiplying the number of affected individuals [20] and the monetary value of the property damage [21] at the county level. Independent variables included the overall CVI, as well as its three sub-indices: hazard, resistance, and damage. All spatial data were normalized prior to regression to ensure comparability and reduce scale-related bias [22]. The analysis was conducted using the Modeling Spatial Relationships Toolset in ArcGIS, which automatically tests for spatial autocorrelation in residuals and model validity through Koenker and Jarque–Bera statistics. The use of these diagnostics allowed us to confirm the spatial independence of the residuals, fulfilling a key assumption of OLS regression in a geospatial context [22]. This method enabled a quantitative validation of the UNEP EVI framework by linking it to historical disaster outcomes, thus enhancing the methodological rigor and interpretability of the vulnerability assessment.

3. Results

3.1. Korean Coastal Vulnerability Index Map

The GIS spatial regression analysis yielded meaningful results. In the resulting map, the vulnerability level of Korean coastal counties ranged from 125 to 196 (median: 162.5, average: 162.5, and standard deviation: 15.07). All coastal counties in South Korea were deemed resilient (as per the original categorization by the international system: 1–215). This outcome was in stark contrast to the original assessment, which labeled South Korea as “extremely vulnerable” [17] p. 21.
Given the paramount importance of identifying regions with heightened vulnerability to prioritize management or fortification ahead of formulating national policies and planning strategies, this study retained the indexes. The intervals in this application were determined by considering the minimum, maximum, and mean values of each indicator’s data range. The final classification was adjusted to five intervals: (1) less than 130: resilient; (2) 130–144: at risk; (3) 145–169: vulnerable; (4) 160–174: highly vulnerable; and (5) 175 or higher: extremely vulnerable. The ultimate vulnerability index map for Korean coastal cities is presented in Figure 3.
According to the vulnerability index map employing the UNEP EVI framework, the vulnerability levels for the 94 coastal counties are reported, as shown below (see Table 2). Saha-gu (CVI: 196), Seo-gu (192), Yeongdo-gu (189), Gangseo-gu in Busan (184), Yeonsu-gu (191), Jung-gu (188), Gyeyang-gu in Incheon (184), and Dong-gu in Ulsan (183) emerged as the top 10 coastal cities in South Korea most susceptible to climate change.
Sub-index maps were also crafted by dividing the indicators into three facets of vulnerability: (1) hazard, (2) resistance, and (3) damage (see Figure 4). The hazard sub-index, which corresponds to 32 of the 50 indicators, most closely mirrored the overall CVI. This sub-index signifies potential threats to the regional environment as gleaned from historical hazard events, reflecting the intensity, frequency, and likelihood of the threat. The resistance sub-index indicators exemplify the inherent capacity to manage both natural and anthropogenic hazards. Numerous counties with smaller islands were flagged as vulnerable by this sub-index. Lastly, the damage sub-index, composed of 10 indicators, conveys the ecological vulnerability of each region. Several populous coastal cities were identified as the most vulnerable by this sub-index [18].

3.2. OLS Linear Regression: UNEP EVI and Previous Disaster Map

The global indication system developed by UNEP and SOPAC provided some representations of past disasters in South Korea. The CVI and Previous Disaster Map correlated according to the OLS linear regression results. The coefficient between the international model and Previous Disaster Map was 0.005352, indicating the relationship between the maps. The multiple R-squared value stood at 0.016528, signifying that the international system accounted for approximately 1.7% of the variation in water-related hazards in South Korea. The result was deemed valid, as it was geographically independent according to the Koenker statistic; the residuals of the model followed a normal distribution, as indicated by the Jarque–Bera statistic.
To assess how effectively the international model represented the national context, OLS regressions were performed for each of the sub-indices comprising the UNEP EVI: (1) hazard, (2) resistance, and (3) damage. The findings revealed that the damage sub-index was statistically robust and bore the closest correlation with past disasters in South Korea, with a multiple R-squared value of 0.051901. Conversely, the UNEP hazard index displayed a negative relationship (−0.000295) without statistical significance, and the resistance sub-index also demonstrated an inconclusive relationship with the Previous Disaster Map (Figure 5).

4. Discussion

The results revealed a wide distribution of vulnerability scores across coastal regions, with most counties falling into the moderate range (125–196; scores under 215 are regarded as “resilient” in the UNEP EVI). While the global indicator originally categorized South Korea as “extremely vulnerable,” the scaled-down application to coastal regions alone indicated that most counties were actually resilient. This discrepancy underscores a key challenge in transferring global indices to subnational scales to reflect national-level categorization; this often masks local variability, especially in highly urbanized and infrastructure-rich areas.
In addition, the global scoring thresholds used here were retained from the original UNEP system without national recalibration, which may not fully reflect the Korean socio-environmental context. Similar challenges were noted in US efforts to refine vulnerability assessments to the census-tract level [9], as well as in the DEA-based MVLRI framework, which adjusts weights to reflect local conditions [8]. These studies reinforce the idea that vulnerability is not fixed but rather highly sensitive to scale, indicator weighting, and socio-environmental context. These factors suggest that global frameworks can be adapted to national or regional contexts; however, standardized thresholds may not capture local nuance without recalibration.
The findings particularly highlight the relative strength of the damage sub-index, which demonstrated the most robust association with actual disaster impacts (R2 = 0.0519). This result aligns with global observations that ecological and anthropogenic stressors such as environmental degradation, population density, and land-use pressures are among the strongest predictors of disaster vulnerability [2,10]. Conversely, the weaker correlation found in the hazard and resistance sub-indices points to the limitations of standalone exposure or infrastructure metrics when used without integration into a broader socio-environmental framework. The hazard sub-index, which includes climatic and geological risk indicators, most closely mirrored the overall vulnerability index. The resistance sub-index captured infrastructural and geographic resilience but identified small island regions as particularly vulnerable due to isolation and resource limitations.
These results contribute to a growing body of literature that calls for multidimensional, spatially explicit vulnerability assessments. While many existing national models rely on either environmental or socioeconomic indicators in isolation, this study demonstrates the potential value of combining an approach consistent with the IPCC AR6 emphasis on integrating sensitivity, exposure, and adaptive capacity [1]. Furthermore, by comparing index scores to real-world disaster outcomes, this research responds directly to the literature’s identified gap with regards to the empirical validation of vulnerability models [2].
Beyond methodological refinement, this study carries broader implications for climate adaptation planning in South Korea and other coastal nations. The spatially disaggregated CVI maps produced here can aid regional governments in prioritizing investments and interventions based on locally relevant dimensions of vulnerability. For example, the identification of small island counties as particularly vulnerable in the resistance sub-index echoes international findings indicating that isolated communities often lack sufficient adaptive infrastructure [13]. Thus, even in high-capacity countries, localized assessments can reveal under-addressed vulnerabilities that national averages obscure.
At a policy level, these findings suggest that international models can serve as valuable supplementary tools for countries with existing national frameworks. It offers a template for such adaptation by showing how global tools can be restructured to enhance local decision making. It also opens the door for more cross-scalar collaboration, wherein global knowledge infrastructure supports national and subnational planning needs.

5. Conclusions

This research employed advanced research techniques on a global scale, specifically targeting South Korea. By localizing and operationalizing 50 global indicators within a GIS modeling framework, it produced a Korean CVI and tested its explanatory relevance by comparing it to 10 years of historical disaster records via spatial regression analysis. The results demonstrate that while the overall explanatory power of the model was modest, the damage sub-index showed the strongest correlation with historical disaster impacts, underscoring the value of ecological and anthropogenic indicators in vulnerability assessment. Importantly, the application of the UNEP EVI to South Korean coastal cities revealed clear spatial variations in vulnerability, emphasizing the relevance of downscaling global frameworks to capture localized climate risks.
However, several limitations should be acknowledged. The regression model explained only a small portion of the observed variation (R2 = 0.017), indicating that the international system in its current form lacks sufficient predictive strength. Additionally, this study retained the original global scaling thresholds without country-specific recalibration, which may have limited its contextual accuracy. This limitation suggests that while the model offers a useful framework, its predictive capability remains constrained and should be interpreted with caution. To address these limitations, future research should explore dynamic weighting schemes, incorporate qualitative and institutional indicators, and expand the geographic scope to include inland areas and transboundary coastal zones. Empirical validation should also be extended to other types of climate-related hazards and include longitudinal data to assess vulnerability trends over time.
While the statistical explanatory power of the model was modest, this paper makes a meaningful contribution by demonstrating a scalable and testable methodological framework for vulnerability assessment. It also emphasizes the importance of grounding index-based models in real-world outcomes and policy applicability. Future research should build upon this foundation by incorporating qualitative indicators, testing additional regions, and further refining calibration methods to improve predictive accuracy while preserving practical utility.
In the face of the current climate crisis, impact analyses, adaptive planning, and resilient urban designs that focus on preparing for climate change have become paramount in the field of city planning. Coastal regions and communities in South Korea have grappled with extreme weather events and face existential threats from the climate crisis. By accurately diagnosing current vulnerability levels and forecasting future hazard risks, national and local governments can allocate their limited resources more effectively to pertinent resilience projects and programs. The methodologies proposed here not only bolster Korean coastal resilience but also enhance vertical coordination in climate research among international, national, and local scholars and professionals.
The process of scaling down offers a blueprint for nations without their own climate change indication systems, enabling them to efficiently devise assessment models by leveraging global research on the subject. Using the spatial regression method for making comparisons with past hazard data is innovative and holds promise for applications across various disciplines. Ultimately, it affirms that accurate, multilevel vulnerability assessments are not only achievable but essential to guiding equitable and targeted climate adaptation strategies worldwide.

Funding

This research received no external funding. The article processing charge (APC) was supported by the author’s personal research fund at Mississippi State University.

Data Availability Statement

The original contributions presented in the study are included in the article, further inquiries can be directed to the corresponding author.

Conflicts of Interest

The author declares no conflict of interest.

References

  1. Intergovernmental Panel on Climate Change (IPCC). Sixth Assessment Report, Working Group II: Impacts, Adaptation and Vulnerability; IPCC: Geneva, Switzerland, 2022. [Google Scholar]
  2. Kasthala, S.; Parthasarathy, D.; Narayanan, K.; Inamdar, A.B. Classification and evaluation of current climate vulnerability assessment methods. Soc. Indic. Res. 2023, 171, 605–639. [Google Scholar] [CrossRef]
  3. Feenstra, I.; Burton, I.; Smith, J.B.; Tol, R.S.J. Handbook on Methods for Climate Change Impact Assessment and Adaptation Strategies; UNEP: Nairobi, Kenya, 1998. [Google Scholar]
  4. UNISDR & WMO. UN System Task Team on the Post-2015 UN Development Agenda: Disaster Risk and Resilience; United Nations, 2012. Available online: https://www.un.org/en/development/desa/policy/untaskteam_undf/thinkpieces/3_disaster_risk_resilience.pdf (accessed on 10 December 2019).
  5. National Academies of Science (NAS). Disaster Resilience: A National Imperative; The National Academies Press: Washington, DC, USA, 2012. [Google Scholar]
  6. Pachauri, R.K.; Allen, M.R.; Barros, V.R.; Broome, J.; Cramer, W.; Christ, R.; Church, J.A.; Clarke, L.; Dahe, Q.; Dasgupta, P.; et al. Climate Change 2014: Synthesis Report. Contribution of Working Groups I, II and III to the Fifth Assessment Report of the Intergovernmental Panel on Climate Change; IPCC: Geneva, Switzerland, 2014. [Google Scholar]
  7. United Nations Environment Programme and South Pacific Applied Geoscience Commission (UNEP & SOPAC). EVI: Analysis of Indicators; UNEP: Nairobi, Kenya, 2005. [Google Scholar]
  8. Fajardo-Gonzalez, J.; Lovell, C.A.K.; Lovell, J.; Edmonds, H. Measuring climate risks: A new multidimensional index for global vulnerability and resilience. Environ. Dev. 2025, 56, 101227. [Google Scholar] [CrossRef]
  9. Environmental Defense Fund. U.S. Climate Vulnerability Index: Fact Sheet; Environmental Defense Fund: New York, NY, USA, 2023; Available online: https://map.climatevulnerabilityindex.org/map/cvi_overall/usa?mapBoundaries=Tract&mapFilter=0&reportBoundaries=Tract&geoContext=State (accessed on 30 May 2025).
  10. Olivares-Aguilar, I.C.; Sánchez-Dávila, G.; Wildermann, N.E.; Clark, D.; Floerl, L.; Villamizar, E.; Matteucci, S.D.; Sevilla, N.P.M.; Nagy, G.J. Methodological approaches to assess climate vulnerability and cumulative environmental impacts on coastal landscapes. Front. Clim. 2022, 4, 1018182. [Google Scholar] [CrossRef]
  11. Lee, J.; Lee, D.; Park, M. Urban flood vulnerability assessment for Seoul using high-resolution rainfall scenarios. Sustainability 2023, 15, 2576. [Google Scholar]
  12. Lee, S.; Lee, H.; Kim, J.; Kim, Y. Identification of flood-vulnerable areas considering demographic characteristics and regional types in South Korea. Water 2020, 12, 3451. [Google Scholar]
  13. Park, H.; Nam, K.; Egawa, S. The Gaps Between Institutional and Practical Disaster Risk Management Measures on Coastal Flood Risks in South Korea’s Coastal Communities. Int. J. Disaster Risk Science. 2024, 15, 594–607. [Google Scholar] [CrossRef]
  14. Korean Statistical Information Service (KOSIS). 2021. Available online: https://kosis.kr/eng/statisticsList/statisticsListIndex.do (accessed on 30 January 2021).
  15. e-National Index. 2021. Available online: https://www.index.go.kr/unity/potal/eNara/main/EnaraMain.do (accessed on 12 May 2024).
  16. Korea Meteorological Administration (KMA). 2021. Available online: https://www.weather.go.kr/weather/earthquake_volcano/tidalwave_02.jsp (accessed on 12 January 2021).
  17. South Pacific Applied Geoscience Commission (SOPAC). The Environmental Vulnerability Index (EVI); SOPAC Technical Report 384; EVI: Heidelberg, Germany, 2004. [Google Scholar]
  18. Pratt, R.; Kaly, U.L.; Mitchell, J. What is Vulnerability? What is Resilience? In Environmental Vulnerability Index; UNEP and SOPAC: Suva, Fiji, 2004. [Google Scholar]
  19. National Oceanic and Atmospheric Administration (NOAA). Coastal Vulnerability Assessment Scenario. Available online: https://www.noaa.gov/about-our-agency (accessed on 23 May 2021).
  20. Ministry of Public Administration and Security. Disaster Statistical Yearbook. Available online: http://www.mois.go.kr (accessed on 20 May 2025).
  21. Korea Water Resources Corporation. National Water Resource Management Comprehensive Information System. Available online: https://www.wamis.go.kr (accessed on 23 May 2021).
  22. ESRI. Interpreting OLS Results. ArcGIS Desktop. 2021. Available online: https://desktop.arcgis.com/en/arcmap/10.3/tools/spatial-statistics-toolbox/interpreting-ols-results.htm (accessed on 10 March 2021).
Figure 1. Conceptual framework of this research.
Land 14 01297 g001
Figure 2. Map of prior hazards: (1) property damage quantum, (2) inundated populace, and (3) aggregate (damage quantum × populace).
Land 14 01297 g002
Figure 3. Korean coastal vulnerability map based on the UNEP EVI system. Red indicates the most vulnerable coastal areas, while green represents the most resilient regions.
Land 14 01297 g003
Figure 4. UNEP CVI for Korean coastal cities: (1) overall CVI, (2) hazard sub-index, (3) resistance sub-index, and (4) damage sub-index.
Land 14 01297 g004
Figure 5. Linear regression results. Areas with extreme positive or negative residuals (in red or blue) indicate poor model fit, where predictions diverge significantly from actual outcomes. Areas with residuals near zero represent better model performance and close alignment between predicted and observed values.
Land 14 01297 g005
Table 1. Fifty indicators and scales for the Korean CVI obtained from the UNEP EVI framework *.
Korea CVICategoryUnit1234567
1High WindsHazardsday/yrX ≤ 0.50.5 < X ≤ 11 < X ≤ 1.51.5 < X ≤ 22 < X ≤ 2.52.5 < X ≤ 33 < X
2Dry PeriodsHazardsindexX ≤ 00 < X ≤ 0.050.05 < X ≤ 0.10.1 < X ≤ 0.150.15 < X ≤ 0.20.2 < X ≤ 0.250.25 < X
3Wet PeriodsHazardsday/yrX ≤ 0.150.15 < X ≤ 0.20.2 < X ≤ 0.250.25 < X ≤ 0.30.3 < X ≤ 0.350.35 < X ≤ 0.40.4 < X
4Hot PeriodsHazardsday/yrX ≤ 55 < X ≤ 1010 < X ≤ 2020 < X ≤ 3030 < X ≤ 4040 < X ≤ 5050 < X
5Cold PeriodsHazardsday/yrX ≤ 11 < X ≤ 55 < X ≤ 1010 < X ≤ 1515 < X ≤ 2020 < X ≤ 256 < X
6Sea TemperaturesHazards%X < −0.01−0.01 ≤ X < 00 ≤ X < 0.010.01 ≤ X < 0.020.02 ≤ X < 0.030.03 ≤ X < 0.040.04 ≤ X
7VolcanosHazardsVEI/km2X ≤ 22 < X ≤ 33 < X ≤ 44 < X ≤ 55 < X ≤ 66 < X ≤ 77 < X
8EarthquakesHazardsnumberX ≤ 11 < X ≤ 22 < X ≤ 33 < X ≤ 44 < X ≤ 55 < X ≤ 66 < X
9TsunamisHazardsindexX ≤ 0.050.05 < X ≤ 0.10.1 < X ≤ 0.150.15 < X ≤ 0.20.2 < X ≤ 0.250.25 < X ≤ 0.30.3 < X
10SlidesHazardsindexX ≤ 00 < X ≤ 0.50.5 < X ≤ 11 < X ≤ 1.51.5 < X ≤ 22 < X ≤ 2.52.5 < X
11Land AreaResistanceLN (km2)X > 76 < X ≤ 75 < X ≤ 64 < X ≤ 53 < X ≤ 42 < X ≤ 3X ≤ 3
12Country DispersionResistanceLN (1000 km/km2)X ≤ 5.25.2 < X ≤ 5.65.6 < X ≤ 6.26.2 < X ≤ 6.86.8 < X ≤ 7.47.4 < X ≤ 88 < X
13Geographic IsolationResistancemX ≤ 00 < 0.X ≤ 55 < 0.X ≤ 1010 < 0.X ≤ 4040 < 0.X ≤ 8080 < 0.X ≤ 160160 < 0.X
14ReliefResistanceangleX ≤ 00 < X ≤ 44 < X ≤ 88 < X ≤ 1212 < X ≤ 1616 < X ≤ 2020 < X
15LowlandsResistance%X ≤ 00 < X ≤ 0.50.5 < X ≤ 11 < X ≤ 1.51.5 < X ≤ 22 < X ≤ 2.52.5 < X
16Shared BordersResistance(NA)X ≤ 00 < X ≤ 22 < X ≤ 44 < X ≤ 66 < X ≤ 88 < X ≤ 1010 < X
17Ecosystem ImbalanceDamagemg/LX > 0.20 < X ≤ 0.2−0.2 < X ≤ 0−0.4 < X ≤ −0.2−0.6 < X ≤ −0.4−0.8 < X ≤ −0.6X < −0.8
18Environmental OpennessHazardsLN (USD 100/km2)X ≤ 11 < X ≤ 1.51.5 < X ≤ 22 < X ≤ 2.52.5 < X ≤ 33 < X ≤ 3.53.5 < X
19Migratory SpeciesResistanceSpp/km2X ≤ 55 < X ≤ 1010 < X ≤ 1515 < X ≤ 2020 < X ≤ 2525 < X ≤ 3030 < X
20Endemic SpeciesResistanceSpp/km2X ≤ 55 < X ≤ 1010 < X ≤ 1515 < X ≤ 2020 < X ≤ 2525 < X ≤ 3030 < X
21IntroductionsDamagenumberX ≤ 00 < X ≤ 11 < X ≤ 22 < X ≤ 33 < X ≤ 44 < X ≤ 55 < X
22Endangered SpeciesDamagenumberX > 6050 < X ≤ 6040 < X ≤ 5030 < X ≤ 4020 < X ≤ 3010 < X ≤ 20X < 10
23ExtinctionsDamagenumberX ≤ 00 < X ≤ 11 < X ≤ 22 < X ≤ 33 < X ≤ 44 < X ≤ 55 < X
24Vegetation CoverDamage%X > 8060 < X ≤ 8040 < X ≤ 6020 < X ≤ 4010 < X ≤ 200 < X ≤ 10X ≤ 0
25Loss of Vegetation CoverHazards%X > 0 X = 0−1 < X < 0−2 < X≤ −1X ≤ −2
26Habitat FragmentationDamageLN (km/ha + 1)X ≤ 0.20.2 < X ≤ 0.40.4 < X ≤ 0.60.6 < X ≤ 0.80.8 < X ≤ 11 < X ≤ 1.21.2 < X
27DegradationDamage%X ≤ 55 < X ≤ 1010 < X ≤ 1515 < X ≤ 2020 < X ≤ 2525 < X ≤ 5050 < X
28Terrestrial ReservesHazards%X > 32.5 < X ≤ 32 < X ≤ 2.51.5 < X ≤ 21 < X ≤ 1.50.5 < X ≤ 1X ≤ 0.5
29Marine ReservesHazardskm2X > 54 < X ≤ 53 < X ≤ 42 < X ≤ 31 < X ≤ 20 < X ≤ 1X = 0
30Intensive FarmingHazardsLN (kg/km2 + 1)X ≤ 22 < X ≤ 33 < X ≤ 44 < X ≤ 55 < X ≤ 66 < X ≤ 77 < X
31FertilizersHazards%X ≤ 44 < X ≤ 66 < X ≤ 77 < X ≤ 88 < X ≤ 99 < X ≤ 1010 < X
32PesticidesHazardskm2X ≤ 2020 < X ≤ 3030 < X ≤ 4040 < X ≤ 5050 < X ≤ 6060 < X ≤ 7070 < X
33BiotechnologyHazardsnumberX ≤ 0NoneNoneNone0 < X ≤ 2020 < X ≤ 5050 < X
34Productivity OverfishingHazardsKRW 1000 M X > 120100 < X ≤ 12080 < X ≤ 10060 < X ≤ 8040 < X ≤ 6020 < X ≤ 40X ≤ 20
35Fish EffortHazardsLN (ppl + 1)X ≤ 22 < X ≤ 42.5 < X ≤ 33 < X ≤ 3.53.5 < X ≤ 44 < X ≤ 4.54.5 < X
36Renewable WaterHazardsm³/yr/pplX ≤ 100100 < X ≤ 200200 < X ≤ 300300 < X ≤ 400400 < X ≤ 500600 < X ≤ 700700 < X
37Sulfur Dioxide EmissionsHazardsLN (t/km2/yr + 1)X ≤ 11 < X ≤ 22 < X ≤ 33 < X ≤ 44 < X ≤ 55 < X ≤ 66 < X
38Waste ProductionHazardsLN (t/km2/yr + 1)X ≤ 11 < X ≤ 22 < X ≤ 33 < X ≤ 44 < X ≤ 55 < X ≤ 66 < X
39Waste TreatmentHazards%X = 10080 ≤ X < 10060 ≤ X < 8050 ≤ X < 6040 ≤ X < 5030 ≤ X < 40X < 30
40IndustryHazards10 M kWh0.X ≤ 11 < 0.X ≤ 55 < 0.X ≤ 1010 < 0.X ≤ 2020 < 0.X ≤ 5050 < 0.X ≤ 100100 < 0.X
41SpillsHazardsnumber0.X ≤ 55 < 0.X ≤ 1010 < 0.X ≤ 1515 < 0.X ≤ 2020 < 0.X ≤ 2525 < 0.X ≤ 3030 < 0.X
42MiningHazardsKRW 1 M /km2/yrX ≤ 1010 < X ≤ 2020 < X ≤ 5050 < X ≤ 100100 < X ≤ 200200 < X ≤ 300300 < X
43SanitationHazards%X = 10095 ≤ X < 10090 ≤ X < 9580 ≤ X < 9070 ≤ X < 8060 ≤ X < 70X < 60
44VehiclesHazardsLN (number/km2 + 1)X ≤ 11 < X ≤ 1.51.5 < X ≤ 22 < X ≤ 2.52.5 < X ≤ 33 < X ≤ 3.53.5 < X
45Human Population DensityDamageLN (ppl/km2 + 1)X ≤ 33 < X ≤ 44 < X ≤ 55 < X ≤ 66 < X ≤ 77 < X ≤ 88 < X
46Human Population GrowthHazards%X < 0X = 00 < X ≤ 0.50.5 < X ≤ 11 < X ≤ 1.51.5 < X ≤ 22 < X
47TouristsHazardsLN (ppl/km2 + 1)X ≤ 22 < X ≤ 44 < X ≤ 66 < X ≤ 88 < X ≤ 1010 < X ≤ 1212 < X
48Coastal SettlementsDamageLN (household/km2 + 1)X ≤ 22 < X ≤ 33 < X ≤ 44 < X ≤ 55 < X ≤ 66 < X ≤ 77 < X
49Environmental AgreementsHazardsppl/100 pplX > 3025 < X ≤ 3020 < X ≤ 2515 < X ≤ 2010 < X ≤ 155 < X ≤ 10X ≤ 5
50Human ConflictsDamageindexX ≤ 5050 < X ≤ 8080 < X ≤ 110110 < X ≤ 140140 < X ≤ 170170 < X ≤ 200200 < X
* Adapted from [17] p. 10.
Table 2. Vulnerability index of Korean coastal cities per UNEP.
CityCounty LevelVICityCounty LevelVICityCounty LevelVI
BusanSahaGu196Gyeongsangnam-doSacheonSi171Gyeonggi-doAnyangSi153
BusanSeoGu192BusanSuyeongGu169Chungcheongnam-doBoryeongSi153
IncheonYeonsuGu191Gyeongsangnam-doMasanSi168Jeollanam-doGangjinGun153
BusanYeongdoGu189Gyeongsangnam-doGeojeSi167Gyeongsangnam-doHamanGun153
IncheonJungGu188Gyeongsangnam-doChangwonSi167IncheonGanghwaGun152
BusanGangseoGu184Gyeongsangnam-doJinhaeSi167Gangwon-doGangneungSi152
IncheonGyeyangGu184JejuJejuSi167Gyeongsangbuk-doPohangSi152
UlsanDongGu183BusanBukGu166Gyeongsangnam-doNamhaeGun152
BusanDongGu181Jeollanam-doYeongamGun166Gyeongsangnam-doHadongGun152
IncheonDongGu181Jeollanam-doGoheungGun165Gangwon-doDonghaeSi151
IncheonNamdongGu181Jeollanam-doHaenamGun165Jeollanam-doJangheungGun151
IncheonBupyeongGu181BusanBusanjinGu164Gyeongsangnam-doGoseongGun151
IncheonNamGu181Gyeongsangbuk-doGyeongjuSi164BusanGeumjeongGu150
IncheonSeoGu178BusanYeonjeGu163Chungcheongnam-doSeocheonGun150
Gyeonggi-doSiheungSi178Gyeonggi-doGimpoSi163Jeollanam-doWandoGun150
Chungcheongnam-doAsanSi177UlsanJungGu162Jeollanam-doMuanGun148
Chungcheongnam-doDangjinGun177BusanDongnaeGu161Jeollanam-doYeonggwangGun148
Gyeonggi-doHwaseongSi176UlsanUljuGun160Jeollanam-doSinanGun148
Jeollanam-doMokpoSi176Chungcheongnam-doTaeanGun160Jeollanam-doJindoGun147
Gyeongsangnam-doGimhaeSi176Gyeongsangnam-doTongyeongSi160Gangwon-doSokchoSi146
BusanNamGu175Chungcheongnam-doHongseongGun159Jeollabuk-doGochangGun145
Gyeonggi-doPyeongtaekSi175JejuSeogwipoSi159Jeollanam-doSuncheonSi144
Jeollanam-doYeosuSi175Gyeonggi-doGunpoSi158Jeollanam-doHampyeongGun143
UlsanNamGu174Gyeongsangnam-doJinjuSi158Gyeongsangbuk-doUlleungGun140
Gyeonggi-doBucheonSi173BusanGijangGun157Gyeongsangbuk-doUljinGun136
Chungcheongnam-doSeosanSi173Gyeonggi-doPajuSi157Jeollanam-doBoseongGun135
BusanHaeundaeGu172Gyeongsangnam-doYangsanSi157Gangwon-doSamcheokSi132
Gyeonggi-doAnsanSi172Jeollabuk-doBuanGun156Gyeongsangbuk-doYeongdeokGun130
Jeollabuk-doGunsanSi172Jeollanam-doGwangyangSi156Gangwon-doGoseongGun129
BusanSasangGu171IncheonOngjinGun155Gangwon-doYangyangGun125
UlsanBukGu171Gyeonggi-doSuwonSi154
Jeollabuk-doIksanSi171Jeollabuk-doGimjeSi154
Disclaimer/Publisher’s Note: The statements, opinions and data contained in all publications are solely those of the individual author(s) and contributor(s) and not of MDPI and/or the editor(s). MDPI and/or the editor(s) disclaim responsibility for any injury to people or property resulting from any ideas, methods, instructions or products referred to in the content.

