1. Introduction
The 15 min city is an urban planning concept that aims to ensure that all essential services, including work, education, healthcare, and recreation, are within a 15 min walk or bike ride from residents’ homes. This model prioritises walkability, sustainability, and local access, offering significant potential to improve pedestrian safety. By reducing the reliance on cars and creating pedestrian-friendly spaces, a 15 min city fosters an environment where safety and accessibility for walking can thrive [
1,
2,
3].
The approach has been associated with reduced traffic congestion, lower carbon emissions, and improved pedestrian safety, making it a key strategy for sustainable urban development [
1,
3,
4,
5,
6]. However, while the 15 min city concept aims to create inclusive and walkable environments, it often overlooks the specific needs of vulnerable pedestrian groups, such as blind pedestrians [
7,
8]. In urban settings, the rise of hybrid, electric, and quiet combustion vehicles presents additional challenges for blind pedestrians, who rely heavily on auditory cues to navigate safely [
7].
International research on pedestrian vulnerability [
9,
10] and urban mobility for sensory-impaired users [
11] highlights the growing interest in inclusive design. However, few studies have focused on mid-sized European cities or included real-world behavioural comparisons involving blind pedestrians. This gap is addressed by integrating behavioural data with urban mobility principles such as the 15 min city, adding to both the planning and transport safety literature.
Research has shown that pedestrians, particularly those with special needs, are at a greater risk of injury due to their increased reliance on non-visual or non-auditory cues. While pedestrians generally exhibit a more remarkable ability to adapt and respond quickly to threats compared to other road users, this flexibility can lead to unpredictable and potentially hazardous behaviours [
12]. To better understand these behaviours, Granié et al. [
13] developed the pedestrian behaviour scale (PBS), a tool designed to assess pedestrian behaviours through self-reported data. The PBS categorises behaviours into five distinct dimensions: violations, errors, lapses, aggressive behaviours, and positive behaviours.
The evolution of pedestrian behaviour research has drawn on methodologies initially developed for driver behaviour analysis. For example, the Pedestrian Behaviour Questionnaire (PBQ) was modelled after the Driver Behaviour Questionnaire (DBQ) by Reason et al. [
14], which includes items across dimensions such as violations, errors, and lapses. Over time, these tools have been adapted and validated across various contexts, including Brazil [
15], Turkey [
16,
17], Greece [
18], China [
19], USA [
12], and Hungary [
20], among others.
In 2021, Vandroux et al. conducted a systematic review on the development, use, and scientific validation of the PBS globally, providing insights and recommendations for selecting the most appropriate version based on specific research needs [
21]. In 2023, Oliveira et al. [
22] evaluated the pedestrian behaviour of 502 Portuguese residents, identifying four key factors—transgression, lapses, aggressive behaviours, and positive behaviours—while in addition developing a reliable shorter version of the questionnaire and analysing the influence of demographic variables on these behaviours [
22]. The findings from Oliveira et al.’s study will be utilised in this research.
Studying the behaviour of blind pedestrians is crucial for enhancing road safety and accessibility, as they are among the most vulnerable road users. Unlike sighted individuals, blind pedestrians rely heavily on auditory cues and tactile information to navigate, making them particularly susceptible to risks posed by quiet vehicles like electric and hybrid cars, which have been linked to increased pedestrian collisions [
23]. Understanding the specific challenges and behaviours of blind pedestrians allows for the development of targeted interventions, such as improved audible traffic signals and safer road designs, which can significantly reduce collisions rates and enhance mobility [
7]. Furthermore, research in this area can inform policymakers and urban planners about the necessity of inclusive infrastructure that considers the needs of all pedestrians, ultimately contributing to a safer and more equitable urban environment [
24].
Using questionnaires in pedestrian behaviour research offers a practical, low-cost, and safe method for exploring the complex interactions between pedestrians and their environments. These tools allow researchers to collect comprehensive data on pedestrian decision-making processes, crucial for developing effective safety interventions.
This study explores pedestrian behaviour within the 15 min city framework, as explored in the context of Coimbra, Portugal by Zargarzadeh and Ribeiro [
2], focusing on the behavioural differences between blind and sighted pedestrians using the pedestrian behaviour scale (PBS) as a diagnostic tool [
13,
22]. A sample of six blind pedestrians and 502 sighted pedestrians was analysed to identify distinct behavioural patterns and assess potential risks associated with pedestrian navigation in urban areas not fully adapted to the needs of blind pedestrians. The findings of this study aim to inform urban planning policies and strategies for inclusive infrastructure, highlighting the importance of considering blind pedestrians in the implementation of 15 min cities. This study aligns with ongoing research on urban accessibility and pedestrian behaviour, contributing to the broader discourse on sustainable urban mobility.
Finally, this study offers two main contributions. Theoretically, it enhances the understanding of pedestrian behaviour from the perspective of sensory-impaired individuals within the urban mobility framework of 15 min cities. By applying the pedestrian behaviour scale (PBS) and a factor analysis approach, it contributes to the behavioural profiling of blind pedestrians—a population often excluded from quantitative analyses. Practically, it exposes the infrastructural and perceptual barriers to pedestrian safety in urban environments, offering insights that can inform urban design, policy recommendations, and vehicle technology development to foster more inclusive cities. The need for inclusive planning is highlighted through a behavioural comparison using validated instruments in a mid-sized European city.
2. Materials and Methods
2.1. Participants
To assess pedestrian behaviour, the PBS was answered by 502 Portuguese residents, anonymously, voluntarily and randomly, for 47 PBS questions using a 5-point scale (1—never, 2—rarely, 3—often, 4—very often, 5—always) in a study validated by Oliveira et al. [
22]. In addition to demographic data and behavioural research items, seven filter items indicate attitudes toward walking and determine whether respondents were qualified to answer subsequent questions.
The participants ranged in age from 15 to 64 years: 45.0% were in the 15–24 age group, 28.9% in the 25–34 age group, 13.9% between 35 and 44 years, and 11.4% were over 45 years of age. Regarding gender distribution, 63.3% of respondents identified as female and 36.7% as male. A non-probabilistic convenience sampling method was employed, which is appropriate for exploratory studies involving online self-administered questionnaires. This approach, while efficient and practical, does not ensure statistical representativeness of the broader population. It is particularly susceptible to selection bias, as the dissemination of the survey through digital platforms—such as institutional mailing lists and social media—tends to attract younger and more technologically engaged individuals. As such, the overrepresentation of younger respondents in this sample is an expected outcome and should be acknowledged as a limitation in terms of generalisability. Nonetheless, this method is widely accepted in preliminary behavioural studies, especially when targeting heterogeneous urban populations in a time- and resource-constrained research setting.
A comparison was made with pedestrians analysed in Oliveira et al. [
22]; 6 blind pedestrians aged between 20 and 52 years were interviewed: 4 females and 2 males. Some survey items were removed from the analysis with the blind pedestrians because they require visual guidance for the adoption of the behaviour or because their occurrence compromises the safety and destination of the pedestrian, who, in this case, is left adrift.
The sample includes six blind participants (1.2% of the total), recruited in collaboration with ACAPO, the Association of Blind and Amblyopic People of Portugal, where those who agreed to participate in the study provided their contacts to be later contacted by a research team member via telephone. National estimates indicate that approximately 0.3% of Portugal’s population is blind or severely visually impaired. The slight oversampling of this group reflects the exploratory nature of this study and aims to give visibility to a highly underrepresented pedestrian profile in mobility research. The sample included one female participant in the age group of 15–24, two blind participants in the age group of 25–34, one man and one woman, and three blind participants aged 45–54, two women and one man. Although they agreed to participate in this research, other personal information was confidential for ethical reasons.
2.2. Materials
This study considers the adoption of an existing survey proposed by Granié et al. [
13] and a validation for a Portuguese resident sample proposed by Oliveira et al. [
22], which raises questions related to pedestrian behaviour, and made available jointly, focused on demographic information, seven questions: gender, age, education, occupation, country of origin, country of residence, and the person with a disability.
To capture a broad spectrum of pedestrian behaviours, the pedestrian behaviour scale (PBS) includes a set of 40 items distributed across five domains: violations, errors, lapses, aggressive behaviours, and positive behaviours. Participants rated the frequency of each behaviour using a 5-point Likert scale ranging from “never” to “always”. Examples of items include the following: “I cross the street diagonally to save time” (violation), “I start crossing and realise I forgot to check for vehicles” (lapse), “I shout at a driver who comes too close” (aggressive behaviour), and “I thank a driver who stops to let me cross” (positive behaviour). These items are designed to reflect everyday pedestrian actions and were drawn from validated previous applications of the PBS [
12,
13]. A complete list of the 29 final items retained in the principal component analysis is available upon request or in the
Appendix A.
The PBS classifies pedestrian behaviour into four core categories: transgressions, lapses, aggressive behaviours, and positive behaviours. Transgressions refer to deliberate or careless rule violations, such as crossing outside designated crosswalks or ignoring traffic lights. Lapses represent unintentional mistakes due to distraction or inattention—for instance, forgetting to look for traffic because one is preoccupied or distracted by a mobile phone. Aggressive behaviours include confrontational actions like shouting at drivers or purposely slowing down while crossing. In contrast, positive behaviours involve courteous or cooperative actions, such as giving way to vehicles or thanking a driver who yields. These categories were derived through principal component analysis and are consistent with findings from international validations of the PBS.
The pedestrian behaviour scale (PBS) is a widely used self-report instrument developed to assess individual differences in pedestrian behaviours, encompassing both safe and unsafe practices. Originally proposed by Granié et al. [
13], the PBS includes dimensions such as errors, violations, aggressive behaviours, and positive behaviours, providing a comprehensive framework for evaluating how pedestrians interact with traffic environments. The scale has demonstrated solid psychometric properties and has been adapted to various cultural contexts. In the Portuguese context, de Oliveira et al. [
22] validated a revised version of the PBS, confirming its factorial structure and internal consistency across different demographic groups, thereby supporting its applicability for understanding pedestrian behaviour patterns in urban settings.
In the first phase, the survey uses a principal components analysis (PCA) to validate the results obtained in the sample. In the second phase, comparisons were made regarding the greater vulnerability of blind road users, considering age and gender.
The survey had been previously validated, and sufficient internal consistency was demonstrated. After the analyses, the test results will be presented for an additional consistency check. This study’s conceptual approach is illustrated in
Figure 1.
2.3. Procedure
The questionnaire was made available online, in both Portuguese and English, via the Lime Survey platform. It was disseminated through social media and institutional email lists over a four-month period during the first COVID-19 lockdown. Participation was voluntary and anonymous, with an average completion time of approximately 30 min. To prevent duplicate submissions, participants were asked to enter the last four digits of their primary identification document and to generate a unique participation code. Only completed responses were considered valid.
Before beginning the questionnaire, participants were required to read and accept a data protection agreement, granting consent for the academic use of their responses.
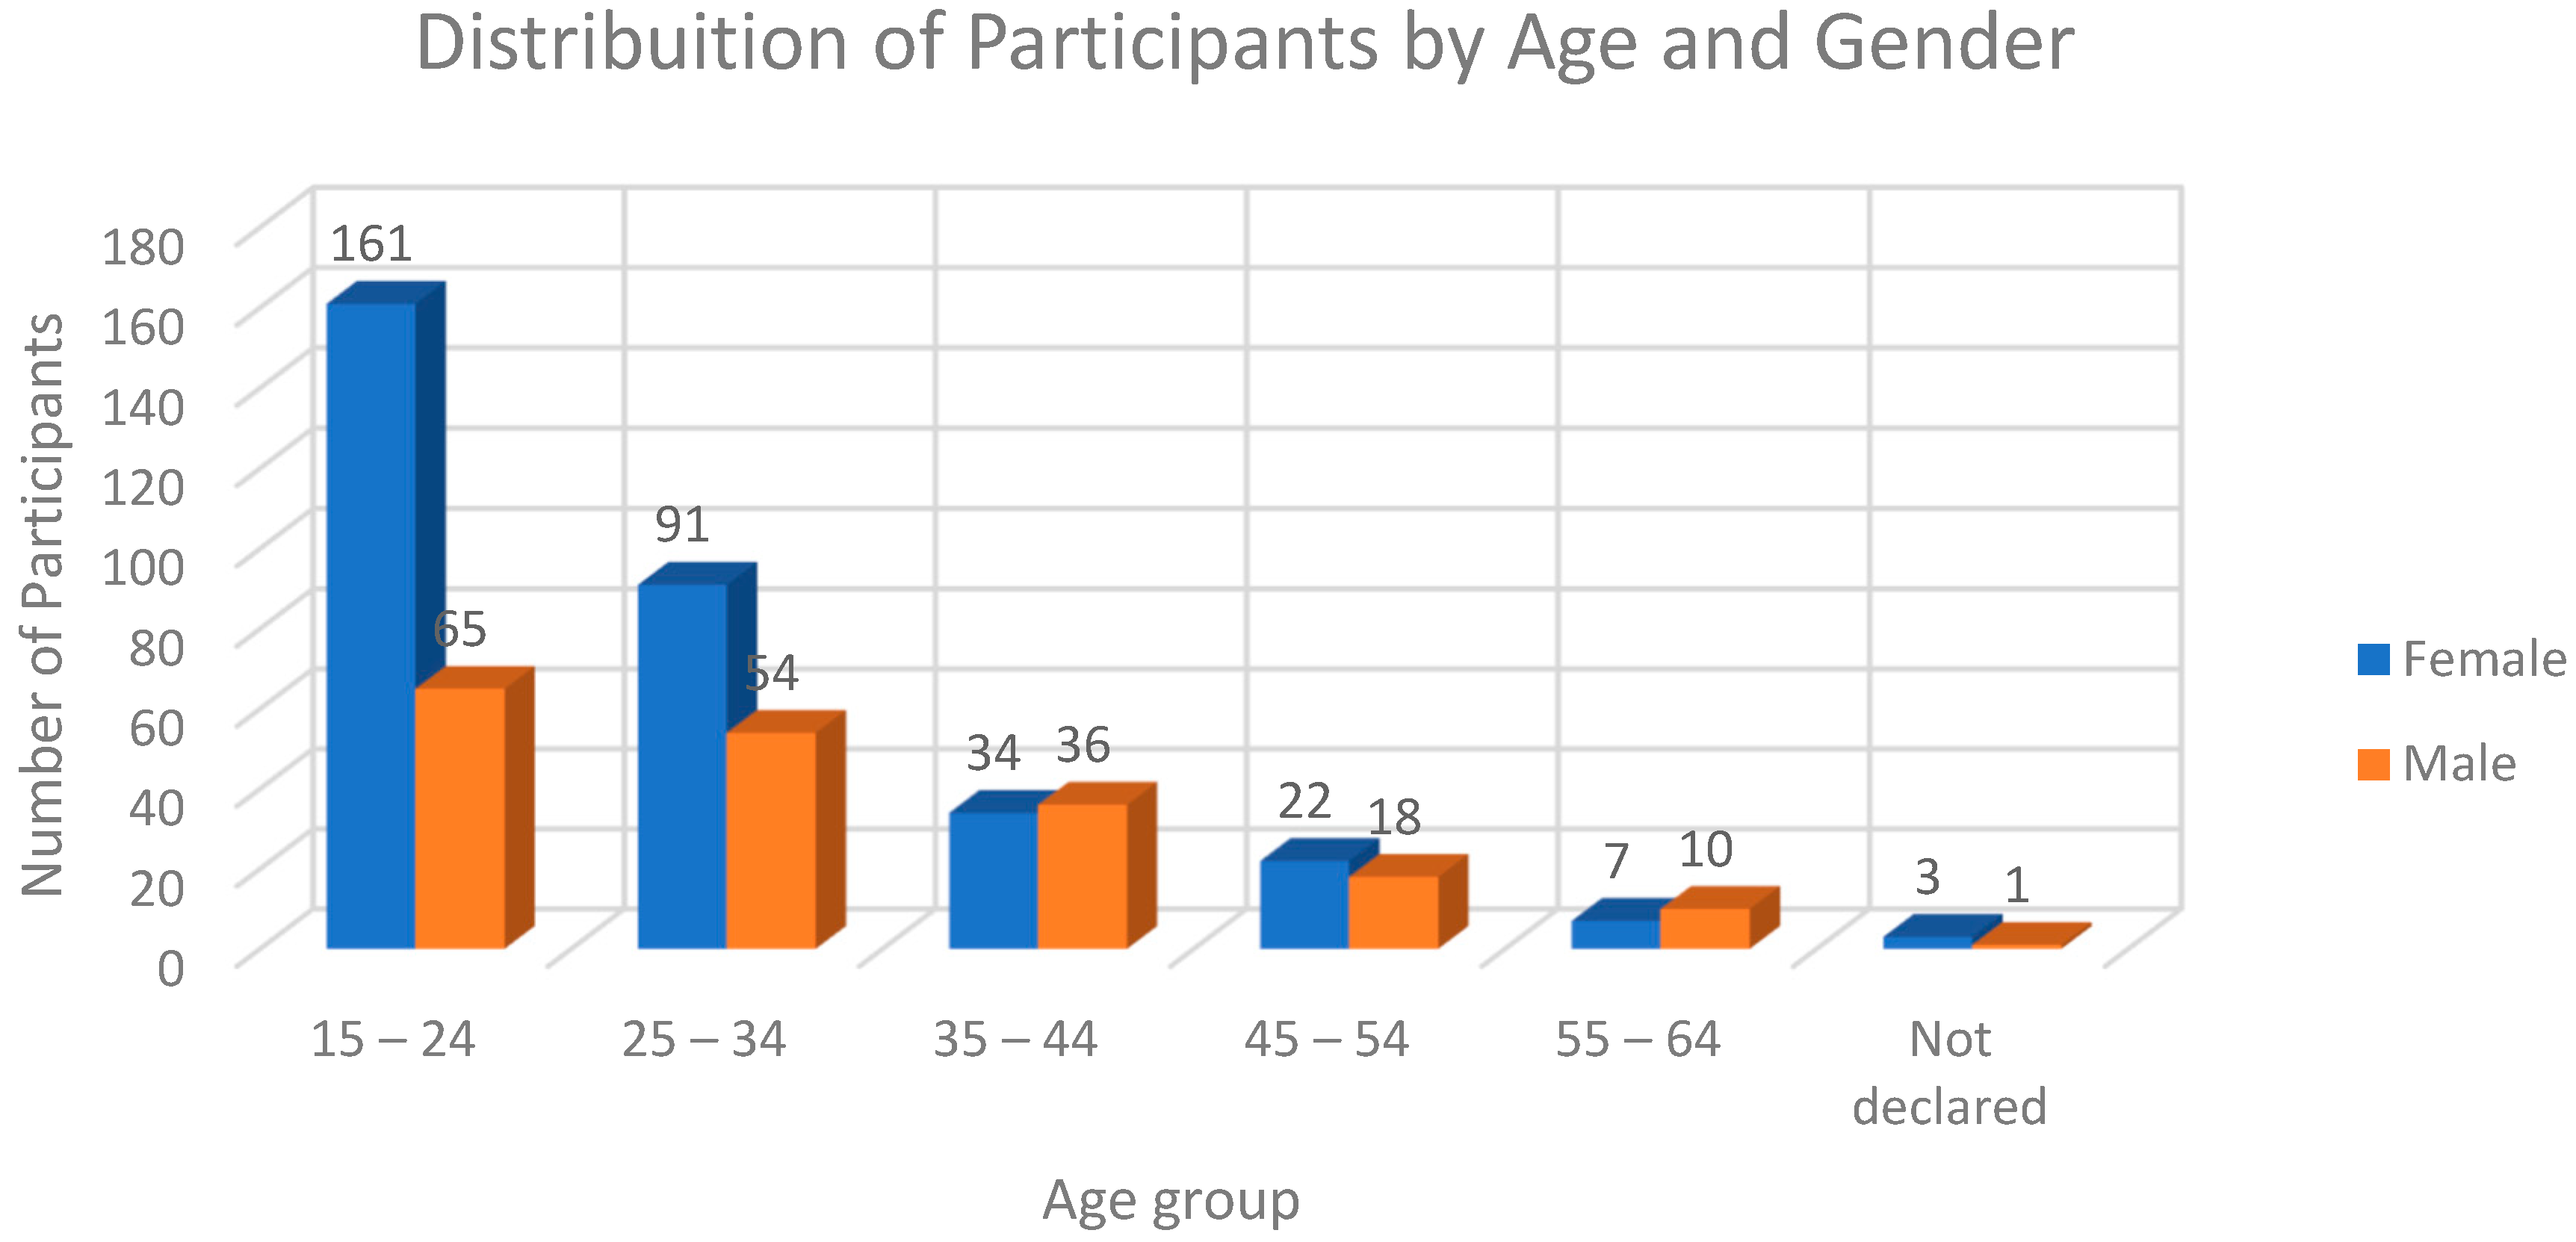
Statistical analyses for this paper were performed using SPSS version 26.0 and Microsoft Excel. The age and gender distribution of the sample, as illustrated in
Figure 2, was considered. These age classes were adopted based on their comparability, statistical relevance, interpretation of results, and adherence to norms and standards used in similar studies.
As illustrated, the sample is predominantly composed of individuals aged between 15 and 34, with a higher proportion of female respondents across most age groups. The number of participants under 18 was notably low (n = 2). Although no age groups were excluded from the analysis, the small representation of minors should be considered when interpreting results. The inclusion of all age categories was intended to reflect the diversity of the pedestrian population, while age grouping criteria were based on statistical relevance and consistency with related studies.
2.4. Statistical Procedures and Variable Justification
Following data collection, the statistical procedures were divided into two main stages: Exploratory Factor Analysis (EFA) and Comparative Analysis between Groups.
To validate PBS, the EFA was conducted using the principal component analysis (PCA) method with Varimax rotation, which was performed on the different behaviour scales to validate the pedestrian behaviour survey sample. The seven filter items were removed to test the factor structure for the reported pedestrian behaviours. The choice of PCA was based on the objective of reducing data dimensionality and identifying latent clusters of pedestrian behaviours. The criteria for factor retention were followed. The Kaiser–Meyer–Olkin test showed a good value (0.871), indicating sample adequacy. Bartlett’s test of sphericity was significant (0.0001), confirming suitability for EFA. The determinant of the matrix was close to zero (3.787 × 10⁻⁷), suggesting no severe multicollinearity. Four factors with eigenvalues >1 in accordance with Kaiser’s criterion were identified, and a cut-off point of 0.40 was used for item loadings, following the guidelines of the PBS creators.
The general equation for PCA can be expressed as follows:
where
: principal component;
: factor loading coefficient;
: original variable;
: error term.
The variables were selected based on the pedestrian behaviour scale (PBS) developed by Granié et al. [
13] and adapted for the Portuguese population by Oliveira et al. [
22]. The categories of behaviours (transgressions, lapses, aggressive behaviours, and positive behaviours) were maintained, as they represent well-documented dimensions of pedestrian behaviour. The items were selected for their ability to distinguish between sighted and blind pedestrians, considering the safety and mobility constraints for blind pedestrians.
After validating the survey, scores were calculated for each observed group. This measure consisted of the sum of the values indicated on the scale by each individual, generating a new variable that represents the entire group and may vary based on the presented values, as detailed in the analysis section. Given the small sample size, further statistical tests such as ANOVA or t-tests were not conducted. Instead, descriptive analyses were used to compare pedestrian behaviour patterns between blind and sighted participants, as well as across gender and age groups. The results of these analyses are presented in the following section.
3. Analysis and Results
Most participants walk for pleasure ‘sometimes’ or ‘often’ (63.5%), and most reported walking ‘rarely’ or ‘sometimes’ when they have no other option (65.1%).
The most frequently reported behaviours (mode response = 4) involved some filter items and positive interactions with vehicle drivers: (a) giving way to another pedestrian, (b) thanking a driver who stops to let me cross, (c) walking on the right side of the sidewalk, and (d) users of public transport. Less frequent behaviours (mode response = 1) mainly include lapses or aggressive behaviour towards other road users. Violations and errors were found between these two extremes.
The six blind pedestrians compared with the study conducted by Oliveira et al. [
22] had some survey items removed from their analysis because these items require visual guidance for the adoption of the behaviour (e.g., E3: I cross between vehicles stopped on the roadway in traffic jams or L7: I forget to look before crossing because I want to join someone on the sidewalk on the other side) or because their occurrence would compromise the safety and destination of the pedestrian, leaving them vulnerable (L8: I realise that I have crossed several streets and intersections without paying attention to traffic).
It was observed that pedestrians more frequently reported positive behaviours towards other road users on average (considering the 1–5 scale, the mean value was 3.46 for the blind and 3.36 for the general) and less frequently aggressive behaviours towards other road users (average value of 1.17 for the blind and 1.26 for the general), as shown in
Table 1.
However, the average associated with transgression for non-blind pedestrians (2.30) and violations for both groups (2.49 for non-blind and 2.48 for blind pedestrians) has values close to the average scale (2.5), representing a considerable risk for pedestrians on urban roads. It is also notable that the highest standard deviation is associated with the violation and, consequently, with the transgression frequency for both groups, representing a bigger unpredictability and adding more risk. Furthermore, the demographic variables could impact the ‘transgression’ item and the other items and deserve a closer look. The study helps recognise risk behaviours and adapt preventive actions for users.
It should be noted that most items related to errors and lapses were reported infrequently and with little variability in the answers because, due to the absence of vision, pedestrians are unable to practice them and, because of this, it is not possible to state that they would not do so if they could.
For the PCA, rotation performs without fixing factors, which explains 40.94% of the variance for four factors. The Kaiser–Meyer–Olkin (KMO) test used as a measure of adequacy showed a fair value (0.871), Bartlett’s sphericity test was significant (0.0001), and the determinant of the matrix obtained was close to zero (3.787 × 10⁻⁷). Four axes with self-values >1 are identified, and a cut-off point of 0.40 was used for the item loading values, following the guidelines of the PBS creators. The axes were differentiated into factors called (1) “transgression”, which included violations of the rules of the road and legal errors, (2) “lapses”, referring to errors caused by lack of attention, (3) “aggressive behaviours”, and (4) “positive behaviours” concerning other road users. The seven items referring to filters were excluded from the analysis, and nine items were eliminated due to low factorial loads: one referred to aggressive behaviour, four referred to errors, and four referred to violations. One item referring to errors and one referring to violations were also eliminated because they were classified on the incorrect axis.
The transgression axis explained 21.57% of the variance and was defined by 11 items: 5 errors and 6 violations. The lapses axis explained 8.28% of the variance and refers to ten items, eight lapses, one error, and one violation, the latter two being excluded from the abovementioned analysis. The five aggressive behaviours concerning the other road users were organised in the third axis, which explained 5.50% of the variance. Positive behaviours were categorised on the fourth axis, representing 4.75% of the variance.
The PCA is significant because it confirms the survey’s suitability for the sample. Oliveira et al. [
22] published further information and details on how the validation was carried out.
Regarding the survey proposed for the blind pedestrians, the respective scores were calculated, which consist of a consolidated score for each of the pedestrians observed in the different behaviours and then the average for each gender and age, to compare the behaviour adopted by blind pedestrians and non-blind pedestrians.
Table 2 shows the results of the composite variables considering the age and gender of non-blind pedestrians.
Different factors that contribute to the adoption of certain behaviours were assessed, namely the following: the scores, which consist of a consolidated score for each of the pedestrians observed in the different behaviours; the demographic variables, namely age and gender; and finally, the filter items used in the PBS, which characterise attitudes during walking.
To check the possible effects of the demographic variables of age and gender on the scales, partial correlations were calculated between the different dimensions of the PBS (transgression, lapses, aggressive behaviour, and positive behaviour).
The correlation matrix showed positive correlations between transgression, lapses, and aggression: the more transgressions that individuals reported, the more they reported lapses and aggressive behaviour. On the other hand, positive behaviour was negatively correlated with lapses: the more that individuals reported positive behaviour towards other road users, the less they reported lapses as pedestrians. About the other factors, although there is a positive correlation, its value is low, which points to a weaker relationship between these other different attitudes.
Table 3 shows the average per group for each score for each gender and age group in the blind group. As in the case of the non-blind presented in the article by Oliveira et al. [
22], the groups related to positive and aggressive behaviours have the highest and lowest averages compared to the others, respectively. However, disregarding transgression—a composite variable encompassing two behaviours and more variables in its composition—the average of these groups is expected to be high. Variability in the case of the blind pedestrians is impossible to calculate since the sample has few elements. Consequently, the answers have little variability and no significant differences between them.
The consolidated score for each of the pedestrians is shown for the different behaviours. Then, the average for each gender and age indicates that blind people recognise more transgressions in their behaviours than non-blind people in almost all age and gender variations, except women between the ages of 25 and 34, for example. For the total sample, blind pedestrians report more transgressions and violations than non-blind pedestrians, who, on the other hand, report more errors, lapses, aggressive behaviours, and positive behaviours. Blind and non-blind men report more transgressions, violations, and errors than blind and non-blind women. However, the blind men studied reported more positive behaviour towards other road users than blind and non-blind women.
It is important to remember that, due to the small sample of blind pedestrians, there is no statistical robustness in this group’s answers. This limits the generalizability of the results, unlike those presented for the sample of non-blind pedestrians.
4. Discussion
From a planning perspective, the findings underscore the imperative of inclusive infrastructure in the context of 15 min cities. The concept of accessibility must extend beyond mere proximity to encompass actual safety and usability for all pedestrians, including those with sensory impairments. Quiet electric vehicles, for instance, pose distinct risks to blind pedestrians due to the absence of auditory cues, highlighting the need for technological adaptations such as mandatory Acoustic Vehicle Alerting Systems.
While the PBS proved effective in capturing behavioural trends, the relatively small sample of blind participants limits the generalisability of some comparisons. Nevertheless, the observed trends substantiate the importance of incorporating this underrepresented group into pedestrian safety research. Future studies should consider mixed-method approaches, integrating both quantitative analyses and qualitative assessments to better capture the lived experiences of blind pedestrians navigating urban spaces.
Additionally, the study focused primarily on individual-level behavioural differences between blind and sighted pedestrians. However, further research could extend the analysis to collective pedestrian dynamics across diverse urban settings and demographic profiles. Investigating crowd-level interactions—particularly those involving individuals with varied sensory and mobility conditions—could yield valuable insights into how spatial configurations either facilitate or impede safe pedestrian movement. Such analyses would complement the present findings and further inform urban design principles aligned with the inclusive ethos of 15 min cities.
Despite the limited number of blind participants (
n = 6), the recruitment challenges associated with this vulnerable group are well-documented, particularly in urban contexts where spontaneous sampling is unfeasible. Recruitment was facilitated through ACAPO (Associação dos Cegos e Amblíopes de Portugal), granting access to a small yet informative cohort. Complementary observational research was conducted and reported in a separate study [
23], involving video-recorded pedestrian crossings in Coimbra with blind participants interacting with electric vehicles. That study corroborated the present findings, highlighting the cautious behaviour of blind pedestrians and the particular risks posed by silent electric vehicles.
Furthermore, the absence of acoustic signals and tactile paving at pedestrian crossings in Coimbra further underscores the limited infrastructural support available to blind pedestrians. National traffic safety reports indicate that Portugal has one of the highest pedestrian fatality rates in the EU, particularly in urban areas, suggesting that pedestrian vulnerability cannot be effectively mitigated without comprehensive measures addressing infrastructure, vehicle design, and driver behaviour. These dimensions merit further investigation, ideally through mixed-method approaches combining perception studies, observational data, and spatial analysis.
Future research should explore comparative analyses of pedestrian behaviour across various demographic groups, including individuals with differing disabilities, age ranges, and levels of familiarity with urban settings. Furthermore, triangulating pedestrian self-reports with driver behaviour observations and spatial data on accident incidence could offer a more comprehensive understanding of pedestrian risk. Evaluating the impact of specific infrastructural interventions—such as tactile paving and acoustic signalling—on blind pedestrians’ autonomy and safety would also provide critical insights for inclusive urban planning.
5. Conclusions
Within the concept of an inclusive 15 min area, the main objective of this study is to understand where and to what extent blind pedestrians are most exposed as vulnerable road users. Using an existing pedestrian study framework previously applied to the Portuguese population by Oliveira et al. [
22] to identify and classify different pedestrian behaviours, the behaviour of six blind pedestrians was compared to the validated sample in the mentioned study. After testing some assessment techniques, it is possible to state that the (stated) behaviour of blind pedestrians does not differ much from that of non-blind pedestrians and that the group considered as more vulnerable presents a more conservative behaviour, i.e., the average of positive behaviours is higher than that of non-blind pedestrians. Those referring to aggressive behaviours and transgressions are lower, as shown in
Table 1.
As previously mentioned, due to the absence of vision, blind pedestrians cannot practise some behaviours. Still, it is not possible to state that they would not do so if they could, as is the case with most items referring to errors and lapses, which present a lower frequency and little variability in responses. It is essential to highlight that, in all versions of the PBS, there is a homogeneity problem in the “positive behaviours” dimension. However, these items present the highest frequencies in all the works known to the authors.
Despite the small sample of blind pedestrians, the study identifies that, in general, blind pedestrians report more transgressions and violations. In contrast, non-blind pedestrians report more errors, lapses, aggressive behaviours, and positive behaviours. Blind men have the highest score for positive behaviour compared to other road users, while non-blind women report more lapses than other road users.
Finally, despite using a practical, simple, and objective self-report method for detecting pedestrian risk behaviour on roads for the most vulnerable pedestrians, the lack of elements in the sample of blind pedestrians studied prevents more meaningful comparisons from being made. In any case, the questionnaire can be considered a valuable tool for measuring and analysing differences in behaviour, especially in the population of pedestrians with the most significant risk, and helps to adapt or implement preventive actions for vulnerable road users. This study provides valuable insights for promoting inclusive 15 min cities, which are essentially inclusive. There is no place for a 15 min city that does not consider inclusivity for all the pedestrians who want to circulate in it. The concept of the 15 min city must be understood as inherently inclusive; otherwise, its purpose is fundamentally undermined.
Based on the results, it is recommended to implement tactile and acoustic guidance systems at key pedestrian crossings in Coimbra and similar mid-sized European cities. Public awareness campaigns and targeted education for drivers about vulnerable road users—especially blind pedestrians—should be reinforced. The integration of Acoustic Vehicle Alert Systems (AVAS) in silent electric vehicles should in addition be prioritised in areas with high pedestrian activity in order to mitigate the risks associated with inaudible approaching vehicles.
Public awareness campaigns and targeted driver education about vulnerable road users—particularly blind pedestrians—should be reinforced. The integration of Acoustic Vehicle Alerting Systems (AVAS) in quiet electric vehicles should in addition be prioritised in areas with high pedestrian activity to mitigate risks associated with inaudible vehicle approach.


 and
and 