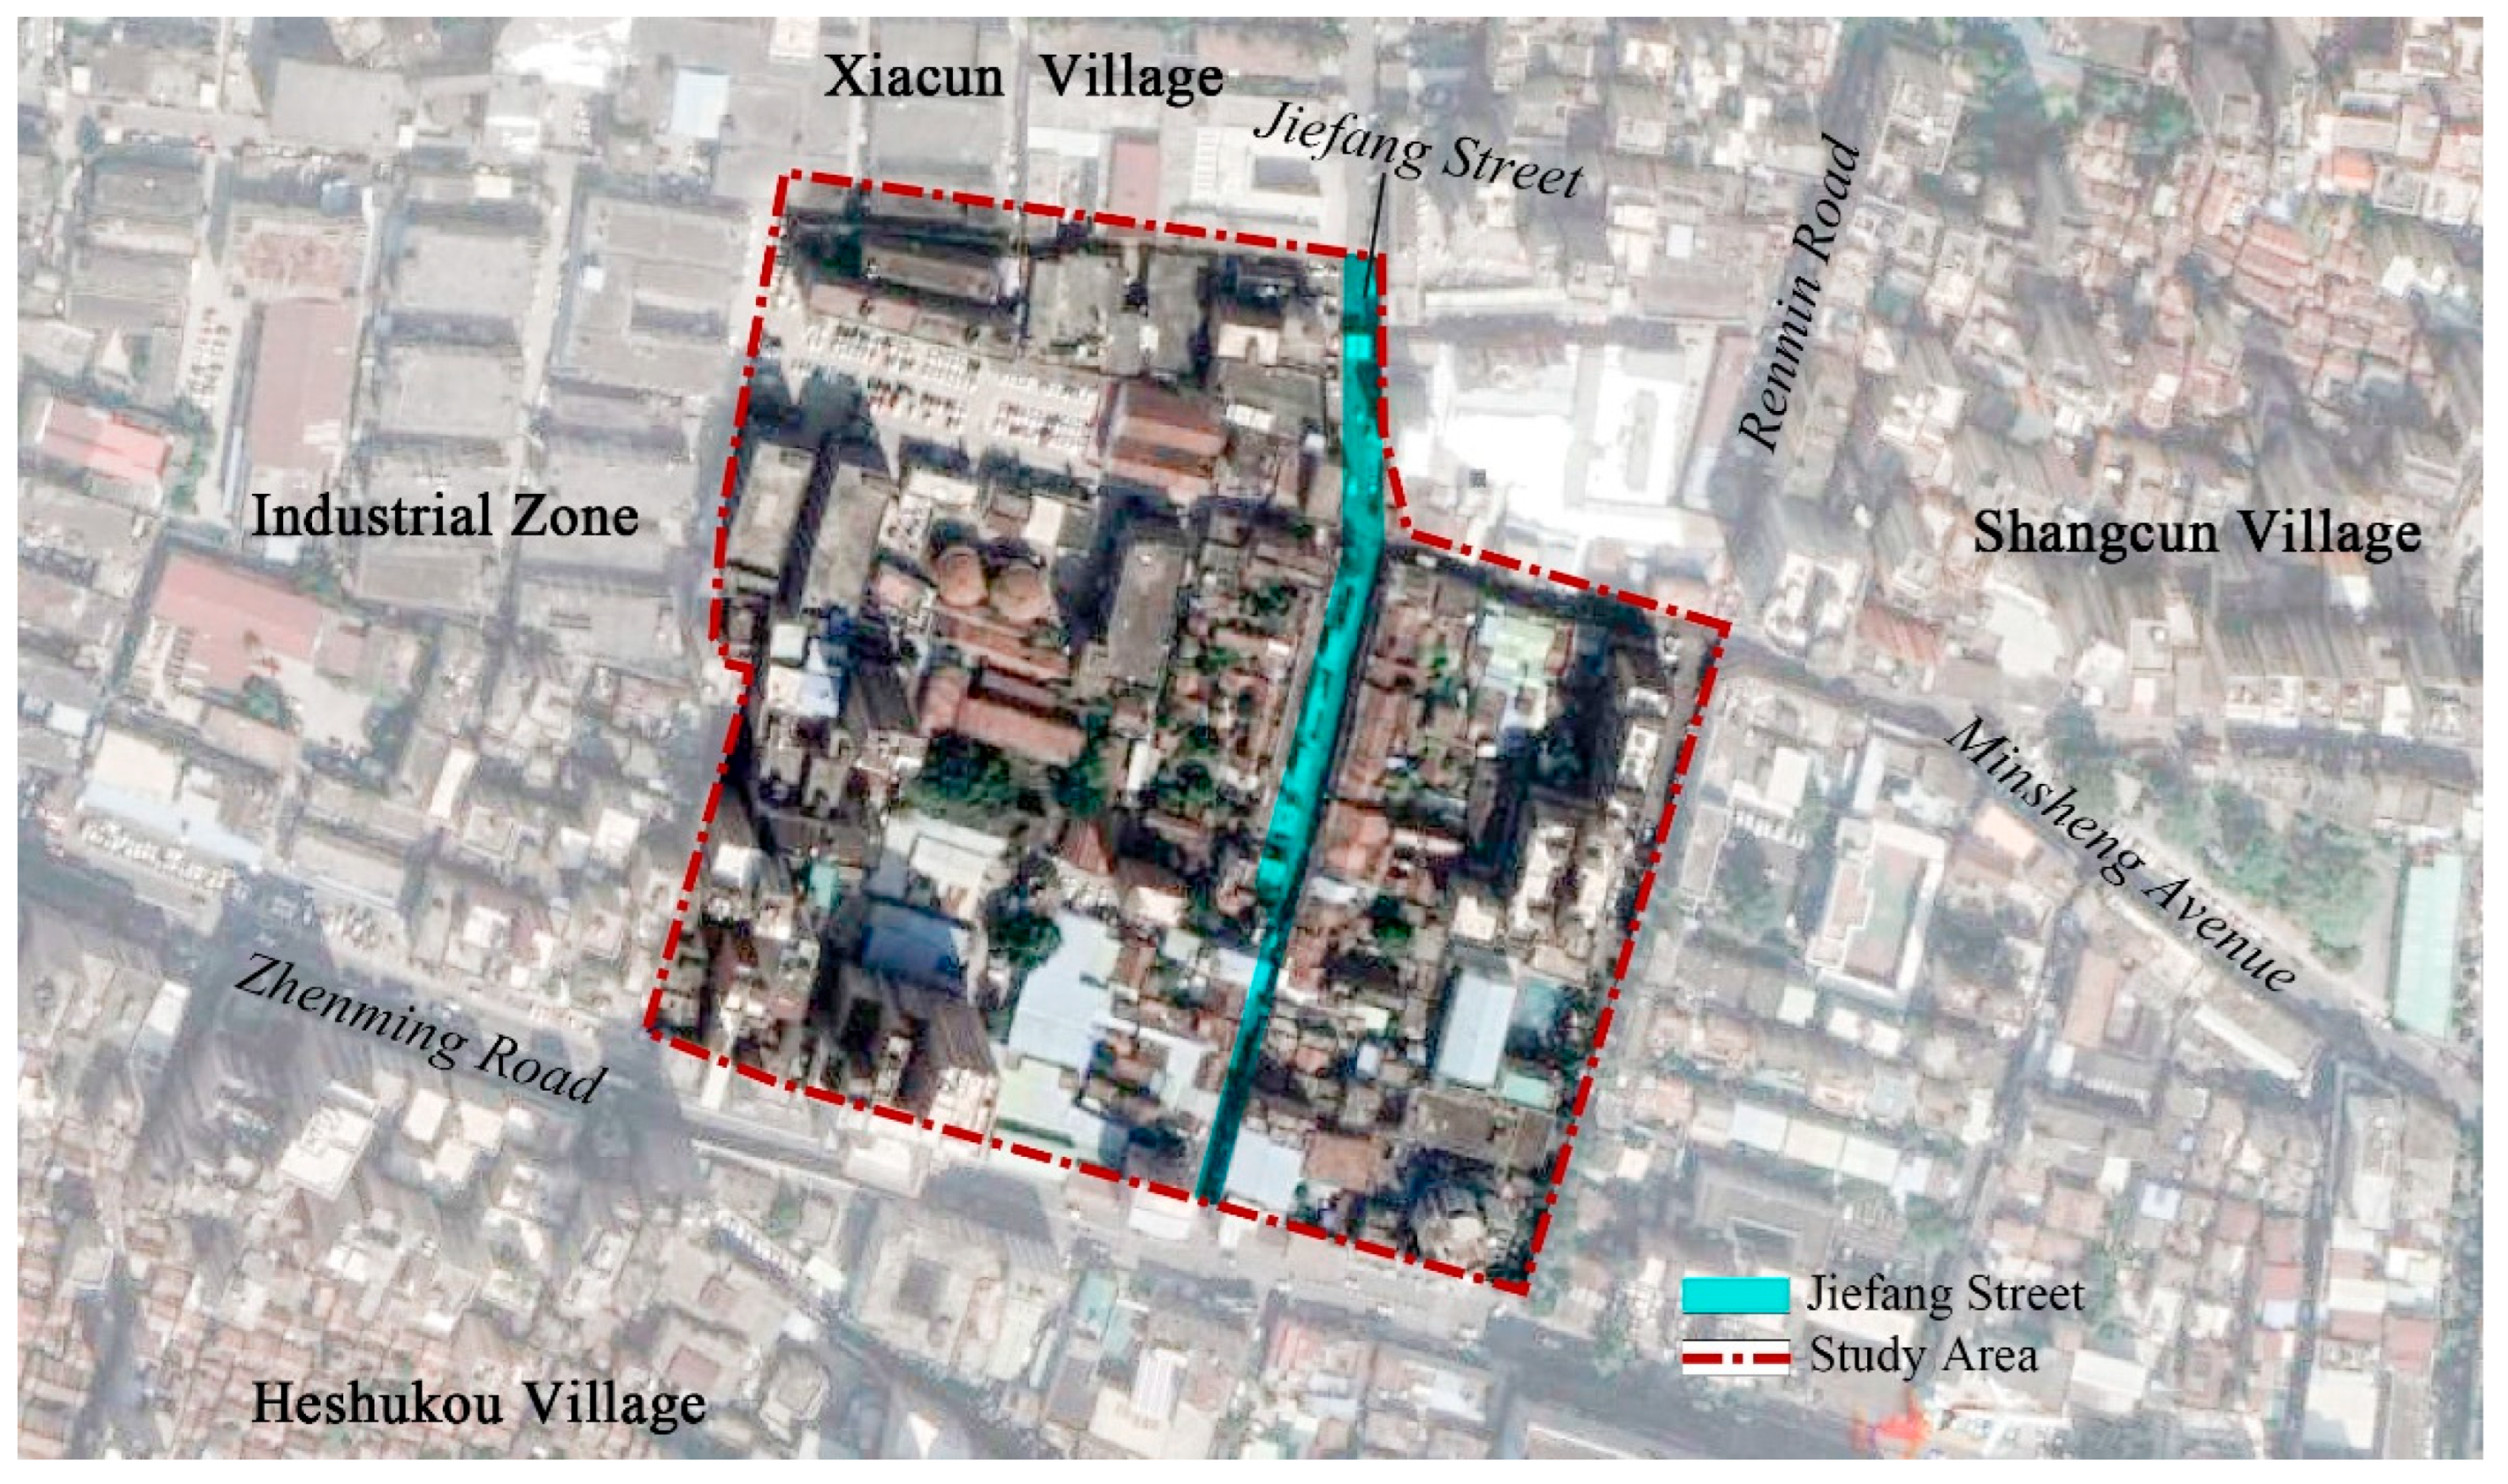
Figure 1.
Research scope map of Gongming Ancient Fair (source: author Liu H.).
Figure 1.
Research scope map of Gongming Ancient Fair (source: author Liu H.).
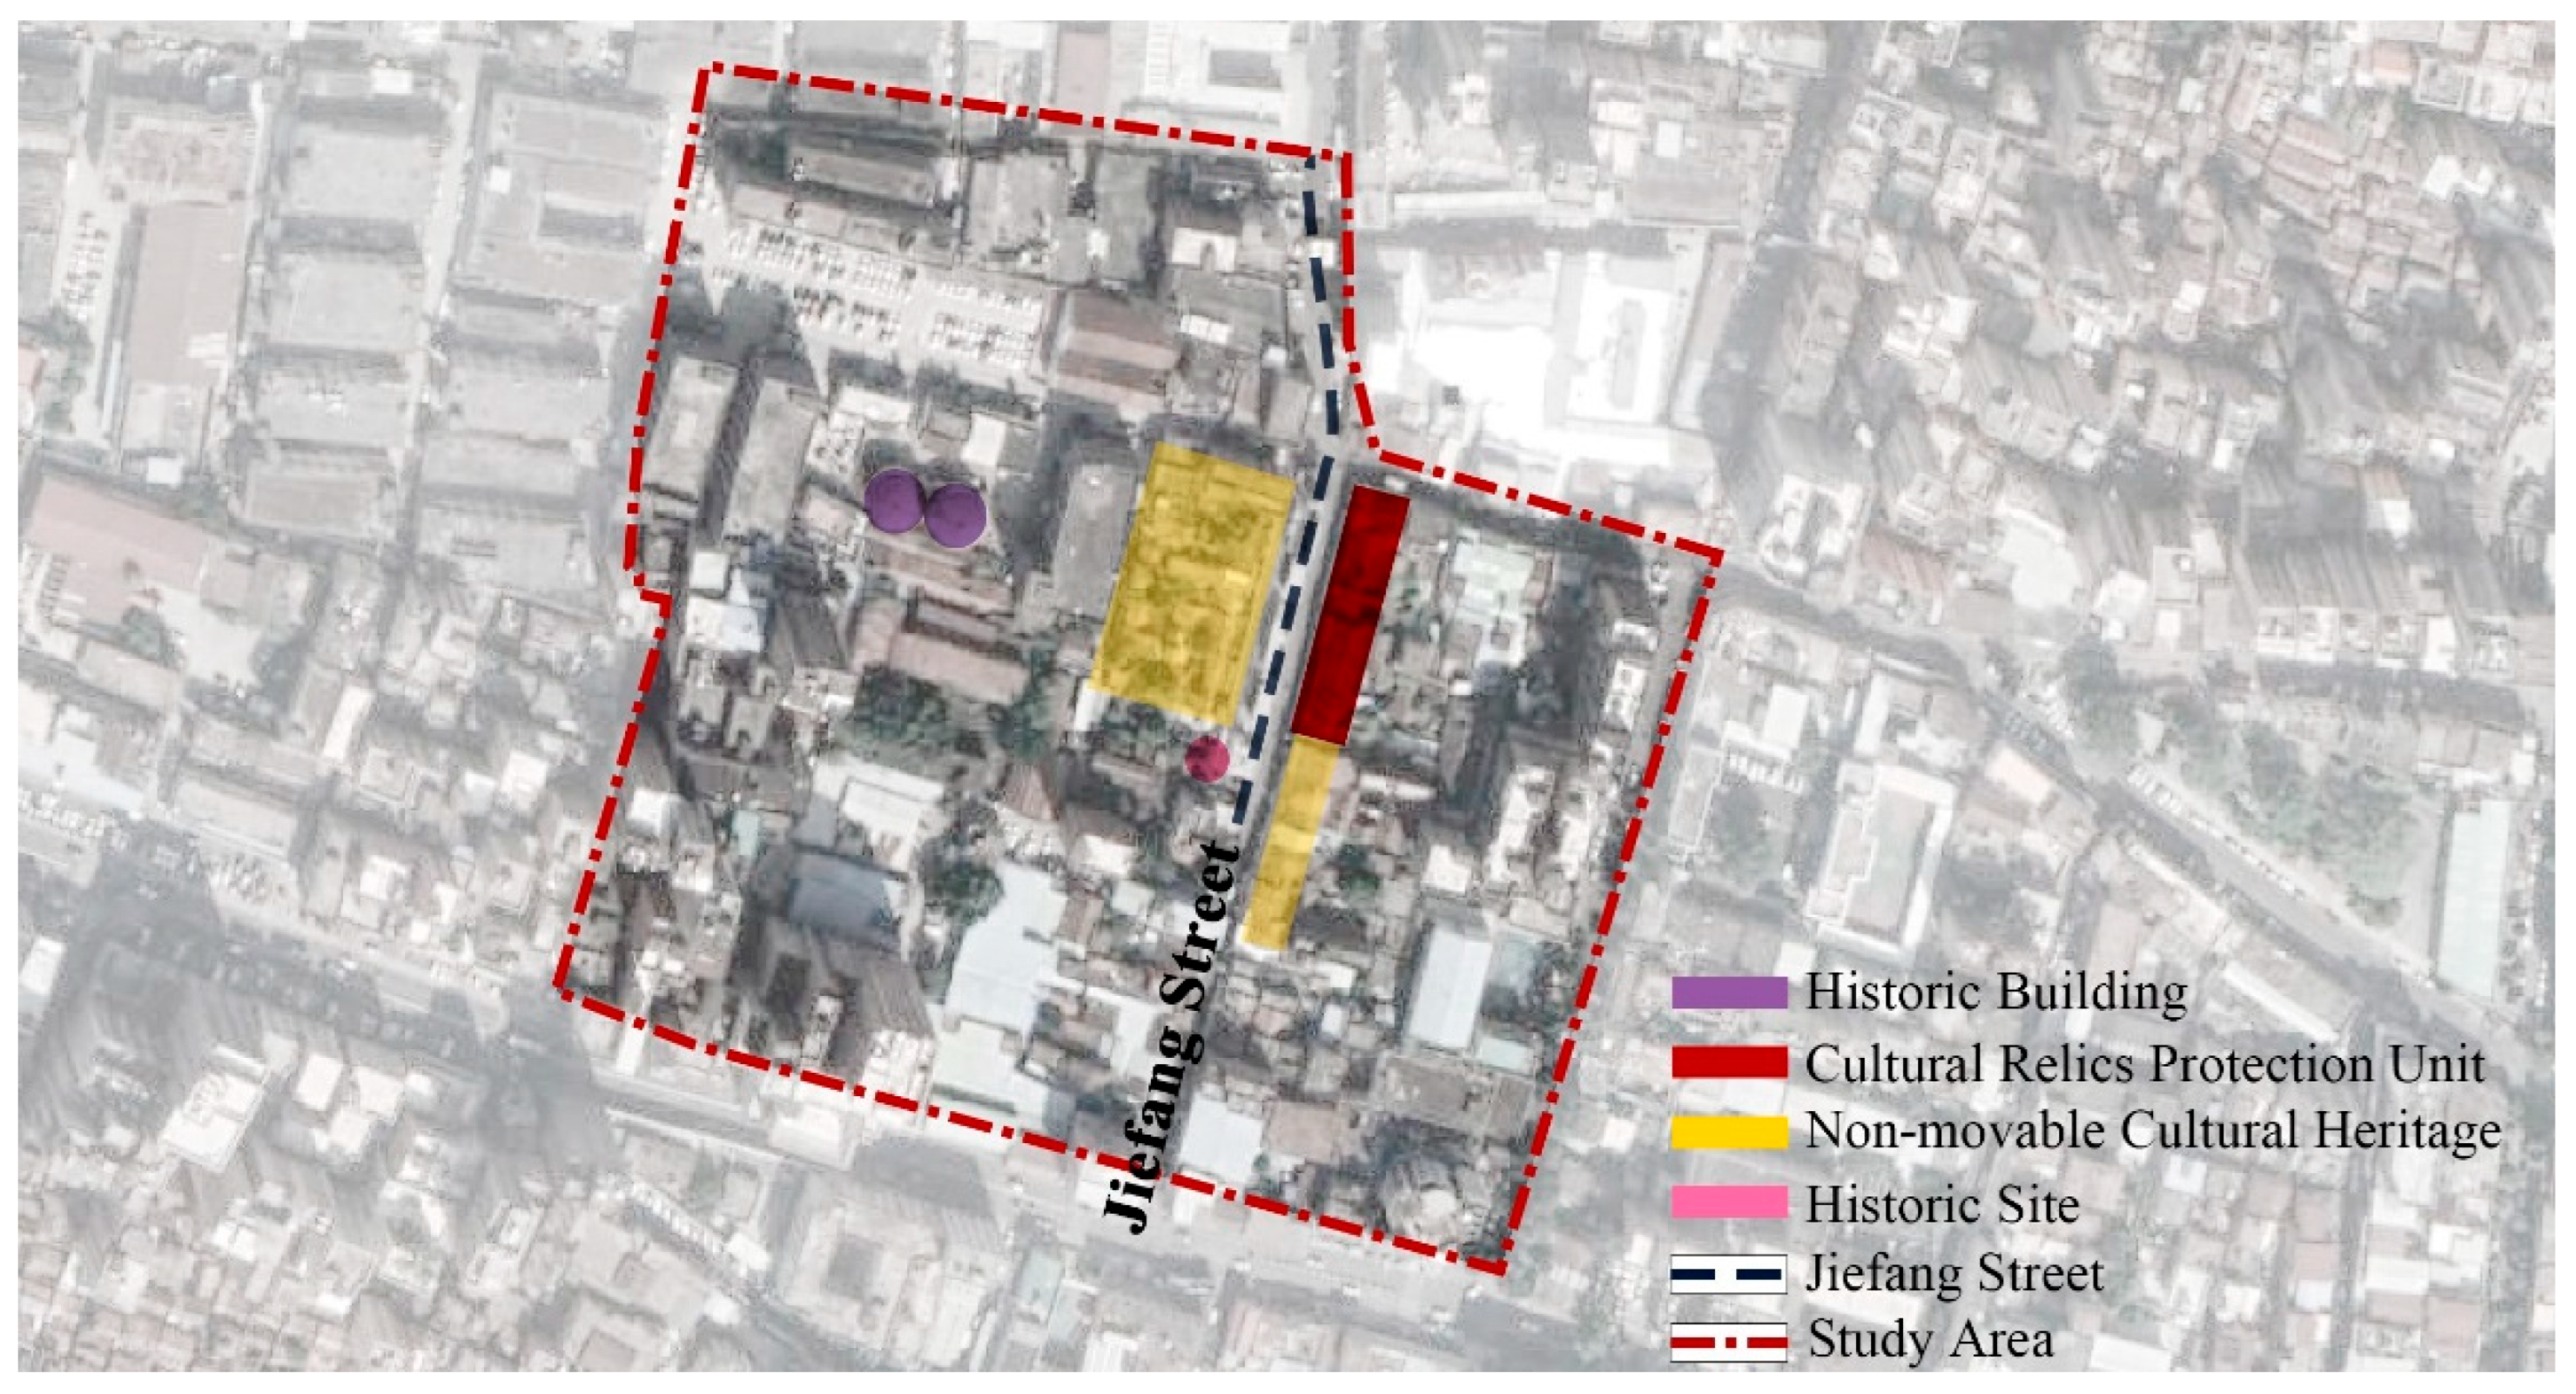
Figure 2.
Schematic diagram of historical and cultural elements in Gongming Ancient Fair (source: author Liu H.).
Figure 2.
Schematic diagram of historical and cultural elements in Gongming Ancient Fair (source: author Liu H.).
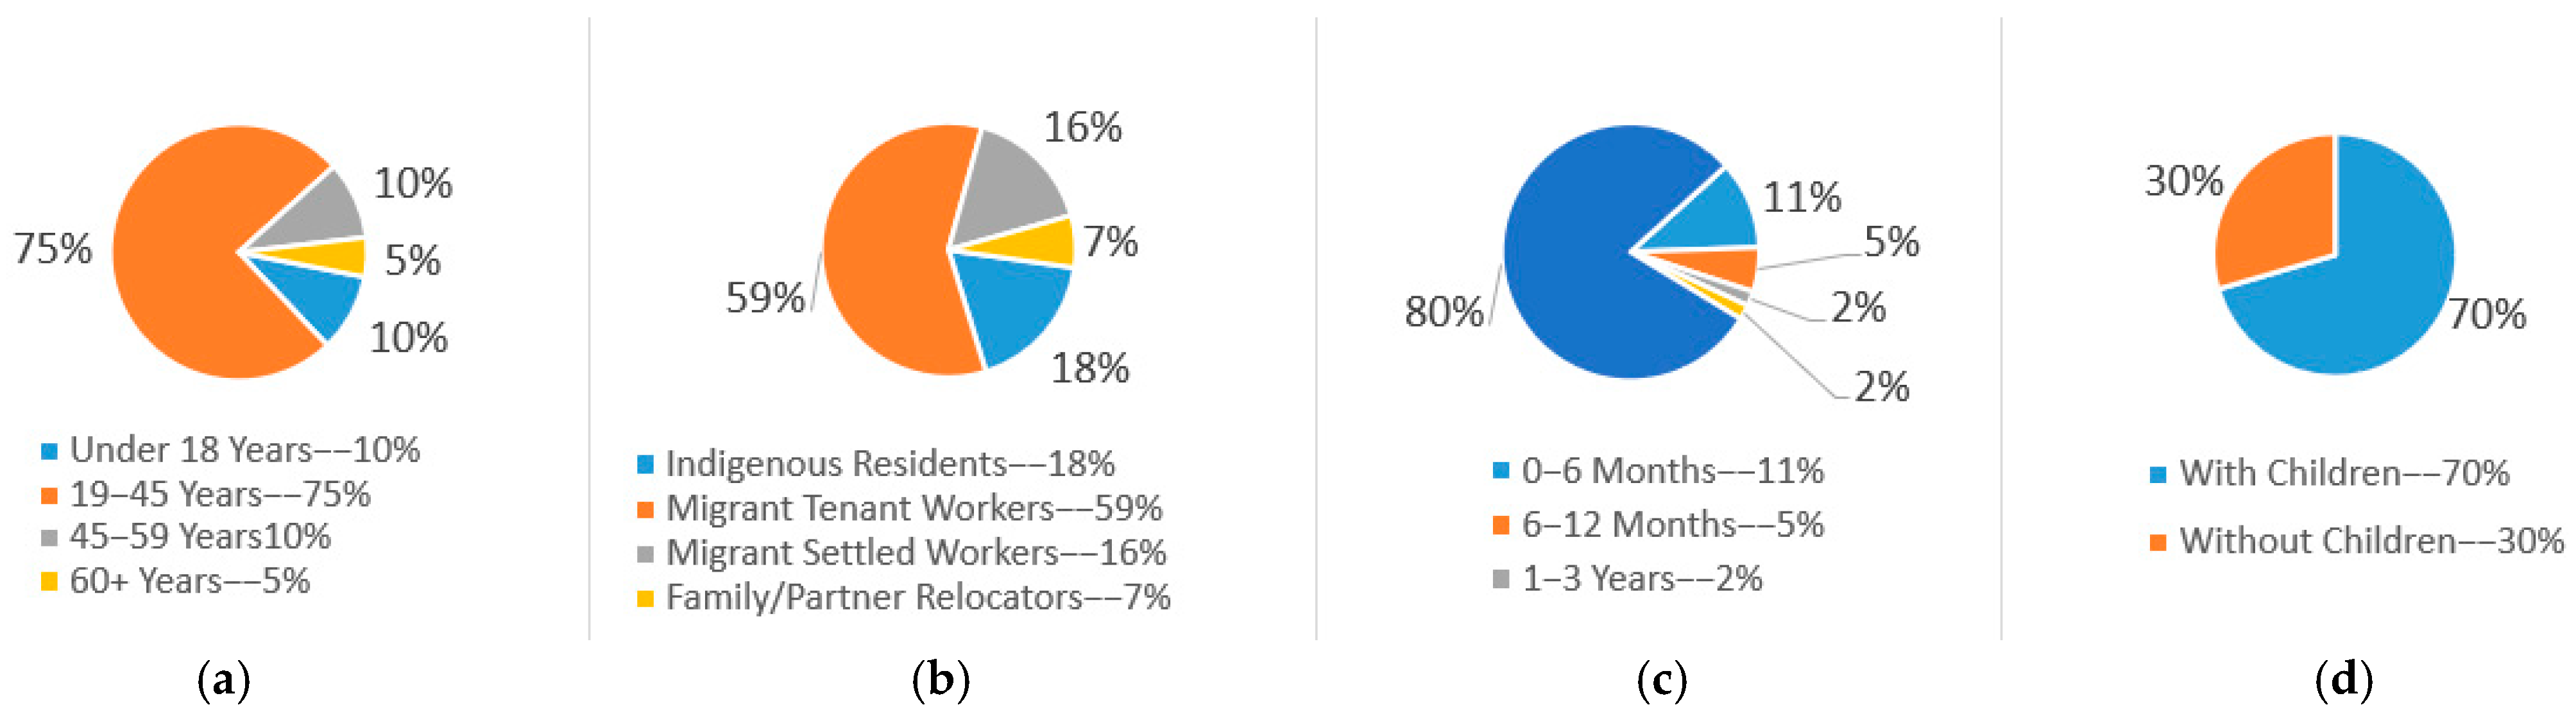
Figure 3.
Demographic chart of respondents: (a) age distribution, (b) resident typology, (c) length of residence, and (d) child-rearing status (source: author Liu H.).
Figure 3.
Demographic chart of respondents: (a) age distribution, (b) resident typology, (c) length of residence, and (d) child-rearing status (source: author Liu H.).
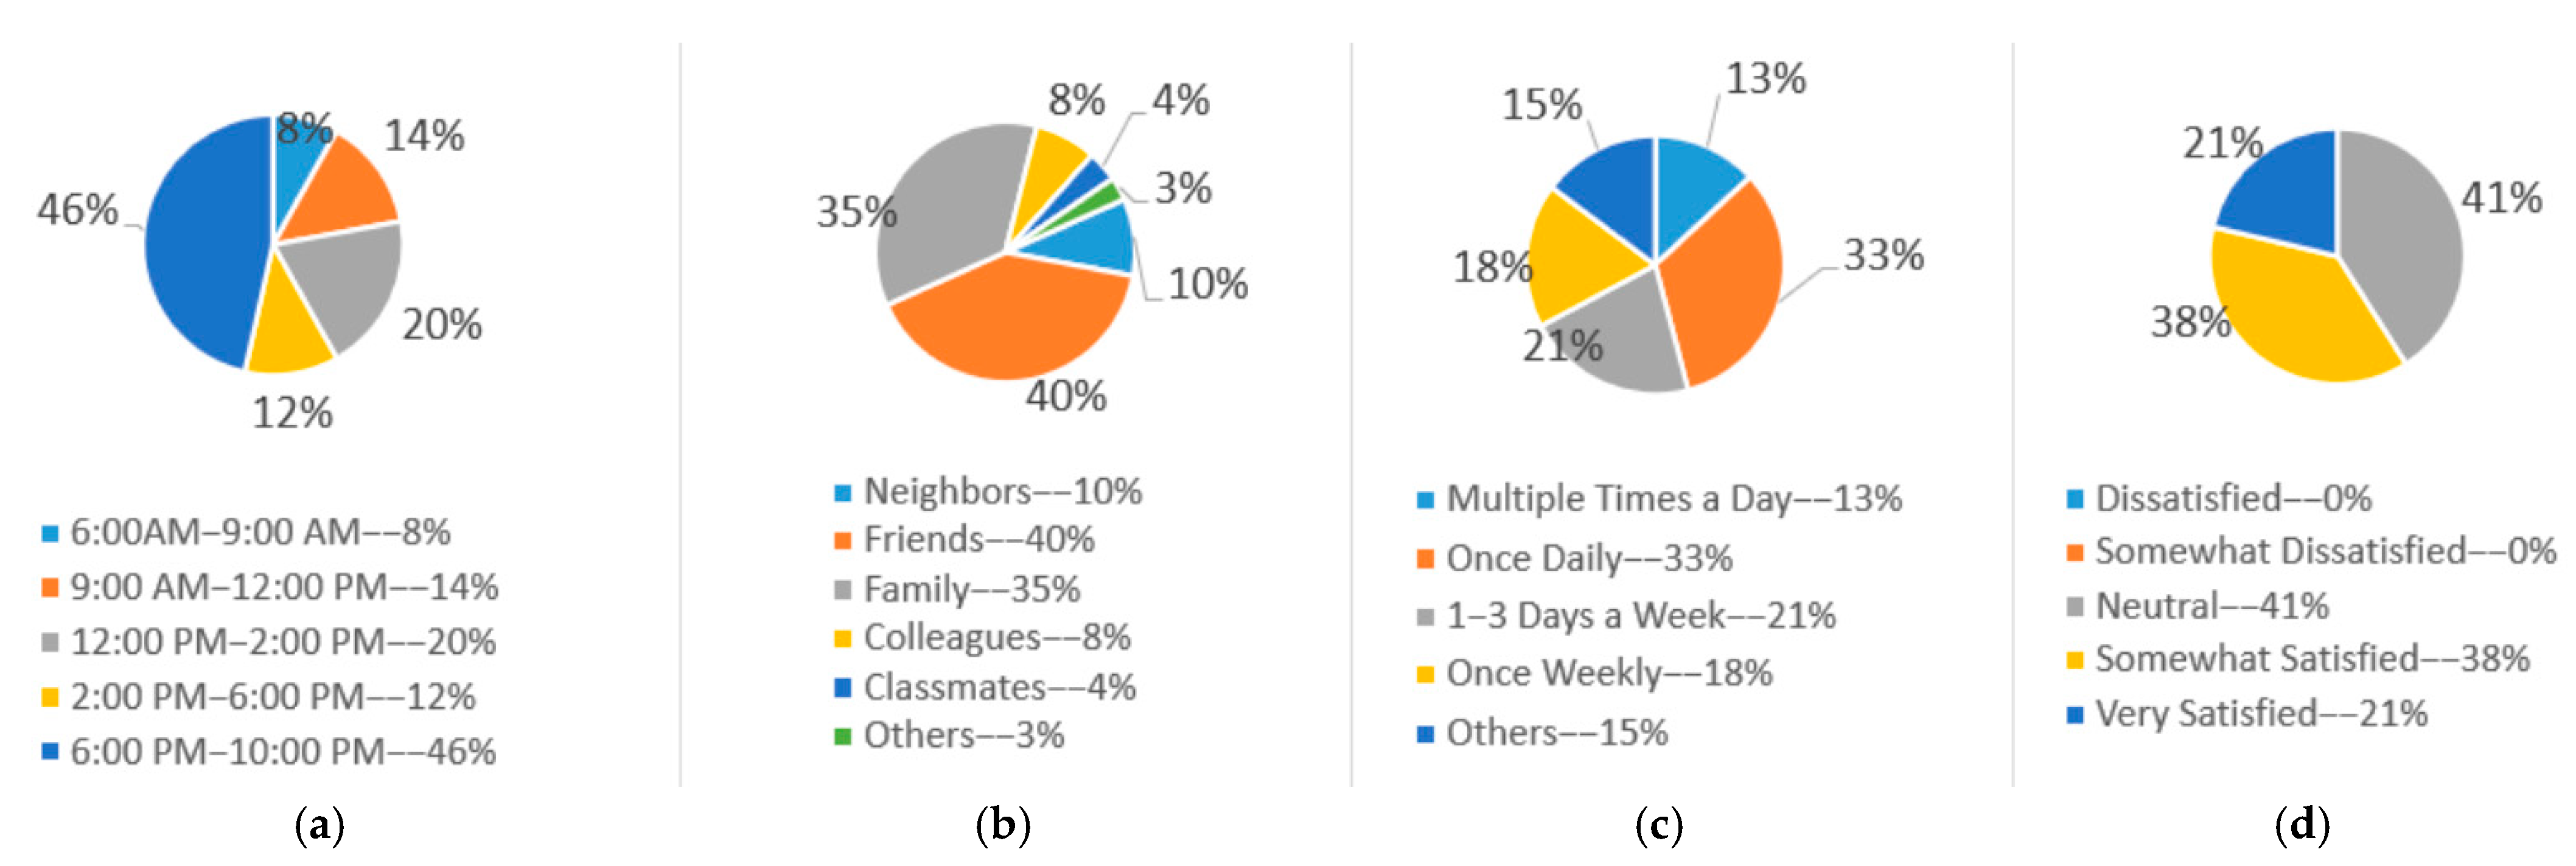
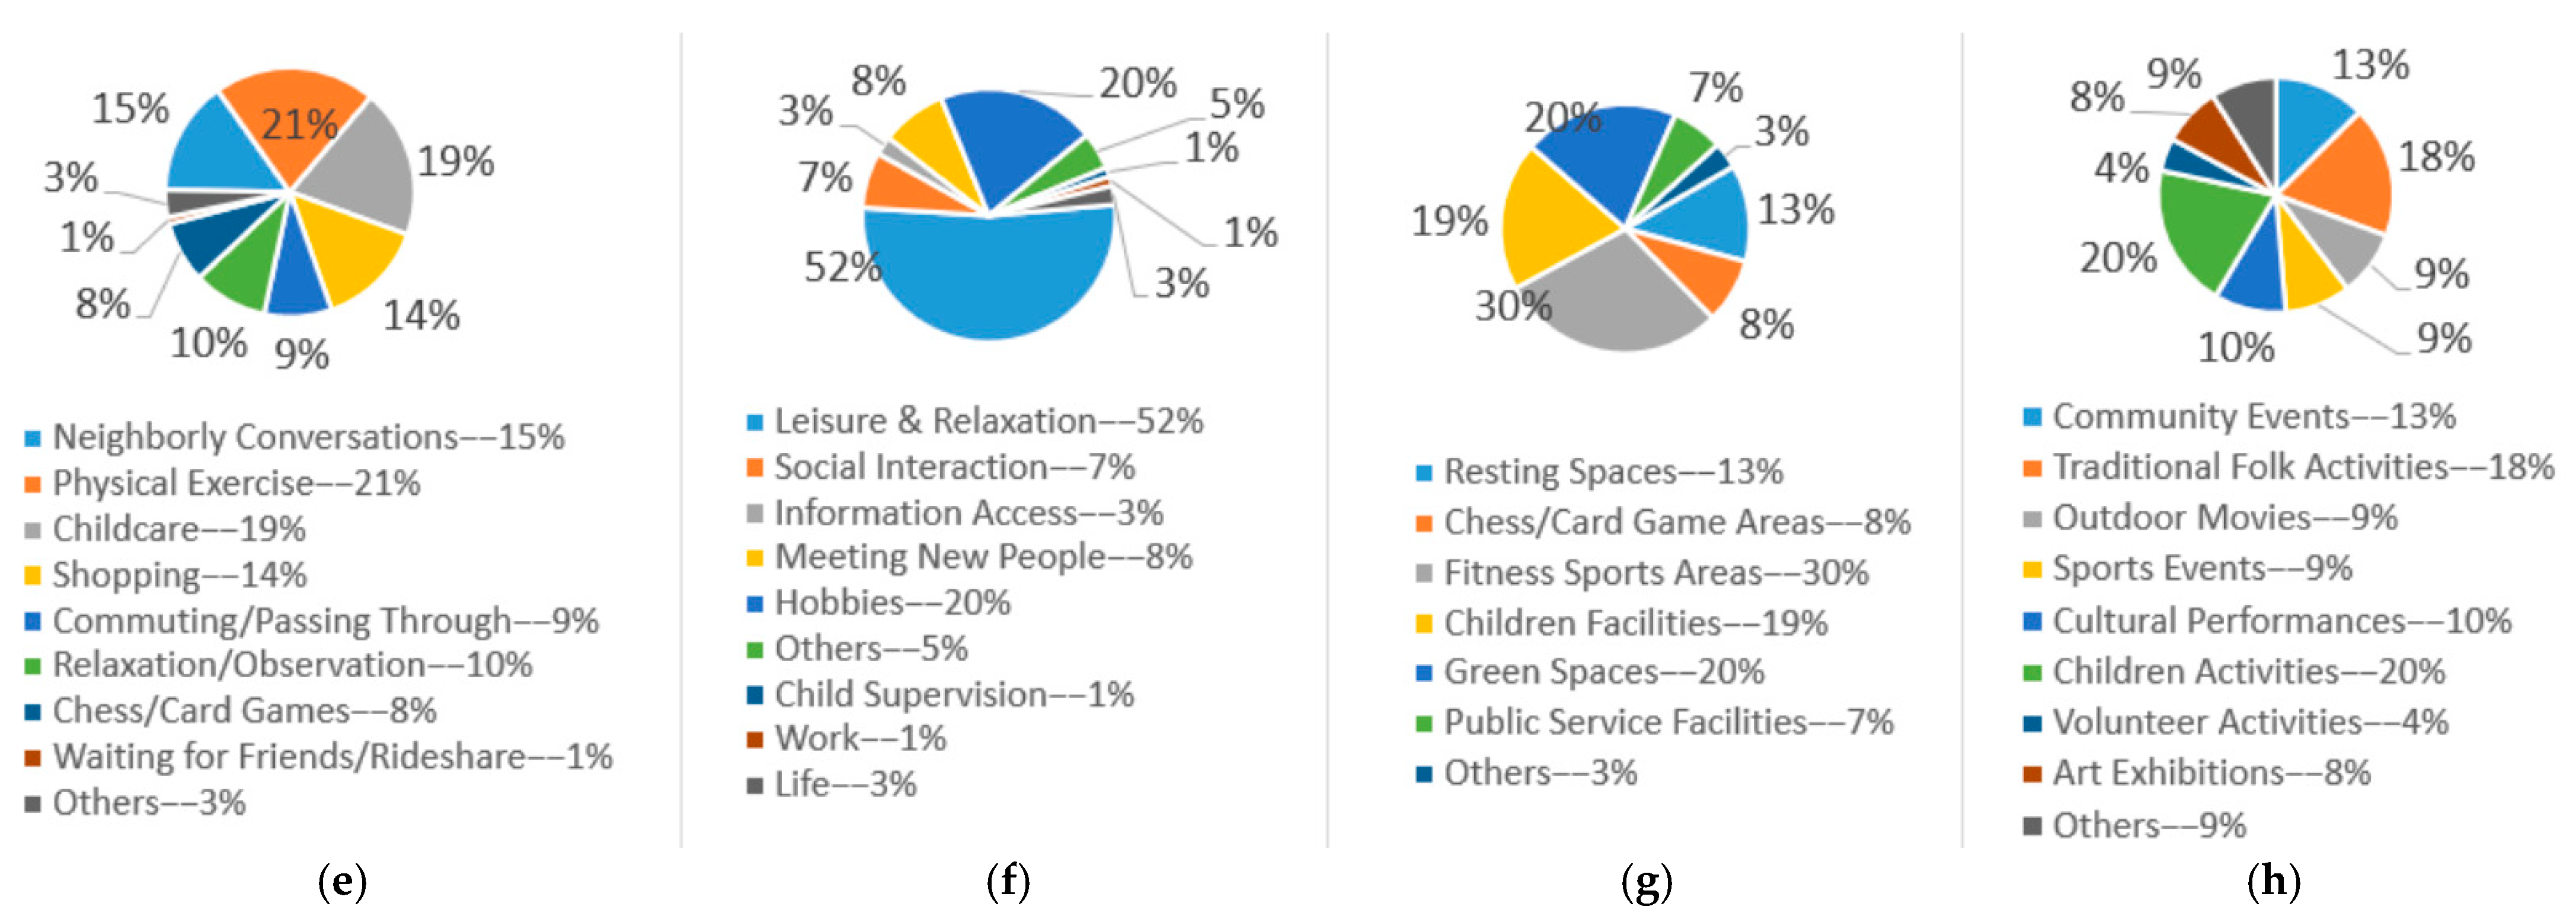
Figure 4.
Public activity participation of respondents: (a) leisure time allocation, (b) social companionship, (c) public activity frequency, (d) residential satisfaction, (e) current public activities, (f) motivations for public activities, (g) desired public spaces, and (h) desired public activities (source: author Liu H.).
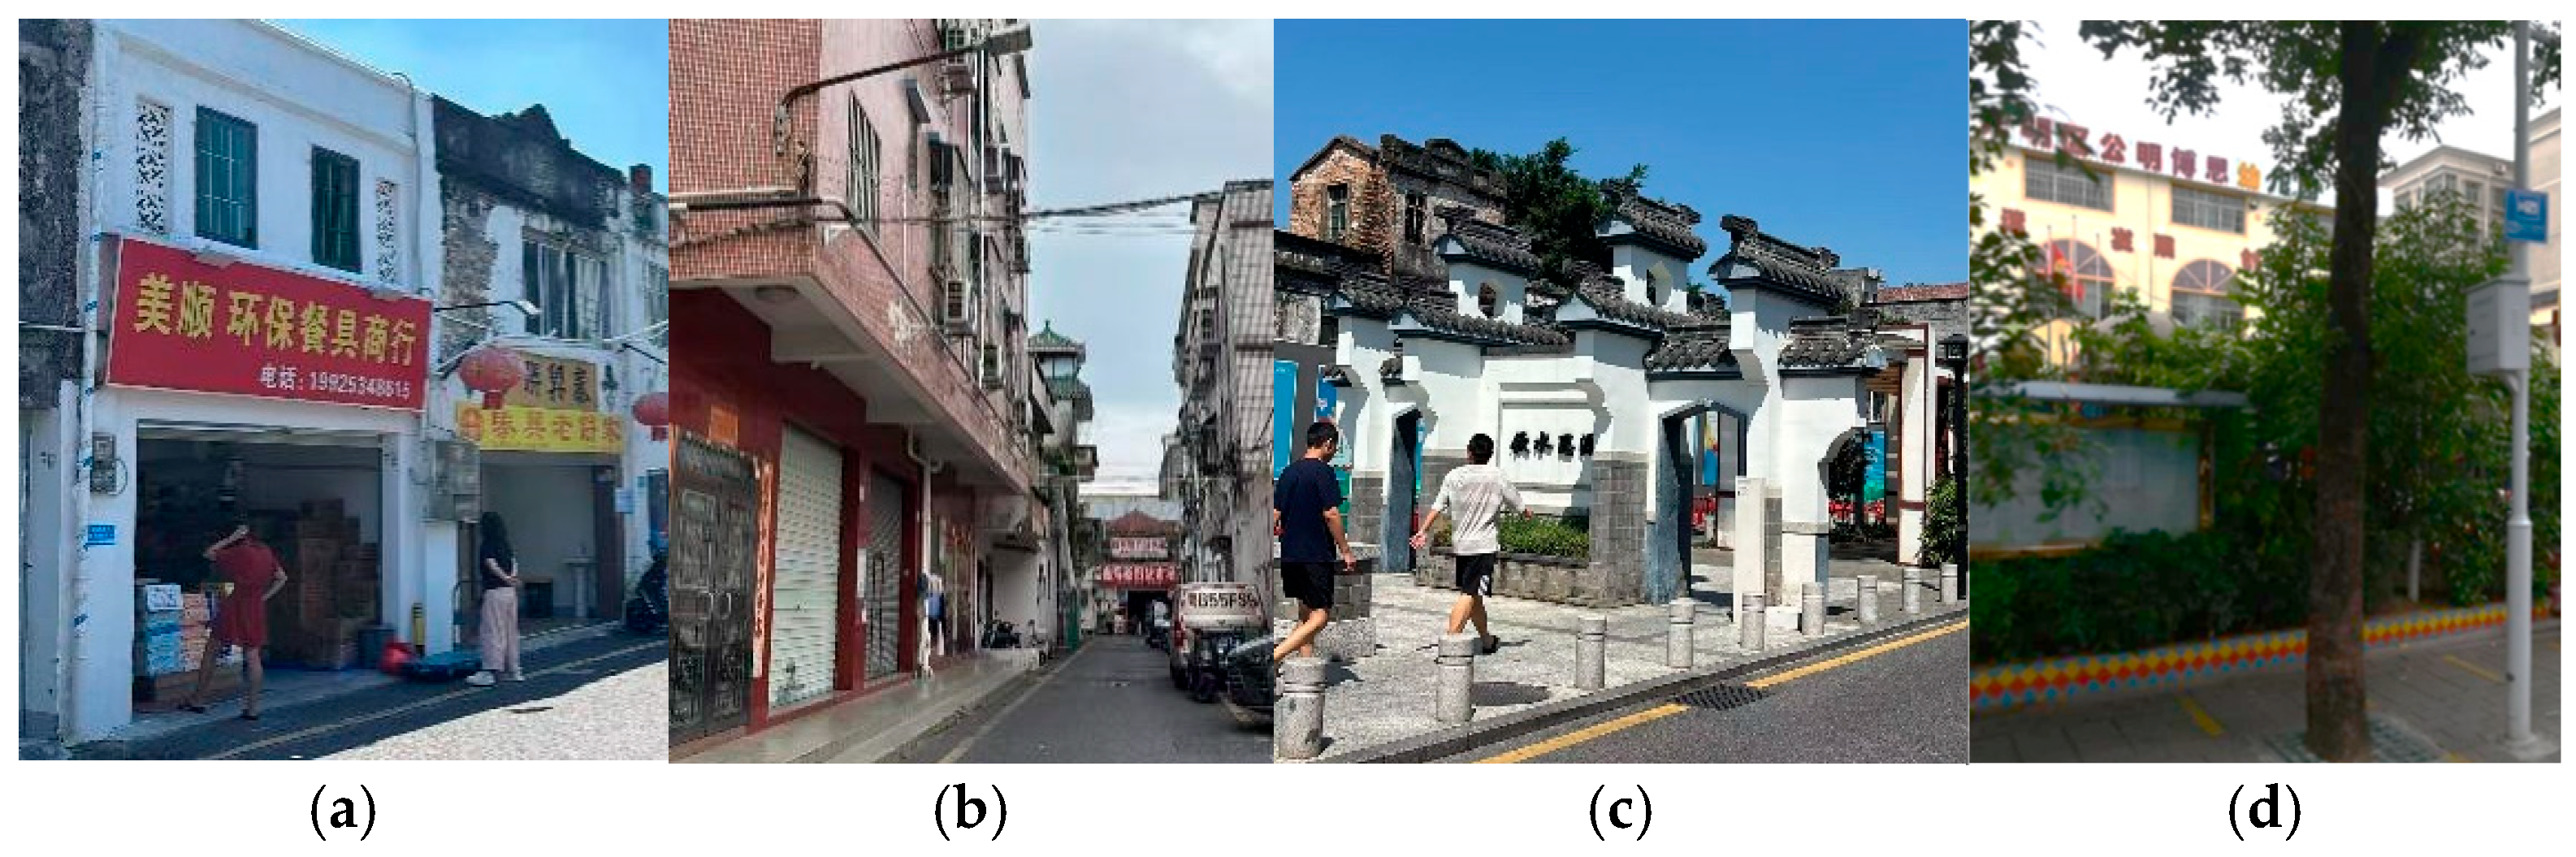
Figure 5.
Classification of public spaces: (a) shop-front spaces, (b) residential-front spaces, (c) micro-plaza spaces, and (d) educational/medical facilities (source: author Liu H.).
Figure 5.
Classification of public spaces: (a) shop-front spaces, (b) residential-front spaces, (c) micro-plaza spaces, and (d) educational/medical facilities (source: author Liu H.).
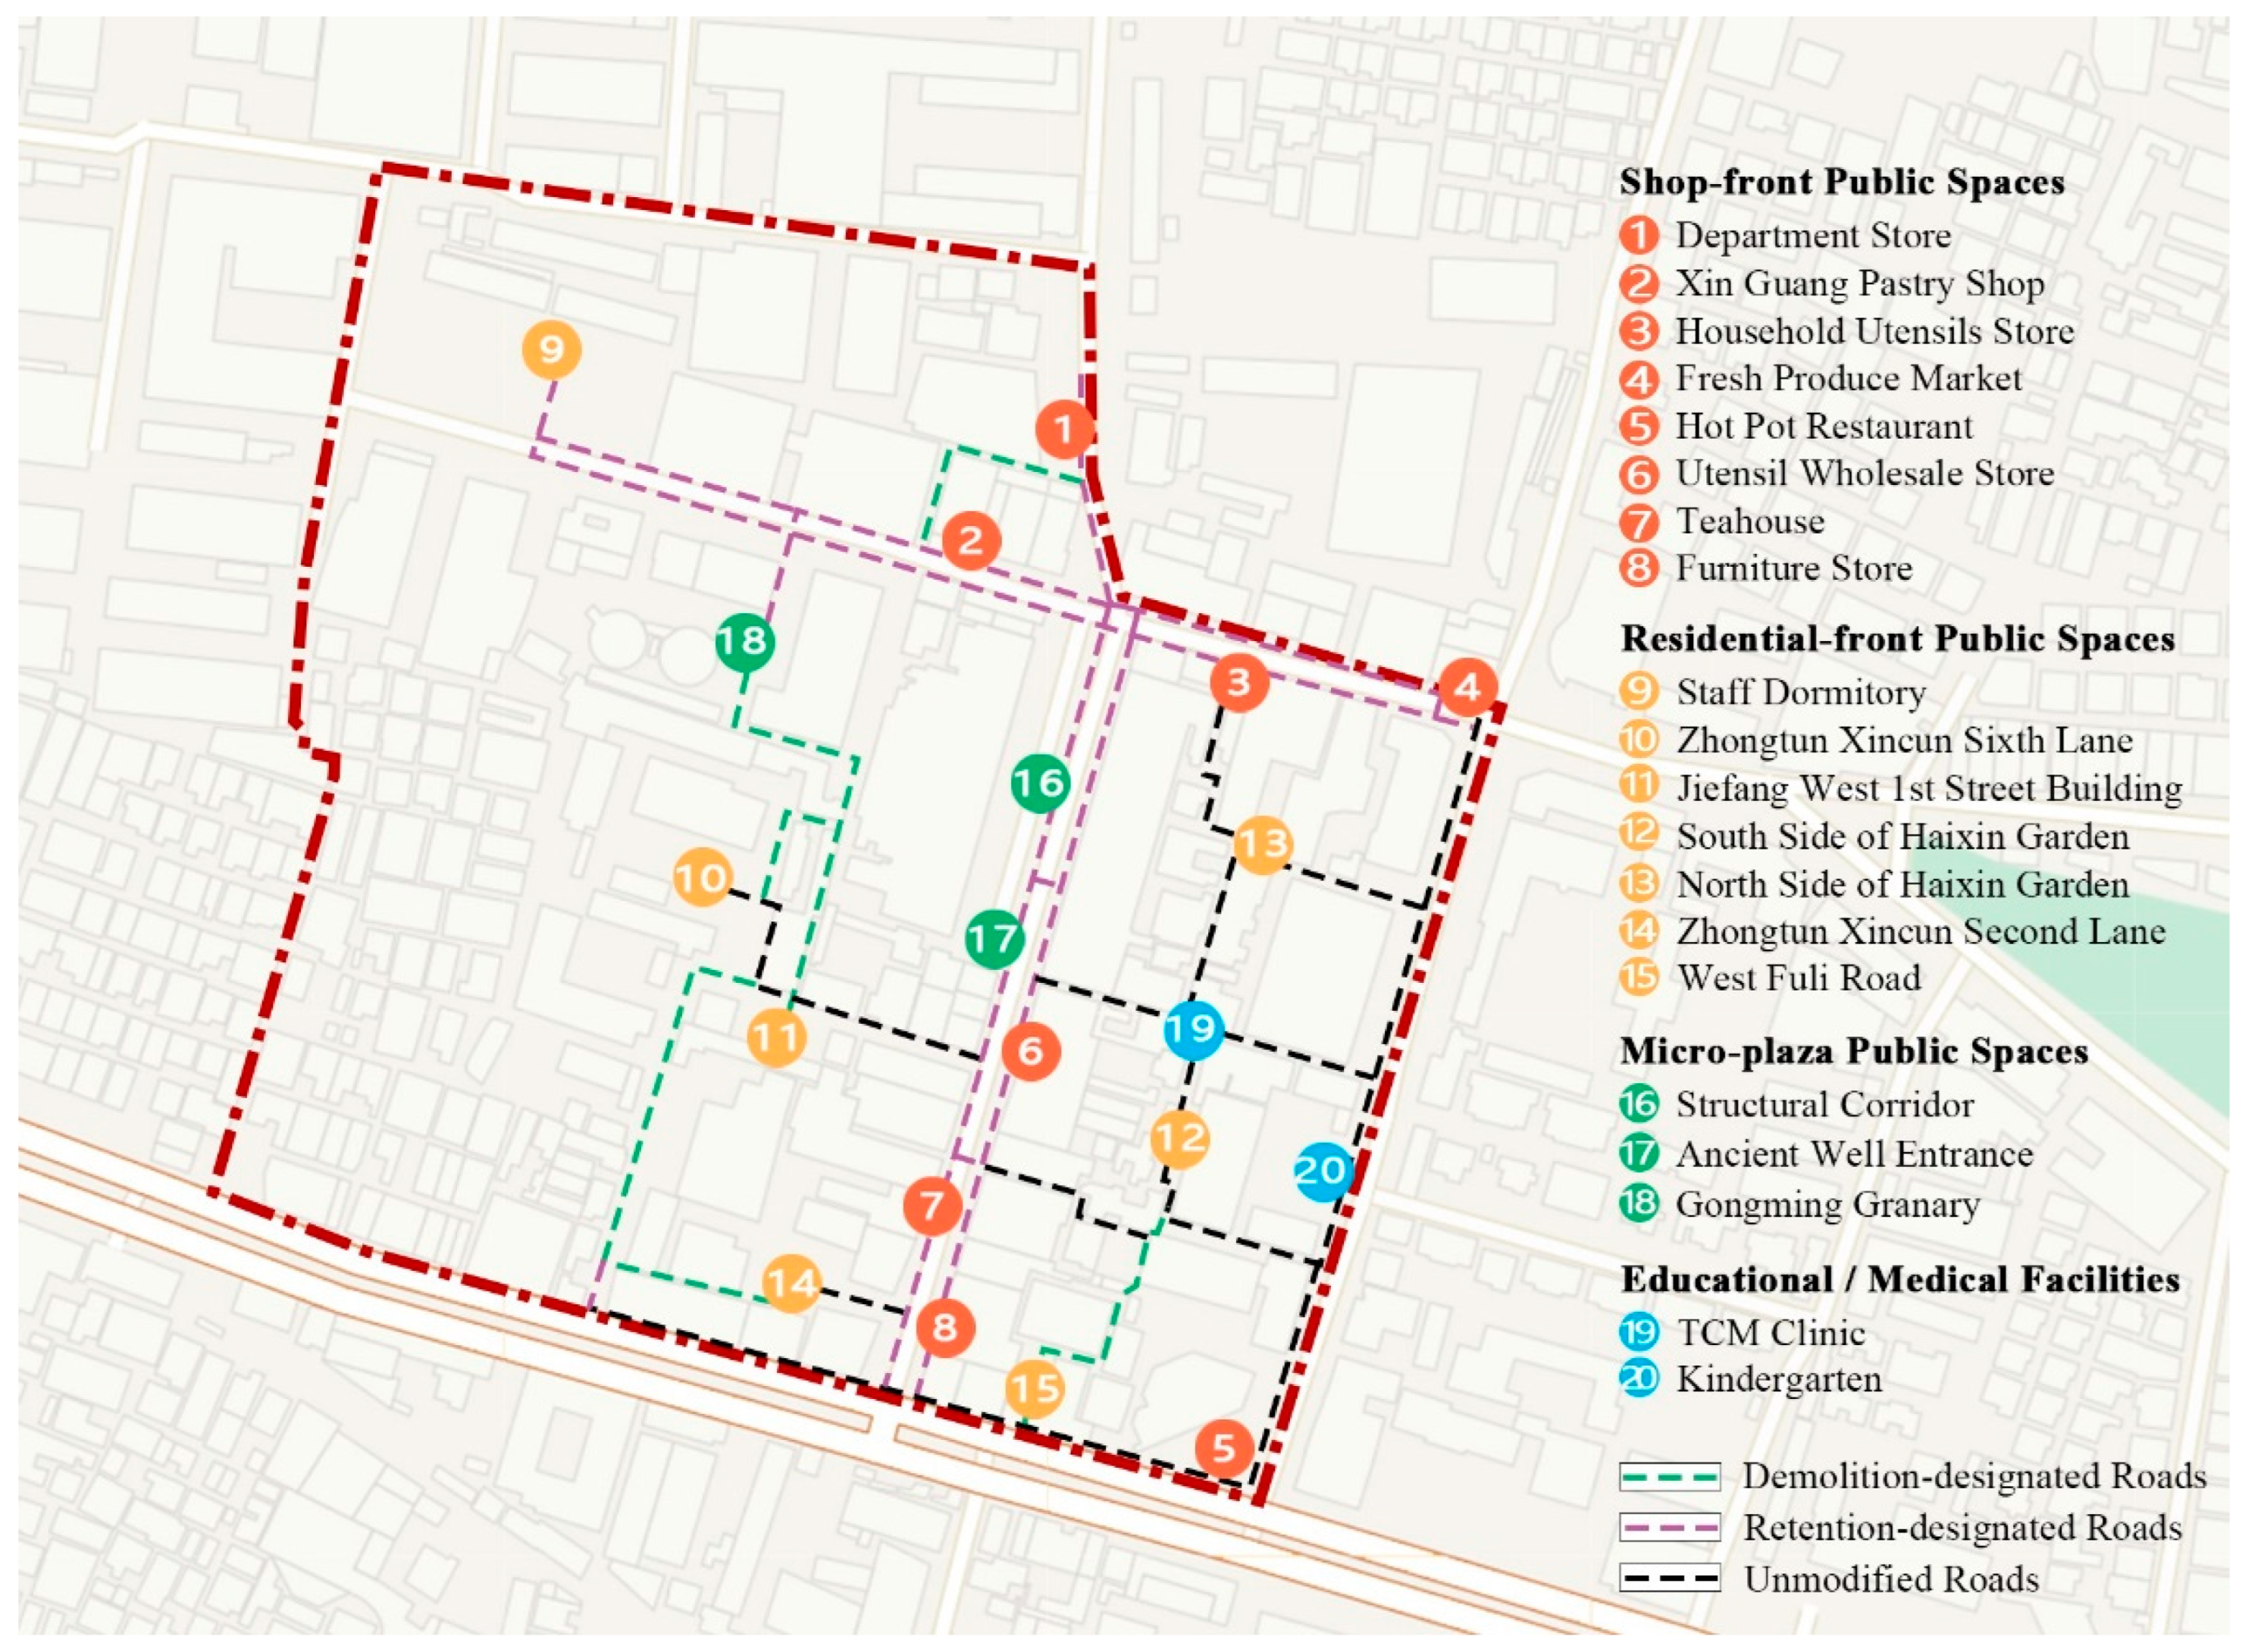
Figure 6.
Public space node distribution map of Gongming Ancient Fair (source: author Liu H.).
Figure 6.
Public space node distribution map of Gongming Ancient Fair (source: author Liu H.).
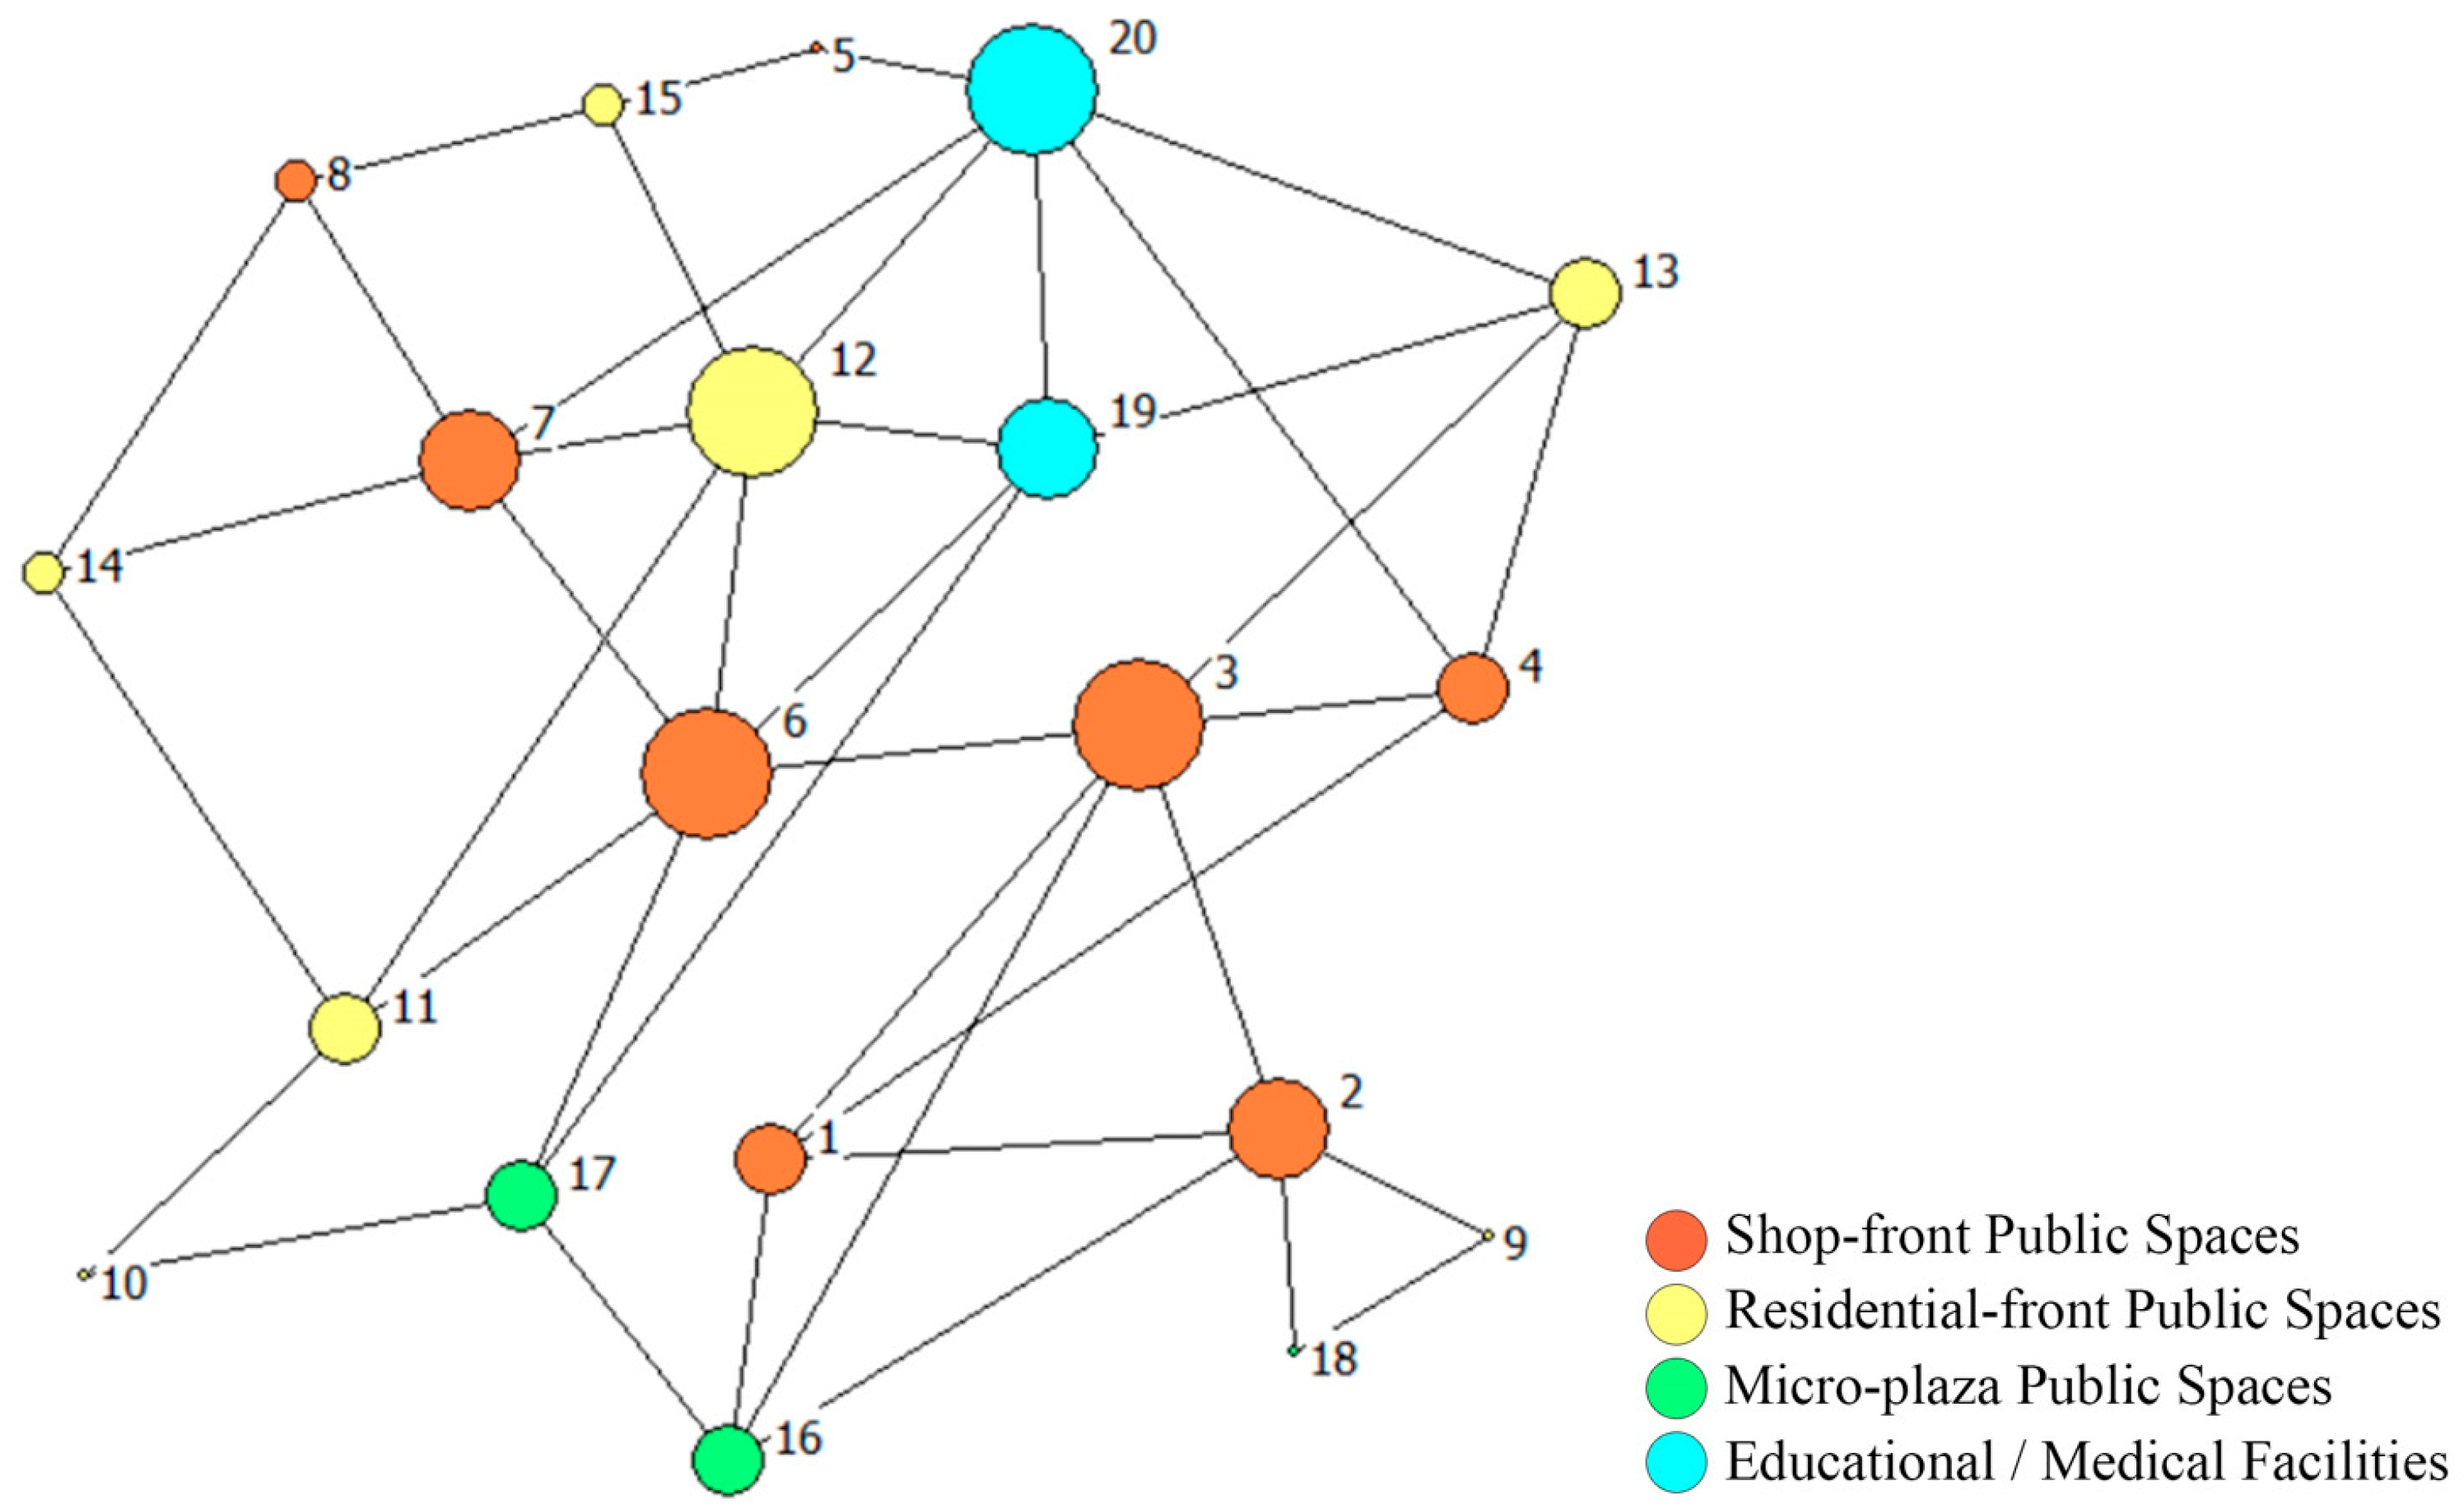
Figure 7.
Public space network with betweenness centrality as node weight (source: author Liu H.).
Figure 7.
Public space network with betweenness centrality as node weight (source: author Liu H.).
Figure 8.
Public activity network with betweenness centrality as node weight (source: author Liu H.).
Figure 8.
Public activity network with betweenness centrality as node weight (source: author Liu H.).
Figure 9.
Road adjustment planning diagram of Gongming Ancient Fair (source: author Liu H.).
Figure 9.
Road adjustment planning diagram of Gongming Ancient Fair (source: author Liu H.).
Figure 10.
Comparative analysis of public space network metrics before and after road adjustments of Gongming Ancient Fair (source: author Liu H.).
Figure 10.
Comparative analysis of public space network metrics before and after road adjustments of Gongming Ancient Fair (source: author Liu H.).
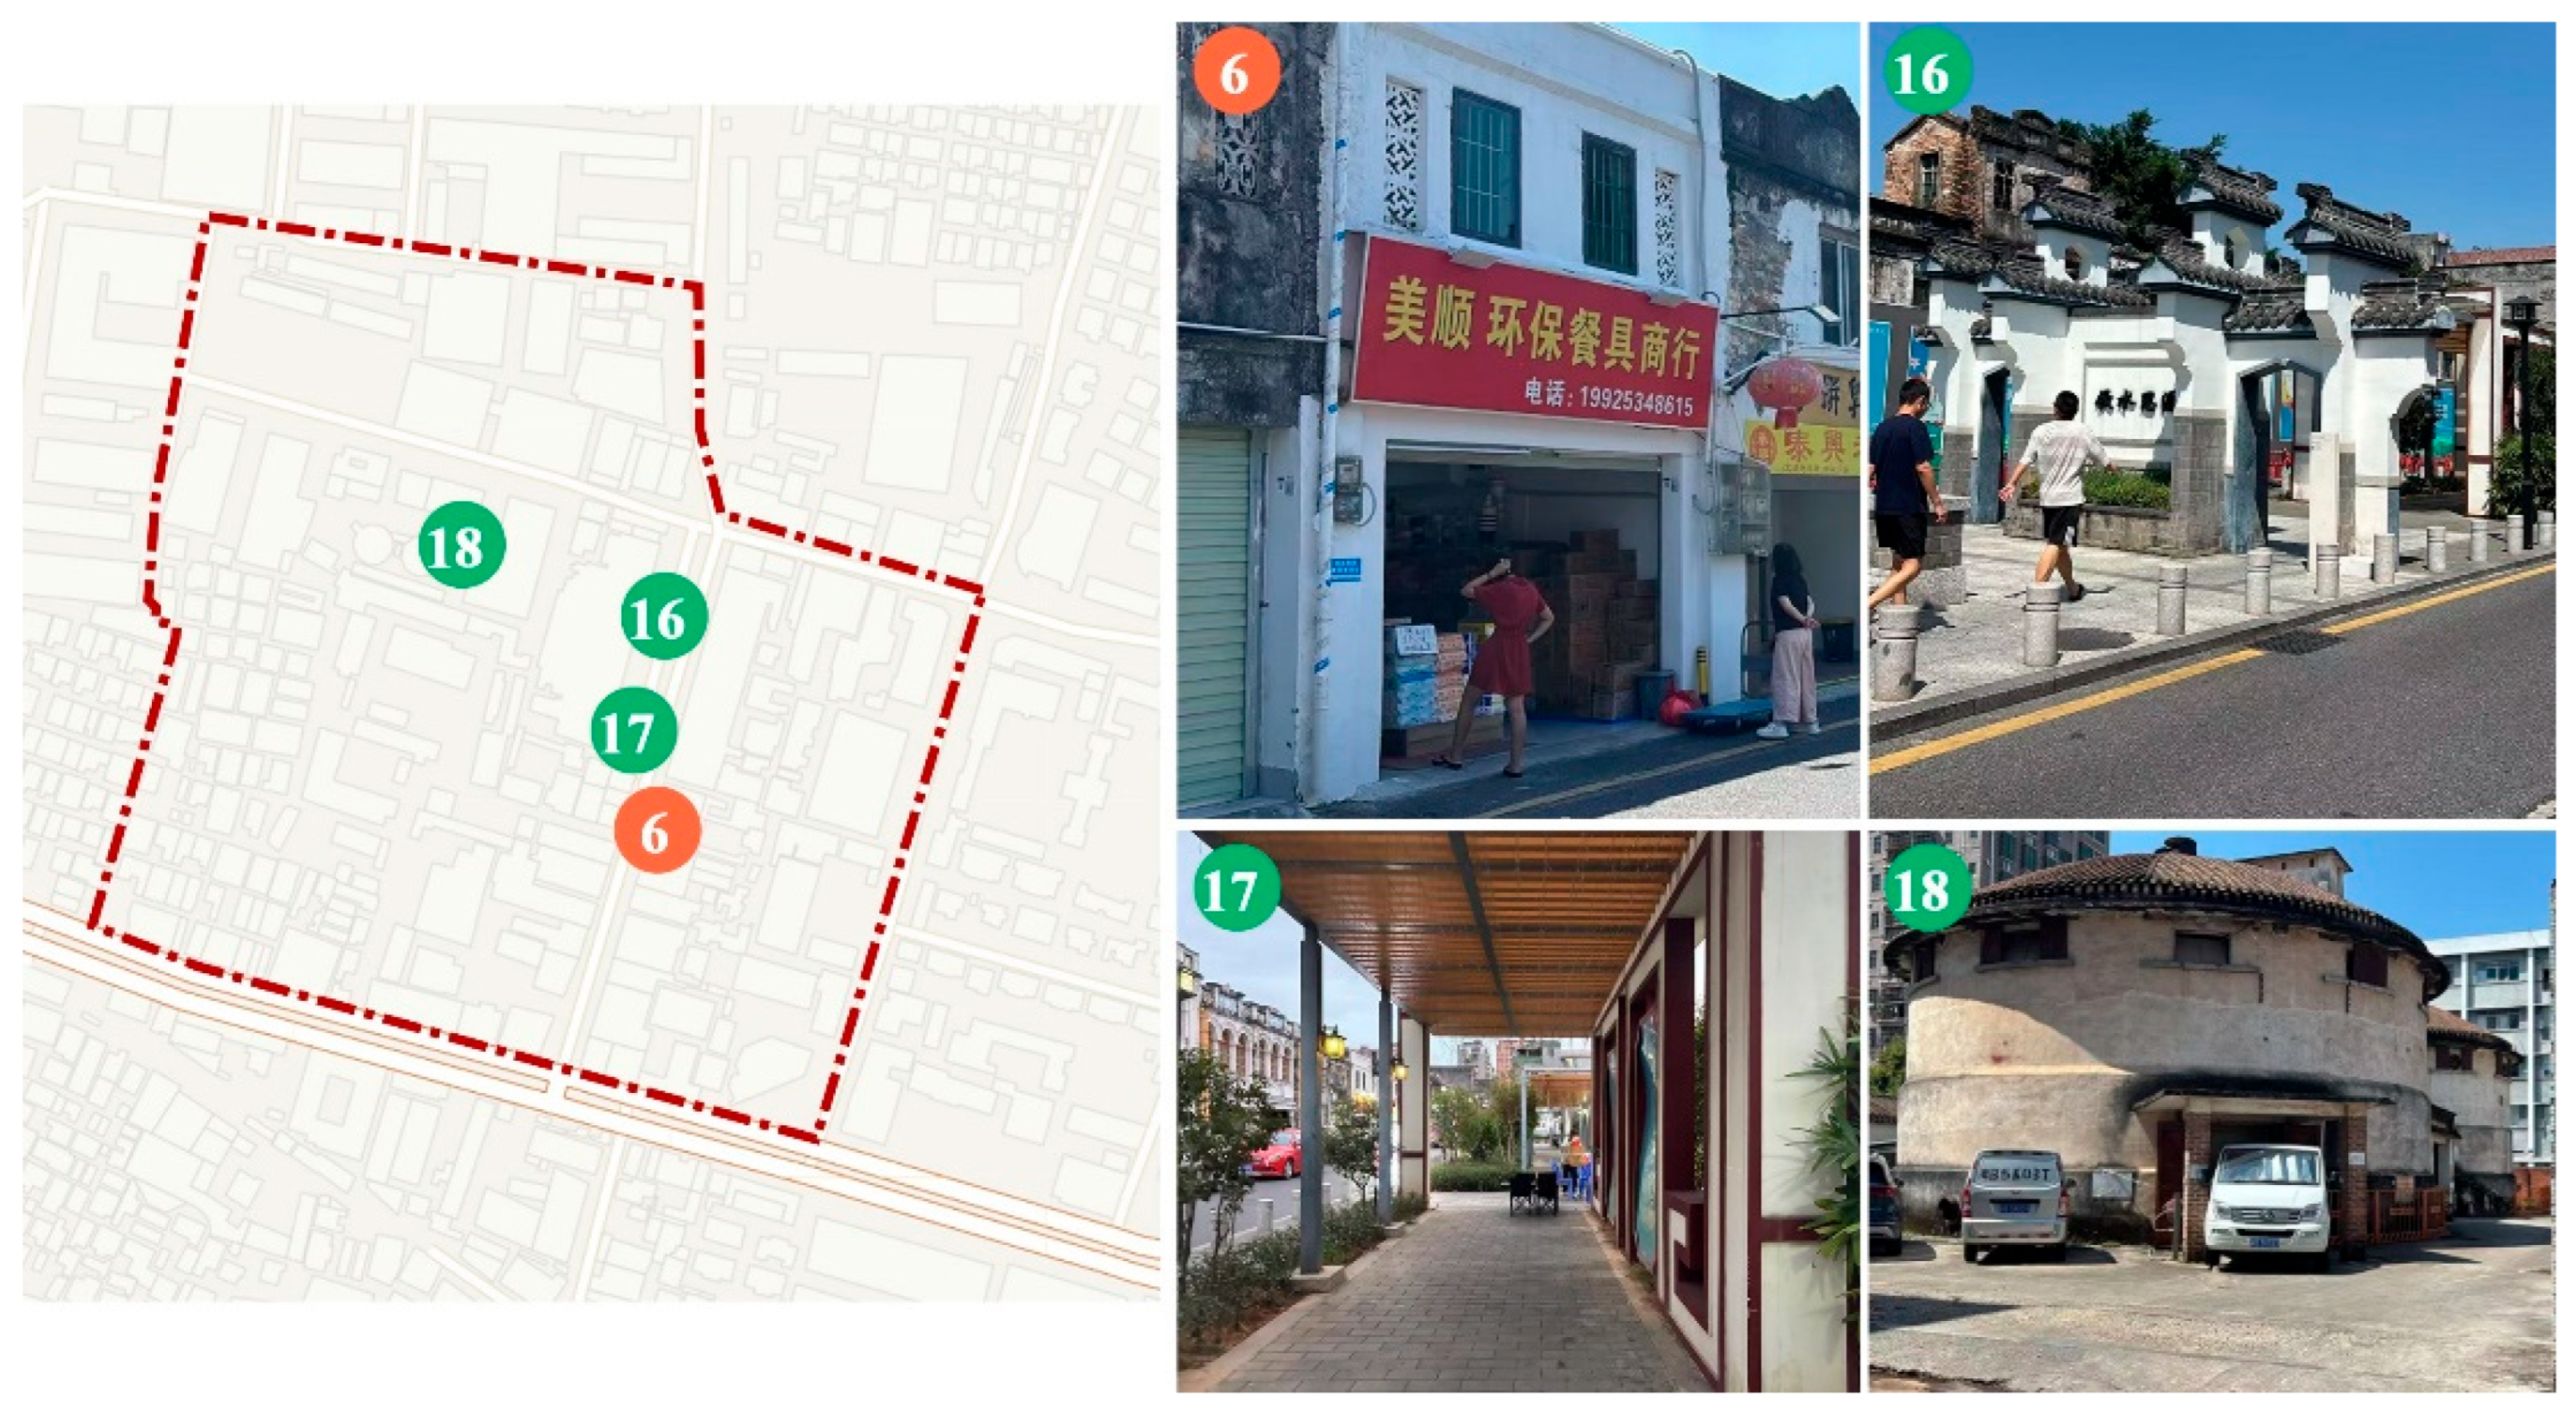
Figure 11.
Key node locations and existing conditions map (source: author Liu H.).
Figure 11.
Key node locations and existing conditions map (source: author Liu H.).
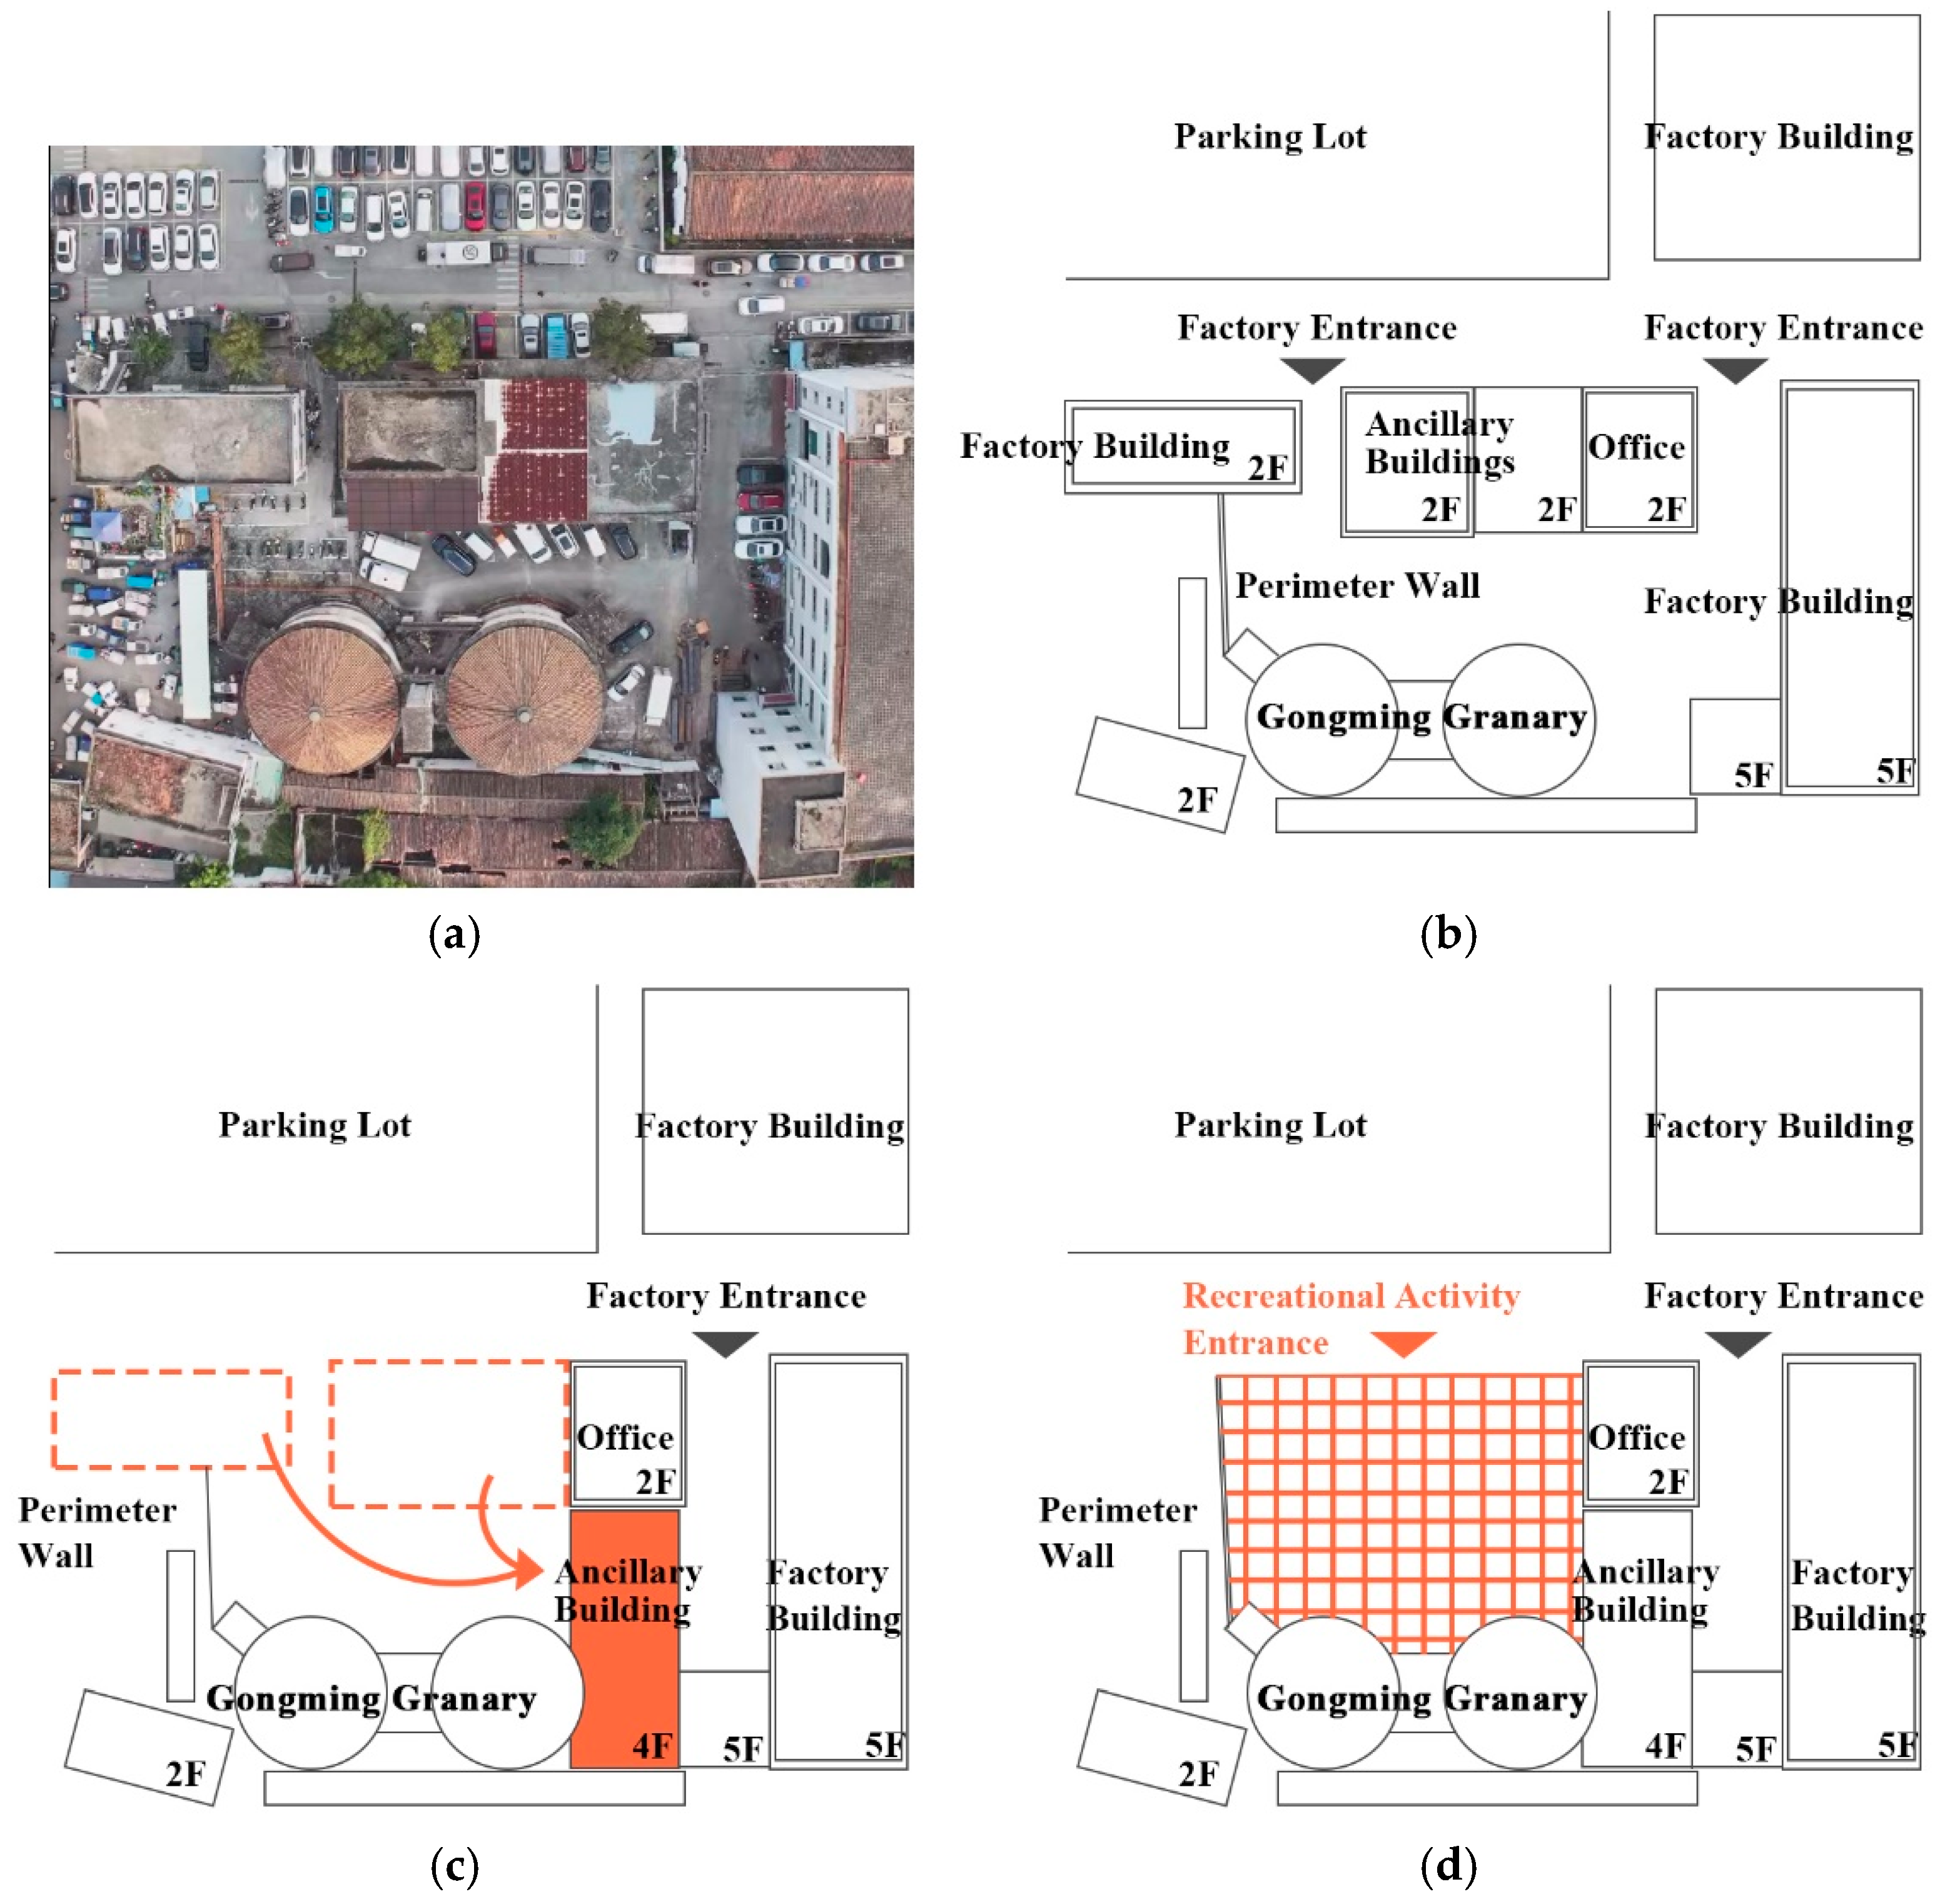
Figure 12.
Adaptive reuse schematic diagram of Gongming Granary: (a) aerial photograph by drone, (b) existing site plan, (c) relocatable factory buildings, and (d) factory and recreational traffic paths (source: author Liu H.).
Figure 12.
Adaptive reuse schematic diagram of Gongming Granary: (a) aerial photograph by drone, (b) existing site plan, (c) relocatable factory buildings, and (d) factory and recreational traffic paths (source: author Liu H.).
Table 1.
Public space network metrics of Gongming Ancient Fair (source: author Liu H.).
Table 1.
Public space network metrics of Gongming Ancient Fair (source: author Liu H.).
| Node Count | Relative Average Node Degree | Density | Average Betweenness Centrality | Betweenness Centralization | Network Clustering Coefficient | Average Path Length | Small-World Quotient (SW) |
|---|
| 20 | 4 | 0.211 | 13.800 | 19.44% | 0.373 | 2.453 | 1.501 |
Table 2.
Betweenness centrality of public space network nodes in Gongming Ancient Fair (source: author Liu H.).
Table 2.
Betweenness centrality of public space network nodes in Gongming Ancient Fair (source: author Liu H.).
| Node 1 | Node 2 | Node 3 | Node 4 | Node 5 | Node 6 | Node 7 | Node 8 | Node 9 | Node 10 |
|---|
| 4.843 | 34.000 | 45.379 | 11.400 | 1.667 | 43.136 | 21.333 | 2.000 | 0.000 | 1.367 |
| Node 11 | Node 12 | Node 13 | Node 14 | Node 15 | Node 16 | Node 17 | Node 18 | Node 19 | Node 20 |
| 12.036 | 20.293 | 6.243 | 2.583 | 3.833 | 10.719 | 16.764 | 0.000 | 10.102 | 28.302 |
Table 3.
Public activity network metrics of Gongming Ancient Fair (source: author Liu H.).
Table 3.
Public activity network metrics of Gongming Ancient Fair (source: author Liu H.).
| Node Count | Relative Average Node Degree | Density | Average Betweenness Centrality | Betweenness Centralization | Network Clustering Coefficient | Average Path Length | Small-World Quotient (SW) |
|---|
| 20 | 4.900 | 0.258 | 11.300 | 24.03% | 0.498 | 2.189 | 1.782 |
Table 4.
Betweenness centrality of public activity network nodes in Gongming Ancient Fair (source: author Liu H.).
Table 4.
Betweenness centrality of public activity network nodes in Gongming Ancient Fair (source: author Liu H.).
| Node 1 | Node 2 | Node 3 | Node 4 | Node 5 | Node 6 | Node 7 | Node 8 | Node 9 | Node 10 |
|---|
| 2.074 | 15.532 | 12.415 | 12.543 | 3.476 | 50.342 | 9.214 | 19.817 | 0.533 | 0.000 |
| Node 11 | Node 12 | Node 13 | Node 14 | Node 15 | Node 16 | Node 17 | Node 18 | Node 19 | Node 20 |
| 21.952 | 11.549 | 2.750 | 1.583 | 3.583 | 13.987 | 17.385 | 0.000 | 8.150 | 19.113 |
Table 5.
Nodes with betweenness centrality differences exceeding 10 between the two networks (source: author Liu H.).
Table 5.
Nodes with betweenness centrality differences exceeding 10 between the two networks (source: author Liu H.).
| Betweenness Centrality | Node 2 | Node 3 | Node 7 | Node 8 |
|---|
| Public Space Network | 34.000 | 45.379 | 21.333 | 2.000 |
| Public Activity Network | 15.532 | 12.415 | 9.214 | 19.817 |
Table 6.
Public space network metrics of Gongming Ancient Fair after road adjustments (source: author Liu H.).
Table 6.
Public space network metrics of Gongming Ancient Fair after road adjustments (source: author Liu H.).
| Node Count | Relative Average Node Degree | Density | Average Betweenness Centrality | Betweenness Centralization | Network Clustering Coefficient | Average Path Length | Small-World Quotient (SW) |
|---|
| 20 | 8.500 | 0.447 | 6.300 | 7.40% | 0.650 | 1.663 | 1.340 |
Table 7.
Comparison of node betweenness centrality before and after road adjustments in Gongming Ancient Fair (ranked by magnitude) (source: author Liu H.).
Table 7.
Comparison of node betweenness centrality before and after road adjustments in Gongming Ancient Fair (ranked by magnitude) (source: author Liu H.).
| Before Road Adjustments | After Road Adjustments |
|---|
| Node Name | Betweenness Centrality | Node Name | Betweenness Centrality | Node Name | Betweenness Centrality | Node Name | Betweenness Centrality |
|---|
| Node 3 | 45.379 | Node 19 | 10.102 | Node 6 | 18.326 | Node 8 | 4.818 |
| Node 6 | 43.136 | Node 13 | 6.243 | Node 20 | 13.844 | Node 12 | 3.636 |
| Node 2 | 34.000 | Node 1 | 4.843 | Node 17 | 13.401 | Node 1 | 3.092 |
| Node 20 | 28.302 | Node 15 | 3.833 | Node 10 | 10.953 | Node 16 | 2.848 |
| Node 7 | 21.333 | Node 14 | 2.583 | Node 11 | 9.156 | Node 4 | 2.090 |
| Node 12 | 20.293 | Node 8 | 2.000 | Node 2 | 8.273 | Node 5 | 1.965 |
| Node 17 | 16.764 | Node 5 | 1.667 | Node 19 | 7.776 | Node 15 | 1.400 |
| Node 11 | 12.036 | Node 10 | 1.367 | Node 7 | 7.700 | Node 13 | 0.943 |
| Node 4 | 11.400 | Node 9 | 0.000 | Node 18 | 7.633 | Node 14 | 0.734 |
| Node 16 | 10.719 | Node 18 | 0.000 | Node 3 | 7.412 | Node 9 | 0.000 |


