


Ecological Risk Assessment of Watersheds Based on Adaptive Cycling Theory—A Case Study of Poyang Lake Ecological and Economic Zone


Abstract
1. Introduction
2. Materials and Methods
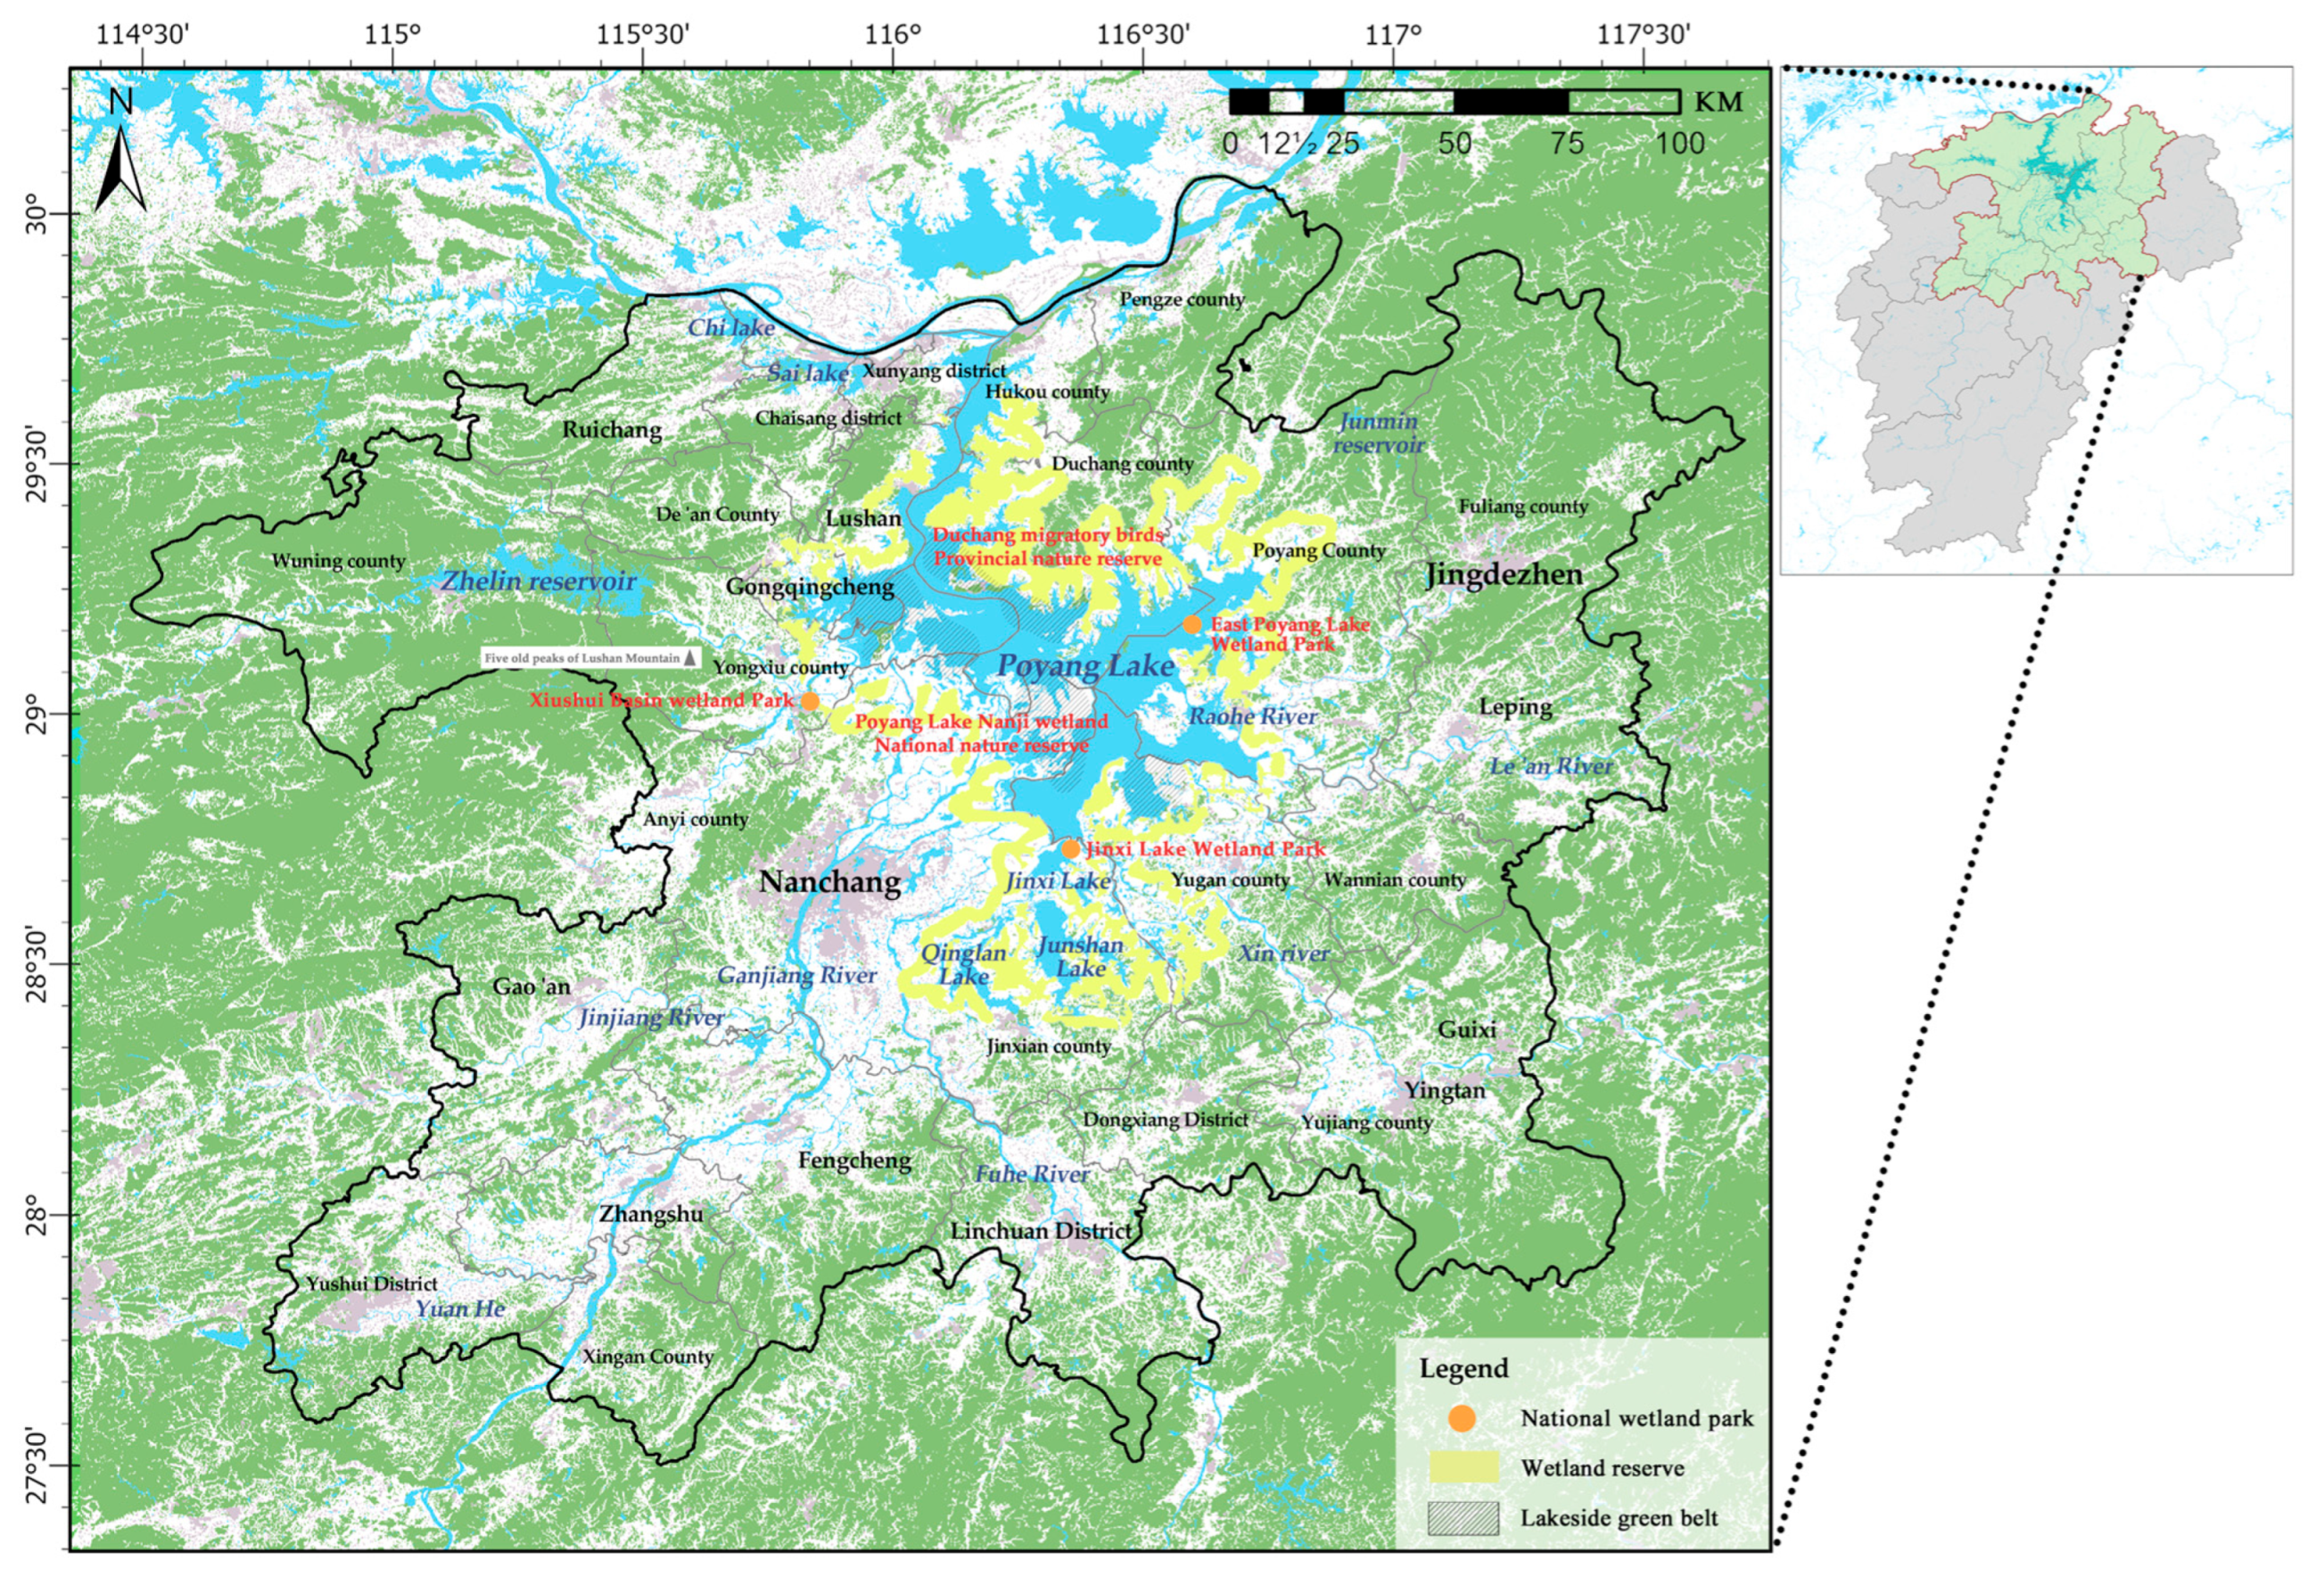
2.1. Study Area
2.2. Data Sources and Preprocessing
2.3. Methodology
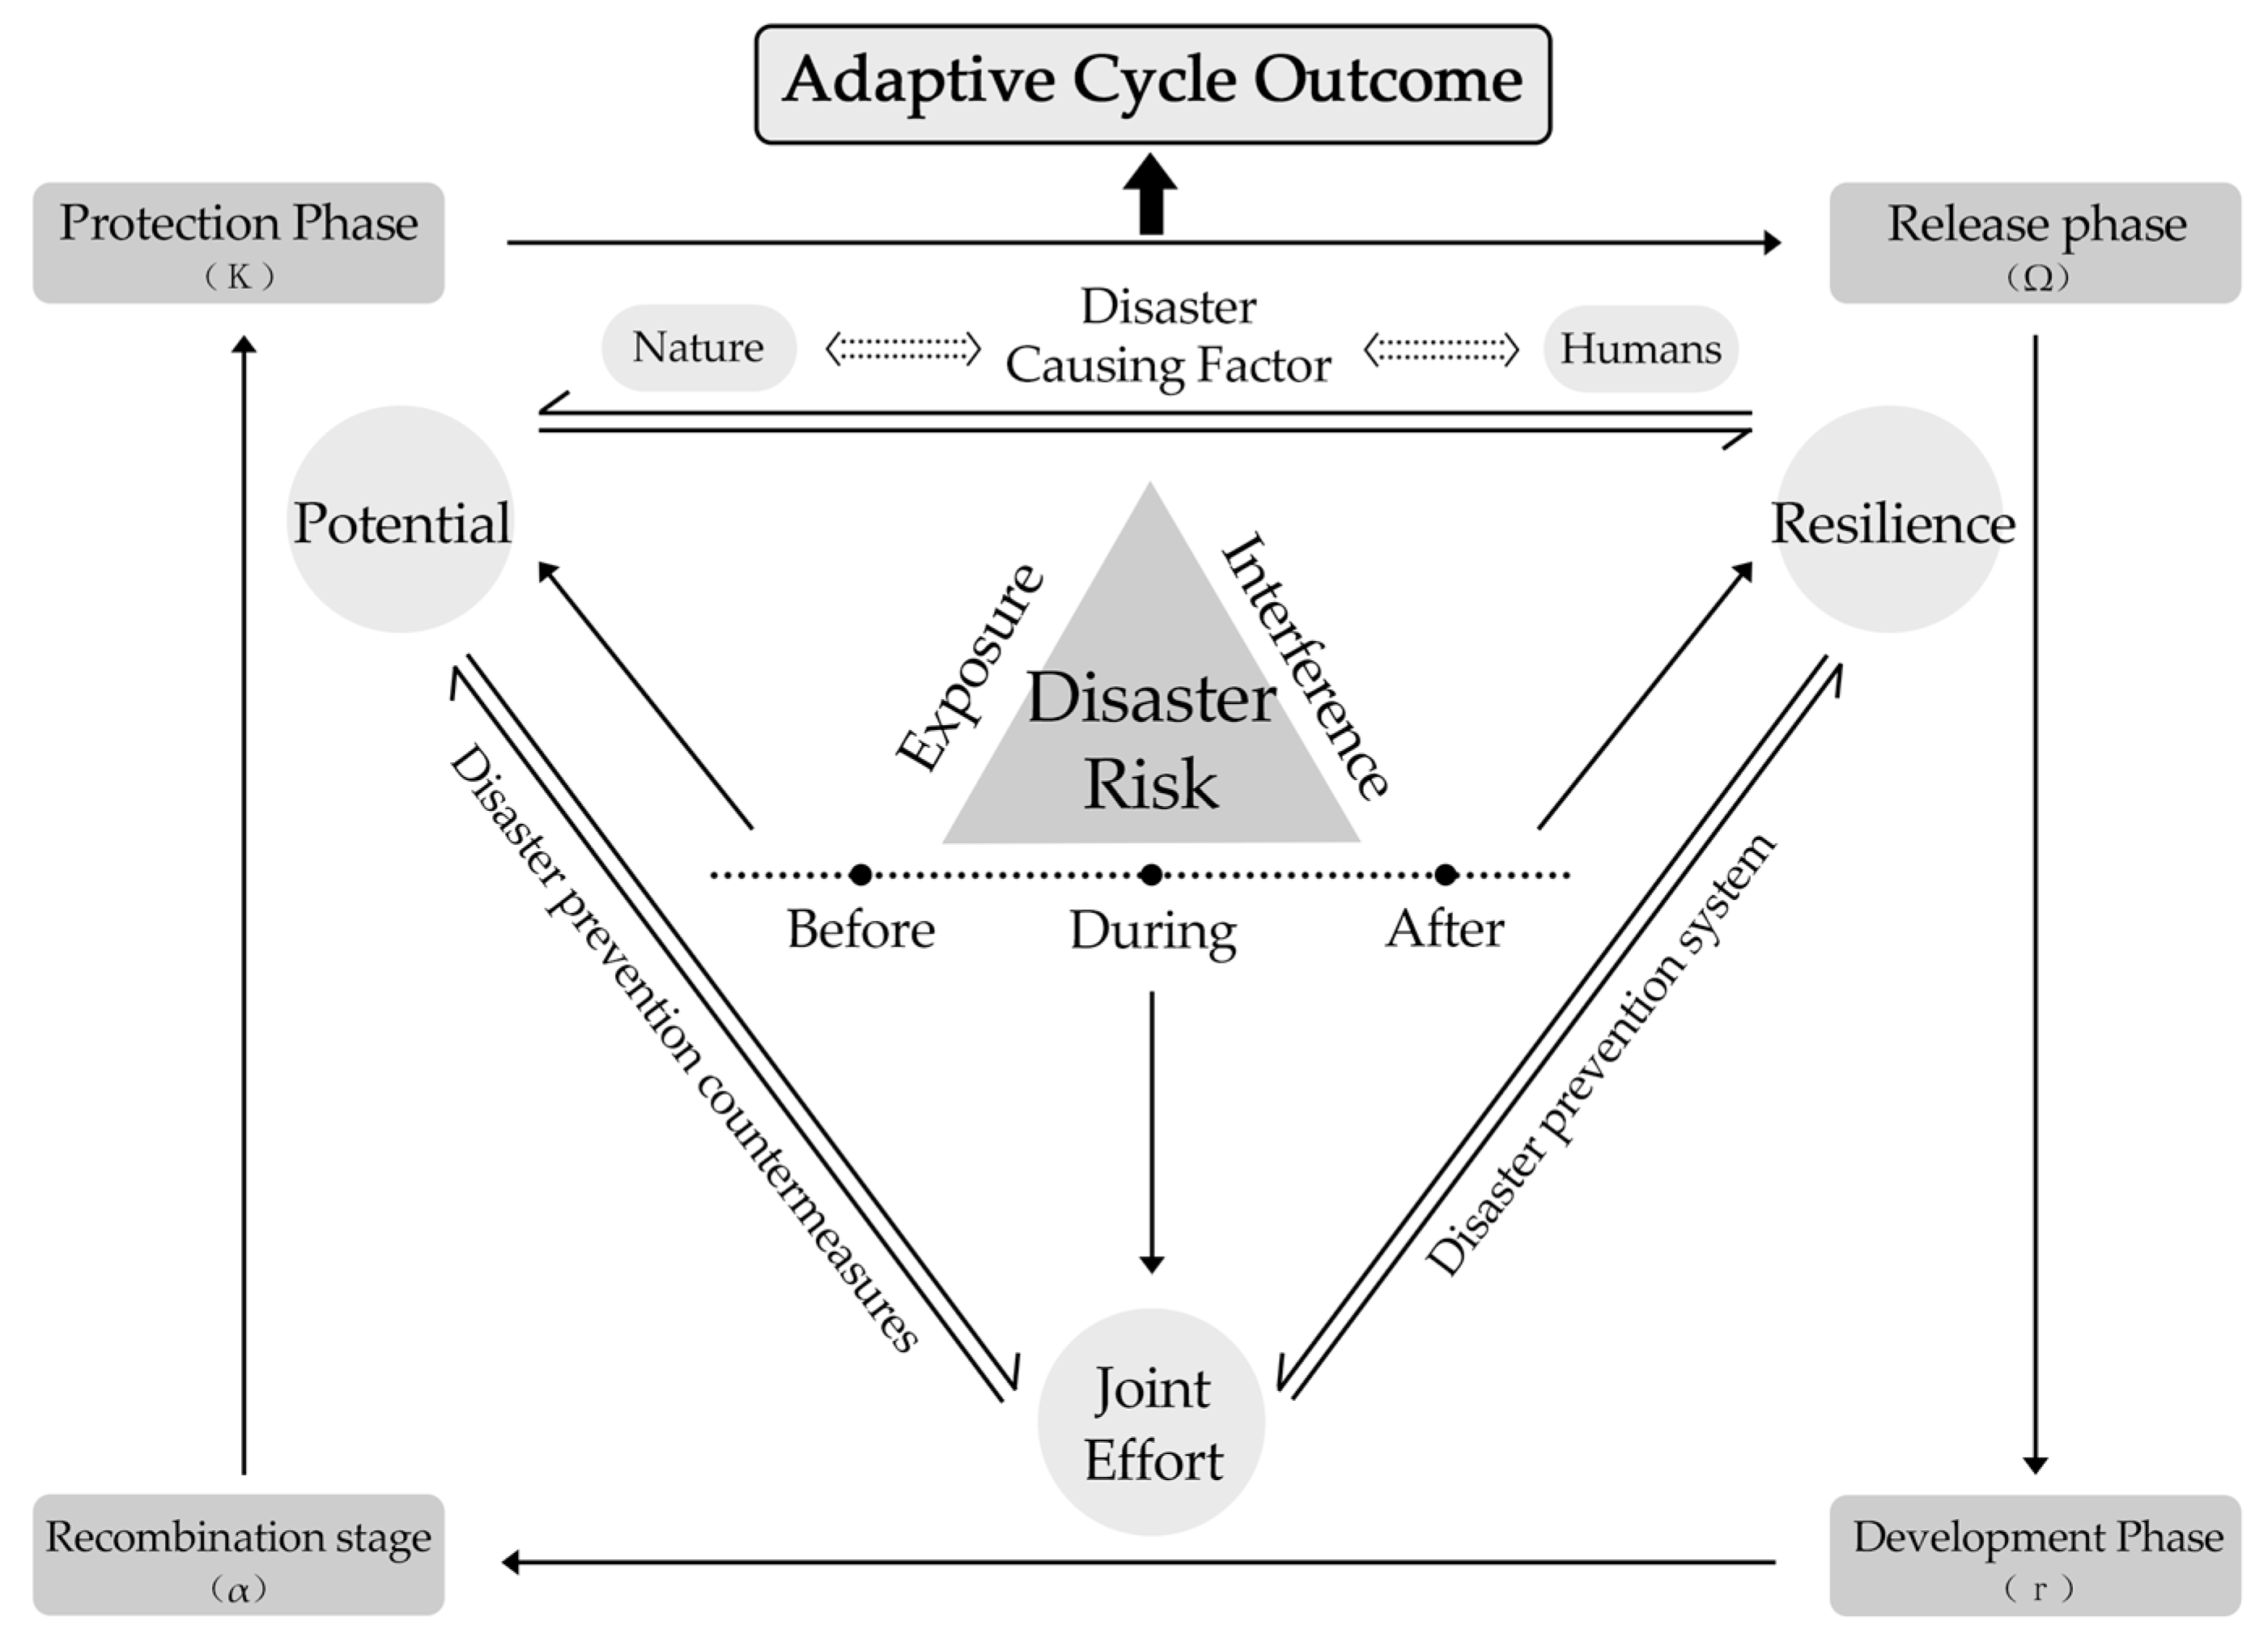
2.3.1. Constructing an Ecological Risk Assessment Framework Based on Adaptive Cycles
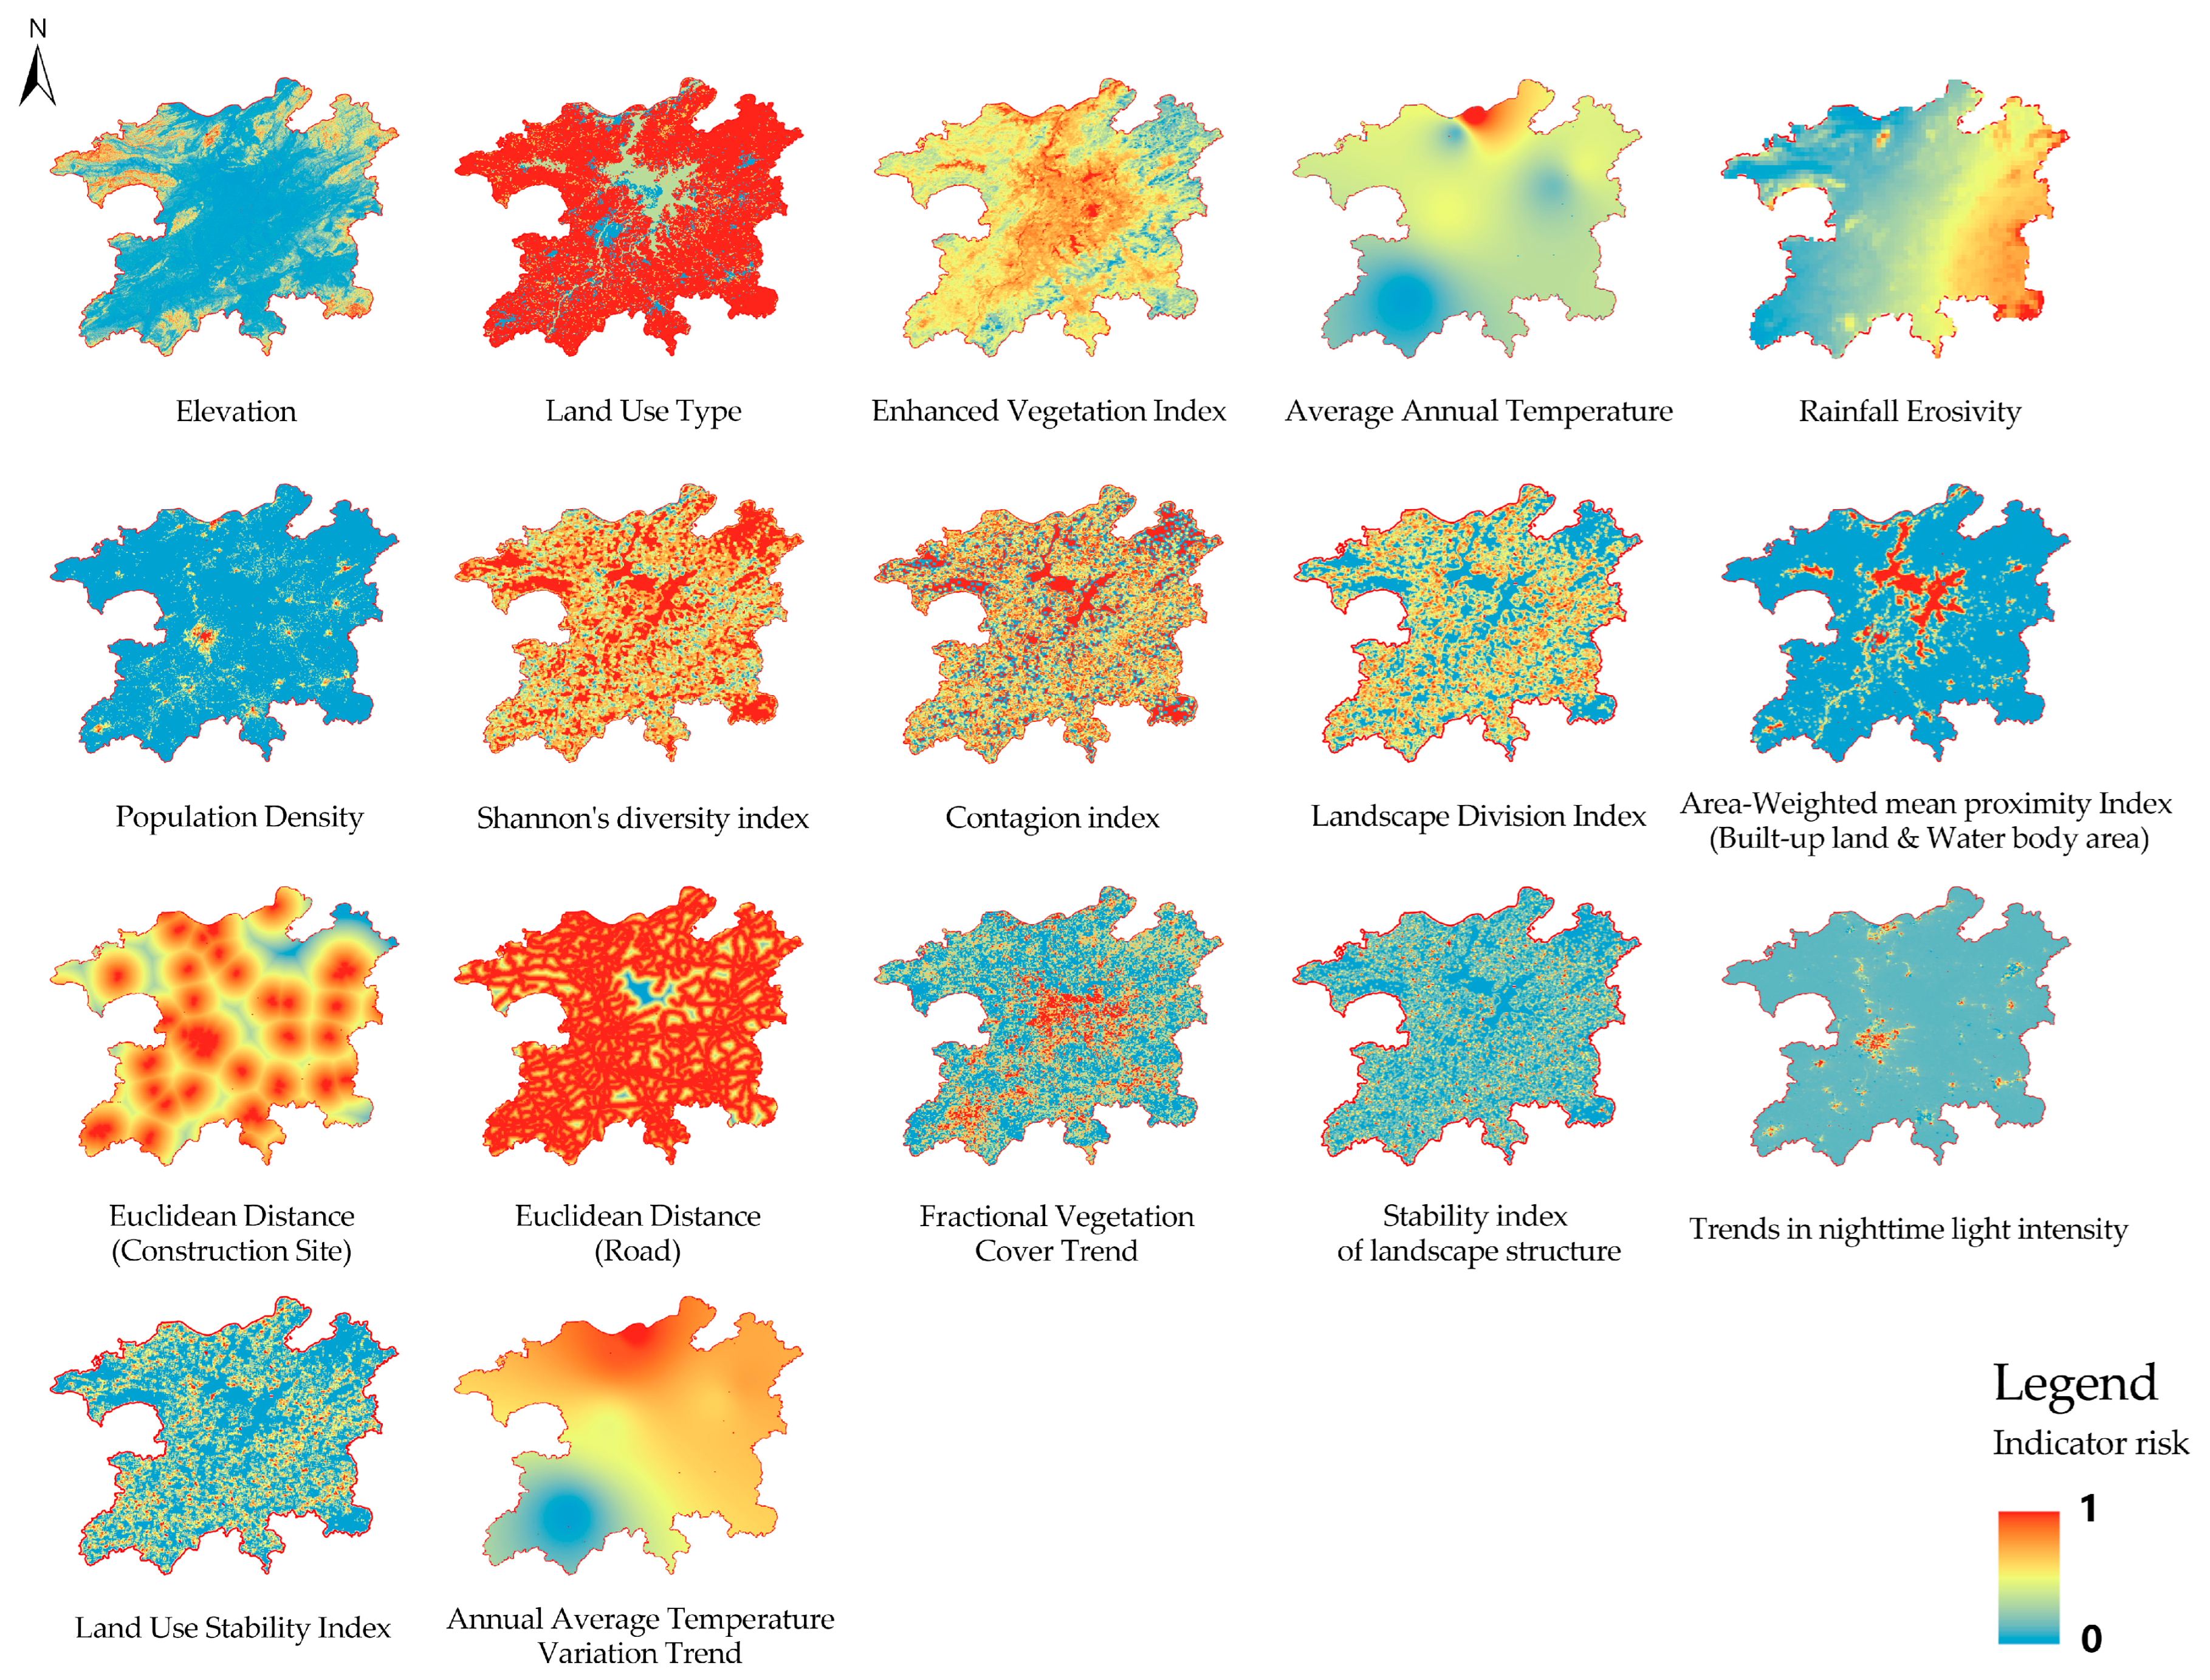
2.3.2. Constructing the “Potential–Connectedness–Resilience” Ecological Risk Indicator System
2.3.3. Constructing the Watershed Adaptive Ecological Risk Index
2.3.4. Ecological Risk Scenario Setting for Watershed Landscape Based on OWA Methodology
3. Results and Discussion
3.1. Spatial and Temporal Distribution of Adaptive Ecological Risk Indices
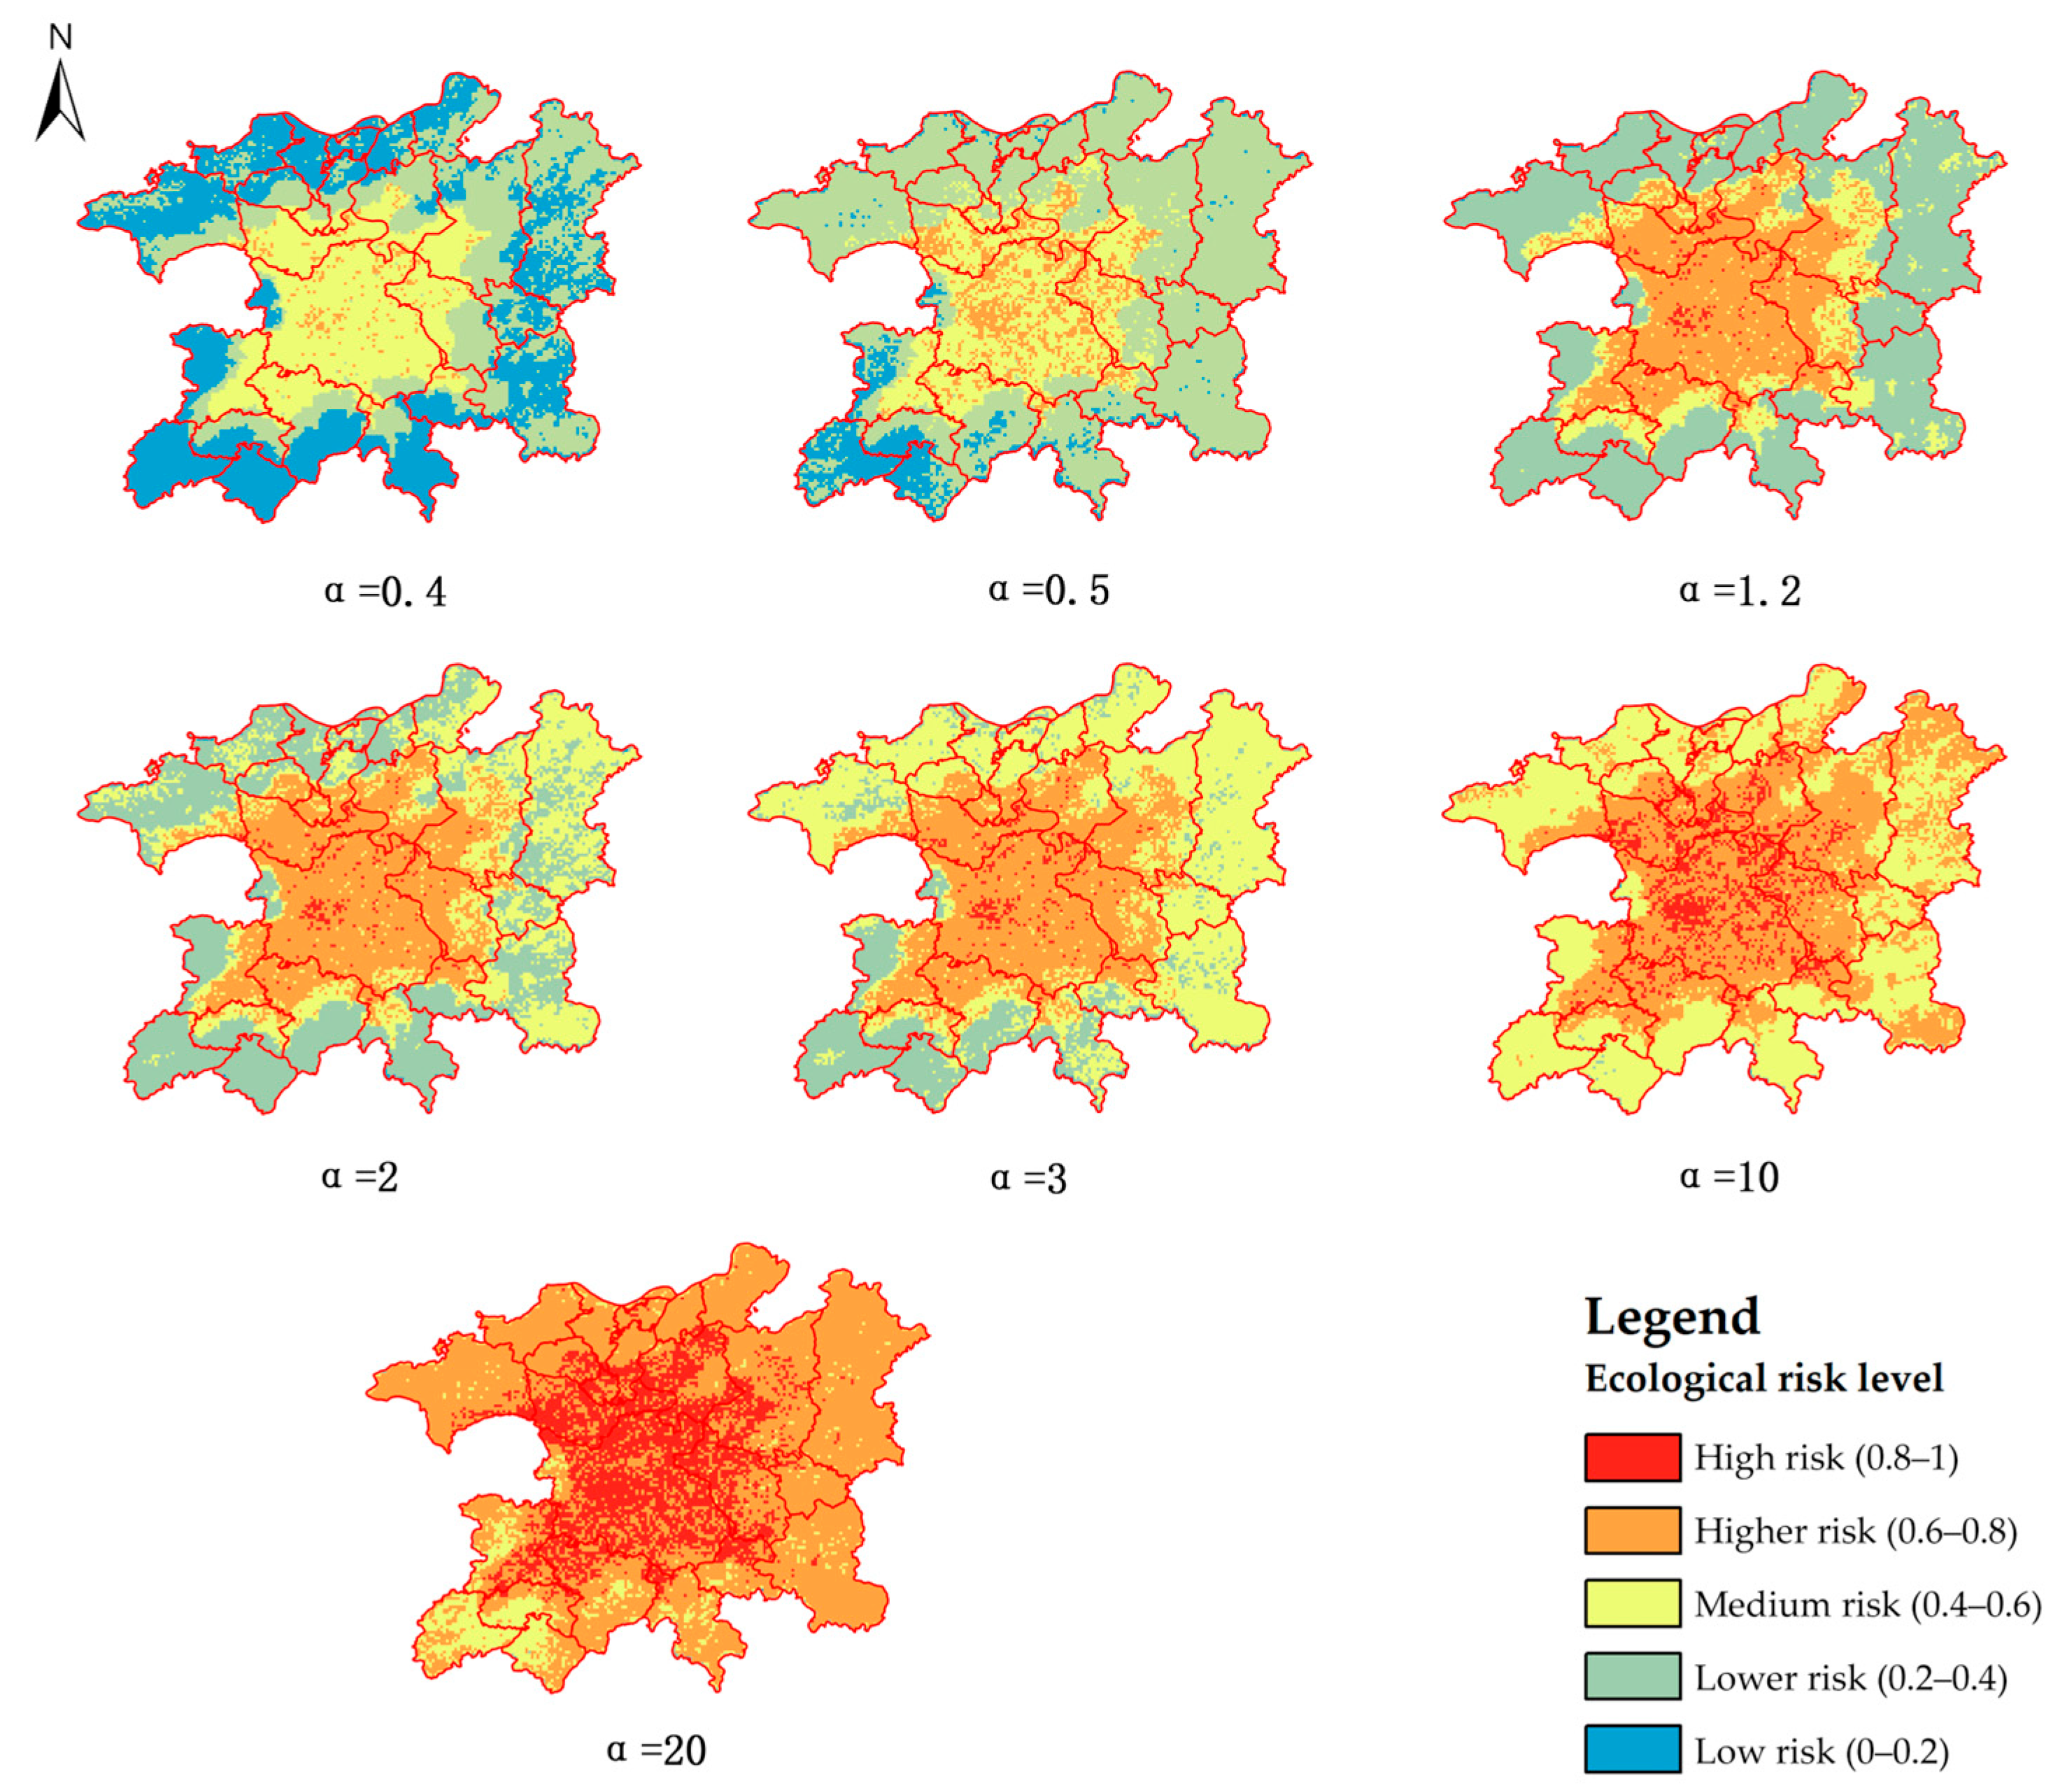
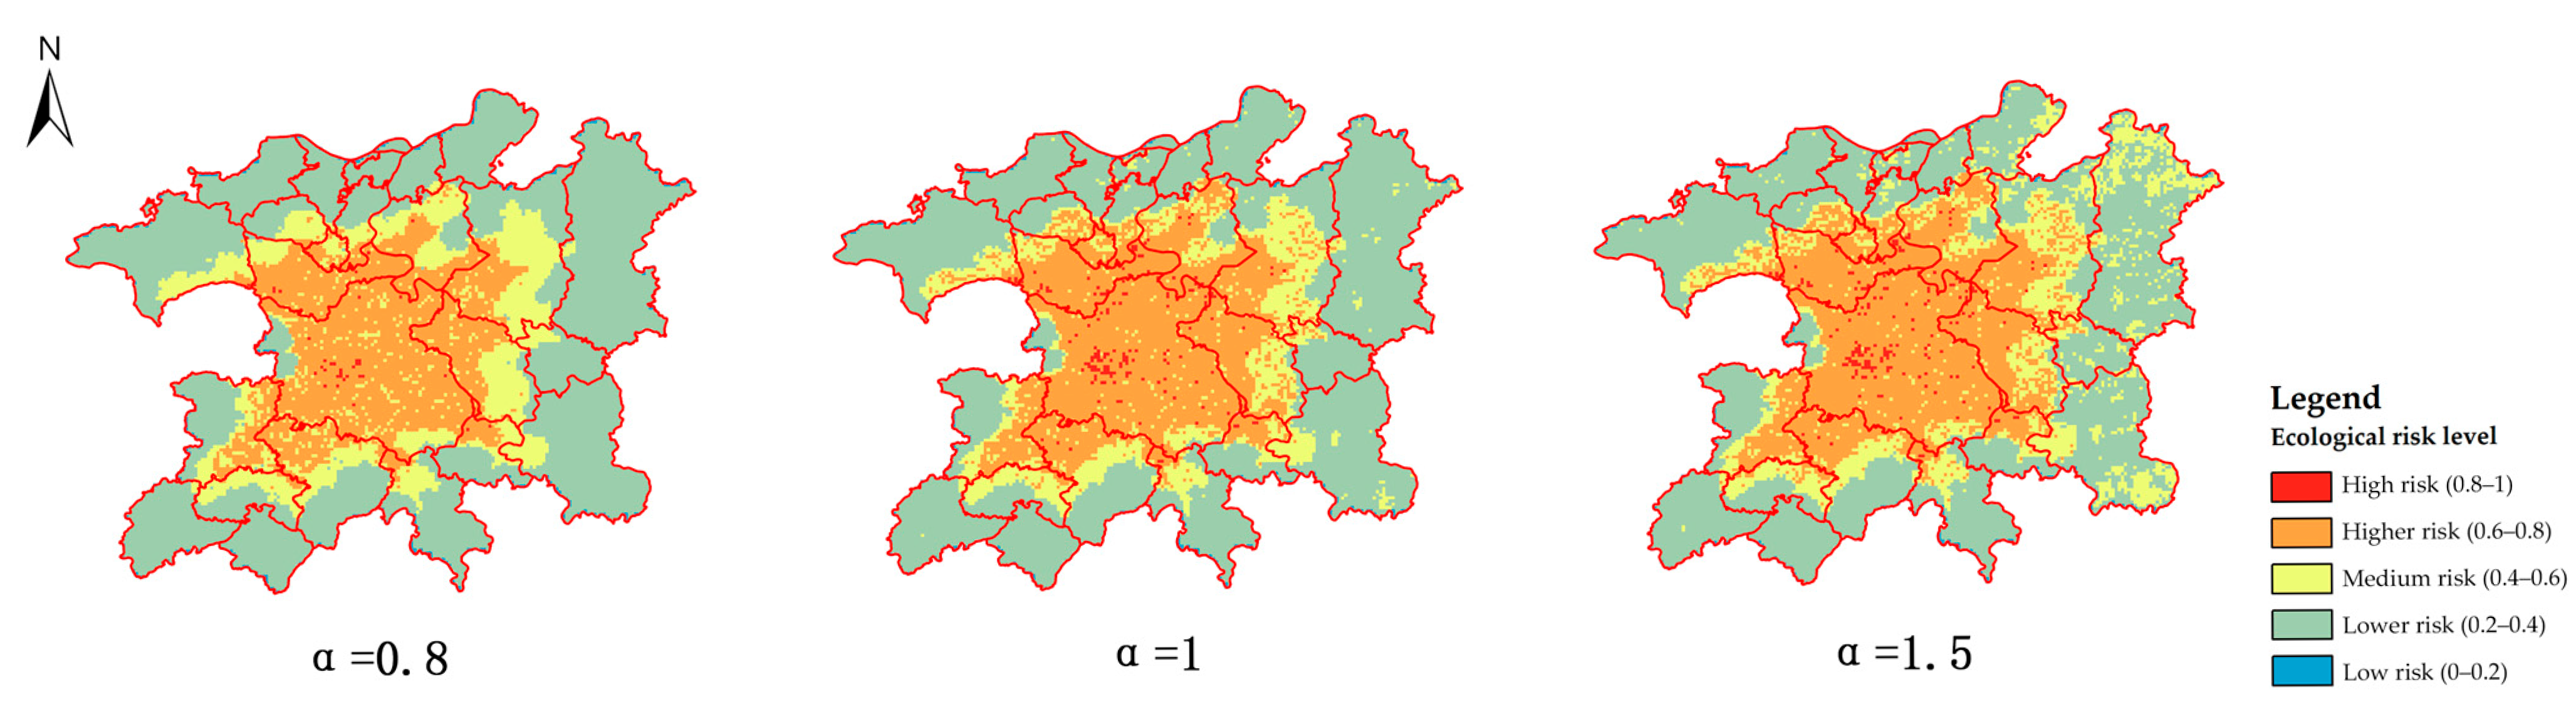
3.2. Analysis of Different Risk Scenarios
3.3. Risk Classification Management Strategy
4. Conclusions
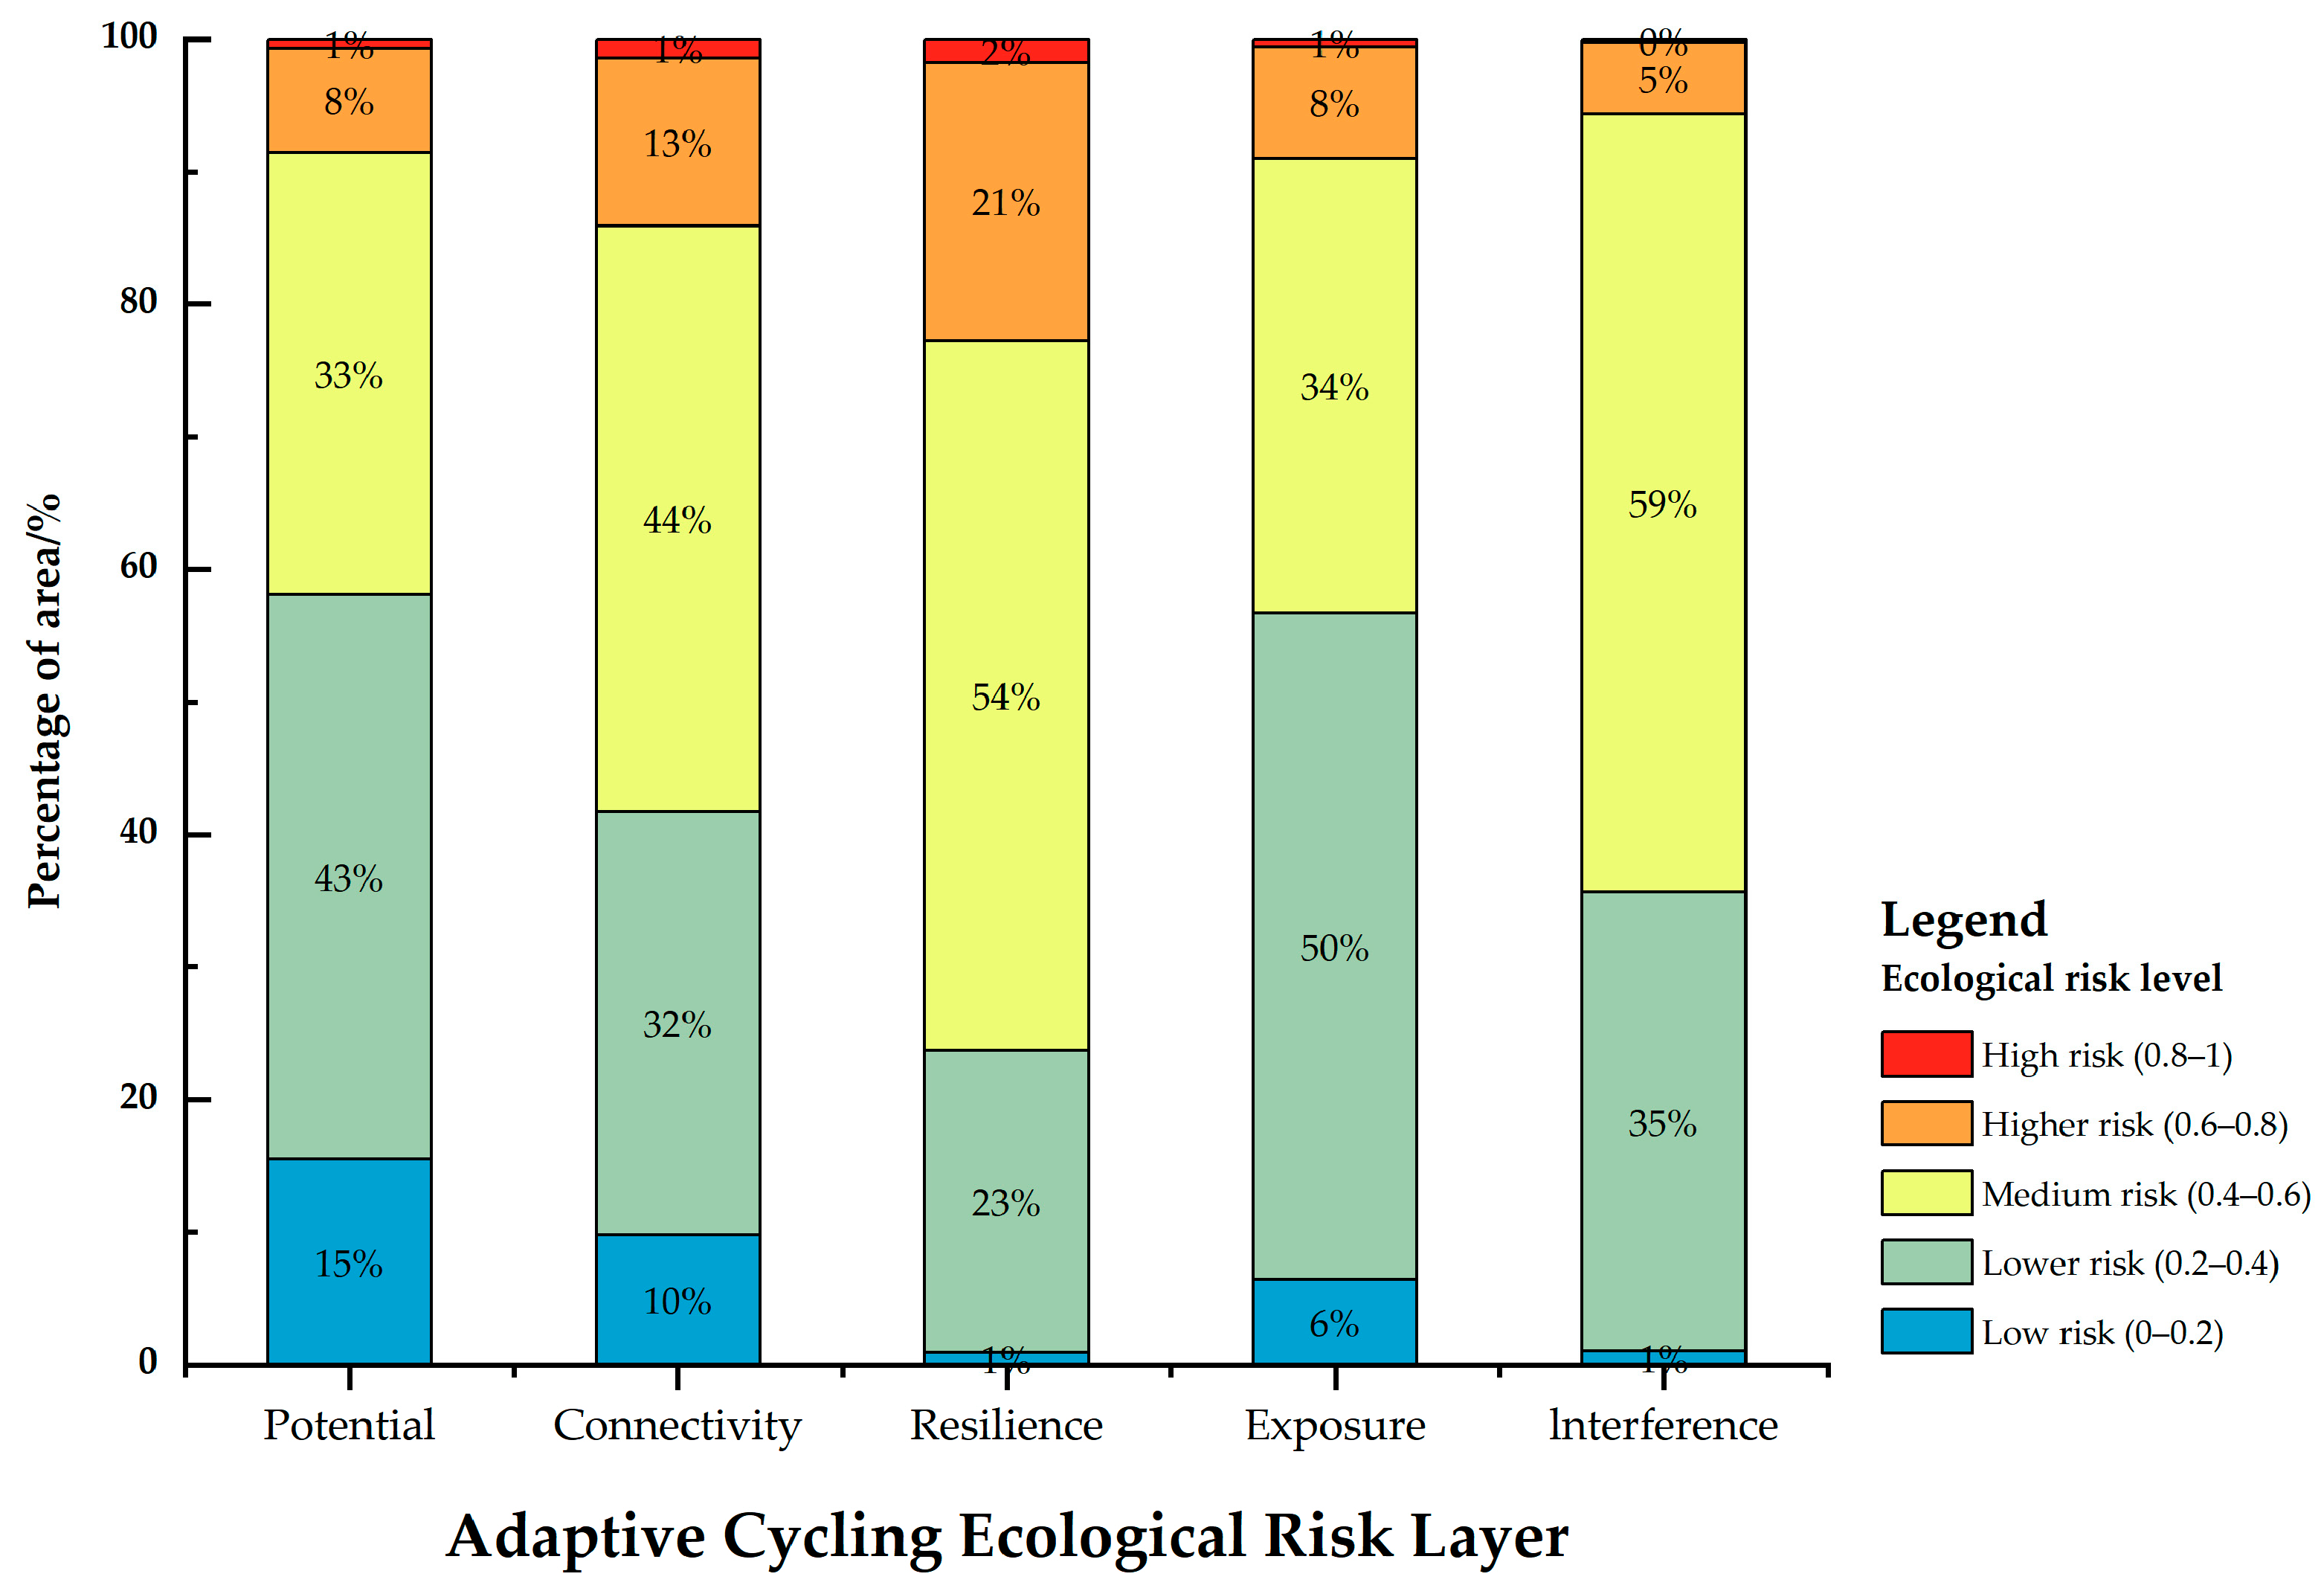
- The ecological risk of the study area under the social–ecological system follows a specific spatial pattern. It centers around Poyang Lake’s water system, with scattered distributions in urban areas. Medium-risk areas make up the largest portion, while low-risk areas mainly lie in the southwest Yuan River plain region. Connection degree and connectivity degree stand as the most critical indicators. The risk ranges of connectivity and resilience align with the general trend of disturbance distribution.
- The system shows clear spatial differences in exposure and disturbance risk. The main water area of Poyang Lake has a “high exposure–disturbance” state. This is because of natural disaster impacts and intense human activities. In contrast, the Gan River, Yuan River, and Xin River basins have “low exposure–disturbance” conditions. Their social systems develop more slowly, and their economic resilience is weaker.
- Using the ordered weighted average method, the study reorganizes and simulates the ecological risk of the watershed. It identifies high- and low-risk areas less affected by policy changes: Nanchang City and Zhelin Reservoir are high-risk zones while surrounding watershed areas are low-risk. Focusing on medium- and high-risk regions, the simulation of α’s change rate shows a more than 5% increase in risk values across Jingdezhen, Yingtan, Xunyang District, De’an County, and Pengze County. Among these, Xunyang District experiences a 17.14% shift from medium to higher risk. This helps meet the decision-making needs for regional sustainable development under different policy scenarios.
Author Contributions
Funding
Data Availability Statement
Conflicts of Interest
Appendix A. Expert Consultation Questionnaire

| Name | Organization | Title | Position | Research Direction |
|---|---|---|---|---|
| Definitely Bad | Very Bad | Quite Bad | Slightly Bad | Average | Slightly Better | Better | Very Good | Absolutely Good | |
|---|---|---|---|---|---|---|---|---|---|
| Value | 1/9 | 1/7 | 1/5 | 1/3 | 1 | 3 | 5 | 7 | 9 |
| Criteria | Risk Layer | Indicators | Connotation of Indicators | Expert Rating |
|---|---|---|---|---|
| Potential risk | Exposing | Slope | Landslides and other geological disasters | |
| Land use type | Human activity patterns | |||
| Enhanced vegetation cover | Spatial distribution of vegetation | |||
| Disruptions | Average annual temperature | Key factors affecting water evaporation and vegetation growth | ||
| Rainfall erosivity | Potential threats of soil erosion | |||
| Population density | The impact of human activity intensity on ecosystems | |||
| Connectivity risk | Exposing | Shannon Diversity | Spatial heterogeneity of landscape types | |
| Spread index | Extent and connectivity of patches | |||
| Landscape separation | Degree of aggregation and dispersion of patches | |||
| Disruptions | Weighted average proximity factor for built-up land and water body area | Measuring the extent of human activity’s impact on water bodies | ||
| Distance to building site | The impact of urbanization on natural ecosystems | |||
| Distance from road | Human activity’s impact on water bodies | |||
| Resilience risk | Exposing | Trends in vegetation cover | The extent of green vegetation spatial recovery | |
| Landscape structural stability index | Stability of land use landscape patterns | |||
| Disruptions | Trends in nighttime light intensity | Trends in ecological system disturbance caused by socio-economic development | ||
| Land use stability index | Stability of human activity states | |||
| Trend in mean annual temperature | Trends in water level extremes |
References
- Li, Q.; Zhang, Z.; Wan, L.; Yang, C.; Zhang, J.; Ye, C.; Chen, Y. Landscape Pattern Optimization of Ningjiang River Basin Based on Landscape Ecological Risk Assessment. Acta Geogr. Sin. 2019, 74, 1420–1437. [Google Scholar]
- Yao, L.; Li, X.L.; Li, Q.; Wang, J.K. Temporal and Spatial Changes in Coupling and Coordinating Degree of New Urbanization and Ecological-Environmental Stress in China. Sustainability 2019, 11, 1171. [Google Scholar] [CrossRef]
- Tang, Z.M.; Bai, X.; Zhan, L.; Zhang, J.; Zhou, M. Geochemical Characteristics and Indicative Significance of Soil Elements in Key Soil Erosion Areas of Changting County, Fujian Province. East China Geol. 2022, 43, 324–335. [Google Scholar]
- Xu, Z.X.; Chen, H.; Ren, M.F.; Cheng, T. Progress on Disaster Mechanism and Risk Assessment of Urban Flood/Waterlogging Disasters in China. Adv. Water Sci. 2020, 31, 713–724. [Google Scholar]
- Li, C.Y.; Deng, Y.L. Degradation of Watershed Ecosystems in China: A Review. Chin. J. Ecol. 2009, 28, 535–541. [Google Scholar]
- Li, X.Y. Key Scientific Issues for Green Water Research in the Watershed. Adv. Earth Sci. 2008, 23, 707–712. [Google Scholar]
- Yu, S.Y.; Chai, X.Y. Analysis of the Interrelationship between the Change of Ecological Environment and Human Activities in the Arid and Semi-arid River Basin. J. Hohai Univ. (Soc. Sci.) 2009, 11, 30–33. [Google Scholar]
- Song, C.Q.; Yang, G.S.; Leng, S.Y. Progress and Prospects in Lake and Watershed Science Research. J. Lake Sci. 2002, 14, 289–300. [Google Scholar]
- Secretariat on Studies of Lake and Watershed. Research Advances on Lake and the Watershed Studies. Bull. Natl. Nat. Sci. Found. China 2003, 10–13. [Google Scholar] [CrossRef]
- Wang, M.E.; Chen, W.P.; Peng, C. Urban ecological risk assessment: A review. Chin. J. Appl. Ecol. 2014, 25, 911–918. [Google Scholar]
- Landis, W.G. Twenty years before and hence: Ecological risk assessment at multiple scales with multiple stressors and multiple endpoints. Hum. Ecol. Risk Assess. 2003, 9, 1317–1326. [Google Scholar] [CrossRef]
- Hooper, B.P.; Duggin, J.A. Ecological Riverine Floodplain Zoning: Its Application to Rural Floodplain Management in the Murray-Darling Basin. Land Use Policy 1996, 13, 87–99. [Google Scholar] [CrossRef]
- Zhang, Z.G.; Li, R.; Wang, G.L. Evaluation of regional ecological risk of soil erosion based on GIS. Sci. Soil Water Conserv. 2007, 5, 98–101. [Google Scholar]
- Liu, J.F.; Li, J.; Liu, J.; Cao, R.Y. Integrated GIS/AHP-based flood risk assessment: A case study of Huaihe River Basin in China. J. Nat. Disasters 2008, 17, 110–114. [Google Scholar]
- GB/T 21010-2017; Current Land Use Classification. National Technical Committee for Standardization of Land and Resources (SAC/TC 93). Standards Press of China: Beijing, China, 2017.
- Sun, J.; Wang, J.; Yang, X.J. An Overview on the Resilience of Social-ecological Systems. Acta Ecol. Sin. 2007, 27, 5371–5381. [Google Scholar]
- Luo, F.H.; Liu, Y.X.; Peng, J.; Wu, J.S. Assessing Urban Landscape Ecological Risk Through an Adaptive Cycle Framework. Landsc. Urban Plan. 2018, 180, 125–134. [Google Scholar] [CrossRef]
- Gunderson, L. Panarchy: Understanding Transformations in Human and Natural Systems; Island Press: Washington, DC, USA, 2002. [Google Scholar]
- Liu, Y.X.; Wang, Y.L.; Peng, J.; Zhang, T.; Wei, H. Urban Landscape Ecological Risk Assessment Based on the 3D Framework of Adaptive Cycle. Acta Geogr. Sin. 2015, 70, 1052–1067. [Google Scholar]
- Xia, C.H.; Ma, D.H.; Guo, X.D.; Wang, Z.T.; Wang, W. Research on Disaster Resilience Mechanism and Planning Response of Territorial Space from the Perspective of Adaptive Cycle. Urban Dev. Stud. 2024, 31, 44–52. [Google Scholar]
- Xu, Y.; Gao, J.F.; Zhao, J.H.; Chen, J.F. The Research Progress and Prospect of Watershed Ecological Risk Assessment. Acta Ecol. Sin. 2012, 32, 284–292. [Google Scholar]
- Lai, S.S.; Chen, W.B.; Wei, X.J.; Cheng, Y.Y. Prediction of Nature Reserves and Identification of Vacancy Areas in Poyang Lake Basin Based on Ecological Resilience Evaluation. Chin. J. Appl. Ecol. 2024, 35, 3461–3468. [Google Scholar]
- Zhao, Y.; Luo, Z.J.; Cao, L.P.; Jiang, J.; Chen, Z.P. Assessment of Ecological Risk in Poyang Lake Basin Based on Changes in Land Use. J. Jiangxi Agric. Univ. 2018, 40, 635–644. [Google Scholar]
- Zhang, Y.X.; Zhan, Q.W. Ecological Quality Assessment of Ecological Economic Zone in Poyang Lake Based on Remote Sensing Ecological Index. Beijing Surv. Mapp. 2024, 38, 1166–1171. [Google Scholar]
- Huang, H.L.; Qu, D.Y.; Lu, W.J.; Niu, H.Y.; Yu, Y.L. Landscape Ecological Risk Evaluation and Prediction in Poyang Lake Ecological Economic Zone. Environ. Sci. Technol. 2024, 47, 216–228. [Google Scholar]
- Li, J.Y.; Sun, C.; Zheng, X. Assessment of Spatio-temporal Evolution of Regionally Ecological Risks Based on Adaptive Cycle Theory: A Case Study of Yangtze River Delta Urban Agglomeration. Acta Ecol. Sin. 2021, 41, 2609–2621. [Google Scholar]
- Zhao, Y.R. Multi-Scale and Multi-Perspective Spatial-Temporal Evolution of Land Use Conflict and its Scenario Simulation in Poyang Lake Ecological and Economic Zone. Ph.D. Thesis, Jiangxi Agricultural University, Nanchang, China, 2024. [Google Scholar]
- Yang, X. Research Progress of Computation Method of Rainfall Erosivity. J. Anhui Agric. Sci. 2019, 47, 5–8. [Google Scholar]
- Gurung, R.B.; Breidt, F.J.; Dutin, A.; Ogle, S.M. Predicting Enhanced Vegetation Index (EVI) Curves for Ecosystem Modeling Applications. Remote Sens. Environ. 2009, 113, 2186–2193. [Google Scholar] [CrossRef]
- Qiu, J.X.; Wang, X.K.; Lu, F.; Ouyang, Z.Y.; Zheng, H. The Spatial Pattern of Landscape Fragmentation and Its Relations with Urbanization and Socio-Economic Developments: A Case Study of Beijing. Acta Ecol. Sin. 2012, 32, 2659–2669. [Google Scholar]
- Bi, R.T.; Gao, Y. Analysis of Multi-scale Effect of Landscape Indices of Classical Landforms in Yuncheng City, Shanxi Province. J. Geo-Inf. Sci. 2012, 14, 338–343. [Google Scholar] [CrossRef]
- Li, D.K.; Ding, S.Y.; Liang, G.F.; Zhao, Q.H.; Tang, Q.; Kong, L.H. Landscape Heterogeneity of Mountainous and Hilly Area in the Western Henan Province Based on Moving Window Method. Acta Ecol. Sin. 2014, 34, 3414–3424. [Google Scholar]
- Zhu, X.H. Fractal and Fractal Dimensions of Spatial Geo-Information; Surveying and Mapping Press: Beijing, China, 2007. [Google Scholar]
- Li, B.; Liu, Y.Y.; Zhang, B.; Huang, J.C.; Guo, X.Y. Multi-scenario Land Use Change Simulation in Caidian Using CLUE-S Based on Tietenberg Modeling. Resour. Sci. 2017, 39, 1739–1752. [Google Scholar]
- Yang, H.; Wang, F.F.; Wu, S.X.; Zhou, H.R. Evaluation of the Spatial Pattern of Land Use in Xinjiang in the Last 15 Years Based on Fractal Theory. Arid Zone Res. 2009, 26, 194–199. [Google Scholar] [CrossRef]
- Zhang, Q.; Xue, C.Y.; Xia, J. Impacts, Contributing Factors and Countermeasures of Extreme Droughts in Poyang Lake. Bull. Chin. Acad. Sci. 2023, 38, 1894–1902. [Google Scholar]
- Zhang, W.B.; Fu, J.S. Rainfall Erosivity Estimation Under Different Rainfall Amount. Resour. Sci. 2003, 25, 35–41. [Google Scholar]
- Zhang, H.L.; Jiao, Y.L.; Zhu, B.J.; Junrui, C.; Ziqing, Z.; Pengfei, Y. Quantitative Analysis of Rainstorm Intensity and Underlying Surface Factors in Xuchang City from Geospatial Perspective. Water Resour. Power 2024, 42, 36–40. [Google Scholar]
- Mo, W.B.; Wang, Y.; Zhang, Y.X.; Zhuang, D.F. Impacts of Road Network Expansion on Landscape Ecological Risk in a Megacity, China: A Case Study of Beijing. Sci. Total Environ. 2017, 574, 1000–1011. [Google Scholar] [CrossRef]
- Zhao, S.N.; Wang, Y.; Qiao, X.N.; Zhao, T.Q. Spatiotemporal Variation and Driving Factors for FVC in Huaihe River Basin from 1987 to 2021. Trans. Chin. Soc. Agric. Mach. 2023, 54, 180–190. [Google Scholar]
- Cai, B.F.; Yu, R. Advance and Evaluation in the Long Time Series Vegetation Trends Research Based on Remote Sensing. J. Remote Sens. 2009, 13, 1170–1186. [Google Scholar]
- Yuan, L.H.; Jiang, W.G.; Shen, W.M.; Liu, Y.H.; Wang, W.J.; Tao, L.L.; Zheng, H.; Liu, X.F. The Spatio-Temporal Variations of Vegetation Cover in the Yellow River Basin from 2000 to 2010. Acta Ecol. Sin. 2013, 33, 7798–7806. [Google Scholar]
- Guo, B.; Jiang, L.; Luo, W.; Yang, G.; Ge, D.Z. Study of an evaluation method of ecosystem vulnerability based on remote sensing in a southwestern karst mountain area under extreme climatic conditions. Acta Ecol. Sin. 2017, 37, 7219–7231. [Google Scholar]
- Qianqian, H.; Tao, L.; Xiaojing, C.; Jiang, L. Rural Ecological Risk Assessment Based on Ecological Adaptability Theory: A Case Study of Fujian Mountainous Countryside. Small Towns Constr. 2024, 42, 77–86. [Google Scholar]
- Yager, R.R. Quantifier Guided Aggregation Using OWA Operators. Int. J. Intell. Syst. 1996, 11, 49–73. [Google Scholar] [CrossRef]
- Zarghami, M.; Szidarovszky, F. Fuzzy Quantifiers in Sensitivity Analysis of OWA Operator. Comput. Ind. Eng. 2008, 54, 1006–1018. [Google Scholar] [CrossRef]
- Liang, K.Y.; Jin, X.B.; Zhang, X.L.; Song, P.; Li, Q.; Yong, S.; Qi, K.; Zhou, Y. Construction of ecological security patterns coupling supply and demand of ecosystem services: A case study of Southern Jiangsu Province. Acta Ecol. Sin. 2024, 44, 3880–3896. [Google Scholar]


| Criteria (Weights) | Risk Layer | Indicators (Weights) | Normalize |
|---|---|---|---|
| Potential risk (0.1634) | Exposing | Slope (0.0958) | + |
| Land use type (0.3181) | + | ||
| Enhanced vegetation cover (0.233) | − | ||
| Disruptions | Average annual temperature (0.0577) | + | |
| Rainfall erosivity (0.1495) | + | ||
| Population density (0.146) | + | ||
| Connectivity risk (0.297) | Exposing | Shannon Diversity (0.1863) | − |
| Spread index (0.3149) | − | ||
| Landscape separation (0.1305) | + | ||
| Disruptions | Weighted average proximity factor for built-up land and water body area (0.0774) | + | |
| Distance to building site (0.2114) | − | ||
| Distance from road (0.0795) | + | ||
| Resilience risk (0.5396) | Exposing | Trends in vegetation cover (0.1554) | − |
| Landscape structural stability index (0.2128) | − | ||
| Disruptions | Trends in nighttime light intensity (0.2834) | + | |
| Land use stability index (0.2498) | − | ||
| Trend in mean annual temperature (0.0987) | + |
| Decision Risk Coefficient (Vj) | α = 0.4 | α = 0.5 | α = 0.8 | α = 1 | α = 1.5 | α = 2 | α = 3 | α = 10 | α = 20 |
|---|---|---|---|---|---|---|---|---|---|
| Trends in nighttime light intensity (V1) | 0.868 | 0.243 | 0.104 | 0.059 | 0.051 | 0.044 | 0.033 | 0.005 | 0.000 |
| Land Use Stability Index (V2) | 0.031 | 0.100 | 0.077 | 0.059 | 0.055 | 0.051 | 0.043 | 0.013 | 0.002 |
| Stability indexof landscape structure (V3) | 0.018 | 0.077 | 0.069 | 0.059 | 0.056 | 0.053 | 0.048 | 0.020 | 0.005 |
| Area-Weighted mean proximity Index (Built-up land and water body area) (V4) | 0.013 | 0.065 | 0.065 | 0.059 | 0.057 | 0.055 | 0.051 | 0.027 | 0.009 |
| Fractional VegetationCover Trend (V5) | 0.010 | 0.057 | 0.061 | 0.059 | 0.058 | 0.057 | 0.054 | 0.034 | 0.014 |
| Landscape Division Index (V6) | 0.009 | 0.052 | 0.059 | 0.059 | 0.058 | 0.058 | 0.056 | 0.040 | 0.020 |
| Shannon’s diversity index (V7) | 0.007 | 0.048 | 0.057 | 0.059 | 0.059 | 0.059 | 0.058 | 0.047 | 0.028 |
| Annual Average Temperature Variation Trend (V8) | 0.006 | 0.044 | 0.055 | 0.059 | 0.059 | 0.060 | 0.060 | 0.054 | 0.036 |
| Land Use Type (V9) | 0.006 | 0.042 | 0.054 | 0.059 | 0.060 | 0.060 | 0.061 | 0.060 | 0.046 |
| Contagion index (V10) | 0.005 | 0.039 | 0.053 | 0.059 | 0.060 | 0.061 | 0.063 | 0.066 | 0.057 |
| Enhanced Vegetation Index (V11) | 0.005 | 0.037 | 0.052 | 0.059 | 0.060 | 0.062 | 0.064 | 0.072 | 0.068 |
| Rainfall Erosivity (V12) | 0.004 | 0.036 | 0.051 | 0.059 | 0.061 | 0.062 | 0.065 | 0.079 | 0.081 |
| Population Density (V13) | 0.004 | 0.034 | 0.050 | 0.059 | 0.061 | 0.063 | 0.066 | 0.085 | 0.095 |
| Euclidean Distance (Road) (V14) | 0.004 | 0.033 | 0.049 | 0.059 | 0.061 | 0.063 | 0.067 | 0.091 | 0.110 |
| Euclidean Distance (Construction Site) (V15) | 0.003 | 0.032 | 0.049 | 0.059 | 0.061 | 0.064 | 0.068 | 0.097 | 0.126 |
| Elevation (V16) | 0.003 | 0.031 | 0.048 | 0.059 | 0.061 | 0.064 | 0.069 | 0.103 | 0.143 |
Disclaimer/Publisher’s Note: The statements, opinions and data contained in all publications are solely those of the individual author(s) and contributor(s) and not of MDPI and/or the editor(s). MDPI and/or the editor(s) disclaim responsibility for any injury to people or property resulting from any ideas, methods, instructions or products referred to in the content. |
© 2025 by the authors. Licensee MDPI, Basel, Switzerland. This article is an open access article distributed under the terms and conditions of the Creative Commons Attribution (CC BY) license (https://creativecommons.org/licenses/by/4.0/).
Share and Cite
Gu, Y.; Wang, J.; Su, X.; Zhang, K. Ecological Risk Assessment of Watersheds Based on Adaptive Cycling Theory—A Case Study of Poyang Lake Ecological and Economic Zone. Land 2025, 14, 1265. https://doi.org/10.3390/land14061265
Gu Y, Wang J, Su X, Zhang K. Ecological Risk Assessment of Watersheds Based on Adaptive Cycling Theory—A Case Study of Poyang Lake Ecological and Economic Zone. Land. 2025; 14(6):1265. https://doi.org/10.3390/land14061265
Chicago/Turabian StyleGu, Yixi, Jiaxuan Wang, Xinyi Su, and Kaili Zhang. 2025. "Ecological Risk Assessment of Watersheds Based on Adaptive Cycling Theory—A Case Study of Poyang Lake Ecological and Economic Zone" Land 14, no. 6: 1265. https://doi.org/10.3390/land14061265
APA StyleGu, Y., Wang, J., Su, X., & Zhang, K. (2025). Ecological Risk Assessment of Watersheds Based on Adaptive Cycling Theory—A Case Study of Poyang Lake Ecological and Economic Zone. Land, 14(6), 1265. https://doi.org/10.3390/land14061265