Article

Ecological Security Patterns Based on Ecosystem Service Assessment and Circuit Theory: A Case Study of Liaoning Province, China

College of Land and Environment, Shenyang Agriculture University, Shenyang 110866, China
*
Authors to whom correspondence should be addressed.
Land 2025, 14(6), 1257; https://doi.org/10.3390/land14061257
Submission received: 20 May 2025 / Revised: 9 June 2025 / Accepted: 10 June 2025 / Published: 11 June 2025

Abstract

As urbanization progresses at an accelerating pace, the depletion of natural resources and environmental degradation are becoming increasingly severe. Constructing ecological security patterns (ESPs) has become a crucial strategy for mitigating environmental stress and promoting sustainable social development. Currently, the methods for constructing ESPs remain under exploration. Particularly, in the identification of ecological sources, insufficient emphasis has been placed on trade-offs among ecosystem services (ESs). This study focuses on Liaoning Province, situated in China’s northeast revitalization area—a region with a developed heavy industry and abundant ecological resources. The InVEST model was employed to assess ESs, and the ordered weighted average (OWA) method was utilized to identify ecological sources. By integrating both natural and social factors, the ecological resistance surface was constructed, and circuit theory was applied to determine ecological corridors, ultimately leading to the development of an ESP. The results show that (1) between 2010, 2015, and 2020, water yield continued to increase, habitat quality continuously declined, soil conservation tended to decrease and then gradually increase, and carbon storage tended to increase and then decrease. The four ESs show similar spatial features, characterized by elevated levels in the eastern and western areas and a comparatively reduced level in the central region; (2) a total of 179 ecological sources were identified, covering 26,235.34 km2. The overall distribution showed a concentration in the east, with a fragmented and dispersed pattern in the southwest. The identification of 435 ecological corridors, with an overall length totaling 8794.59 km, resulted in a network-like distribution pattern. Additionally, 65 ecological pinch points and 67 barrier points were identified; and (3) a “four zones, three corridors, and two belts” pattern of ecological protection and restoration has been proposed. The findings offer valuable insights for Liaoning Province and other rapidly developing regions facing escalating environmental pressures.

1. Introduction

The preservation of biodiversity and the protection of human well-being are intrinsically connected to ecosystem functions [1]. However, rapid industrialization and widespread urbanization have put ecosystems under hitherto unheard-of strain, which could result in structural instability and functional deterioration [2]. Rapid urbanization has led to several environmental problems, including the loss of biodiversity [3], the heat island effect [4], and water scarcity [5]. An estimated one million species are at risk of going extinct as a result of human activity, according to the 2019 United Nations Intergovernmental Science-Policy Platform on Biodiversity and Ecosystem Services (IPBES) Global Assessment [6]. With the increasing global emphasis on environmental sustainability, the exploration of ecological security patterns (ESP) has developed into a key component in regional ecological landscape research [7].
As a proven methodology for reconciling conflicts between ecological preservation and socioeconomic advancement, ESPs have been extensively implemented in both national and regional frameworks [8], particularly in ecological spatial planning, environmental governance, and sustainable development policy-making [9]. The initiative of the “United Nations Decade on Ecosystem Restoration 2021–2030” significantly emphasizes the importance of restoring and protecting ecosystems worldwide, as well as halting land degradation for global sustainable development [10]. China has long prioritized ecological and environmental protection by enacting various policies and regulations [11], promoting the visionary concept of “mountains, rivers, forests, farmlands, lakes, and grasslands as an integrated life community” in its new era of ecological civilization advancement. This paradigm-shifting approach emphasizes the holistic integrity and dynamic interdependence of natural ecosystems, thereby enhancing the criteria for the integrated development of territorial space and environmental protection [12]. In 2020, the “14th Five-Year Plan for Economic and Social Development of the People’s Republic of China” explicitly states that establishing regional ESPs serves as a critical strategic approach for national land development and conservation. The construction of ESPs proves crucial for safeguarding ecosystem sustainability within integrated national and local environmental governance systems [13]. Research on ESPs primarily focuses on core areas, including design principles, planning methods, indicator construction, and pattern optimization. With the ongoing advancement of research, the methodological framework for ESP construction has been steadily improved, and research methods have gradually become more diversified, simplified, and refined [14]. Many scholars have actively promoted interdisciplinary integration by combining technologies such as the InVEST model [15] and circuit theory [14], opening new research directions for ESP construction. ESP construction currently adheres to a framework of “source identification, resistance surface construction, and corridor extraction” [16,17].
Identifying ecological sources employs a variety of theoretical and technical approaches. Some studies explicitly classify nature reserves, historical sites, and ecological patches as ecological sources [18], while other research emphasizes the assessment of ecological sensitivity and landscape connectivity. Wang et al. emphasized the overall structure of ecological networks [19], whereas Jin et al. focused on key ecological functional areas, reflecting the diversity of identification methods [20]. However, these approaches typically rely on high-value ESs while overlooking the trade-offs among ESs. To address this limitation, Pan et al. introduced the OWA method, establishing seven scenarios based on six typical ESs to systematically consider ES trade-offs and optimize ecological source selection [21]. The OWA method provides a reliable foundation for identifying ecological sources and constructing ESPs by systematically assessing ES trade-offs and their interaction relationships [22]. Ecological resistance surfaces are defined by land use types to simulate species movement within natural ecosystems [23]. Li et al. introduced social and natural resistance factors, allowing for the development of a more scientific and systematic ecological resistance surface, thereby strengthening the reliability of the model [24]. Ecological corridors, acting as critical connections between ecological sources, are essential for maintaining landscape connectivity [25]. Common identification methods include the MCR model [26], circuit theory [27], and ant colony algorithm [28]. The MCR model does not account for key factors, such as the random wandering behavior of species and corridor width. In contrast, circuit theory can more effectively model the random migration behaviors of species. Ford et al. proposed a prioritization method for ecological corridor construction by studying the relationship between species dispersal intensity and species abundance in connected habitats [29]. Furthermore, ecological pinch points and barrier points enable a better understanding of key bottlenecks in the flow of matter. Such insights contribute to predicting species migration pathways and inform the formulation of appropriate ecological restoration strategies [30]. In summary, the application of the OWA method effectively resolves trade-offs among ESs in identifying ecological sources. Moreover, defining both the width and significance of ecological corridors is essential for constructing a scientifically robust ESP.
Located in Northeast China, Liaoning Province serves as a major grain-producing area, a crucial industrial base, and is endowed with abundant natural resources. Its diverse topography, encompassing coastal, inland, mountainous, and plain regions, creates favorable conditions for agriculture, industry, and tourism. Liaoning Province boasts significant ecological resources, such as the Black Soil Conservation Area and the Liaohe Wetland National Park. Over the past few decades, Liaoning has implemented numerous ecological construction and conservation initiatives, resulting in substantial improvements to the ecological environment [31]. Consequently, the construction of an ESP in Liaoning Province is essential not only for resolving the tension between economic growth and environmental conservation but also for fostering the harmonious coexistence of humanity and nature. The objectives of this study are: (1) To evaluate ESs for the years 2010, 2015, and 2020 using the InVEST model; (2) To refine the methodology for identifying ecological sources by applying the OWA method; (3) To determine the ecological resistance surface through the integration of natural and social factors; (4) To delineate ecological corridors, pinch points, and barrier points within Liaoning Province using circuit theory; and (5) To propose a protection and restoration pattern of “four zones, three corridors, and two belts” based on the constructed ESP of Liaoning Province. The framework is presented in Figure 1.

2. Materials and Methods
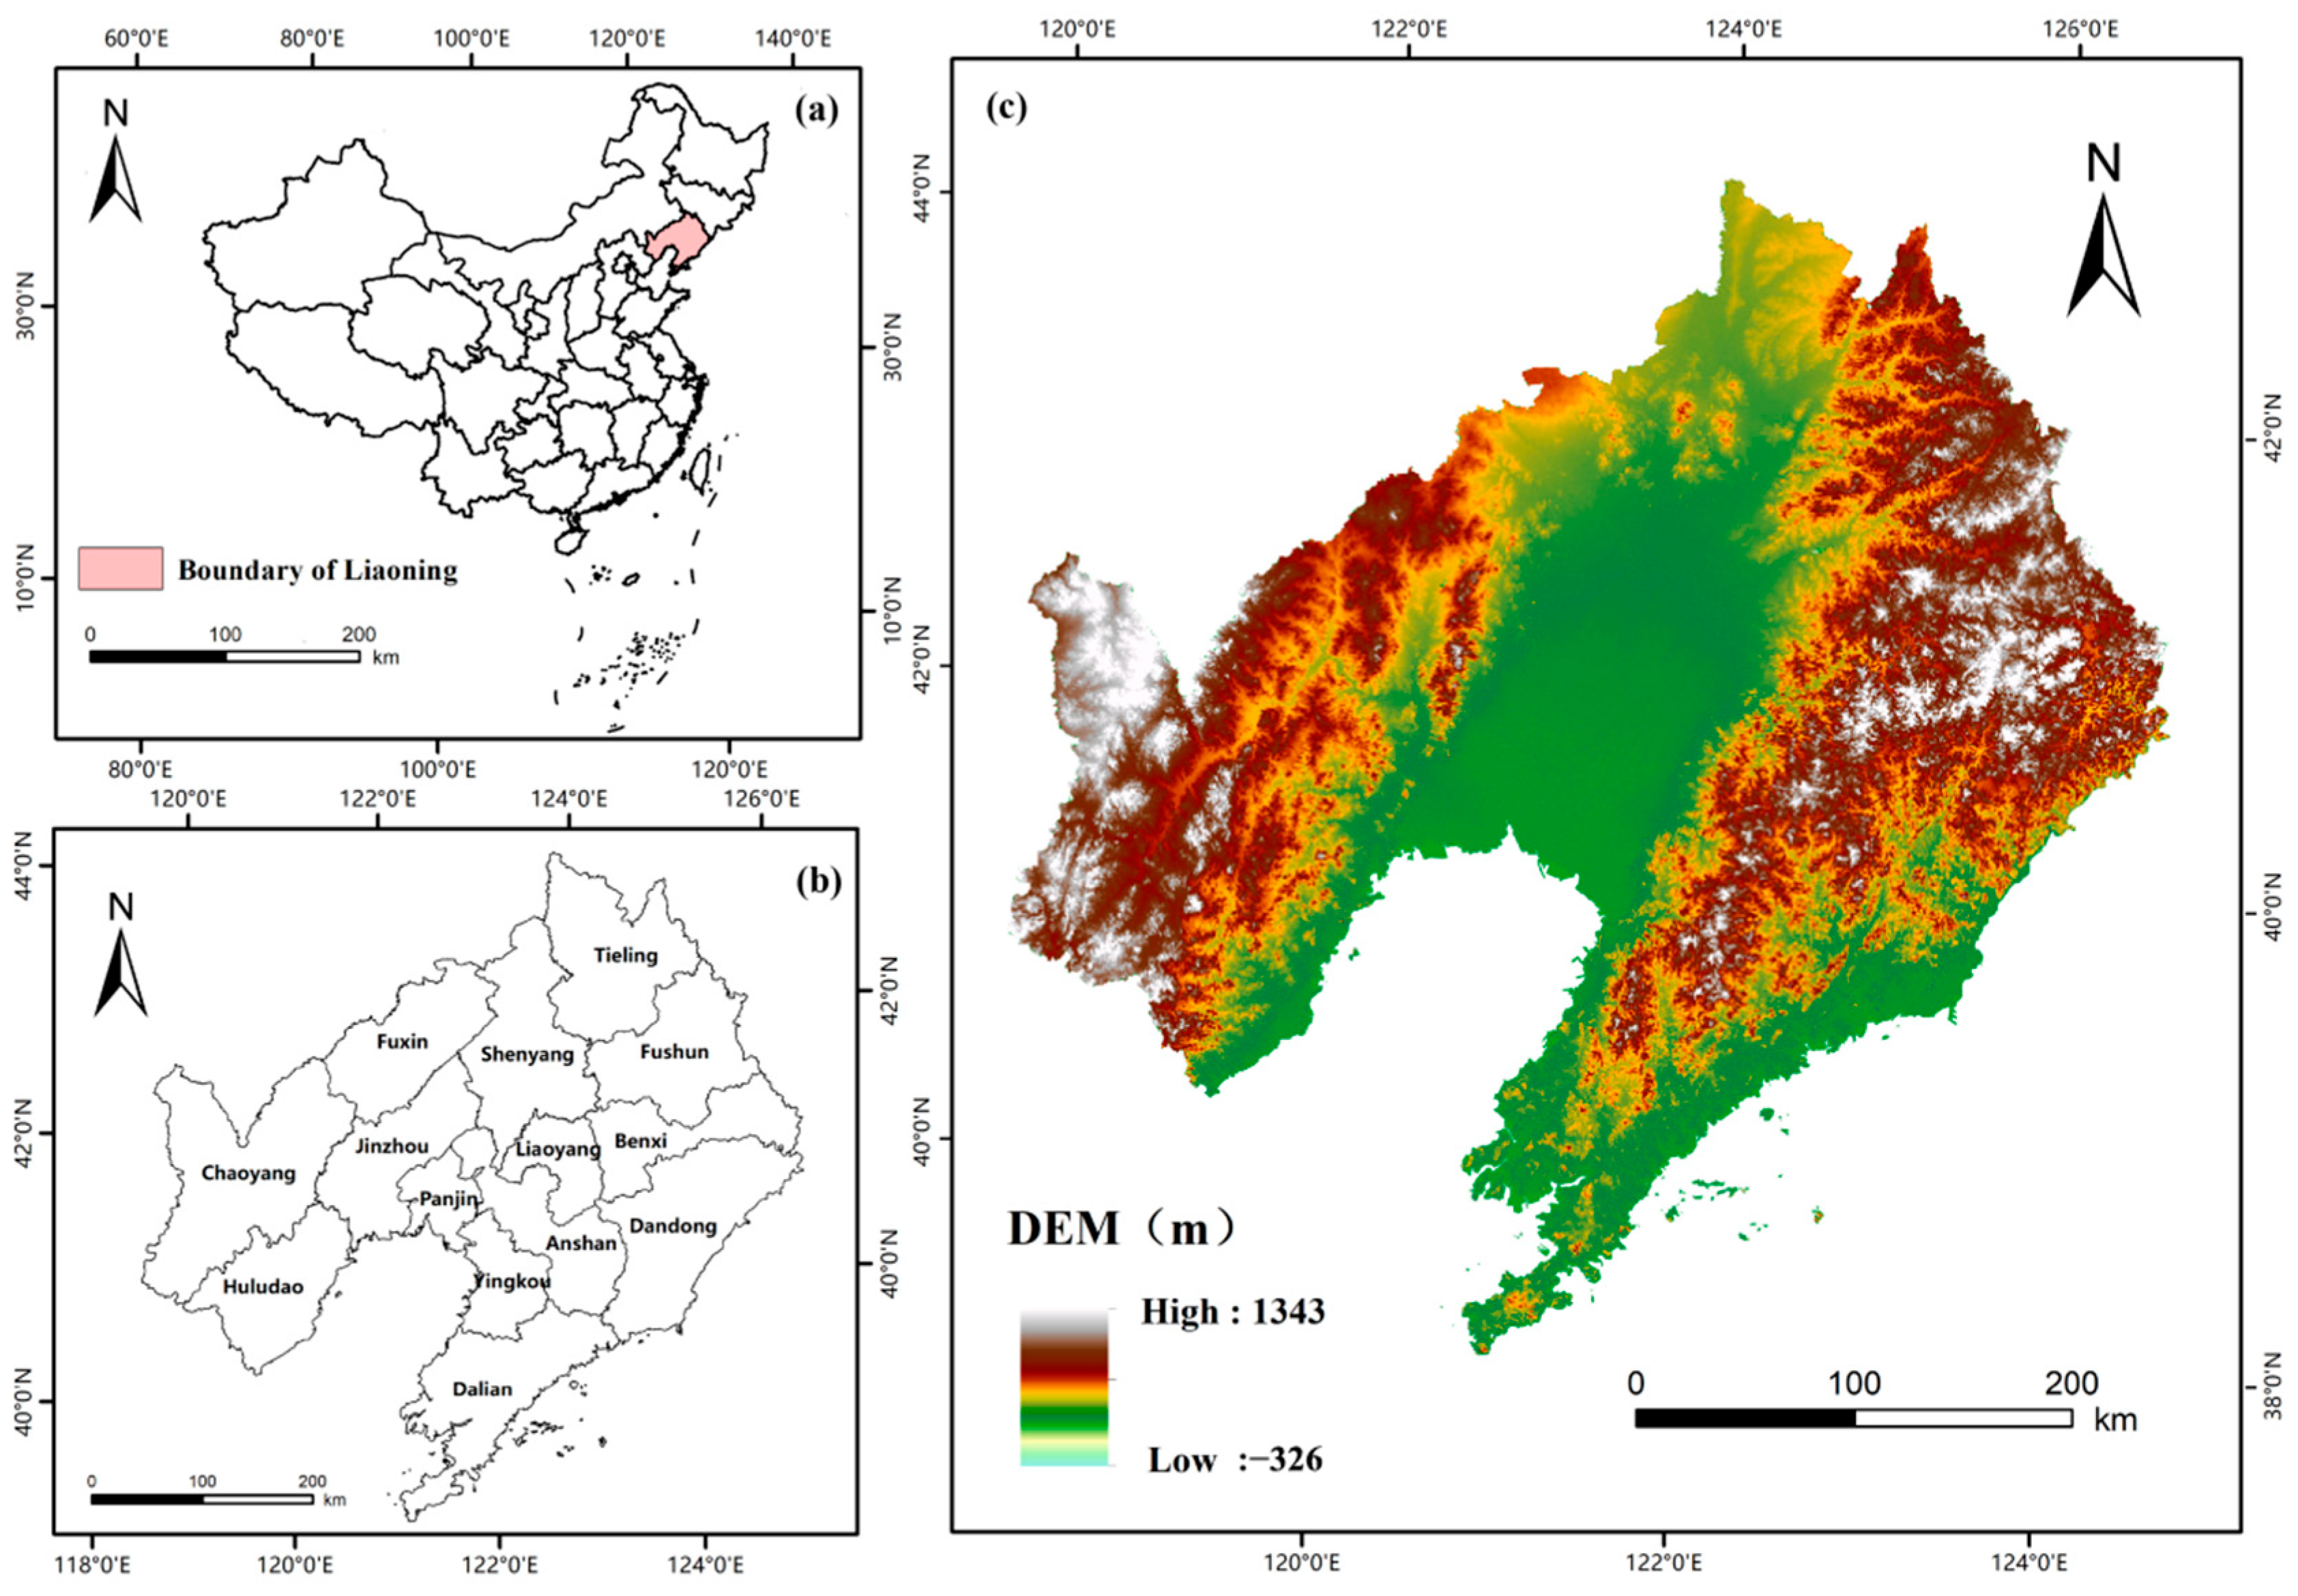
2.1. Study Area

Liaoning Province is located in the southern part of northeast China (118°53′ to 125°46′ E, 38°43′ to 43°26′ N) (Figure 2). Liaoning province has 14 prefecture-level cities and a temperate monsoon climate. The topography of Liaoning Province is notable, characterized by the east and west sides of high terrain; the central region is relatively low, with the east and west mainly composed of mountains and hills, whereas the center consists of plains. As the sole coastal province in Northeast China, Liaoning’s population is predominantly concentrated in the central plain and along the coast. Liaoning Province boasts a unique ecological landscape encompassing the world’s largest contiguous black soil belt in its northern plains, dense forest ecosystems covering 41.8% of its territory in the eastern mountainous areas, and critical wetland systems along its southern coastline that form part of the East Asian-Australasian Flyway. The ecosystems in Liaoning Province are characterized by complexity and diversity. In the face of the challenge of industrial transformation, it is essential to achieve environmental protection in tandem with sustainable economic development.

2.2. Data Sources

The main sources of data are presented in Table 1. The data covers the years 2010, 2015, and 2020. The coordinate system is standardized as Krasovsky_1940_Albers.

2.3. Methodology

2.3.1. ESs Assessment

In this study, we combine the provisioning, supporting, and regulating functions of ESs and select four types of ESs for evaluation. The InVEST model is an efficient and widely recognized tool for assessing ES functions and has a broad range of applications.
(1)
Water Yield
Water yield serves as an indicator of precipitation and evapotranspiration differences among various landscape types [32]. The InVEST model employs a cumulative rainfall approach to estimate hydrological output, integrating the Budyko curve with fundamental water balance concepts [33].
Q x = ( 1 A T E x P x ) × P x
A E T x P x = 1 + ω x R x j 1 + ω x R x j + 1 R x j
Here, Q x is the water yield; A E T x is the actual evapotranspiration; P x   is the annual precipitation; R x j   is to the dryness index; ω x   is the effective water content of the plant.
(2)
Habitat Quality
Habitat quality reflects an ecosystem’s ability to provide suitable living conditions and resources for species [34]. The InVEST model is evaluated by combining LULC with anthropogenic and environmental threats to biodiversity [35].
Q x j = H j 1 D x j z D x j z + K z
Here, Q x j is the habitat quality; H j is the habitat suitability; D x j z is the habitat degradation level; K z is the half-saturation constant; z   is the normalization parameter. Refer to the biomass in this study and Tables S1 and S2 in the Supplementary Materials [36].
(3)
Soil Conservation
Soil conservation plays a critical role in mitigating land degradation and sustaining the integrity of nutrient-rich topsoil [37]. The sediment delivery ratio (SDR) within the InVEST model utilizes the Modified Universal Soil Loss Equation (RUSLE) [38].
u l s e x = R x   ×   K x   ×   L S x   ×   S D R b a r e _ x
r k l s x = R x   ×   K x   ×   L S x   ×   C x   ×   S D R x
S D R x = u s l e x r k l s x
Here, S D R x is soil conversation; u l s e x   is potential sediment; r k l s x is actual sediment. R x is the rainfall erosivity factor; K x is the soil erosion factor; L S x are the slope length and slope factor; C x is the vegetation cover and crop management factors; S D R b a r e _ x is the bare soil conditions.
(4)
Carbon Storage
Through photosynthesis, ecosystems capture carbon dioxide and store carbon in biomass, soil, and organic matter [39]. In the InVEST model, carbon storage is estimated by taking into account the density of carbon [40].
C t o t a l = C a b o v e + C b e l o w + C d e a d + C s o i l
Here, C t o t a l is the total of carbon storage; C a b o v e   is above-ground biomass; C b e l o w   is below-ground biomass; C s o i l   is soil organic matter; C d e a d   is dead organic matter. For reference, we use the carbon pool values listed in Table S3 of the Supplementary Materials [41].

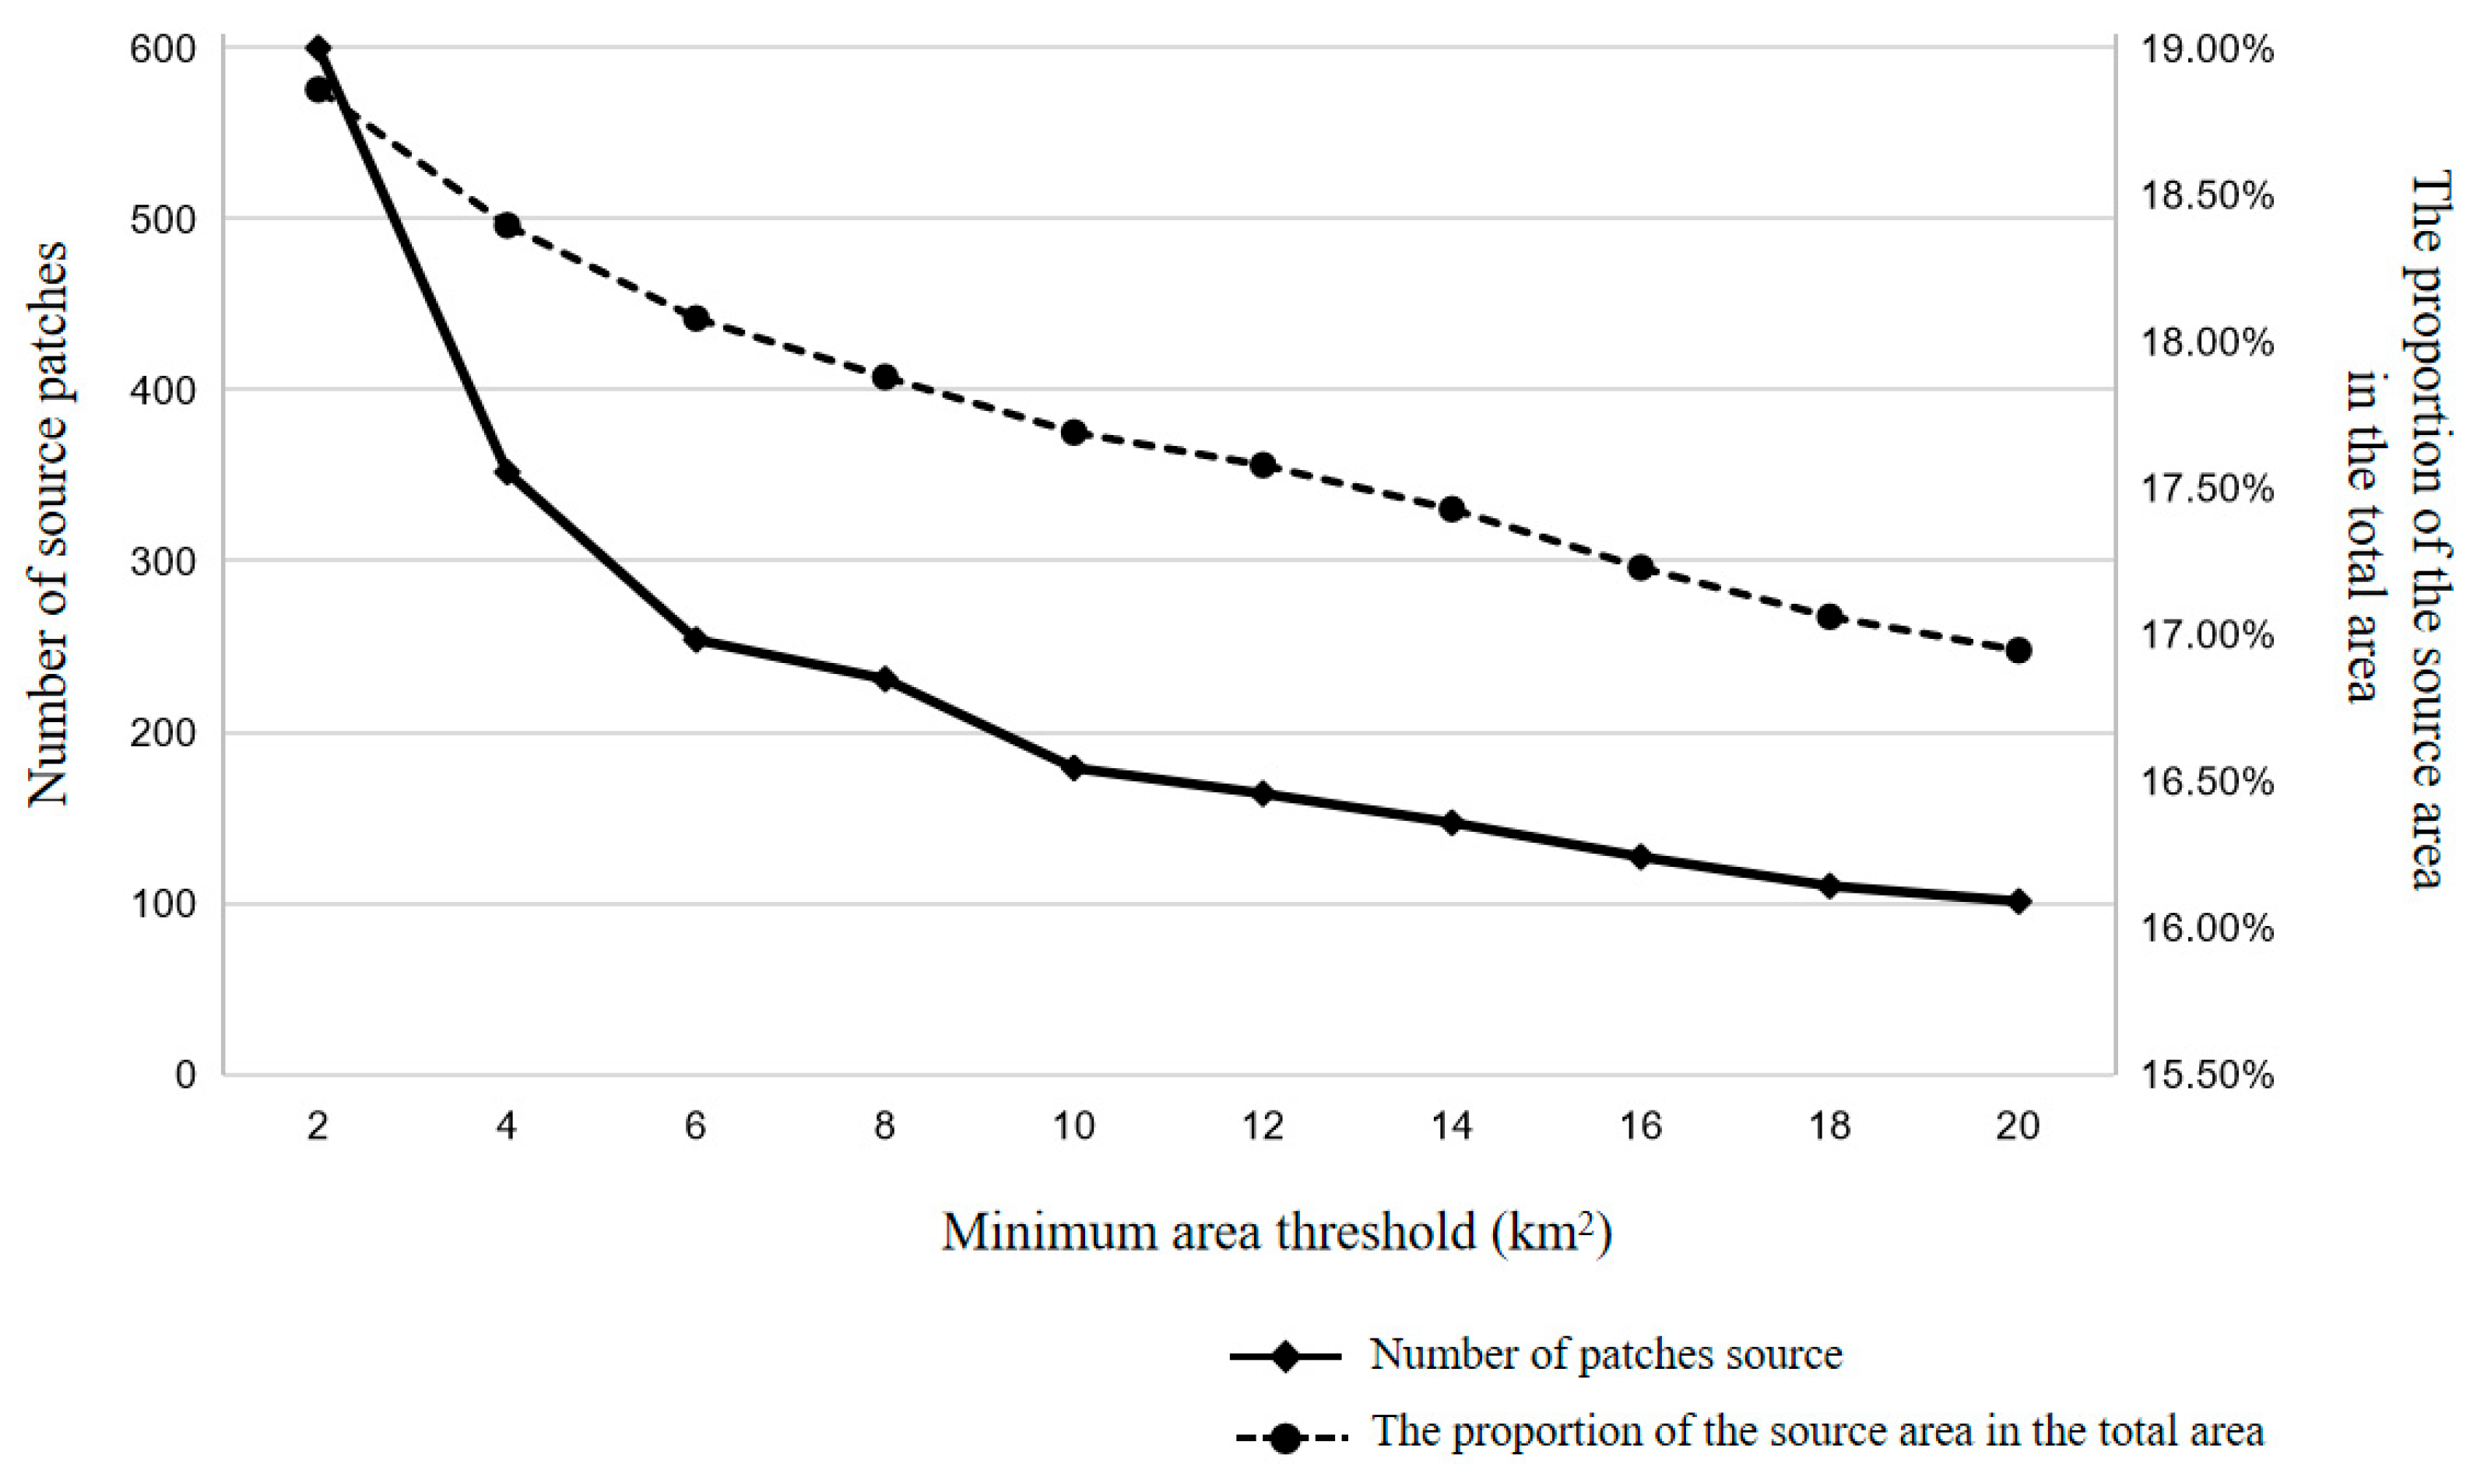
2.3.2. Selecting Ecological Sources

(1)
The OWA method
The formula for this method is as follows: Selecting ecological sources involves diverse and intricate methodologies [42]. To address this, we integrated OWA with GIS analysis, enabling multi-objective assessments that consider trade-offs among various ESs [43].
O W A D i j = i n ω i s i j , ω i s i j 0 ,   1   a n d   i n ω i = 1 ,   f o r   i   a n d   j = 1 , 2 , 3 , , n
Here, D i j is the value of the attribute i at position j in the normalized grid, normalize the four ESs of 2020 to a range of 0 to 1, and rank them in ascending order based on their average values. Subsequently, the ordered weights for seven risk factors were determined; s x j is the new sequence obtained by arranging four ESs in ascending order based on their average values; ω i is the ordered weight of s i j   ;   n is the total number of ES grid cells.
When α < 1 , the greater the weight of the factor, the more pessimistic the researcher is, and the landscape ecological risk tends to increase, α = 1 indicates no preference, and when α > 1 , the greater the weight of the factor, the more optimistic the researcher is, and the landscape ecological risk tends to decrease. We set seven different levels of risk coefficients α 0.0001, α 0.1, α 0.5, α 1, α 2, α 10, α10,000 for simulation [44].
The weights and trade-offs of different ESs are obtained by setting different risks. The formulas are as follows:
r i s k = n 1 1 x n n i ω i ( 0 r i s k 1 )
t r a d e o f f = 1 n i n ( ω i 1 / n ) / n 1 0 t r a d e o f f 1
Here, n is the total number of raster layers, and   ω i   is the weight of i . The equilibrium degree of the size distribution of different ESs under various risk coefficients is represented by trade-offs. The closer the value is to 1, the more balanced the distribution of various ESs and the more moderate the internal conflicts [45].
The protection efficiency of different ESs is assessed using the following formula, which combines trade-offs and protection efficiency to select the most suitable ecological sources [46].
E = E S C ¯ E S 0 ¯
Here, E is the protection efficiency of ES types; E S C ¯ is the average value of ES types in the priority protected area; and E S 0 ¯ is the average value of ES types in the whole study area.
(2)
Landscape connectivity
Landscape connectivity refers to the extent to which a landscape either supports or impedes the mobility of organisms. Specifically, high levels of connectivity between patches are crucial for maintaining ecosystem stability and resilience [47]. Ecological sources were analyzed using Conefor software 2.6 and GIS to calculate the dpc of ecological sources, which were then classified into three categories: key, important, and general ecological sources [48].
d P C = i = 1 n j = 1 n α i · α j · p i j A L 2
Here, n is the total number of habitat nodes in the landscape, α i and α j are the attributes of the nodes i and j , A L 2 is the maximum landscape attribute, and p i j is the maximum product probability of all paths between patches i and j .

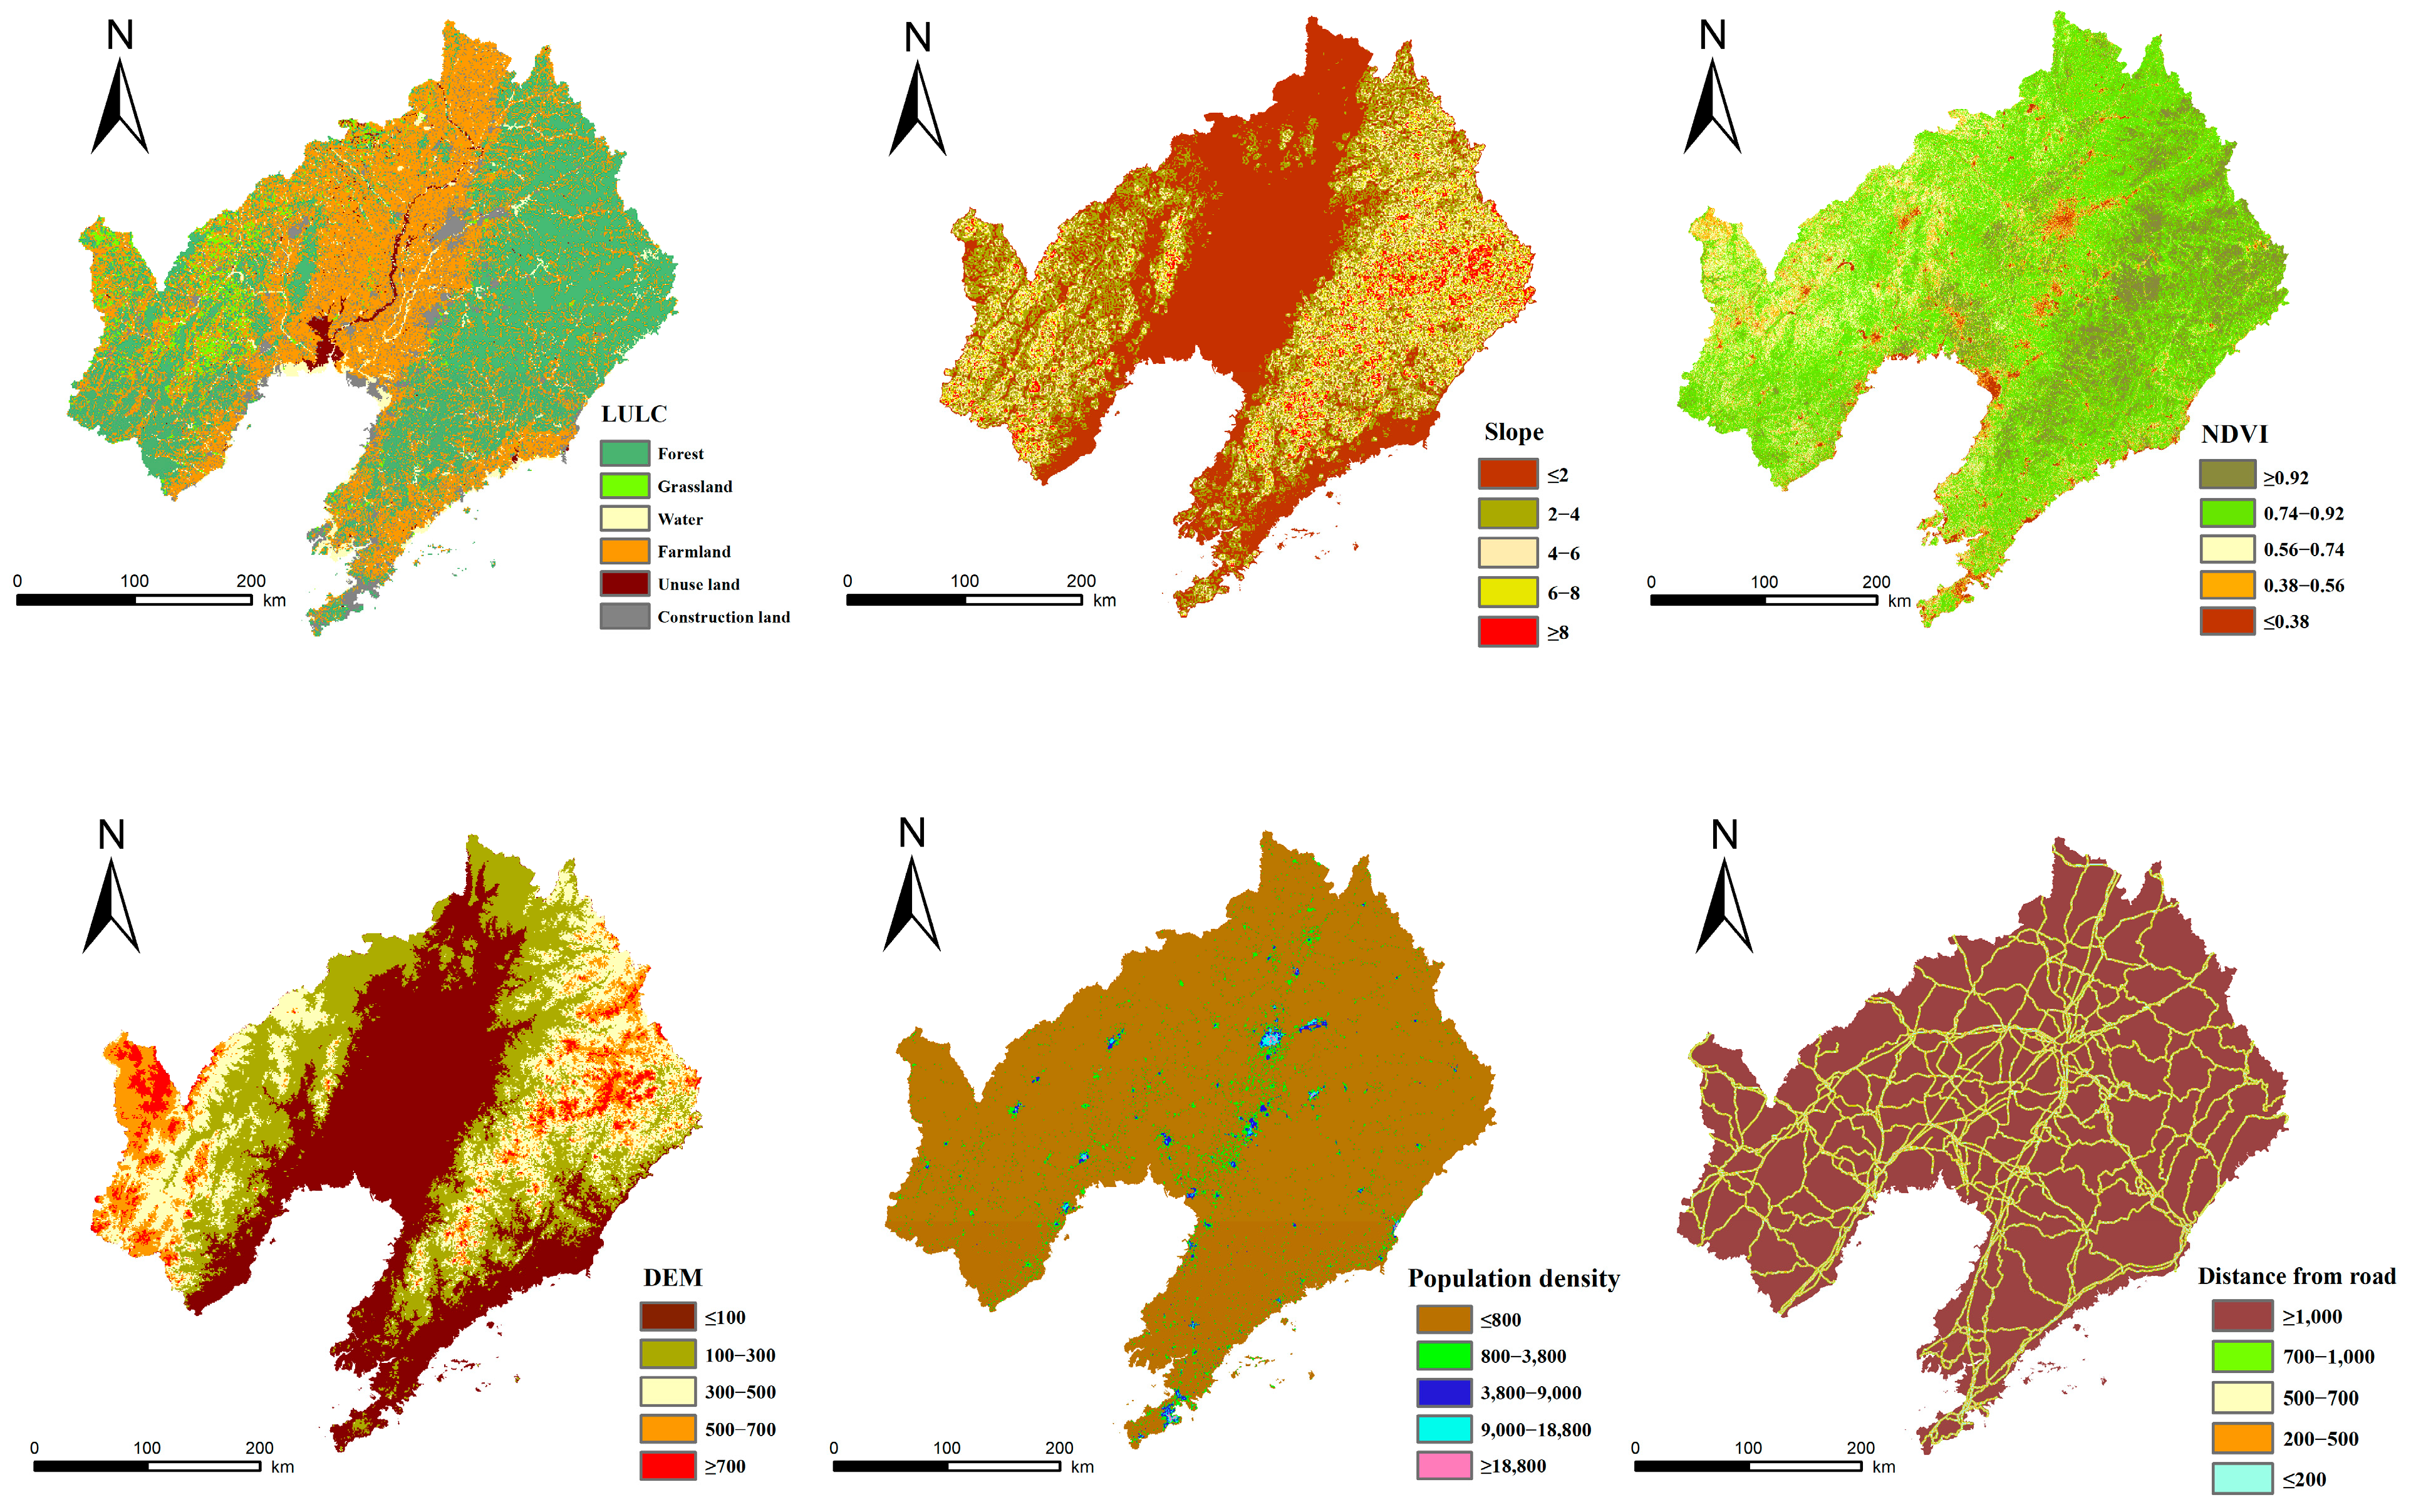
2.3.3. Constructing Ecological Resistance Surfaces

The ecological resistance surface reflects the barriers and disturbances that species confront during migration, indicating the level of ecological security in each region [30,49]. Using the hierarchical analysis method, we chose six factors and assigned weights to each of them (Table 2).

2.3.4. Extraction of Ecological Corridors, Pinch Points and Barrier Points

Circuit theory connects the calculated effective resistances, current flows, and voltages across the landscape with ecological processes like species migration and gene flow [50]. Kirchhoff’s rules are applied to represent the landscape as a circuit network in order to ascertain the current and voltage flows [51].
I = V R e f f
Here,   I   is the current through the conductor; V is the voltage measured across the conductor; and R e f f is the effective resistance of the conductor. Within the field of ecology, I   mimics ecological flow and can be used to predict the probability of species migration or gene flow.   R e f f is considered an indicator of spatial isolation between nodes [52].
Ecological pinch points are essential areas for facilitating important ecological processes [53], which are selected using the Pinchpoint Mapper module, and the corridor’s CWD setting is configured to 4000 m.
Ecological barrier points are defined as particular regions within an ecosystem that obstruct species migration, genetic flow, and other ecological functions. The Barrier Mapper module is employed to identify these barrier points within a 1000 m search radius.

3. Results

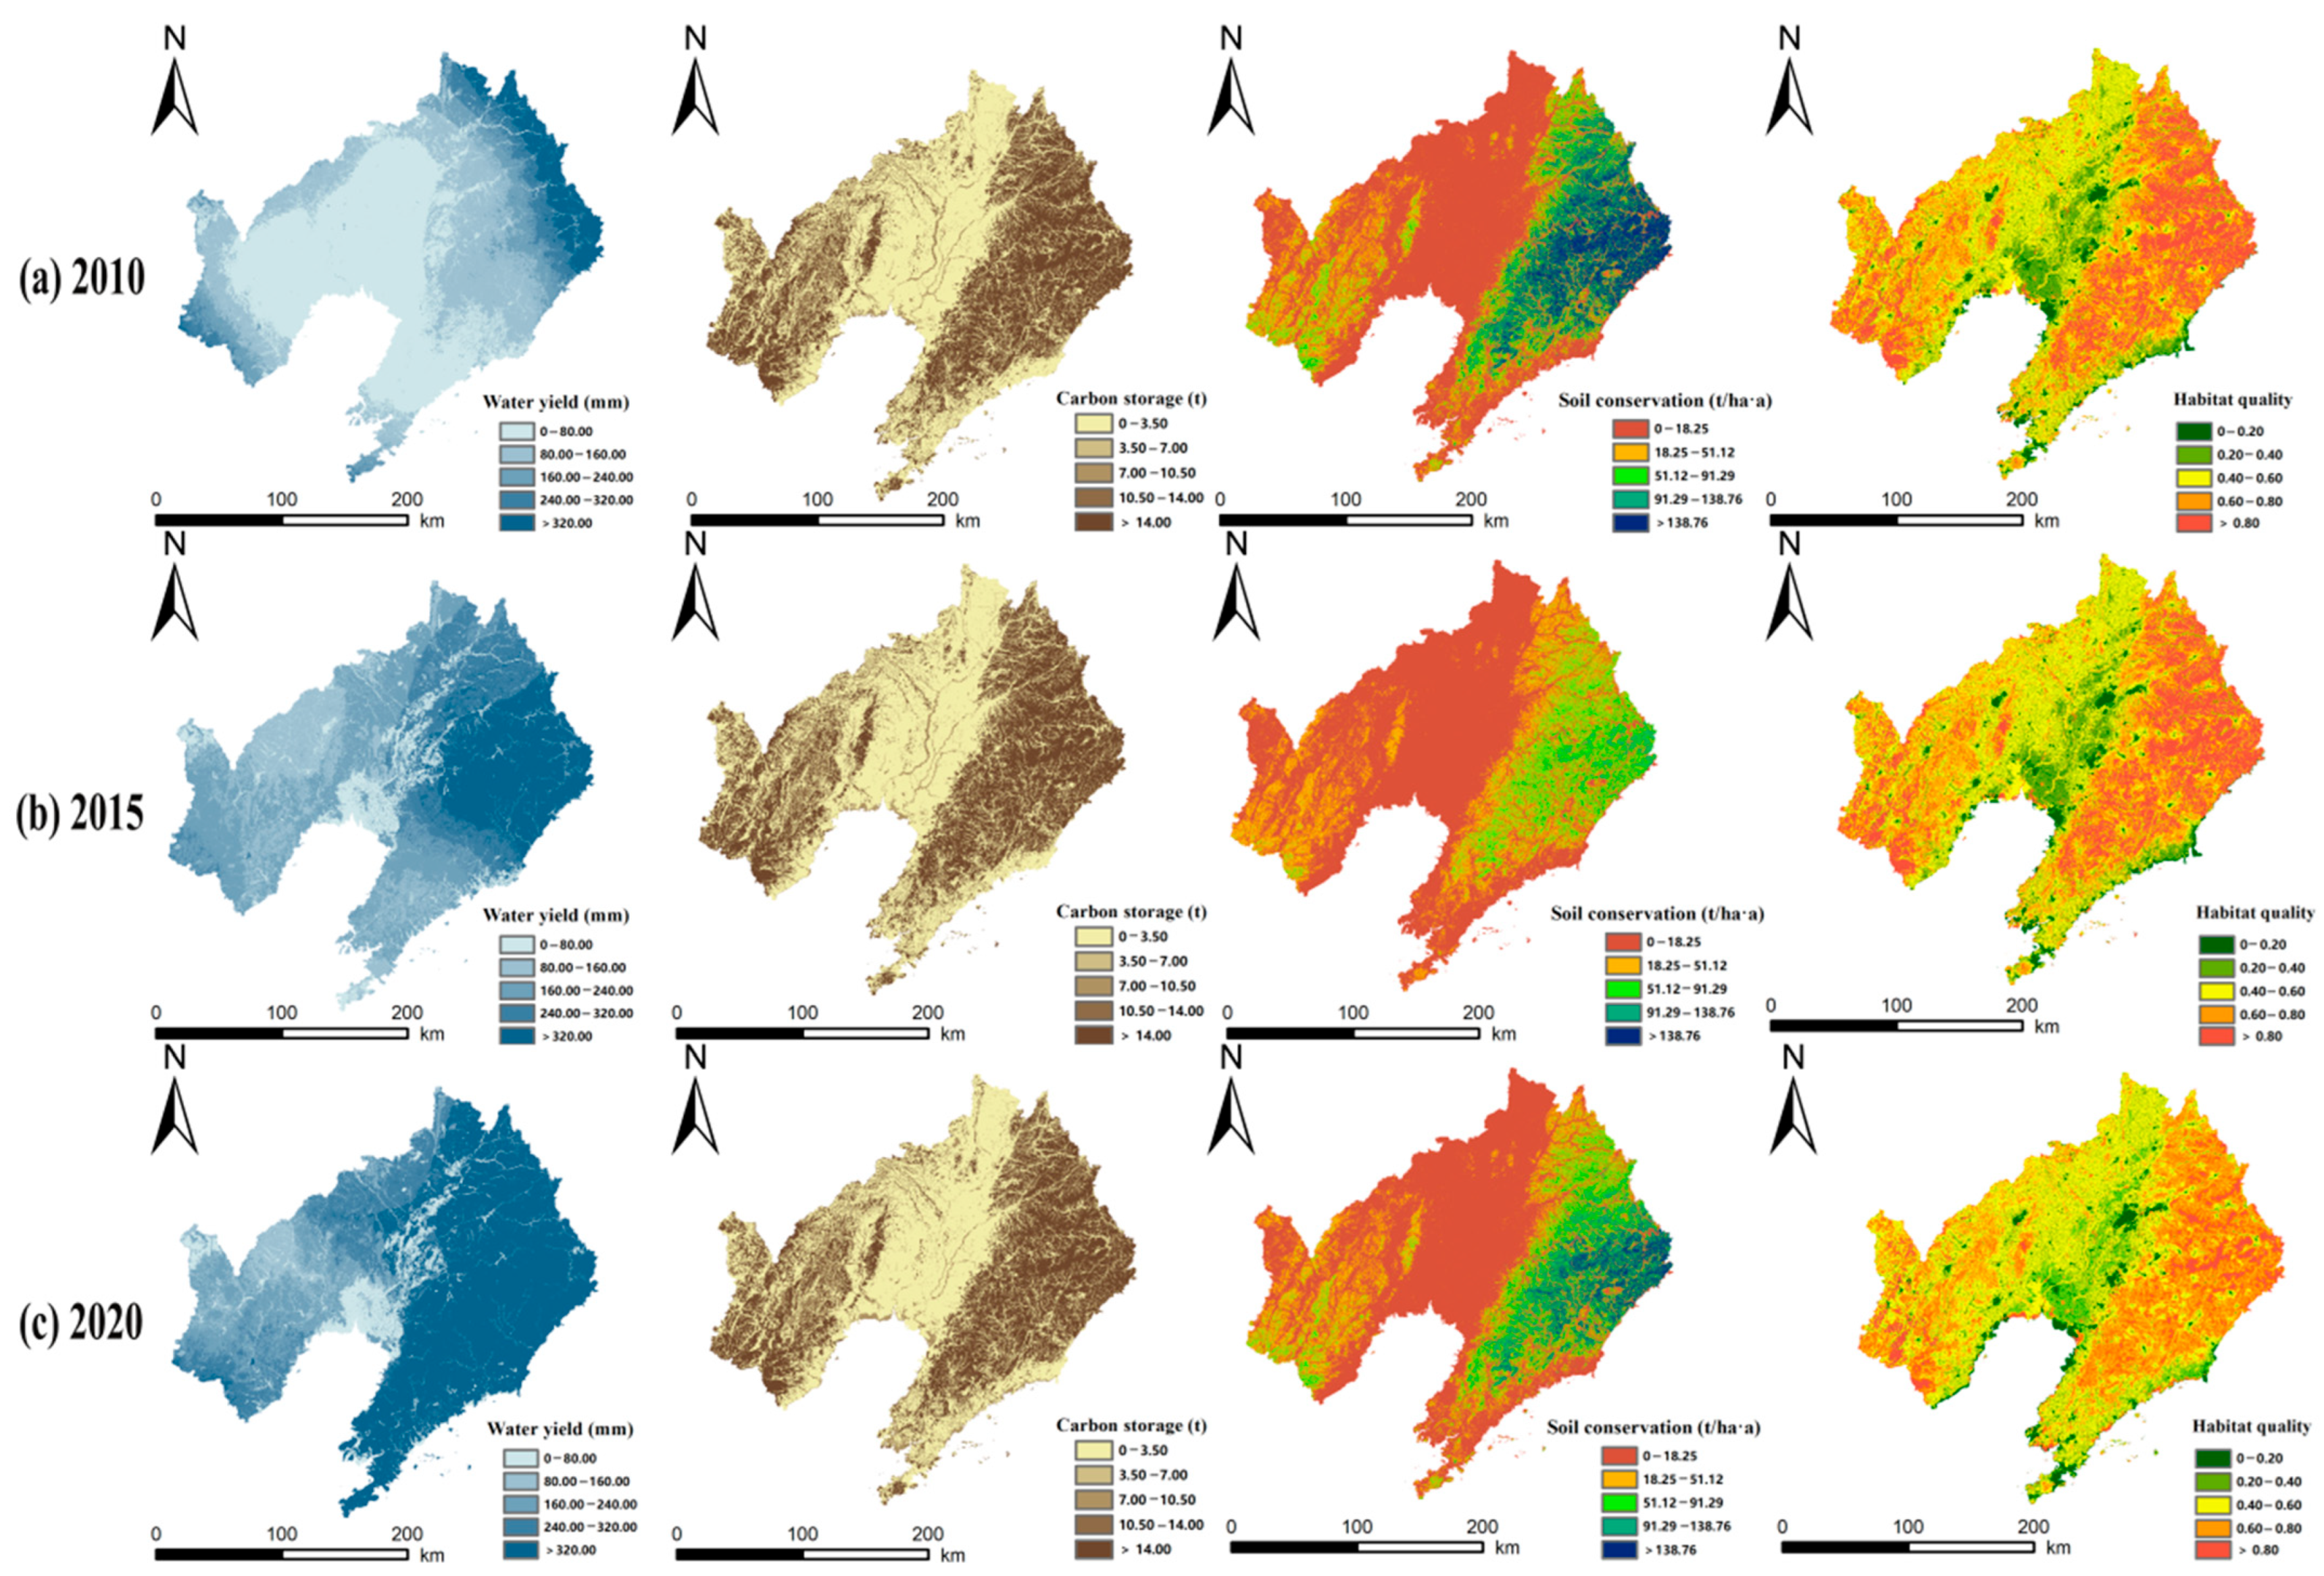
3.1. Temporal and Spatial Characteristics of ESs

As shown in Table A1 of Appendix A, the water yield in 2010, 2015, and 2020 showed an increasing trend, with average values of 119.41 mm, 214.73 mm, and 384.72 mm, respectively. Soil conservation tended to decrease and then increase, while carbon storage tended to increase and then decrease; the average value of soil conservation was 44.97 t/ha·a, 20.78 t/ha·a, and 33.28 t/ha·a, while the average value of carbon storage was 11.59 t, 11.61 t, and 11.54 t, respectively. Habitat quality decreased each year with average values of 0.61, 0.60, and 0.54, respectively. The spatial distribution of the four ESs exhibits a consistent trend, with lower values in the center and higher values in the eastern and western regions (Figure 3). In 2010, 2015, and 2020, high-value regions for water yield moved toward the eastern and western directions; in the eastern region, high-value areas for soil conservation showed an increasing trend, whereas those for carbon storage maintained stability; conversely, high-value regions for habitat quality in both eastern and western areas exhibited a decreasing trend.

3.2. Construction of an ESP in Liaoning Province

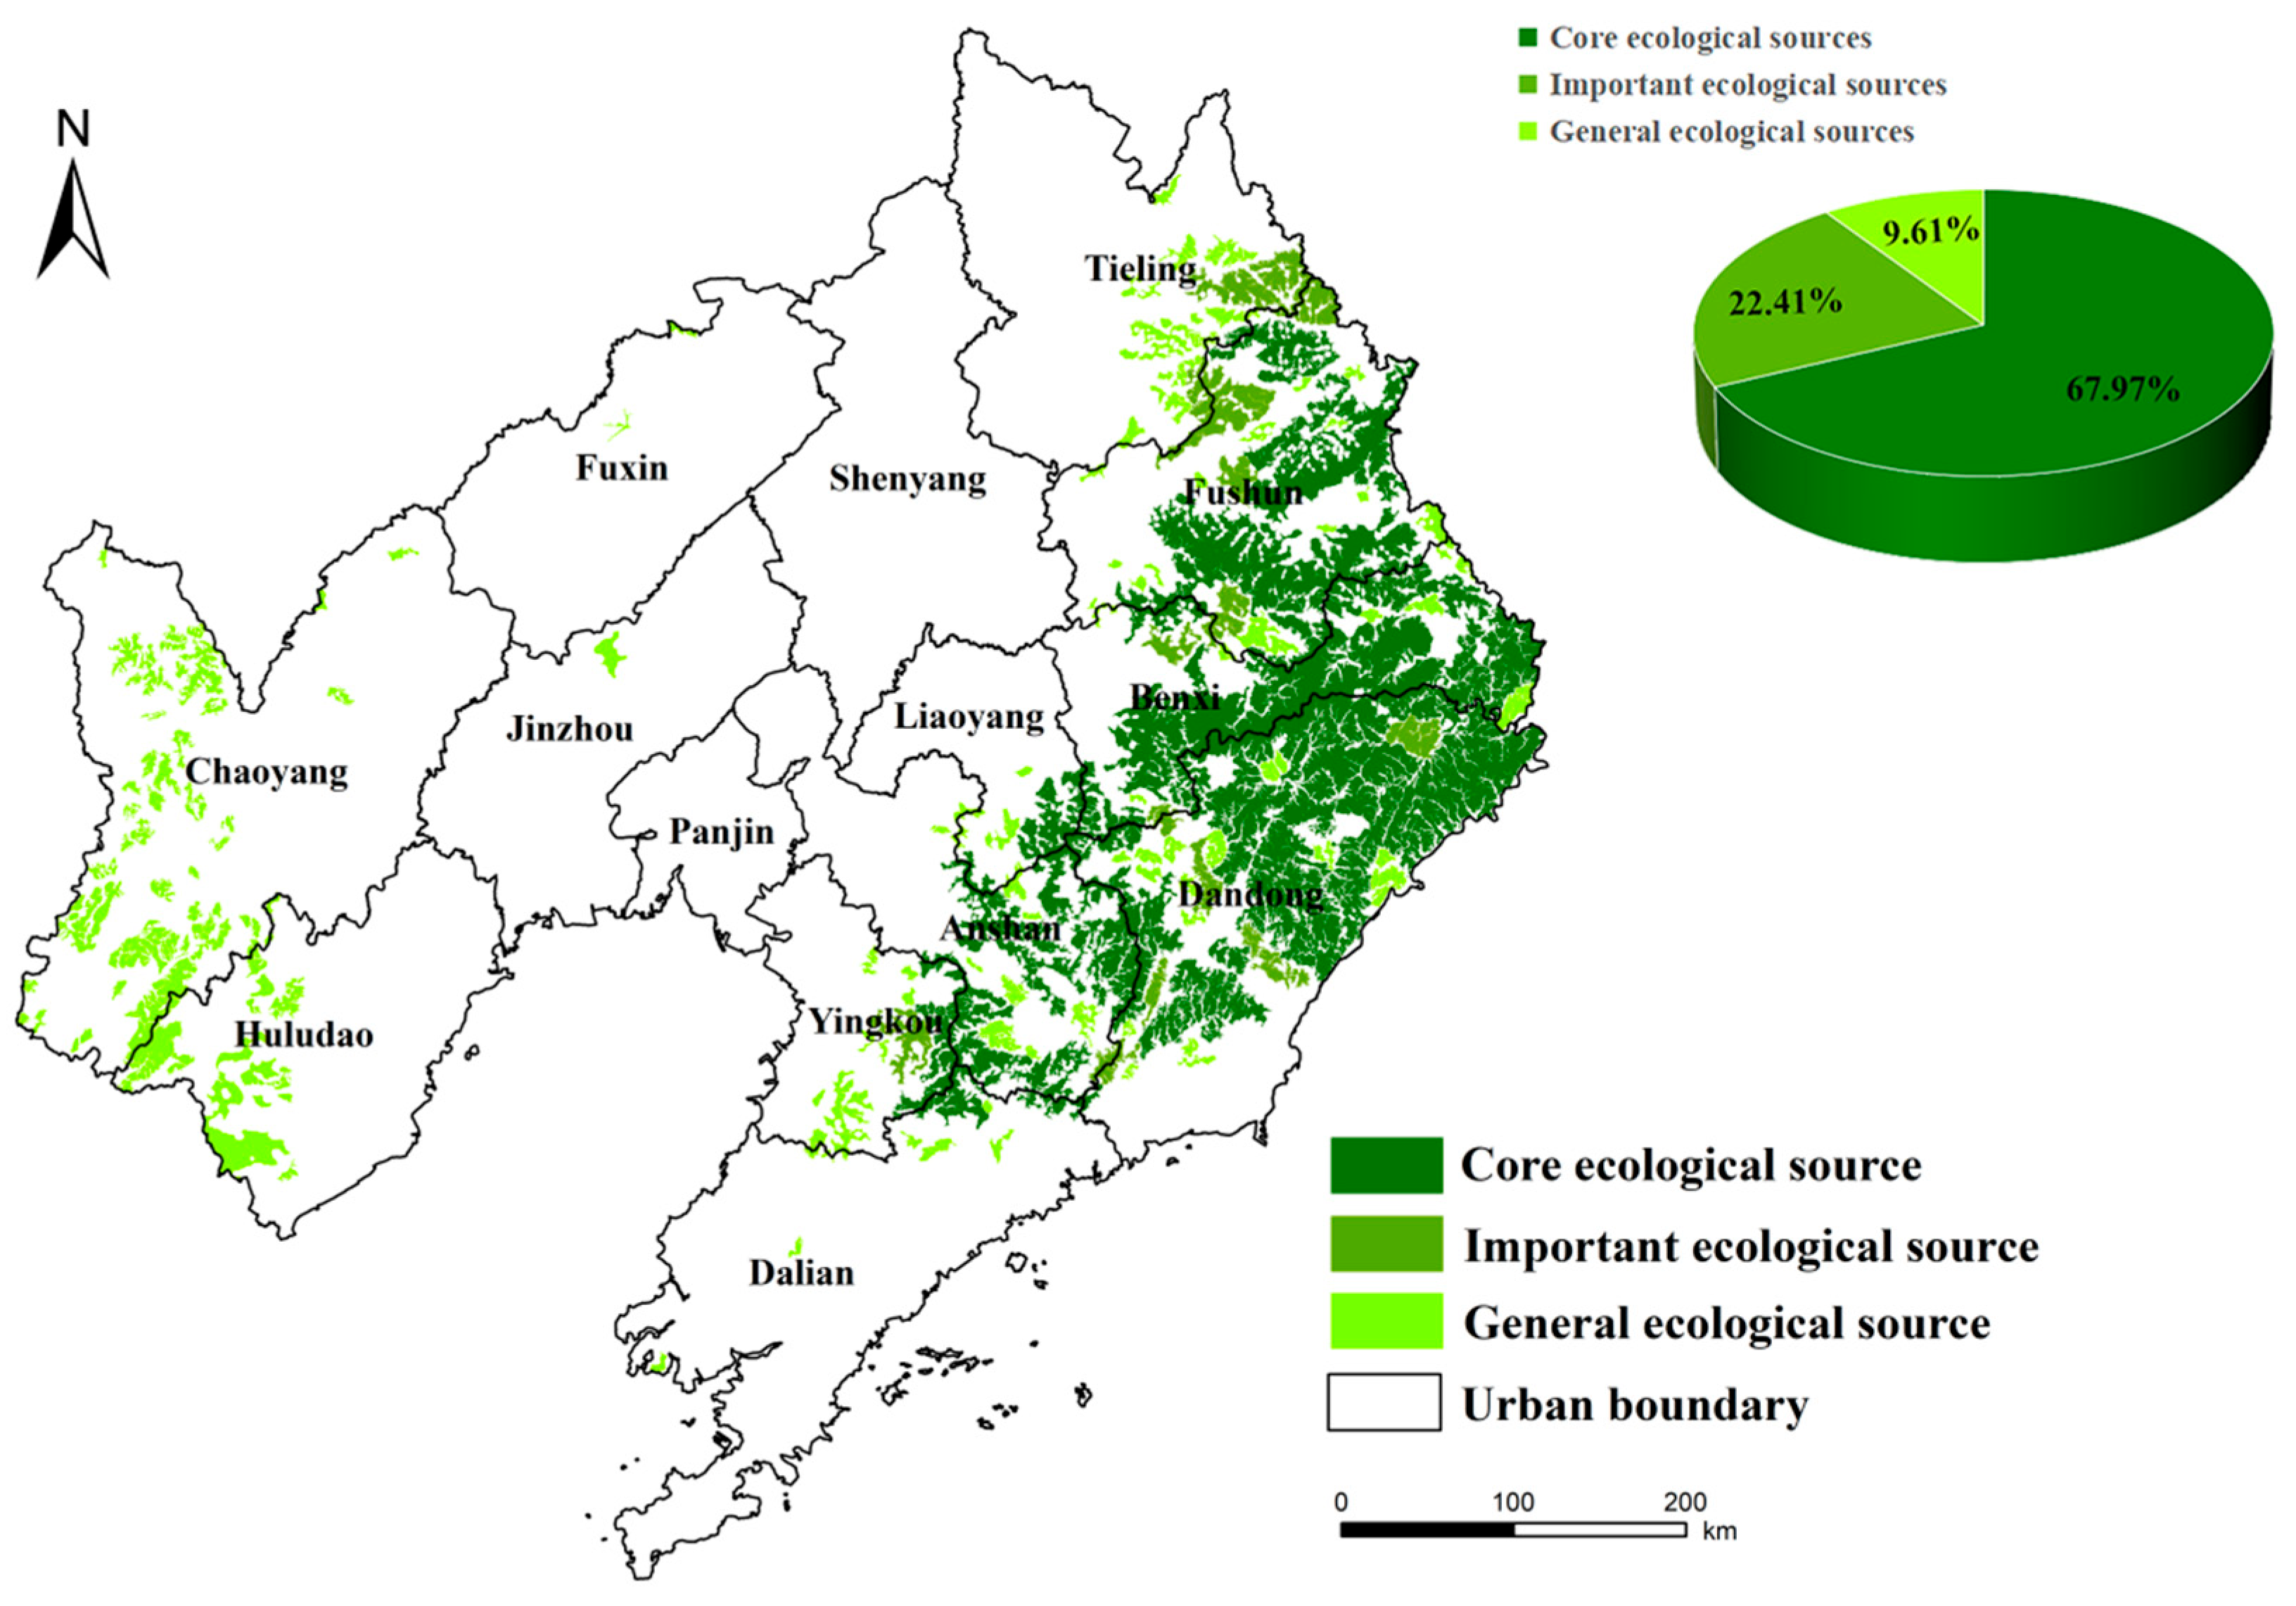
3.2.1. Identification of Ecological Sources

(1)
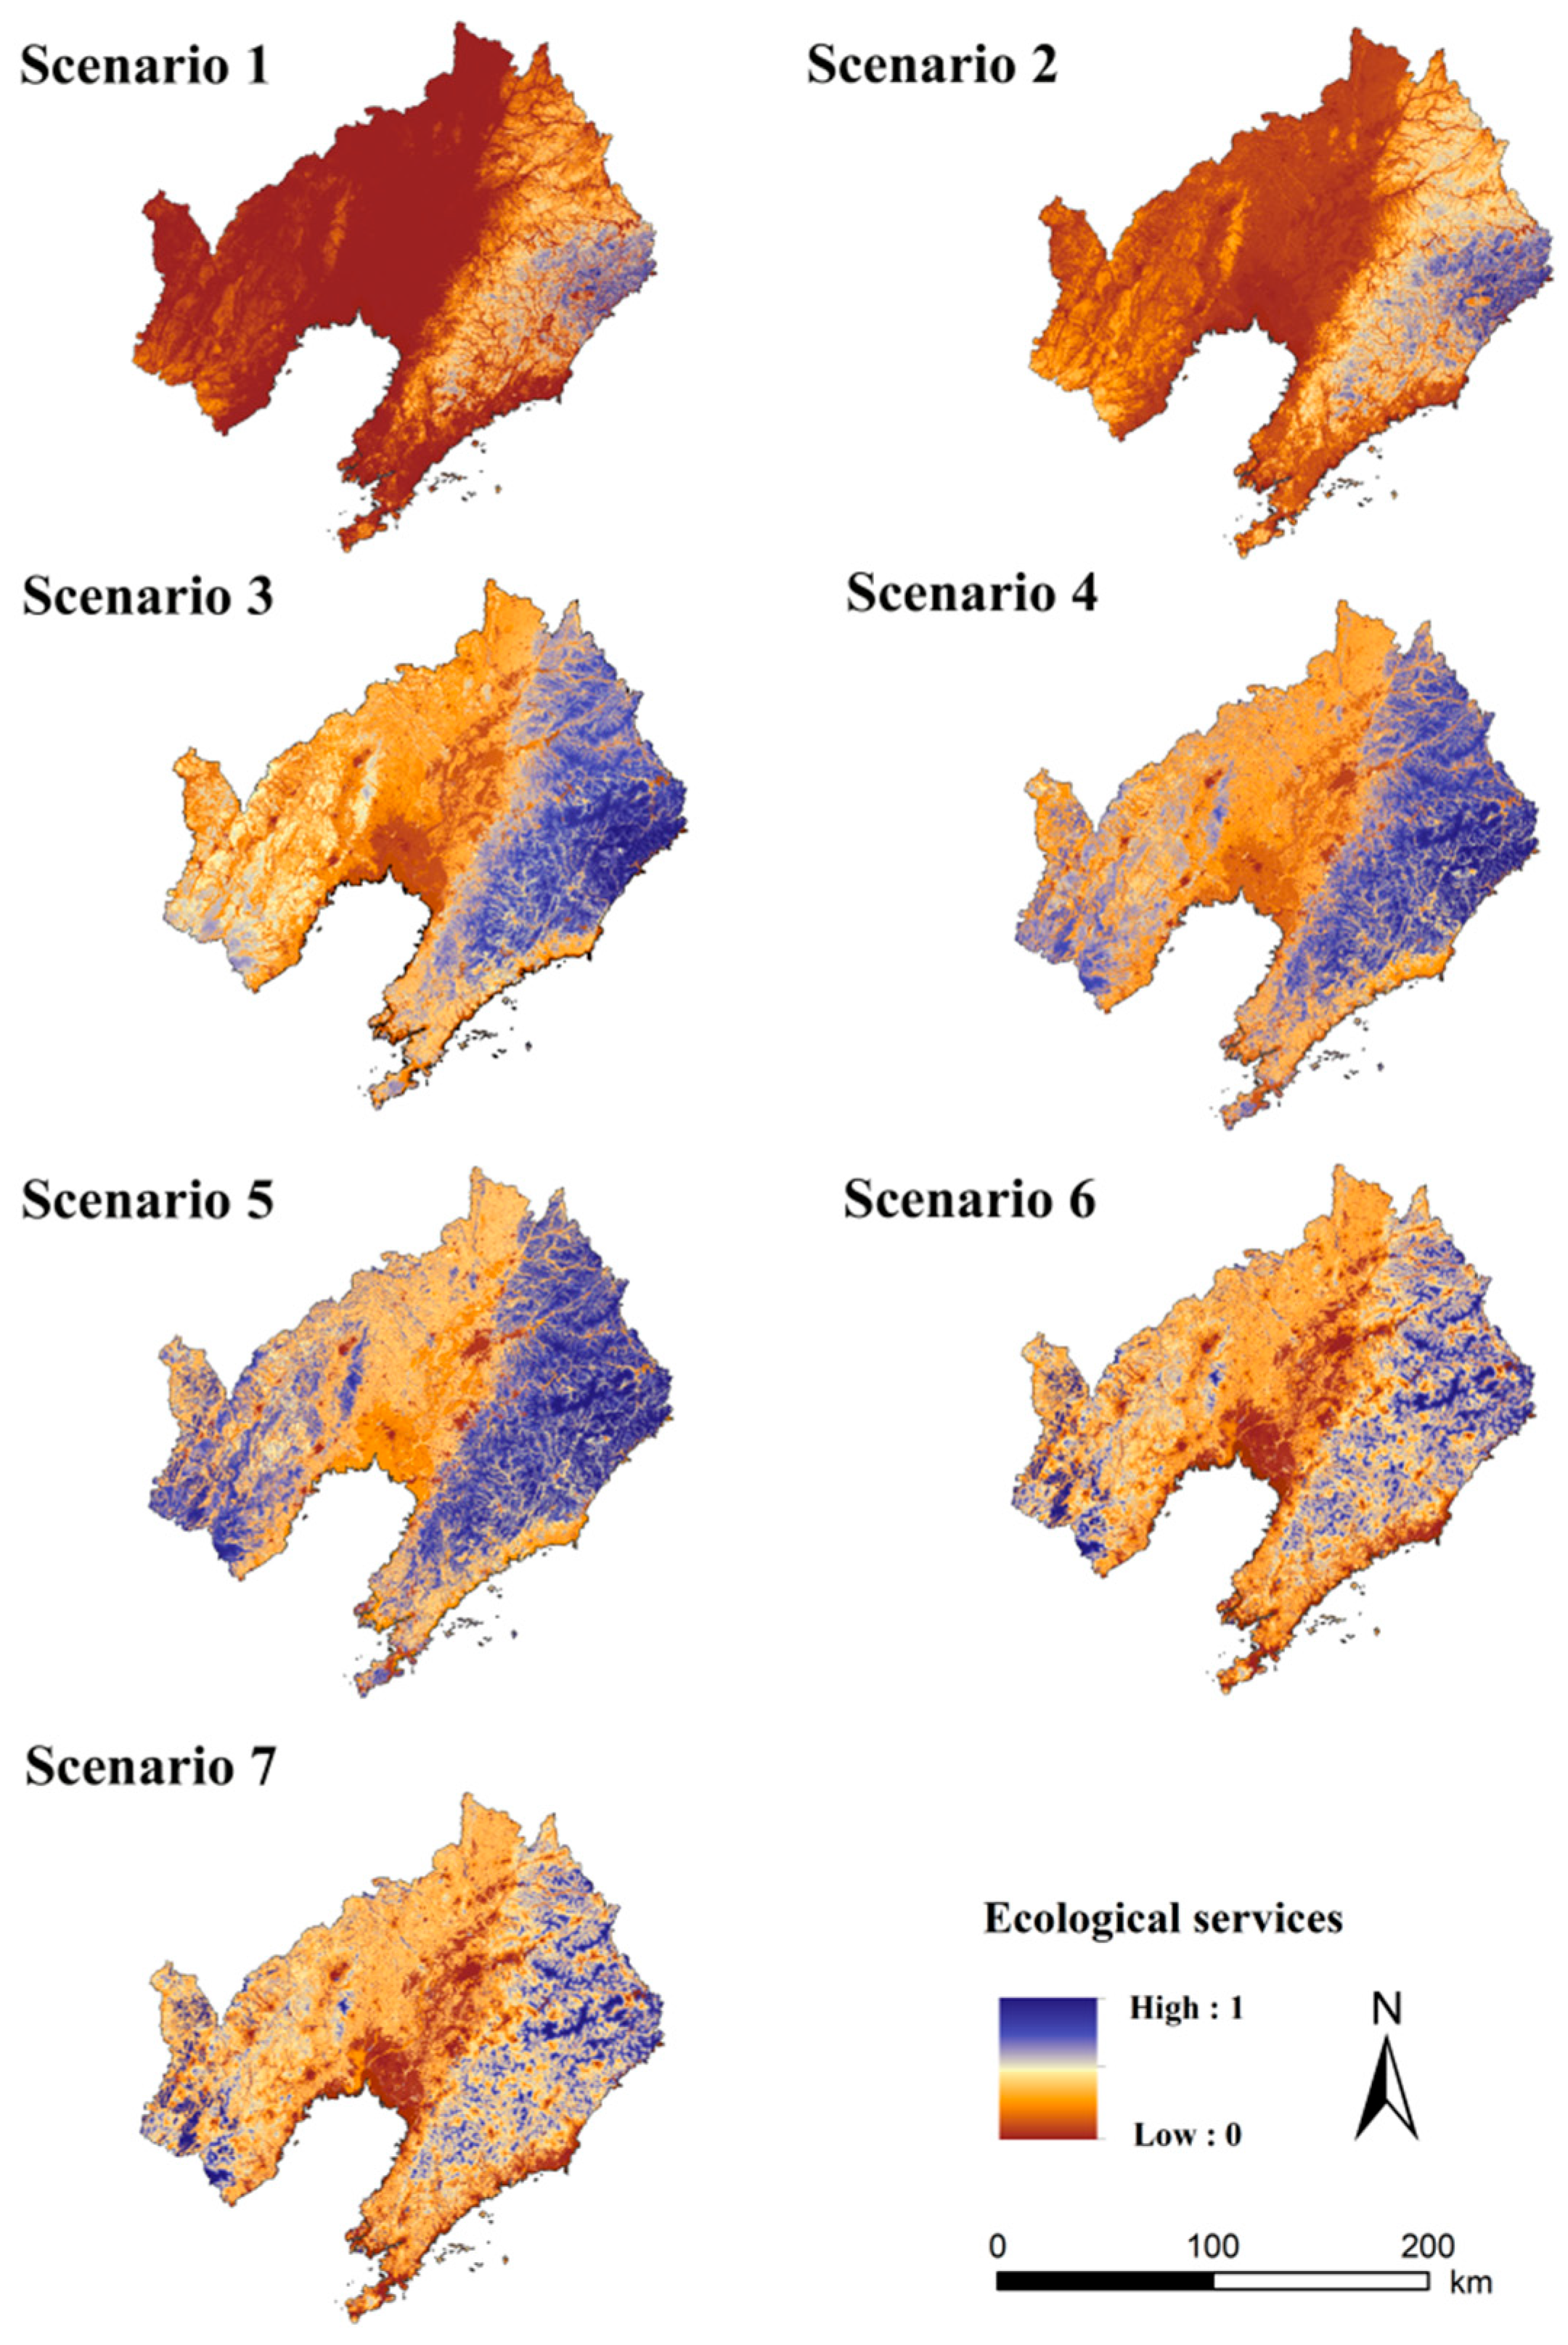
Ecosystem weights, risk values under different scenarios
The standardized of the four ESs are arranged in ascending order, and the results are as follows: ω1 is soil conservation, ω2 is water yield, ω3 is carbon storage, and ω4 is habitat quality. The weights and trade-offs corresponding to the four ESs are calculated according to Formulas (7) and (8) (Table 3). The scenario with the highest trade-off is Scenario 4 (risk = 1, trade-off = 1), where each ES has the same weight, which is the ideal scenario for ESs. Scenario 1 and Scenario 7, which assign weights only to soil conservation and habitat quality, are the two extreme scenarios for decision making, and therefore the trade-off is 0. In addition to the ideal and extreme scenarios, the trade-off among other scenarios, from high to low, is as follows: Scenario 5 > Scenario 3 > Scenario 2 > Scenario 6.
The spatial distribution of the four ESs in Liaoning Province under seven scenarios is produced by integrating the OWA approach and GIS (Figure 4). In Scenario 1, the majority of the study area’s ESs are low-value areas, with only a small portion of the eastern forests being high-value. In Scenario 2, the eastern woods had high-value sections, the western woodland had medium-value areas, and the central region still had a preponderance of low-value distribution. Scenario 3 shows a progressive decline in the distribution of low values in the central and western areas. In Scenario 4, the distribution of high-value areas showed a significant increase compared to Scenario 3, with these areas remaining predominantly concentrated in the eastern woodland. In Scenario 5, high values are clustered, primarily in the eastern and western woodland parts. In Scenarios 6 and 7, the distribution of high-value areas decreased compared to Scenario 5. In Scenarios 5 through 7, the spatial distribution of ESs is characterized by medium- to high-value areas. Overall, the distribution pattern of ESs across Scenarios 1 to 7 transitions from being centered on low-value clusters to focusing on medium and high-value clusters.
(2)
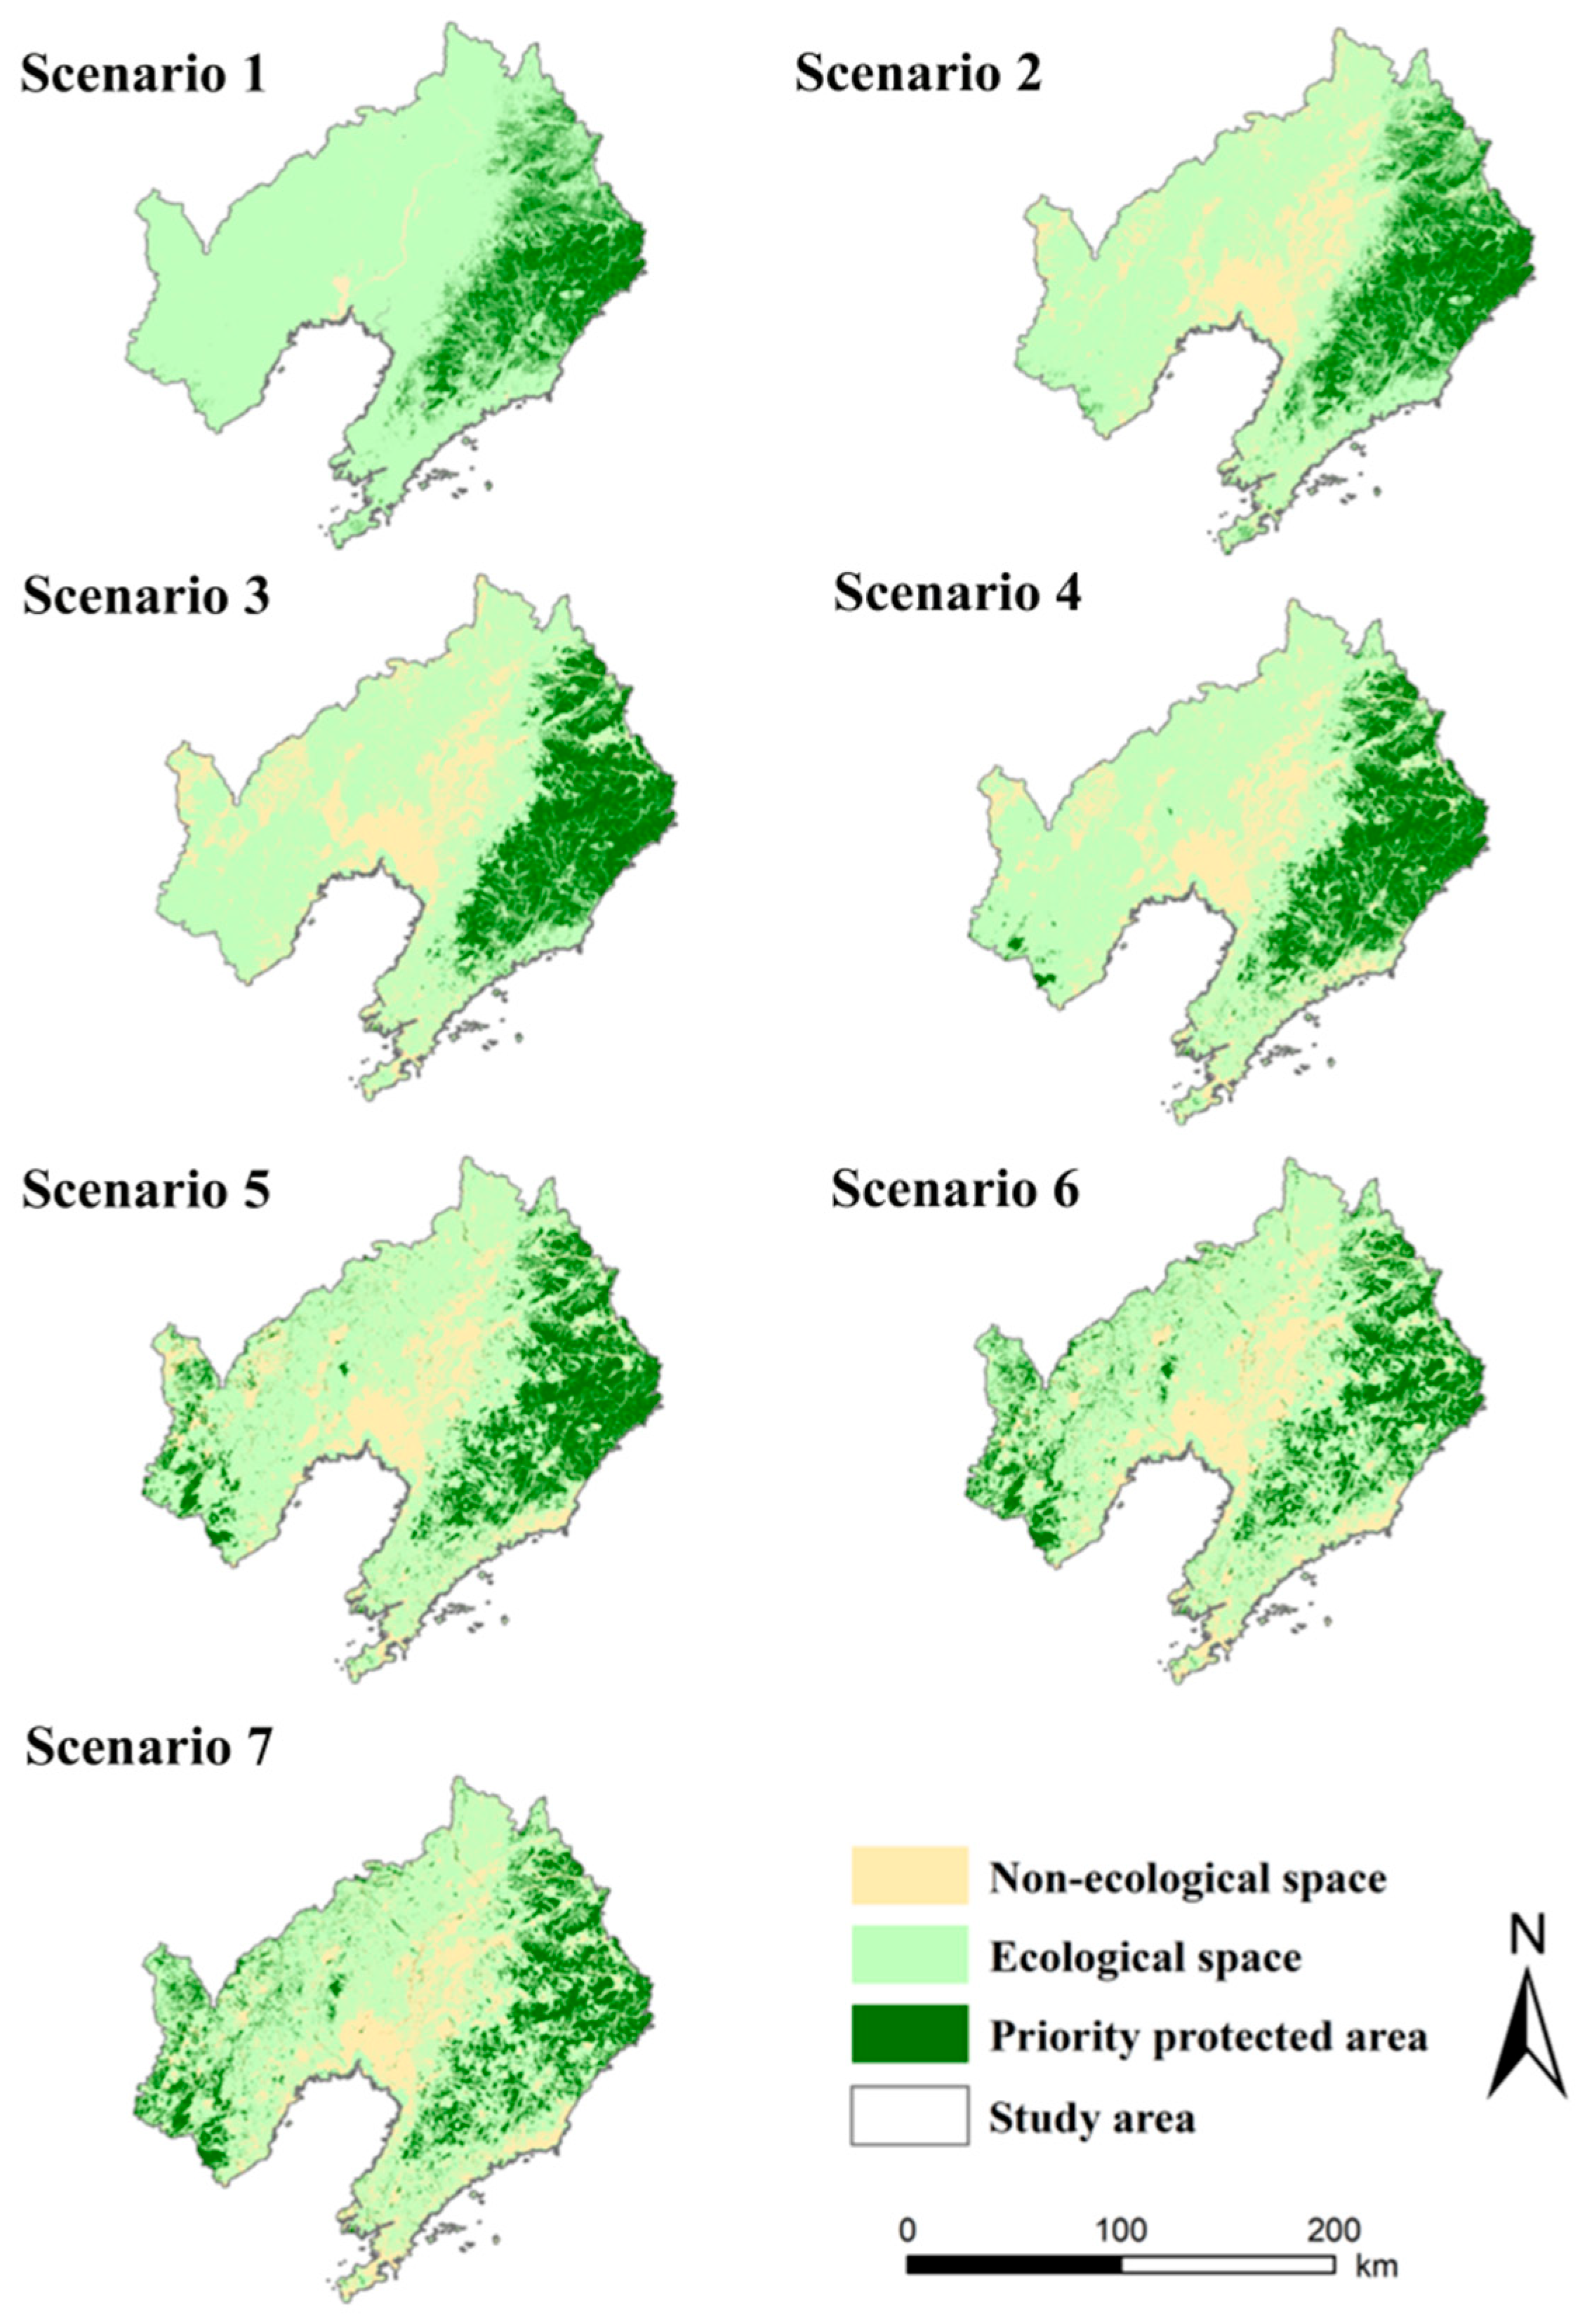
Determination of priority protection areas for ESs under different scenarios
In this study, the quartile classification method is used to classify the ESs under different scenarios into five categories to identify priority protected areas. As shown in Figure 5, the largest category represents priority protected areas in Liaoning Province, the smallest category represents non-ecological spaces, and the remaining categories represent ecological spaces in Liaoning Province. In Scenario 1, Scenario 2, and Scenario 3, the distribution pattern of priority protected areas is similar, mainly concentrated in the eastern area. From Scenario 1 to Scenario 3, the scope of non-ecological spaces gradually expands. In Scenario 4, priority protected areas are mainly concentrated in the eastern area while being scattered in the western part. Priority protected areas are distributed similarly in Scenarios 5, 6, and 7, with the majority of them concentrated in the eastern and western regions and a smaller number scattered around the center. The distribution of priority protected areas in Scenario 5 is more concentrated than in Scenarios 6 and 7. As Scenario 1 progresses to Scenario 5, the distribution of priority protection areas gradually becomes more dispersed. From Scenarios 5 to 7, while the distribution of these areas continues to diffuse, the overall extent begins to contract gradually.
Table 4 shows the protection efficiency of the four ESs for the seven scenarios. Except for the ideal scenario (Scenario 4), the trade-offs between Scenario 3 and Scenario 5 are higher, and the differences between them are smaller. In terms of protection efficiency, the protection efficiencies of the four ESs in Scenario 5 were higher than those in Scenario 3, and the average protection efficiency of Scenario 5 was >1. Combining the trade-offs and the protection efficiencies, the prioritized protected areas in Scenario 5 were selected as the optimal scenario.
(3)
Determine the ecological sources
Directly designating priority protected areas as ecological sources may compromise the integrity of these sources due to the presence of scattered small patches within them. Moreover, these small patches are likely to pose greater challenges for protection and management during the implementation phase. Thus, this study employs the area threshold method, which involves determining the number of source patches and the ratio of the source area to the total area. It subsequently determines the two inflection points at which the change stabilizes as the minimum area threshold. As shown in Figure 6, a step size of 2 km2 was chosen, taking into account the location of the study area and its ecological background characteristics. Within the minimum area threshold range of 0–20 km2, the number of source patches and the proportion of the total regional area exhibit an initial significant decrease. A turning point is observed at the 10 km2 minimum area threshold, beyond which the decline becomes continuous and more gradual. Although the total area of the source area was affected by the minimum area threshold, the proportion of the ecological source area to the entire regional area consistently remained between 17.7% and 17.06%. This indicates that the excluded patches, although numerous, were relatively small in size and had a negligible impact on the overall pattern of ecological sources. Ecological sources were identified from patches exceeding 10 km2 within priority protected areas while excluding overlaps between ecological sources and both building land and unused land.
A total of 179 ecological sources were identified in the study area, which covered 26,235.34 km2, or around 17.64% of the overall study area. The ecological source area ranged from 10.01 km2 at the minimum to 10736.86 km2 at the maximum. Landscape connectivity, as classified by Conefor software, categorizes ecological sources into three grades based on the dpc index: dpc ≤ 1 for general ecological sources, 1 ≤ dpc ≤ 3 for important ecological sources, and dpc ≥ 3 for core ecological sources. The analysis identified 13 core ecological sources covering a total extent of 17,866.18 km2, accounting for 67.97% of the total source area. With a total area of 5890.46 km2, 14 important biological sources make up 22.41% of the source area. A total of 2527.41 km2, or 9.61% of the overall source area, comprised the 152 general ecological sources that were identified.
The ecological sources in Liaoning Province, as a whole, indicate that they are clustered and continuous in the east, fragmented and scattered in the southwest, and primarily distributed in the mountainous and hilly regions of eastern and western Liaoning Province, with high altitudes. In contrast, there are almost no ecological sources in the central plain region. The ecological sources in Liaoning Province are primarily distributed across woodlands and grasslands, accounting for 42.93% of the province’s woodland area. Core ecological sources are primarily located in the southwestern areas of Fushun, Benxi, Dandong, and Anshan cities. Important ecological sources are predominantly found in central Dandong, eastern Tieling, and northern Fushun. General ecological sources are mainly distributed in western Chaoyang and southwestern Huludao. The higher number and importance of ecological sources in the eastern region compared to the western region can primarily be attributed to the elevated topography, dense forest cover, well-developed water systems, and low levels of human activity in the mountainous areas of Liaoning Province (Figure 7).

3.2.2. Construction of Ecological Resistance Surface

The six selected resistance factors were combined to establish the ecological resistance surface for Liaoning Province (Figure 8). They were then categorized into five levels using the natural breakpoint approach (Figure 9). Among these, level 1 represents the region with the lowest resistance, where gene flow between populations encounters minimal hindrance. Level 5 signifies the region with the highest resistance, imposing the strongest constraints on species dispersal and gene flow, thereby posing one of the most significant challenges to maintaining biodiversity and population persistence. Levels 2, 3, and 4 correspond to low-resistance, moderate-resistance, and relatively high-resistance regions, respectively. As resistance values increase, the difficulty of gene flow and material exchange between species progressively escalates. The findings reveal that the ecological resistance surface exhibits a distinct spatial distribution pattern in Liaoning Province, with the central parts displaying noticeably higher resistance and the eastern and western regions showing relatively lower resistance. The cities in central Liaoning Province that exhibit high resistance values primarily consist of Shenyang, Panjin, and Fuxin. In this region, land use is predominantly characterized by farmland. The terrain is relatively flat and densely populated, with a high urbanization rate and a high concentration of basic farmland, which is resistant to species migration and exchange. The cities with lower resistance values in the eastern and western regions include Huludao, Fushun, Benxi, and Dandong. In these areas, land use is predominantly woodland, characterized by relatively high terrain, dense vegetation cover, superior habitat quality, and minimal disturbance from human activities. Consequently, these factors result in reduced obstruction of energy flow and species transfer. In particular, Chaoyang City in the west has a high resistance value due to its location in the northwestern mountainous and hilly areas, characterized by undulating terrain, pronounced soil erosion and sanding problems, and relatively low vegetation cover, which is resistant to material cycling and energy flow.

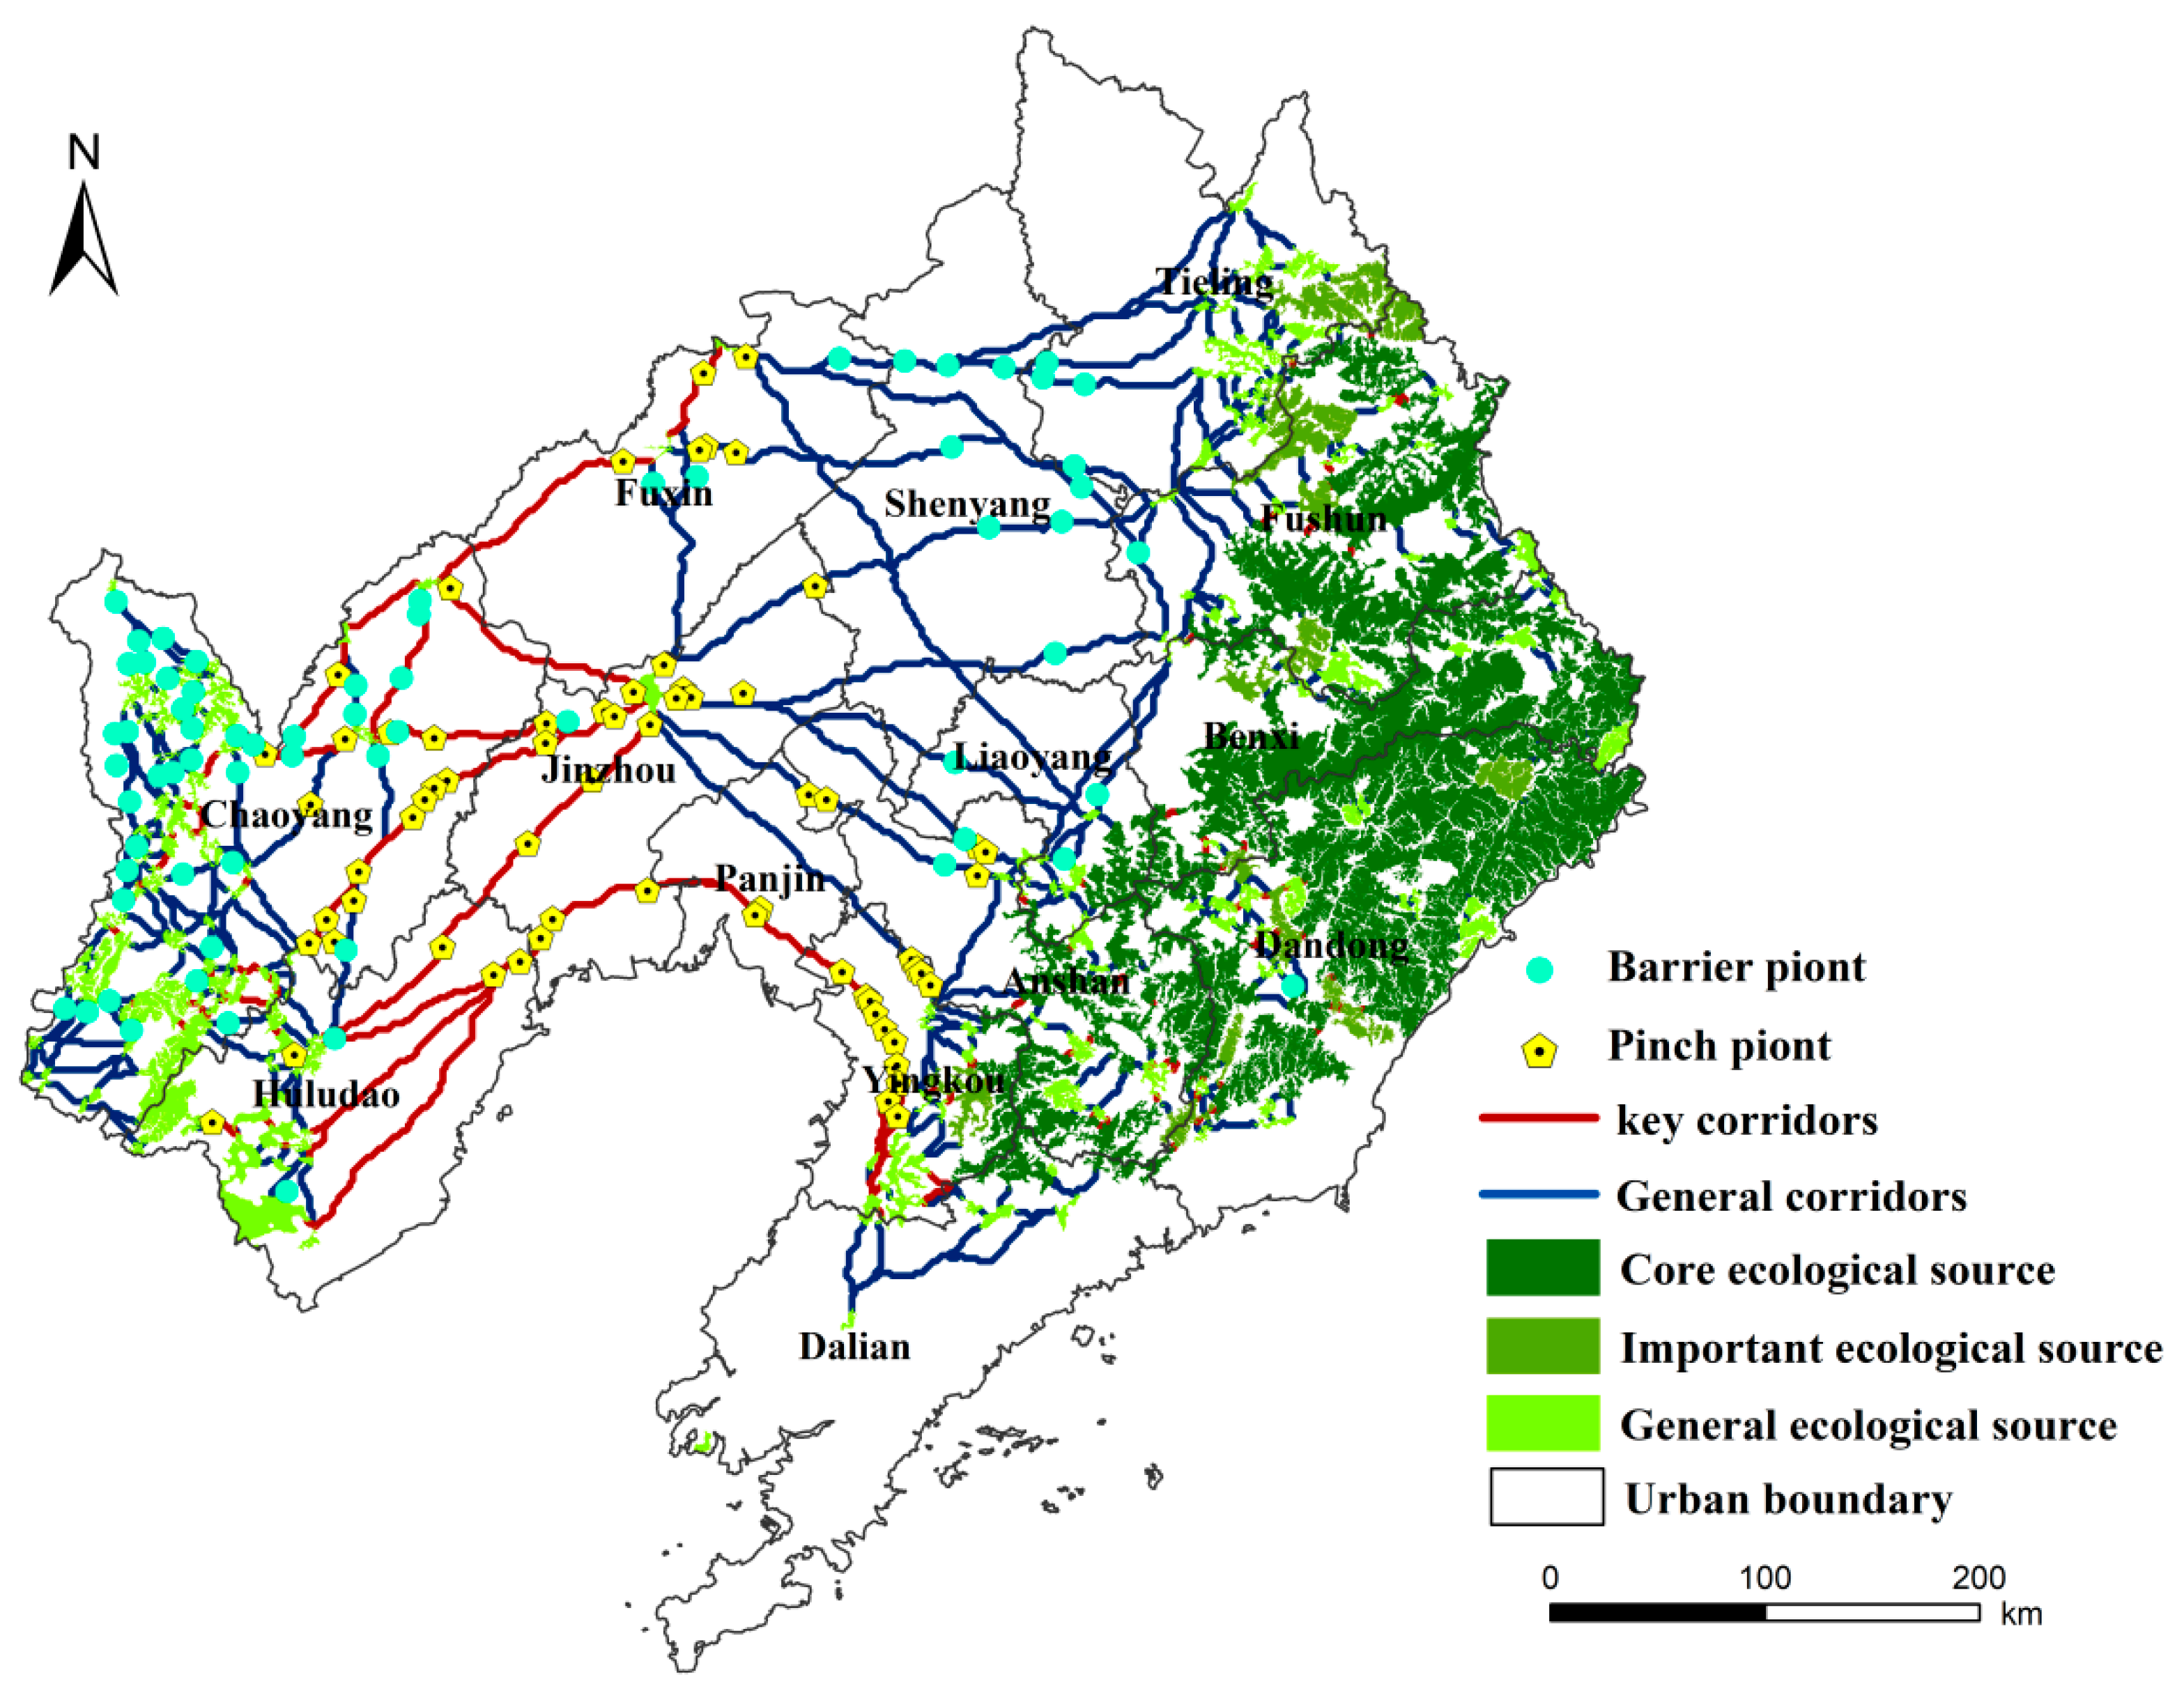
3.2.3. Ecological Corridor Extraction

Ecological corridors are constructed by identifying and connecting continuous paths with lower resistance values on ecological resistance surfaces, effectively linking different ecological sources and thus building the optimal channels. Using the Linkage Mapper tool, ecological sources and resistance surfaces were integrated to create the ecological corridors in Liaoning Province (Figure 10). In total, 435 natural corridors totaling 8794.59 km in length were identified, with the longest corridor measuring 358.79 km. To ascertain the importance of corridors for preserving ecological network connectivity, the cumulative current was analyzed using the Centrality Mapper program [54]. By using the natural breakpoint method to categorize ecological corridors, 106 key ecological corridors and 329 general ecological corridors were identified. The ecological corridors are spatially distributed in a network pattern, connecting ecological sources in the eastern, central, and western parts of Liaoning. The eastern and western ecological corridors are densely distributed and relatively short in length. The key ecological corridors are crucial for maintaining the structure and functionality of the entire ecological network, serving as important pathways for species migration and gene flow and as the main targets of ecological restoration and conservation activities. The majority of these corridors are located in the central-western part of Liaoning.

3.2.4. Identify Ecological Pinch Points and Barrier Points

The ecological corridor width is determined by defining cumulative thresholds, which are employed to detect ecological pinch points [53]. In order to identify the optimal width for these corridors, various widths were assessed, including 2000 m, 4000 m, 6000 m, 8000 m, and 10,000 m. The trends in ecological source area, non-ecological source area, and ecological corridor area were compared under different ecological corridor widths. When the corridor width surpassed 4000 m, there was a significant increase in the area of ecological sources. This study determined that 4000 m was the ideal corridor width in order to guarantee a suitable corridor width, a logical layout, and the maintenance of ecosystem stability. Ecological points were then retrieved using this width [48]. The ecological barrier point selection has a detection radius of 1000 m.
This study identified 65 ecological pinch points and 67 barrier points. The ecological pinch points, primarily concentrated in the central plain region, serve to link eastern and western ecological sources. In contrast, ecological barrier points, which are primarily located in the western hilly areas, disrupt connectivity between ecological sources due to intensive human activities in these regions.

3.2.5. ESP of Liaoning

Based on the above analysis, the ESP of Liaoning Province is constructed. There are 179 ecological sources, covering 13 core ecological sources, 14 important ecological sources, and 152 general ecological sources, which are important areas with ecological functions. Ecological sources are mainly distributed in the eastern and western regions of Liaoning Province. The eastern part of Liaoning Province is characterized by the remnants of Changbai Mountain, while the western part is dominated by Nuruerhu Mountain, featuring a high proportion of mountains and hills and rich forest resources. The core and important ecological sources are mainly in Fushun, Benxi, Dandong, and Anshan Cities. Fushun and Benxi are situated in the hilly regions of Liaodong, featuring extensive forest coverage, which creates an ideal living environment for various organisms.
Ecological corridors comprise 435 corridors, including 106 important corridors and 329 general corridors, which are linear structures connecting ecological sources. In urban areas, ecological corridors serve as vital links that connect fragmented ecological resources, contributing significantly to the maintenance or restoration of ecosystem integrity. These corridors not only support species migration and genetic exchange but also play a critical role in strengthening urban resilience. In Liaoning Province, the ecological corridors are distributed in a network-like pattern. Key corridors in Liaoning Province are primarily distributed across its central-western part, which, due to its ecological vulnerability and critical role as a necessary species exchange route between Northeast China and North China, requires enhanced artificial interventions and focused protection measures. The general ecological corridors, primarily located in the eastern, western, and central-eastern parts of the study area, can serve as secondary protection routes. Given that this region possesses a stronger natural ecological foundation and experiences relatively lower ecological stress, the focus should be on preserving the existing corridors by leveraging their favorable natural conditions.
This study identifies 65 ecological pinch points, primarily located in key corridors that play a crucial role in species migration and genetic exchange. Safeguarding and restoring these pinch points are crucial for preserving ecological connectivity. Additionally, there are 67 ecological barrier points, mostly distributed in the northwestern area. Recognizing and eliminating these barrier points can enhance ecosystem connectivity and strengthen overall ecosystem function (Figure 11).

4. Discussion

4.1. The Rationality of Constructing ESP

The ESP can improve environmental issues while preserving the integrity of ecosystem functions and processes. Also, it provides a vital reference for formulating planning strategies that take into account the current state of ES [55]. By optimizing this pattern, the negative impacts of environmental degradation can be reduced by preventing and mitigating ecological risks [56]. Determining the most suitable scale for ESP construction is currently a popular research focus, with investigations spanning various spatial levels. These range from large-scale areas, such as urban agglomerations [7], provinces [57], and cities [58], to smaller regions, like nature reserves [59]. With the vigorous promotion of concepts and policies related to urban agglomerations and regional integration in China, research on large-scale ESP has gradually emerged [60]. Studying individual cities or counties may overlook the material flow information between cities, whereas establishing a comprehensive ESP that connects multiple urban agglomerations within a province or city group can ensure the integrity of ecosystems [61]. To explore the ESP construction in Liaoning Province, Zhang focused on highlighting the role of factors such as species diversity and ecological structural complexity in shaping ecological resilience. The MCR model was employed to establish ecological corridors, and MSPA was utilized to assess landscape ecological risk, thereby identifying ecological sources [62]. Because ecological systems are inherently complex, identifying ecological sources—despite their crucial role in maintaining ecosystem integrity—continues to present methodological challenges in current studies [22]. This research introduces the OWA method for determining ecological sources through ES trade-offs and consideration of varying degrees of preference for different ESs, with the objective of making ecological source determination more scientific [63,64]. This method ensures a more meticulous and equitable consideration when selecting ecological sources by avoiding situations where high levels of one ES weaken the levels of other ESs. We determined ecological sources by analyzing ES trade-offs and constructed ESP. This method ensures that various ESs within the identified ecological sources are balanced, thus demonstrating the scientific and rational nature of the new approach.

4.2. Policy Implications

Water yield demonstrates an increasing trend, primarily driven by regional precipitation, vegetation cover, and human activities, necessitating targeted management measures to ensure sustainable water resource utilization. In 2015, compared to 2010, the soil conservation capacity in Liaoning Province decreased, mainly due to excessive agricultural development, accelerated urbanization, and irrational land use, resulting in issues such as increased soil erosion and vegetation destruction. By 2020, however, the amount of soil conservation has increased compared to 2015, which is closely related to the new round of farmland reforestation projects implemented in Liaoning Province. This project has enhanced the service function of the ecosystem by restoring vegetation and improving soil structure. By 2020, the area under this project had expanded to 27,120 ha, playing a positive role in soil conservation. In 2015, compared to 2010, carbon storage in Liaoning Province increased, which is strongly associated with the 6667 ha of farmland returned to the forest project initiated in 2015 [60]. However, carbon storage declined in 2020 compared to 2015, which was attributed to the influence of land use change [65]. The decreasing trend in habitat quality can be attributed to the negative impacts of human actions. Liaoning Province has achieved some success in ecological protection but still faces many challenges. It is necessary to enhance the enforcement of protective measures, refine land utilization practices, and boost ecosystem service capacities to support sustainable development within the area.

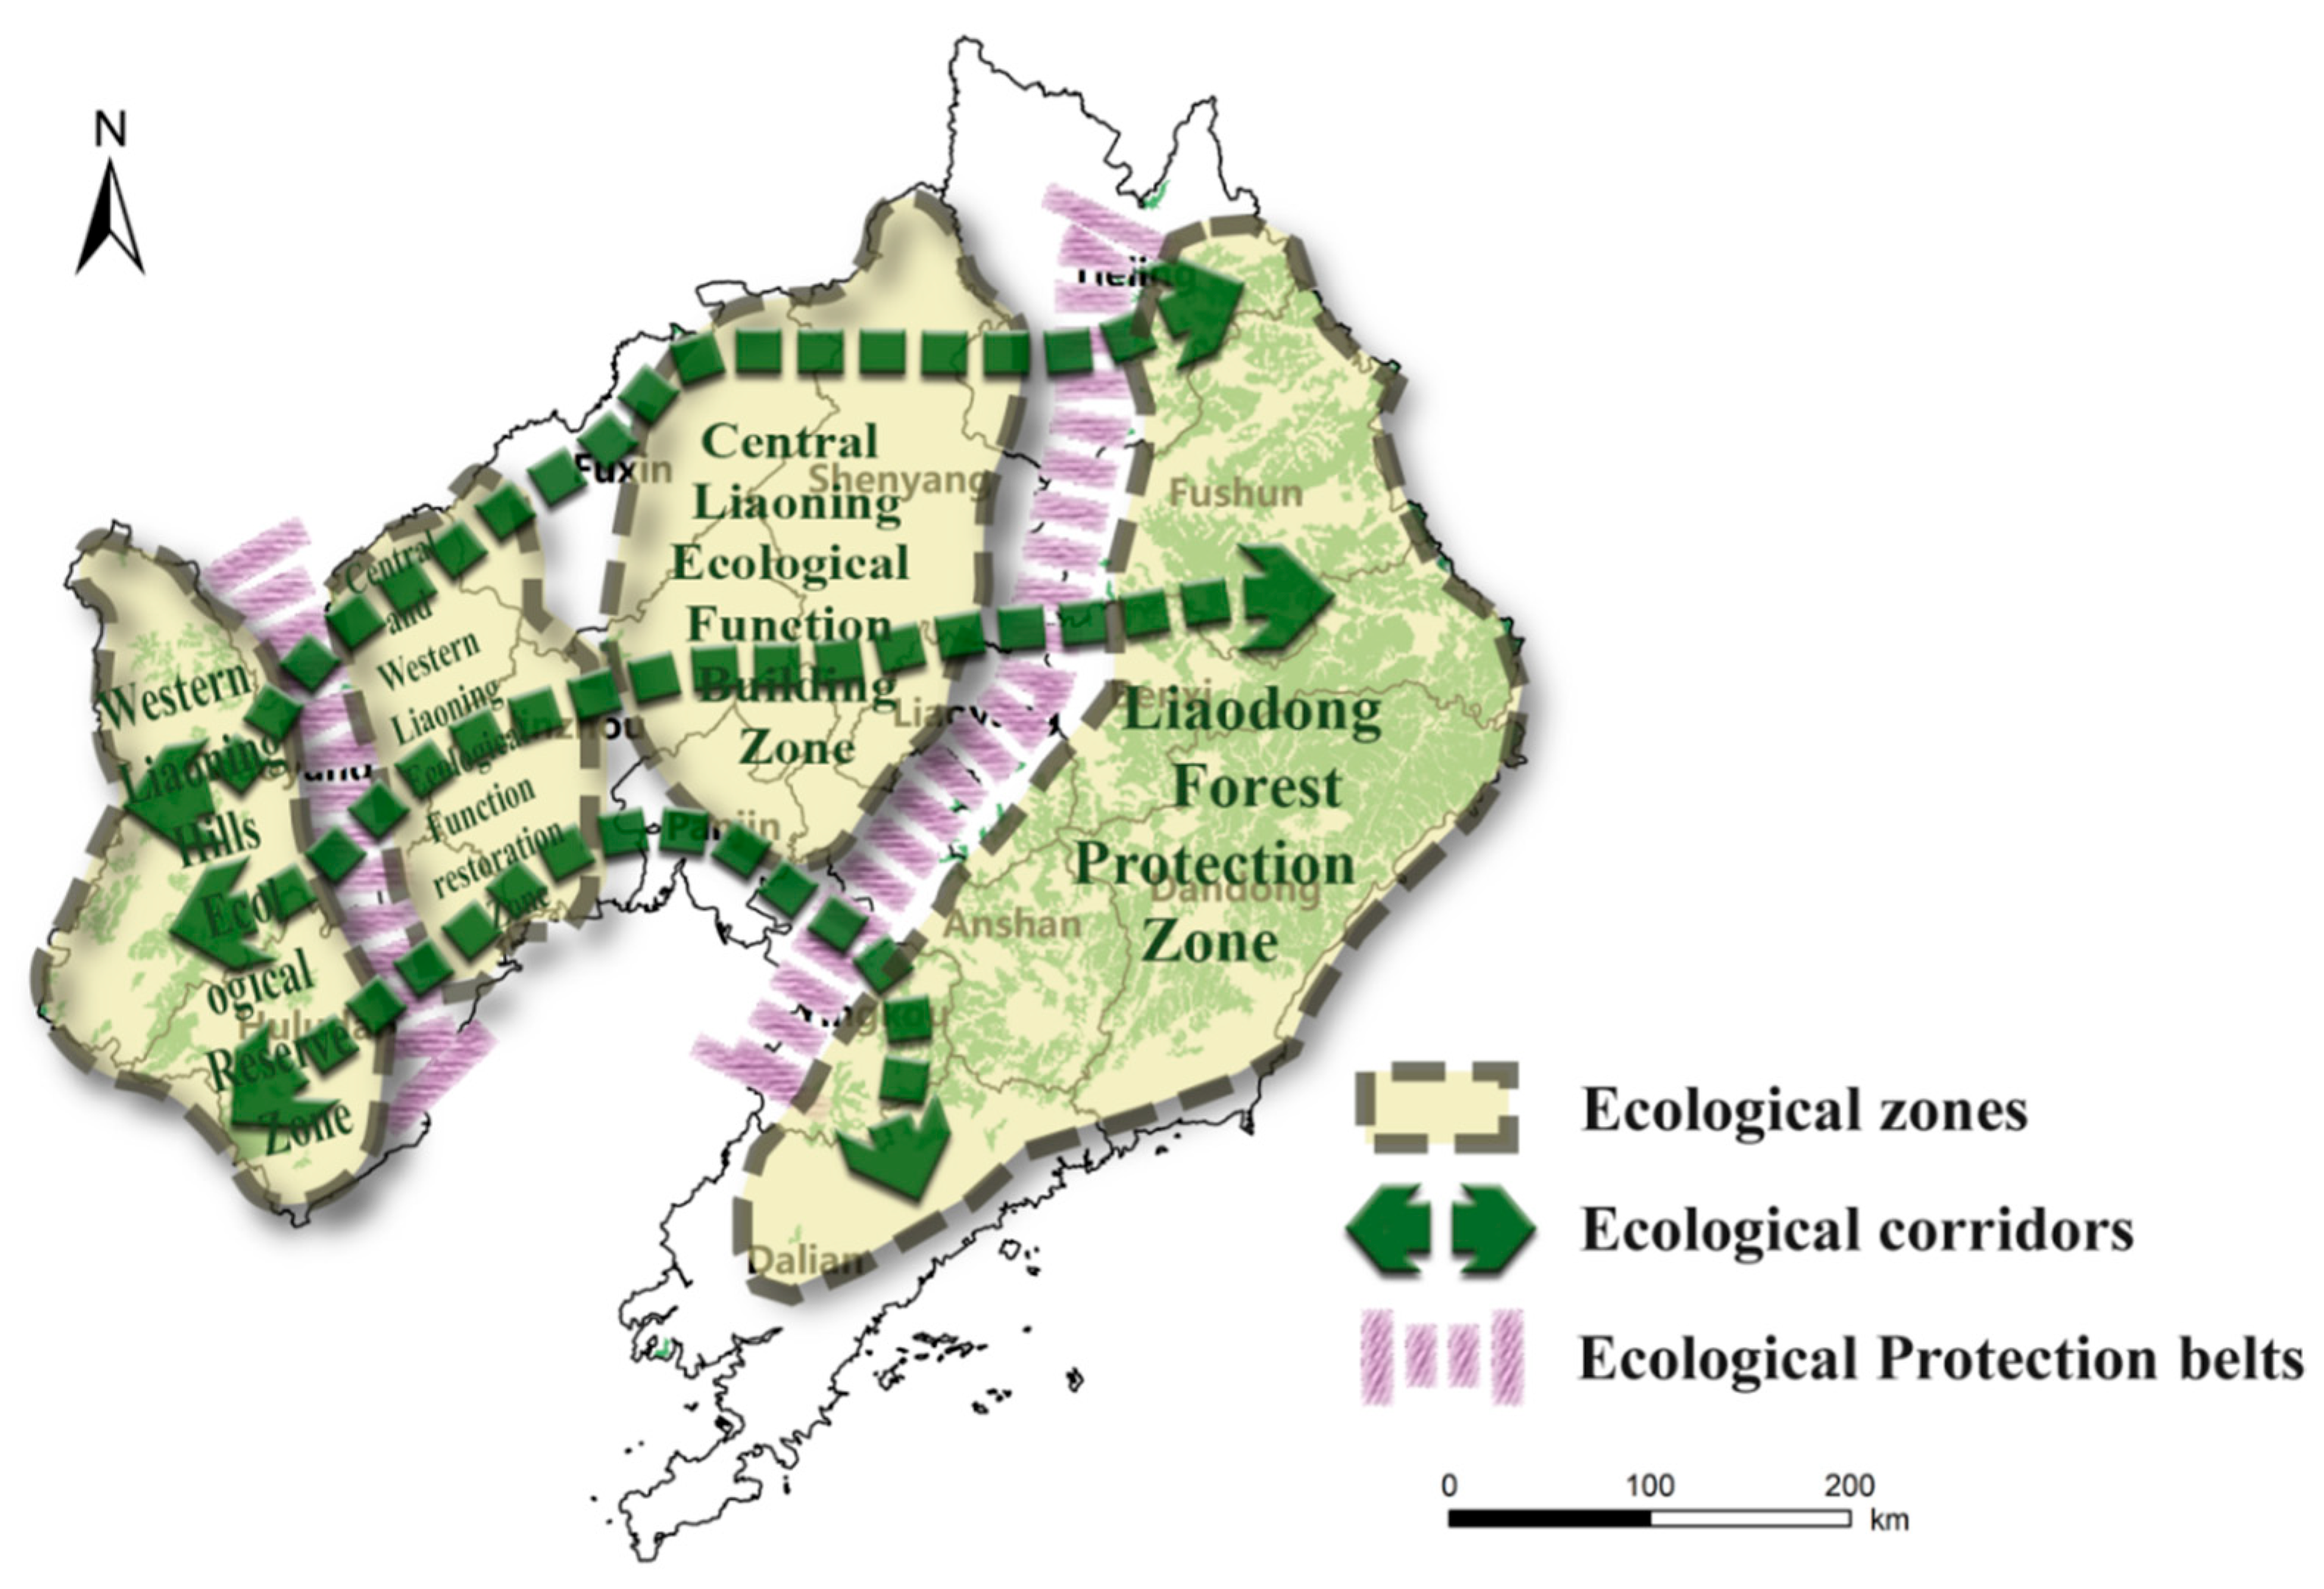
4.3. Constructing the Ecological Protection and Restoration Pattern of “Four Zones, Three Corridors and Two Belts”

We propose an ecological protection and restoration pattern, known as the “four zones, three corridors, and two belts” approach, based on the ESP (Figure 12). This approach is grounded in the synergistic principle of “pattern–process–function” in landscape ecology. According to the different ecological functions, the “four zones” are the Eastern Forest Protection Zone, the Central Liaoning Ecological Function Building Zone, the Central and Western Liaoning Ecological Function Restoration Zone, and the Western Hills Ecological Reserve Zone. To safeguard the Eastern Forest Protection Zone and the Western Hills Ecological Reserve Zone, where ecological sources are concentrated, the Liaodong Forest Protection Belt and the Liaoxi Hilly Protection Belt have been established as peripheral ecological barriers. Connecting “four zones” and “two belts”, integrating key and general ecological corridors to build “three corridors”, namely the North Margin Corridor, the Middle Line Corridor, and the Bohai Bay Corridor.
“Four zones”: The Eastern Forest Protection Zone features densely concentrated core and important ecological sources, with ecological corridors that are extensively dispersed throughout the region. This area plays a crucial role in ecological environmental protection, featuring abundant forest resources and significant biodiversity. For industrial and mining land, as well as industrial parks, it is essential to implement strict zoning-based control over the risks of geological disasters and soil-water pollution. Simultaneously, efforts should be made to advance the green transformation of industries while prioritizing the conservation of forest carbon sink functions and biodiversity in order to sustain regional ecological balance. The distribution of key ecological corridors and barrier points is rather dense, and the Central Liaoning Ecological Function Building Zone has comparatively few ecological sources. Given the current situation of intensive urbanized chemical and mining activities, priority should be given to promoting the construction of ecological isolation in mining urban areas, ecological restoration of abandoned industrial and mining lands, and releasing land through urban renewal to supplement small ecological spaces. At the same time, a regional joint planning and ecological compensation mechanism should be established and improved. Key corridors and pinch points are heavily concentrated in the Central and Western Liaoning Ecological Function Restoration Zone. The migration and flow of species are greatly aided by the delicate ecological conditions in this region. Given the current situation of industrial land expansion and urban sprawl, it is essential to focus on the protection of ecological pinch points. A strategy combining enclosure protection and artificial restoration should be adopted. By enhancing water conservation capacity to increase vegetation coverage, the regional ecological environment can be improved. In the Western Hills Ecological Reserve Zone, ecological sources are sparsely dispersed, with numerous ecological corridors and obstacles between them. As a result, the ecological functions hold significant importance, while the ecological environment remains relatively fragile. In response to the ecological threats posed by coastal urban belts, large-scale industrial zones, agricultural development zones, and areas of mining and tailings accumulation, comprehensive measures such as terrain reshaping, enhancement of water source conservation, and optimization of land use should be adopted to effectively reduce soil erosion and land fragmentation, increase vegetation coverage, restore species diversity, and thereby enhance the stability of the ecosystem. At the same time, it is essential to scientifically demarcate and strictly adhere to the ecological red lines of the coastal zones to ensure regional ecological security.
“Three corridors”: From the west, the North Margin Corridor is a key ecological corridor and ecological pinch points, passing through Nurul Tiger and Daheishan Nature Reserve. To the east are the general ecological corridors and ecological barrier points, connecting the Badger Cave, Lotus Lake, and Qilin Lake Wetland Park. This corridor connects regional ecological sources, maintains biodiversity and species gene exchange, considers the functions of windbreaks and water conservation, and promotes cross-city coordinated development. The western part of the Middle Line Corridor primarily consists of key ecological corridors and pinch points, following the natural landscape pattern centered around the Daling River. The eastern section consists of general ecological corridors and barrier points, featuring a dense population and intensive human activities, both of which impose adverse impacts on ecological security. The corridor should regulate urban expansion and industrial-agricultural development, prioritize the protection of wetlands in the Liaohe, Daling, and Hunhe rivers, and strengthen ecological connectivity. The Bohai Bay Corridor, extending from west to east, serves as a key ecological corridor and ecological pinch point. It traverses the eastern and western protected areas within the Bohai Bay region of southern Liaoning Province. The coastal wetlands of this corridor are densely distributed. The corridor should focus on promoting wetland protection, migratory bird migration, and coastal zone restoration functions, establish migratory bird protection areas, strengthen wetland protection, and prohibit industrial pollution emissions and man-made damage.
“Two belts”: The Liaodong Forest Protection Belt establishes an ecological barrier at the junction of the Eastern Forest Protection Zone and the Central Liaoning Ecological Function Building Zone so as to prevent the urbanization development of Shenyang metropolitan area from affecting the service function of the eastern forest ecosystem and promote the restoration and cultivation of forest vegetation. The Liaoxi Hilly Protection Belt establishes an ecological barrier at the junction of the Western Hills Ecological Reserve Zone and the Central and Western Liaoning Ecological Function Restoration Zone, aiming to mitigate soil erosion and enhance ecosystem resilience.

4.4. Limitations and Perspectives

When assessing ecosystem service indicators, the existing system needs to be further improved. Present studies primarily concentrate on supporting, regulating, and provisioning services. Considering the swift pace of urbanization, cultural ecosystem functions, including leisure and recreation services, are growing increasingly significant and must be integrated into the evaluation framework to capture the diverse values of ecosystems more fully. In the future, a three-year ecological security pattern can be constructed and directly linked to the trends revealed in the ecosystem service assessment and spatial distribution data, thereby enhancing its research value and relevance. With the ongoing advancement of science and technology, the potential application of machine learning and other methodologies could be explored in the future to comprehensively investigate the integration of various ecosystem services into the new urbanization process. This would consequently provide robust scientific guidance for achieving a balance between ecological preservation and urban development. Meanwhile, to enhance the accuracy and comprehensiveness of the assessment, dual or multiple evaluations can be combined with various methods, such as ecological sensitivity evaluation, in the future so as to select and protect ecological source sites more accurately and promote the sustainable development of ecosystems.

5. Conclusions

By constructing an ESP, it is possible to effectively address the potential conflict between environmental conservation and economic growth. In contrast to prior research, ecological sources were identified using the OWA method. Through the integration of natural and social factors, ecological resistance surfaces were developed. Subsequently, ecological corridors were identified by applying circuit theory, leading to the establishment of the ESP for Liaoning Province. The conclusions are as follows:
(1)
Temporal and spatial differences were significant for the four ESs. In 2010, 2015, and 2020, water yield showed an increasing trend. Carbon storage increased and then decreased, soil conservation decreased and then increased, and habitat quality decreased. Spatially, the distribution of these four ESs shows a consistent pattern, with high-value areas primarily concentrated in the eastern and western woodlands.
(2)
The ESP of Liaoning Province is primarily composed of 179 ecological sources, 435 ecological corridors, 65 ecological pinch points, 67 barrier points, and resistance surfaces categorized into 5 levels. The ecological corridors within Liaoning Province are distributed in a network configuration. Ecological pinch points are primarily located along key corridors, while ecological barrier points are concentrated primarily in the northwestern part.
(3)
Based on the ESP, an ecological protection and restoration pattern featuring “four zones, three corridors and two belts” has been established.
This study has refined the methodology for constructing ESPs and provided novel perspectives on the development of provincial ecological protection frameworks.

Supplementary Materials

The following supporting information can be downloaded at: https://www.mdpi.com/article/10.3390/land14061257/s1, Table S1: Habitat suitability and sensitivity tables for different land use types; Table S2: Habit at threat factors and threat degree; Table S3: Carbon density of different types of land use in Liaoning Province.

Author Contributions

Conceptualization: B.W. and H.G.; data curation: Y.Z.; funding acquisition: H.G.; software: B.W. and Y.Z.; methodology: Z.B.; writing—original draft: B.W.; writing—review and editing: H.G., Z.B. and B.W. All authors have read and agreed to the published version of the manuscript.

Funding

This research was funded by the Ministry of Education Humanities and Social Sciences General Research Project (grant number: 23A10157004), Liaoning Provincial Department of Education, Social Science Project, Study on the Decoupling Relationship Between Land Use Efficiency and Carbon Emission and its Realization Path in Three Eastern Provinces in the Context of New Urbanization (grant number: JYTQN2024019), Liaoning Provincial Department of Science and Technology, Qingyuan County Ground Power Enhancement Science and Technology Mission, Liaoning Province (grant number: 2024JH5/10400158), Propaganda Department of Liaoning Provincial Committee of the Communist Paty of China, “Xingliao Talent Program” “Cultural Masters” and “Four Batch” Talents (grant number: XLYC2210046).

Data Availability Statement

Dataset available on request from the authors.

Conflicts of Interest

The authors declare that they have no conflicts of interest.

Appendix A

Table A1. Average value of ESs assessment.
YearWater Yield (mm)Soil Conservation
(t/ha·a)
Carbon Storage
(t/ha)
Habitat Quality
2010119.4144.9711.590.61
2015214.7320.7811.610.60
2020384.7233.2811.540.54

References

  1. Costanza, R.; De Groot, R.; Braat, L.; Kubiszewski, I.; Fioramonti, L.; Sutton, P.; Farber, S.; Grasso, M. Twenty years of ecosystem services: How far have we come and how far do we still need to go? Ecosyst. Serv. 2017, 28, 1–16. [Google Scholar] [CrossRef]
  2. Qian, W.; Zhao, Y.; Li, X. Construction of ecological security pattern in coastal urban areas: A case study in Qingdao, China. Ecol. Ind. 2023, 154, 110754. [Google Scholar] [CrossRef]
  3. Trisos, C.H.; Merow, C.; Pigot, A.L. The projected timing of abrupt ecological disruption from climate change. Nature 2020, 580, 496–501. [Google Scholar] [CrossRef]
  4. Wang, R.; Voogt, J.; Ren, C.; Ng, E. Spatial-temporal variations of surface urban heat island: An application of local climate zone into large Chinese cities. Build. Environ. 2022, 222, 109378. [Google Scholar] [CrossRef]
  5. Guo, M.; Ma, S.; Wang, L.; Lin, C. Impacts of future climate change and different management scenarios on water-related ecosystem services: A case study in the Jianghuai ecological economic Zone, China. Ecol. Ind. 2021, 127, 107732. [Google Scholar] [CrossRef]
  6. IPBES. Global Assessment Report on Biodiversity and Ecosystem Services of the Intergovernmental Science-Policy Platform on Biodiversity and Ecosystem Services; Brondízio, E.S., Settele, J., Díaz, S., Ngo, H.T., Eds.; IPBES Secretariat: Bonn, Germany, 2019; 1148p. [Google Scholar]
  7. Jia, Q.; Jiao, L.; Lian, X.; Wang, W. Linking supply-demand balance of ecosystem services to identify ecological security patterns in urban agglomerations. Sustain. Cities Soc. 2023, 92, 104497. [Google Scholar] [CrossRef]
  8. Huang, J.; Hu, Y.; Zheng, F. Research on recognition and protection of ecological security patterns based on circuit theory: A case study of Jinan City. Environ. Sci. Pollut. Res. 2020, 27, 12414–12427. [Google Scholar] [CrossRef]
  9. Tong, H.-L.; Shi, P.-J. Using ecosystem service supply and ecosystem sensitivity toidentify landscape ecology security patterns in the Lanzhou-Xining urban agglomeration, China. J. Mt. Sci. 2020, 17, 2758–2773. [Google Scholar] [CrossRef]
  10. Van Tulder, R.; Rodrigues, S.B.; Mirza, H.; Sexsmith, K. The UN’s Sustainable Development Goals: Can multinational enterprises lead the Decade of Action? J. Int. Bus. Policy 2021, 4, 1–21. [Google Scholar] [CrossRef]
  11. Cui, X.; Deng, W.; Yang, J.; Huang, W.; de Vries, W.T. Construction and optimization of ecological security patterns based on social equity perspective: A case study in Wuhan, China. Ecol. Ind. 2022, 136, 108714. [Google Scholar] [CrossRef]
  12. Fu, B.; Liang, D.; Lu, N. Landscape ecology: Coupling of pattern, process, and scale. Chin. Geogr. Sci. 2011, 21, 385–391. [Google Scholar] [CrossRef]
  13. Cui, W.; Liu, J.; Jia, J.; Wang, P. Terrestrial ecological restoration in China: Identifying advances and gaps. Environ. Sci. Eur. 2021, 33, 123. [Google Scholar] [CrossRef]
  14. Zhang, Y.; Zhao, Z.; Fu, B.; Ma, R.; Yang, Y.; Lü, Y.; Wu, X. Identifying ecological security patterns based on the supply, demand and sensitivity of ecosystem service: A case study in the Yellow River Basin, China. J. Environ. Manag. 2022, 315, 115158. [Google Scholar] [CrossRef]
  15. Caro, C.; Marques, J.C.; Cunha, P.P.; Teixeira, Z. Ecosystem services as a resilience descriptor in habitat risk assessment using the InVEST model. Ecol. Ind. 2020, 115, 106426. [Google Scholar] [CrossRef]
  16. Zhang, P.; Dang, G. Construction of Ecological Security Pattern of Tao River Basin Based on MCR Model and ant Colony Algorithm. Ecol. Environ. 2023, 32, 481. [Google Scholar] [CrossRef]
  17. Fu, Y.; Shi, X.; He, J.; Yuan, Y.; Qu, L. Identification and optimization strategy of county ecological security pattern: A case study in the Loess Plateau. China Ecol. Ind. 2020, 112, 106030. [Google Scholar] [CrossRef]
  18. Zhang, Y.H.; Li, Y.L.; Jia, H.F. Evaluation of Landscape Ecological Security Pattern in Mentougou District of Yongding River Basin. Arid Land Geogr. 2013, 36, 1049–1057. [Google Scholar] [CrossRef]
  19. Wang, S.; Wu, M.; Hu, M.; Xia, B. Integrating ecosystem services and landscape connectivity into the optimization of ecological security pattern: A case study of the Pearl River Delta, China. Environ. Sci. Pollut. Res. 2022, 29, 76051–76065. [Google Scholar] [CrossRef]
  20. Jin, X.; Wei, L.; Wang, Y.; Lu, Y. Construction of ecological security pattern based on the importance of ecosystem service functions and ecological sensitivity assessment: A case study in Fengxian County of Jiangsu Province, China. Environ. Dev. Sustain. 2021, 23, 563–590. [Google Scholar] [CrossRef]
  21. Pan, J.; Liang, J.; Zhao, C. Identification and optimization of ecological security pattern in the arid inland basin based on ordered weighted average and ant colony algorithm: A case study of Shule River basin, NW China. Ecol. Ind. 2023, 154, 110588. [Google Scholar] [CrossRef]
  22. Guo, M.; Cong, X.; Zheng, H.; Zhang, M.J.; Wang, L.J.; Gong, J.W.; Ma, S. Integrating the ordered weighted averaging method to establish an ecological security pattern for the jianghuai ecological economic zone in China: Synergistic intraregional development. Ecol. Ind. 2022, 135, 108543. [Google Scholar] [CrossRef]
  23. Sun, D.; Wu, X.; Wen, H.; Ma, X.; Zhang, F.; Ji, Q.; Zhang, J. Ecological security pattern based on XGBoost-MCR model: A case study of the three gorges reservoir region. J. Clean. Prod. 2024, 470, 143252. [Google Scholar] [CrossRef]
  24. Li, Q.; Zhou, Y.; Yi, S. An integrated approach to constructing ecological security patterns and identifying ecological restoration and protection areas: A case study of Jingmen, China. Ecol. Ind. 2022, 137, 108723. [Google Scholar] [CrossRef]
  25. Mao, C.R.; Dai, L.M.; Qi, L.; Wang, Y.; Zhou, W.M.; Zhou, L.; Yu, D.P.; Zhao, F.Q. Constructing ecological security pattern based on ecosystem services: A case study in Liaohe River Basin, Liaoning Province, China. Acta Ecol. Sin. 2020, 40, 6486–6494. [Google Scholar]
  26. Jiang, H.; Peng, J.; Dong, J.; Zhang, Z.; Xu, Z.; Meersmans, J. Linking ecological background and demand to identify ecological security patterns across the Guangdong-Hong Kong-Macao Greater Bay Area in China. Landsc. Ecol. 2021, 36, 2135–2150. [Google Scholar] [CrossRef]
  27. Yu, K.J. Security patterns and surface model in landscape ecological planning. Landsc. Urban Plan. 1996, 36, 1–17. [Google Scholar] [CrossRef]
  28. Zhang, W.; Gong, X.; Han, G.; Zhao, Y. An improved ant colony algorithm for path planning in one scenic area with many spots. IEEE Access 2017, 5, 13260–13269. [Google Scholar] [CrossRef]
  29. Ford, A.T.; Sunter, E.J.; Fauvelle, C.; Bradshaw, J.L.; Ford, B.; Hutchen, J.; Phillipow, N.; Teichman, K.J. Effective corridor width: Linking the spatial ecology of wildlife with land use policy. Eur. J. Wildl. Res. 2020, 66, 69. [Google Scholar] [CrossRef]
  30. Luo, K.; Wang, H.; Yan, X.; Yi, S.; Wang, C.; Lei, C. Integrating CVOR and circuit theory models to construct and reconstruct ecological networks: A case study from the Tacheng-Emin Basin, China. Ecol. Ind. 2024, 165, 112170. [Google Scholar] [CrossRef]
  31. Griffin, T.; Conrad, Z.; Peters, C.; Ridberg, R.; Tyler, E.P. Regional self-reliance of the Northeast food system. Renew. Agric. Food Syst. 2015, 30, 349–363. [Google Scholar] [CrossRef]
  32. Gan, G.; Liu, Y.; Sun, G. Understanding interactions among climate, water, and vegetation with the Budyko framework. Earth-Sci. Rev. 2021, 212, 103451. [Google Scholar] [CrossRef]
  33. Zhang, L.; Hickel, K.; Dawes, W.R.; Chiew, F.H.S.; Western, A.W.; Briggs, P.R. A rational function approach for estimating mean annual evapotranspiration. Water Resour. Res. 2004, 40, W02502. [Google Scholar] [CrossRef]
  34. Lindenmayer, D.; Hobbs, R.; Montague-Drake, R.; Alexandra, J.; Bennett, A.; Burgman, M.; Cae, P.; Calhoun, A.; Cramer, V.; Cullen, P. A checklist for ecological management of landscapes for conservation. Ecol. Lett. 2008, 11, 78–91. [Google Scholar] [CrossRef]
  35. Berta Aneseyee, A.; Noszczyk, T.; Soromessa, T.; Elias, E. The InVEST habitat quality model associated with land use/cover changes: A qualitative case study of the Winike Watershed in the Omo-Gibe Basin, Southwest Ethiopia. Remote Sens. 2020, 12, 1103. [Google Scholar] [CrossRef]
  36. Yang, Z.P.; Xu, J.W.; Feng, X.H.; Guo, M.; Jin, Y.H.; Gao, X.J. Research on the Impact of Land Use Change on Habitats in Northeast China Based on the InVEST Model. Ecol. Sci. 2018, 37, 139–147. [Google Scholar] [CrossRef]
  37. Qiao, X.; Li, Z.; Lin, J.; Wang, H.; Zheng, S.; Yang, S. Assessing current and future soil erosion under changing land use based on InVEST and FLUS models in the Yihe River Basin, North China. Int. Soil Water Conserv. Res. 2024, 12, 298–312. [Google Scholar] [CrossRef]
  38. Merritt, W.S.; Letcher, R.A.; Jakeman, A.J. A review of erosion and sediment transport models. Environ. Model. Softw. 2003, 18, 761–799. [Google Scholar] [CrossRef]
  39. Ke, X.; Tang, L. Impact of cascading processes of urban expansion and cropland reclamation on the ecosystem of a carbon storage service in Hubei Province, China. Acta Ecol. Sin. 2019, 39, 672–683. [Google Scholar] [CrossRef]
  40. Gu, H.; Li, J.; Wang, S. Multi-Scenario Simulation of Land Use/Cover Change and Terrestrial Ecosystem Carbon Reserve Response in Liaoning Province, China. Sustainability 2024, 16, 8244. [Google Scholar] [CrossRef]
  41. Zhao, H.Q.; Liu, G.; Yang, Z.; Liu, X.Q.; Miao, Q.F.; Fu, H.C. Evaluation and Multi-scenario Prediction of Ecosystem Services in Liaoning Province from 2000 to 2020. Environ. Sci. 2024, 45, 4137–4151. [Google Scholar] [CrossRef]
  42. Yager, R.R. Quantifier guided aggregation using OWA operators. Int. J. Intell. Syst. 1996, 11, 49–73. [Google Scholar] [CrossRef]
  43. Ma, S.; Wang, L.-J.; Zhu, D.; Zhang, J. Spatiotemporal changes in ecosystem services in the conservation priorities of the southern hill and mountain belt, China. Ecol. Ind. 2021, 122, 107225. [Google Scholar] [CrossRef]
  44. Zhao, W.Z.; Han, Z.L.; Yan, X.L.; Zhong, J.Q. Construction of Ecological Security Patterns Based on Multi-scenario Trade-offs of Ecosystem Services: A Case Study of Wafangdian in Dalian City. J. Nat. Resour. 2020, 35, 546–562. [Google Scholar] [CrossRef]
  45. Gou, R.; Su, W.C.; Quan, X.Y.; Huang, X.F. Identification of ecological security pattern in FAST Quiet Zone based on Ordered Weighted Averaging and circuit theory. Acta Ecol. Sin. 2024, 44, 9636–9651. [Google Scholar] [CrossRef]
  46. Zhao, C.C. Identification and Optimization of Ecological Security Patterns in the Shule River Basin Based on OWA and Ant Colony lgorithm. Master’s Thesis, Northwest Normal University, Lanzhou, China, 2022. [Google Scholar] [CrossRef]
  47. Minor, E.S.; Urban, D.L. A graph-theory framework for evaluating landscape connectivity and conservation planning. Conserv. Biol. 2008, 22, 297–307. [Google Scholar] [CrossRef] [PubMed]
  48. Wang, B.; Fu, S.; Hao, Z.; Zhen, Z. Ecological security pattern based on remote sensing ecological index and circuit theory in the Shanxi section of the Yellow River Basin. Ecol. Ind. 2024, 166, 112382. [Google Scholar] [CrossRef]
  49. Liu, X.; Su, Y.; Li, Z.; Zhang, S. Constructing ecological security patterns based on ecosystem services trade-offs and ecological sensitivity: A case study of Shenzhen metropolitan area, China. Ecol. Ind. 2023, 154, 110626. [Google Scholar] [CrossRef]
  50. Peng, J.; Yang, Y.; Liu, Y.; Hu, Y.; Du, Y.; Meersmans, J.; Qiu, S. Linking ecosystem services and circuit theory to identify ecological security patterns. Sci. Total Environ. 2018, 644, 781–790. [Google Scholar] [CrossRef]
  51. McRae, B.H.; Beier, P. Circuit theory predicts gene flow in plant and animal populations. Proc. Natl. Acad. Sci. USA 2007, 104, 19885–19890. [Google Scholar] [CrossRef]
  52. McRae, B.H.; Hall, S.A.; Beier, P.; Theobald, D.M. Where to restore ecological connectivity? Detecting barriers and quantifying restoration benefits. PLoS ONE 2012, 7, e52604. [Google Scholar] [CrossRef]
  53. Leonard, P.B.; Duffy, E.B.; Baldwin, R.F.; McRae, B.H.; Shah, V.B.; Mohapatra, T.K. GFLOW: Software for modeling circuit theory-based connectivity at any scale. Methods Ecol. Evol. 2017, 8, 519–526. [Google Scholar] [CrossRef]
  54. Dong, J.; Peng, J.; Xu, Z.; Liu, Y.; Wang, X.; Li, B. Integrating regional and interregional approaches to identify ecological security patterns. Landsc. Ecol. 2021, 36, 2151–2164. [Google Scholar] [CrossRef]
  55. Wang, Y.; Pan, J. Building ecological security patterns based on ecosystem services value reconstruction in an arid inland basin: A case study in Ganzhou District, NW China. J. Clean. Prod. 2019, 241, 118337. [Google Scholar] [CrossRef]
  56. Gao, F.; Yang, W.; Zhang, S. An integrated approach to constructing ecological security pattern in an urbanization and agricultural intensification area in northeast China. Land 2023, 12, 330. [Google Scholar] [CrossRef]
  57. Jin, L.; Xu, Q.; Yi, J.; Zhong, X. Integrating CVOR-GWLR-Circuit model into construction of ecological security pattern in Yunnan Province, China. Environ. Sci. Pollut. Res. 2022, 29, 81520–81545. [Google Scholar] [CrossRef]
  58. Gu, H.; Huan, C.; Yang, F. Spatiotemporal dynamics of ecological vulnerability and its influencing factors in shenyang city of China: Based on SRP model. Int. J. Environ. Res. Public Health 2023, 20, 1525. [Google Scholar] [CrossRef]
  59. Hu, X.W.; Jia, T.C. Construction and Optimization of the Ecological Security Pattern in Sanjiangyuan National Park Based on Ecological Sensitivity and Landscape Connectivity. Resour. Environ. Yangtze Basin 2023, 32, 1724–1735. [Google Scholar]
  60. Lang, Y.; Sun, Y.; Yin, S.H.; Wei, X. Construction of ecological security pattern: Concept, framework and prospect. Ecol. Environ. Sci. 2022, 31, 845–856. [Google Scholar] [CrossRef]
  61. Wen, H.; Deng, X.P.; Li, Y.; Wang, C.; Wang, L.R.; He, D.J.; You, W.B. Identification and Construction of County-level Ecological Security Patterns Integrating Ecological Spaces: A Case Study of Wuyishan City. Chin. J. Ecol. 2023, 42, 1197. [Google Scholar] [CrossRef]
  62. Zhang, S.; Jiang, H.; Yu, H.; Feng, X.; Fan, M. Construction of landscape ecological network based on MCR risk assessment Model: A case study of Liaoning Province, China. Ecol. Ind. 2024, 166, 112549. [Google Scholar] [CrossRef]
  63. Malczewski, J. Integrating multicriteria analysis and geographic information systems: The ordered weighted averaging (OWA) approach. Int. J. Environ. Technol. Manag. 2006, 6, 7–19. [Google Scholar] [CrossRef]
  64. Fan, Y.; Fang, C. Evolution process and obstacle factors of ecological security in western China, a case study of Qinghai province. Ecol. Ind. 2020, 117, 106659. [Google Scholar] [CrossRef]
  65. Ren, D.; Cao, A. Analysis of the heterogeneity of landscape risk evolution and driving factors based on a combined GeoDa and Geodetector model. Ecol. Ind. 2022, 144, 109568. [Google Scholar] [CrossRef]
Figure 1. Construction of ESP framework.
Land 14 01257 g001
Figure 2. The geographical position of Liaoning Province: (a) The location of Liaoning Province in China. (b) Urban distribution within Liaoning Province. (c) Elevation map of Liaoning Province.
Land 14 01257 g002
Figure 3. Spatial distribution of ESs for 2010, 2015, and 2020.
Land 14 01257 g003
Figure 4. The spatial distribution of ESs across seven scenarios.
Land 14 01257 g004
Figure 5. Identification of non-ecological space, ecological space, and priority protected areas across seven scenarios.
Land 14 01257 g005
Figure 6. Setting of minimum area thresholds for ecological sources.
Land 14 01257 g006
Figure 7. Spatial distribution of core, important, and general ecological sources.
Land 14 01257 g007
Figure 8. Spatial distribution of each resistance factor.
Land 14 01257 g008
Figure 9. Distribution of the ecological resistance surface in space.
Land 14 01257 g009
Figure 10. Spatial distribution of key and general ecological corridors.
Land 14 01257 g010
Figure 11. Construction of an ESP in Liaoning province.
Land 14 01257 g011
Figure 12. Ecological protection and restoration pattern of Liaoning province.
Land 14 01257 g012
Table 1. Data sources.
DataResolutionData Sources
Land use data30 mResource and Environment Science and Data Center
(https://www.resdc.cn/, accessed on 10 January 2025)
DEM30 mGeospatial Data Cloud (https://www.gscloud.cn/, accessed on 10 January 2025)
Meteorological data1000 mNational Earth System Science Data Center (http://www.geodata.cn/, accessed on 10 January 2025)
Soil data1000 mWorld Soil Database (http://www.fao.org, accessed on 10 January 2025)
Soil erosion factor300 mGeographic Data Sharing Infrastructure (www.gis5g.com, accessed on 10 January 2025)
Population data1000 mWorld Pop (https://www.worldpop.org/, accessed on 10 January 2025)
Normalized difference vegetation index (NDVI)1000 mMOD17A3H Data Product (https://www.earthdata.nasa.gov/, accessed on 10 January 2025)
River datashapefileOpen Street Map (https://www.openhistoricalmap.org/, accessed on 10 January 2025)
Table 2. Resistance factors and coefficients.
TypeFactorClassificationResistance CoefficientWeight
Nature factorsLand use typeForest10.2893
Grassland3
Water5
Farmland7
Unused land9
Construction land10
DEM (m)≤10010.1812
100–3003
300–5005
500–7007
≥70010
NDVI≤0.38100.1532
0.38–0.567
0.56–0.745
0.74–0.923
≥0.921
Slope (°)≤210.1263
2–43
4–65
6–87
≥810
Human factorsPopulation density
(person/km2)
≤80010.1667
800–38003
3800–90005
9000–18,8007
≥18,8009
Distance from road (m)≤20010.0833
200–5003
500–7005
700–10007
≥10009
Table 3. The analysis of risk and trade-offs in various scenarios.
ScenariosRisk ω 1 ω 2 ω 3 ω Trade-Off
10.0011.0000.0000.0000.0000.0018
20.10.8710.0620.0390.0280.1721
30.50.5000.2070.1590.1340.6612
410.2500.2500.2500.2501.0000
520.0630.1880.3130.4380.6773
6100.0000.0010.0550.9440.0736
710000.0000.0000.0001.0000.0000
Table 4. Protection efficiency of ESs in different scenarios.
ScenarioProtection EfficiencyAverage Protection
Efficiency
Soil ConservationWater YieldHabitat QualityCarbon Storage
10.311.001.011.120.86
20.350.991.091.320.94
30.390.891.141.540.99
40.400.851.181.560.99
50.450.901.331.731.10
60.491.161.041.631.08
70.511.241.121.351.06
Disclaimer/Publisher’s Note: The statements, opinions and data contained in all publications are solely those of the individual author(s) and contributor(s) and not of MDPI and/or the editor(s). MDPI and/or the editor(s) disclaim responsibility for any injury to people or property resulting from any ideas, methods, instructions or products referred to in the content.

