Next Article in Journal
Climate Change in China and Its Effects on the Sustainable Efficiency of Agricultural Land Use
Previous Article in Journal
Ecological Security Patterns Based on Ecosystem Service Assessment and Circuit Theory: A Case Study of Liaoning Province, China
Previous Article in Special Issue
Low-Altitude, Overcooled Scree Slope: Insights into Temperature Distribution Using High-Resolution Thermal Imagery in the Romanian Carpathians
 
 
Due to scheduled maintenance work on our database systems, there may be short service disruptions on this website between 10:00 and 11:00 CEST on June 14th.
Article

Analyzing Ecological Environmental Quality Trends in Dhaka Through Remote Sensing Based Ecological Index (RSEI)

1
Department of Geography & Environment, Jagannath University, Dhaka 1100, Bangladesh
2
Department of Environmental Science and Disaster Management, Daffodil International University, Dhaka 1216, Bangladesh
3
Institute of Water and Flood Management, Bangladesh University of Engineering and Technology, Dhaka 1000, Bangladesh
4
Department of Disaster Management, Begum Rokeya University, Rangpur 5404, Bangladesh
5
Department of Geography and Environmental Sustainability, College of Humanities and Social Sciences, Princess Nourah bint Abdulrahman University, P.O. Box 84428, Riyadh 11671, Saudi Arabia
6
Department of Geography, Geoinformatics and Regional Development, Faculty of Natural Sciences and Informatics, Constantine the Philosopher University in Nitra, 949 01 Nitra, Slovakia
7
Institute of Landscape Ecology SAS Bratislava, Branch Nitra, 949 01 Nitra, Slovakia
8
Public Works Engineering Department, Faculty of Engineering, Mansoura University, Mansoura 35516, Egypt
*
Authors to whom correspondence should be addressed.
Land 2025, 14(6), 1258; https://doi.org/10.3390/land14061258
Submission received: 22 March 2025 / Revised: 6 June 2025 / Accepted: 10 June 2025 / Published: 11 June 2025
(This article belongs to the Special Issue Integration of Remote Sensing and GIS for Land Use Change Assessment)

Abstract

:
Assessing the ecological environmental quality (EEQ) is crucial for protecting the environment. Dhaka’s rapid, unplanned urbanization, driven by economic and social growth, poses significant eco-environmental challenges. Spatiotemporal ecological and environmental quality changes were assessed using remote sensing based ecological index (RSEI) maps derived from Landsat images (1993, 2003, 2013, and 2023). RSEI was based on four indicators—greenness (NDVI), heat index (LST), dryness (NDBSI), and wetness (LSM). Landsat 5 TM and 8 OLI/TIRS images were processed on Google Earth Engine (GEE), with principal component analysis (PCA) applied to determine RSEI. The findings showed a decline in the overall RSEI (1993–2023), with low- and very low-quality areas increasing by about 39% and high- and very high-quality areas decreasing by 24% of the total area. NDBSI and LST were negatively correlated with RSEI, except in 1993, while NDVI and LSM were generally positive but negative in 1993. The global Moran’s I (0.88–0.93) indicated strong spatial correlation in the distribution of EEQ across Dhaka. LISA cluster maps showed high-high clusters in the northeast and east, while low-low clusters were concentrated in the northwest. This research examines the degradation of ecological conditions over time in Dhaka and provides valuable insights for policymakers to address environmental issues and improve future ecological management.

1. Introduction

The ecological environment refers to all the elements influencing the preservation and evolution of ecosystems [1]. It is closely related to the worth of the surroundings for human welfare and socio-economic viability [2]. Human activities, including civilization, industrialization, and environmental policies, directly impact ecosystems [3,4]. Changes in land cover due to human activities influence habitat distribution as well as biodiversity, ecological processes, and surface temperature, altering ecological settings and functions [5,6]. As a result, many environmental challenges, for example, the loss of ecological functions, land desertification, soil erosion, environmental contamination, and the degradation of biodiversity, have surfaced. These issues have increased the fragility of the environment, which is vital to human life [7].
Urbanization alters environments, intensifying heat island effects and pollution, as well as harming ecosystems and human health. Rapid urbanization promotes economic and social development; however, this growth also leads to numerous environmental issues on both local and global levels [8,9]. Uncontrolled urbanization results in serious problems, including social and ecological degradation, destruction of biodiversity and ecosystems, and health crises [8,10].
Bangladesh’s rapid urbanization, faster than most South Asian countries, has triggered severe ecological impacts in major cities [11,12,13,14]. Based on the night light intensity, Rahman et al. [11] grouped 331 Bangladeshi cities; Dhaka fell into the same category as seven other big cities. The growth of urban areas in Dhaka City has led to habitat destruction and fragmentation, adversely affecting wildlife diversity. The aquatic ecosystem, a crucial element of overall livelihood, is gradually being destroyed due to overexploitation, pollution, and climate change, posing significant threats to human well-being and environmental sustainability [15]. Moreover, pollution in this city severely impacts its fragile ecosystem, leading to extensive ecological degradation [16]. Consequently, analyzing how urban development affects a city’s environmental and thermal environment helps authorities design a more ecologically friendly urban development. Changes in the city’s land use have deteriorated the ecosystem service value and reduced the overall ecosystem service value over the past thirty years [17]. Furthermore, preserving urban ecosystems is vital for maintaining the health of both humans and the natural environment [18]. As a result, studying urban ecology has become a critical necessity in the current context.
Therefore, there is a rising demand for models that can detect spatial and temporal variations in ecological status [19]. Recent developments in satellite-based Earth observation systems can serve as powerful tools for ecosystem management, offering robust indicators of ecosystem conditions from local to global scales [20]. Measuring the reflected radiation from the Earth’s surface allows one to assess ecological conditions at several levels using remote sensing images. This capability enables the detection of various ecosystem components, including soil, vegetation, and open water [21,22,23]. As a result, remote sensing technology is extensively applied in ecosystem research and governance [24,25].
Numerous research articles focus on urban ecology assessment, including the monitoring of built-up and vegetation [26,27], urban heat islands (UHIs) [28,29], water resource management [30], air quality regulation [31], and biodiversity monitoring [32]. These studies underscore the effectiveness of remote sensing methods in urban ecology monitoring [33,34], employing various indices such as NDVI [35], LST [36], BI [37], EVI [38], NDBI [39], SAVI [40], and MNDWI [41]. However, Xu [42] introduced the remote sensing based ecological index (RSEI) to observe and evaluate regional ecological conditions. This index can enable quick identification and evaluation of regional environmental conditions over time [43]. These studies have found four main factors of the ecological environment: greenness, heat index, dryness, and wetness. Studies have given critical new perspectives on environmental changes and weaknesses in many areas, including Tianjin City [44], Samara [45], Xiong’an New Area [25], Fuzhou City [46], Manas Lake wetland area [47], and the coastal regions of southeastern China [19], as well as other cities in China [48]. These studies have also emphasized the impact of socioeconomic and human activities on the ecological environment and the potential of plant restoration to improve ecological conditions [48].
However, according to the authors’ literature review, there are no significant studies utilizing the RSEI approach to evaluate the ecological conditions in Dhaka, Bangladesh, though there is a substantial threat to the ecology in this area. This research is unique because it focuses on filling a specific gap in the existing studies. The main objective of this study is to utilize RSEI methodologies to assess the ecological environment in Dhaka city. Four parameters, namely greenness (NDVI), heat index (LST), wetness (LSM), and dryness (NDBSI), were utilized to calculate the RSEI for the Dhaka metropolitan area. This research uses satellite imagery to analyze alterations in the ecological environment over the past three decades. It aims to evaluate the impact of rapid urbanization on urban ecology and propose solutions to address environmental vulnerability in the capital city of Bangladesh.

Study Area

Dhaka, the capital of Bangladesh, functions as the center for the nation’s political, economic, and cultural activities. It is the largest city in the country and ranks as the 11th largest megacity globally. It is located on the northern bank of the Buriganga River, inside the Ganges delta, and is bordered by other rivers [49]. The Buriganga River borders it to the south, and the Turag and Balu Rivers border it to the north and northeast. Tongi and Baru mark the northeastern boundary. Dhaka’s elevation varies from approximately 0 to 23 m above sea level, with an average altitude of 7 m. The city receives approximately 1854 mm of average annual rainfall, with 80% of this precipitation occurring between May and September [50]. The Dhaka metropolitan area has a population of approximately 22.4 million and a population density exceeding 23,000 people per square kilometer, making it one of the most densely populated regions globally [51]. Dhaka has developed substantially in recent years, establishing itself as the fastest-growing major city [52]. Recent urbanization and development have made Dhaka City’s ecology vulnerable. Infrastructure growth, wetland infill, deforestation, and pollution from poor waste management have significantly threatened its ecological balance (Figure 1).

2. Materials and Methods

Initially, the image datasets were cleaned up for clouds (less than 1%), cloud shadows, and snow/ice pixels to ensure completeness and reliability for subsequent analysis. Data have been produced from the Landsat 5 TM. Landsat 8 OLI top-of-atmosphere sensors (LANDSAT/LT05/C02/T1 and LANDSAT/LC08/C02/T1) were used to compute various indices, including greenness (NDVI), wetness (LSM), dryness (NDBSI), and heat index (LST) (Figure 2). Subsequently, these data were used to create four 30 m resolution RSEI maps for the years 1993, 2003, 2013, and 2023 using Python 3 in Google Colaboratory. The subsequent phase entailed examining the temporal and geographical variations in the ecological environment quality (EEQ) in Dhaka city by utilizing the four RSEI maps from 1993 to 2023. Afterwards, the spatial correlation of EEQ+ was assessed using the global spatial autocorrelation index, such as Moran’s I, and the Local Indicators of Spatial Association (LISA). The specific information on the datasets can be found in Table 1. The detailed workflow of this research is shown in Figure 3.

2.1. Greenness Index

The normalized difference vegetation index (NDVI) is a crucial metric for assessing vegetation cover, renowned for its effectiveness among various forest indices. NDVI values have been employed to forecast bird diversity, urban tolerance, and specialization in urban environments, hence highlighting its significance in efficiently monitoring biodiversity trends [53]. The calculation of NDVI has been illustrated in Equation (1), highlighting its wide application in measuring forest density and its usefulness in many ecological studies [54,55].
N D V I = N I R R E D N I R + R E D
In the N D V I formula, “NIR” indicates the near-infrared red band, and “RED” refers to the red band of light. The spatiotemporal NDVI images are given in Figure 2.

2.2. Wetness Index

Land surface moisture (LSM) has a substantial impact on ecology since it plays a pivotal role in a range of ecological processes and the evolution of ecosystems [56,57]. Specifically, for Landsat Operational Land Imager (OLI) and Landsat Thematic Mapper (TM) data, the wetness index can be accurately estimated using [58] Equations (2) and (3) [59], respectively. The wetness images are given in Figure 2.
L S M T M = 0.3102 × R e d + 0.2021 × G r e e n + 0.0315 × B l u e + 0.1594 × N I R 0.6806 × S W I R 1 0.6109 × S W I R 2
L S M O L I = 0.3283 × R e d + 0.1972 × G r e e n + 0.1511 × B l u e + 0.3407 × N I R 0.7117 × S W I R 1 0.4559 × S W I R 2

2.3. Dryness

Dryness characterizes regions with minimal vegetation or low soil moisture. Human activities and uncontrolled urbanization have resulted in the substitution of natural land surfaces and forest cover with urban areas and exposed soil, hence exacerbating environmental deterioration [60]. Therefore, this study selected the normalized difference build-up and soil index (NDBSI) in Figure 2, associated with the Index-based Built-up Index (IBI) and Soil Index (SI). The following Equations (4)–(6) measure these indicators [61,62,63]:
N D B S I = ( I B I + S I ) / 2
I B I = 2 S W I R 1 ( S W I R 1 + N I R ) N I R N I R + R e d G r e e n ( G r e e n + S W I R 1 ) 2 S W I R 1 ( S W I R 1 + N I R ) +   N I R ( N I R + R e d ) + G r e e n ( G r e e n + S W I R 1 )  
S I = [ ( S W I R 1 + R e d ) ( N I R + B l u e ) ] / [ ( S W I R 1 + R e d ) + ( N I R + B l u e ) ]
where S W I R 1 ,   N I R ,   R e d ,   G r e e n ,   a n d   B l u e represent the reflectance of each band in the TM and OLI sensors, respectively.

2.4. Heat Index

The land surface temperature (LST) is a key component of the heat index and plays a critical role in the RSEI (Figure 2), acting as a determinant of the temperature of the Earth’s surface [64,65]. It spans numerous fields, involving climate research, agriculture, UHI investigations, water resource management, and eco-environmental studies. Thermal infrared bands from satellite sensors are essential for LST computation [66,67,68,69]. In this study, LST was derived using standard procedures for Landsat 5 TM and Landsat 8 OLI/TIRS, including radiometric calibration, brightness temperature conversion, and emissivity correction. The detailed calculation formulas and processing steps are provided in Supplementary Materials (Sections S1–S7).

2.5. Calculation of RSEI

The RSEI, introduced by Xu [42], serves as an efficient model for monitoring and evaluating ecological conditions, utilizing solely remotely sensed data [19]. It is widely acknowledged for assessing environmental quality and incorporates four critical components: greenness (NDVI), heat index (LST), dryness (NDBSI), and wetness (LSM). These components are extracted from satellite imagery through inversion techniques [70].
Principal component analysis (PCA) is used to combine these four indicators. PCA is used because it can compress multi-dimensional data and identify significant factors by transforming numerous variables in an orthogonal linear manner [71]. The benefit of PCA is its capacity to automatically and empirically decide the weight of each indicator based on the data features and the contribution rate of each index to each principal component [72]. The impact of each indication on the RSEI is determined by its weighting on PC1 [25]. The RSEI is formulated as follows:
R S E I = P C 1 [ f ( L S T , N D B S I , N D V I , L S M ) ]
Before the PCA calculation, all index values were normalized to a 0 to 1 scale to eliminate negative values and ensure comparability across factors. Equation (8) is used for the normalization process, which is given below:
N I i = ( I i I m i n ) / ( I m a x I m i n )
where NIi represents the normalized index value; Ii is the index value for pixel I; Imin is the index’s minimum value; and Imax is this index’s maximum value.
The RSEI values derived from this equation are such that lower values indicate better ecological conditions, while higher values signify poorer conditions [19]. To align with the standard expectation that higher RSEI values should denote better ecological status, the RSEI is adjusted as follows:
R S E I 0 = 1 [ P C 1 [ f L S T , N D B S I , N D V I , L S M ] ]
Moreover, to ensure the comparability of RSEI values across different temporal and spatial contexts, normalization of the RSEI values is required:
R S E I = ( R S E I 0 R S E I 0 _ m i n ) / ( R S E I 0 m a x R S E I 0 _ m i n )
The RSEI determined using Equation (10) represents the final results of RSEI in this study. The RSEI is categorized into five classes at equal intervals (Table 2), corresponding to very low, low, moderate, high, and very high ecological environments [19,72].

2.6. Spatial Autocorrelation Analysis

Spatial autocorrelation is an essential measure for assessing the association between the environmental quality of one region and the ecological quality of its neighboring areas [73,74]. Analyzing the spatial correlation of EEQ helps describe its spatial distribution homogeneity within the study region. This research devoted both global spatial autocorrelation (Global Moran’s I) and local spatial association indicators (Local Moran’s I) to evaluate the geographical correlation of RSEI [75]. Moran’s I measures the correlation between adjoining units in geospatial space (pixels of 500 m × 500 m). A value closer to 1 indicates a stronger correlation between units. Consequently, the researchers used Moran’s I to assess the connection between the RSEI units in this study, as represented by Equation (11).
G l o b a l m o r a n s   I = m × i = 1 m j = 1 m W i j D i D ¯ D j D ¯ i = 1 m j = 1 m W i j ( D i D ¯ ) 2
Here m expresses the total elements, Di illustrates the EEQ value at position i, and D ¯ is the average EEQ value across all elements in the study region. Wij is the spatial weight. The range of Moran’s I extends from −1 to 1. A Moran’s I value around +1 implies a high level of positive spatial autocorrelation for EEQ. Conversely, a value near −1 suggests a significant negative geographical correlation. A value of 0 signifies no spatial autocorrelation [71].
The LISA index is a crucial metric for analyzing local spatial autocorrelation, as it allows for calculating Moran’s I value at each spatial unit. This makes the analysis of local spatial autocorrelation particularly important. If there is no global spatial autocorrelation, LISA can be used to detect local spatial autocorrelation that may be concealed. LISA may be used to identify spatial heterogeneity when global spatial autocorrelation is present [76]. The calculation formula for Local Moran’s I uses the same parameters as the global Moran’s I index.
L o c a l   m o r a n s   I = ( D i D ¯ ) × j = 1 m W i j ( D j D ¯ ) i 1 m ( D i D ) 2
The LISA cluster map categorizes local spatial classes into five types: High-High (H-H), Low-Low (L-L), Low-High (L-H), High-Low (H-L), and No Significant. The H-H classification denotes that the focal and surrounding areas exhibit high environmental ecological quality (EEQ). Conversely, the L-L classification indicates that the chosen area and its neighboring areas have low EEQ. The L-H categorization refers to a situation in which the selected location has a low Environmental Equity Quotient (EEQ), while the surrounding areas have a high EEQ. In contrast, the H-L classification signifies that the chosen area has high EEQ, while the surrounding areas have low EEQ [75].

2.7. Pearson’s Correlation Analysis
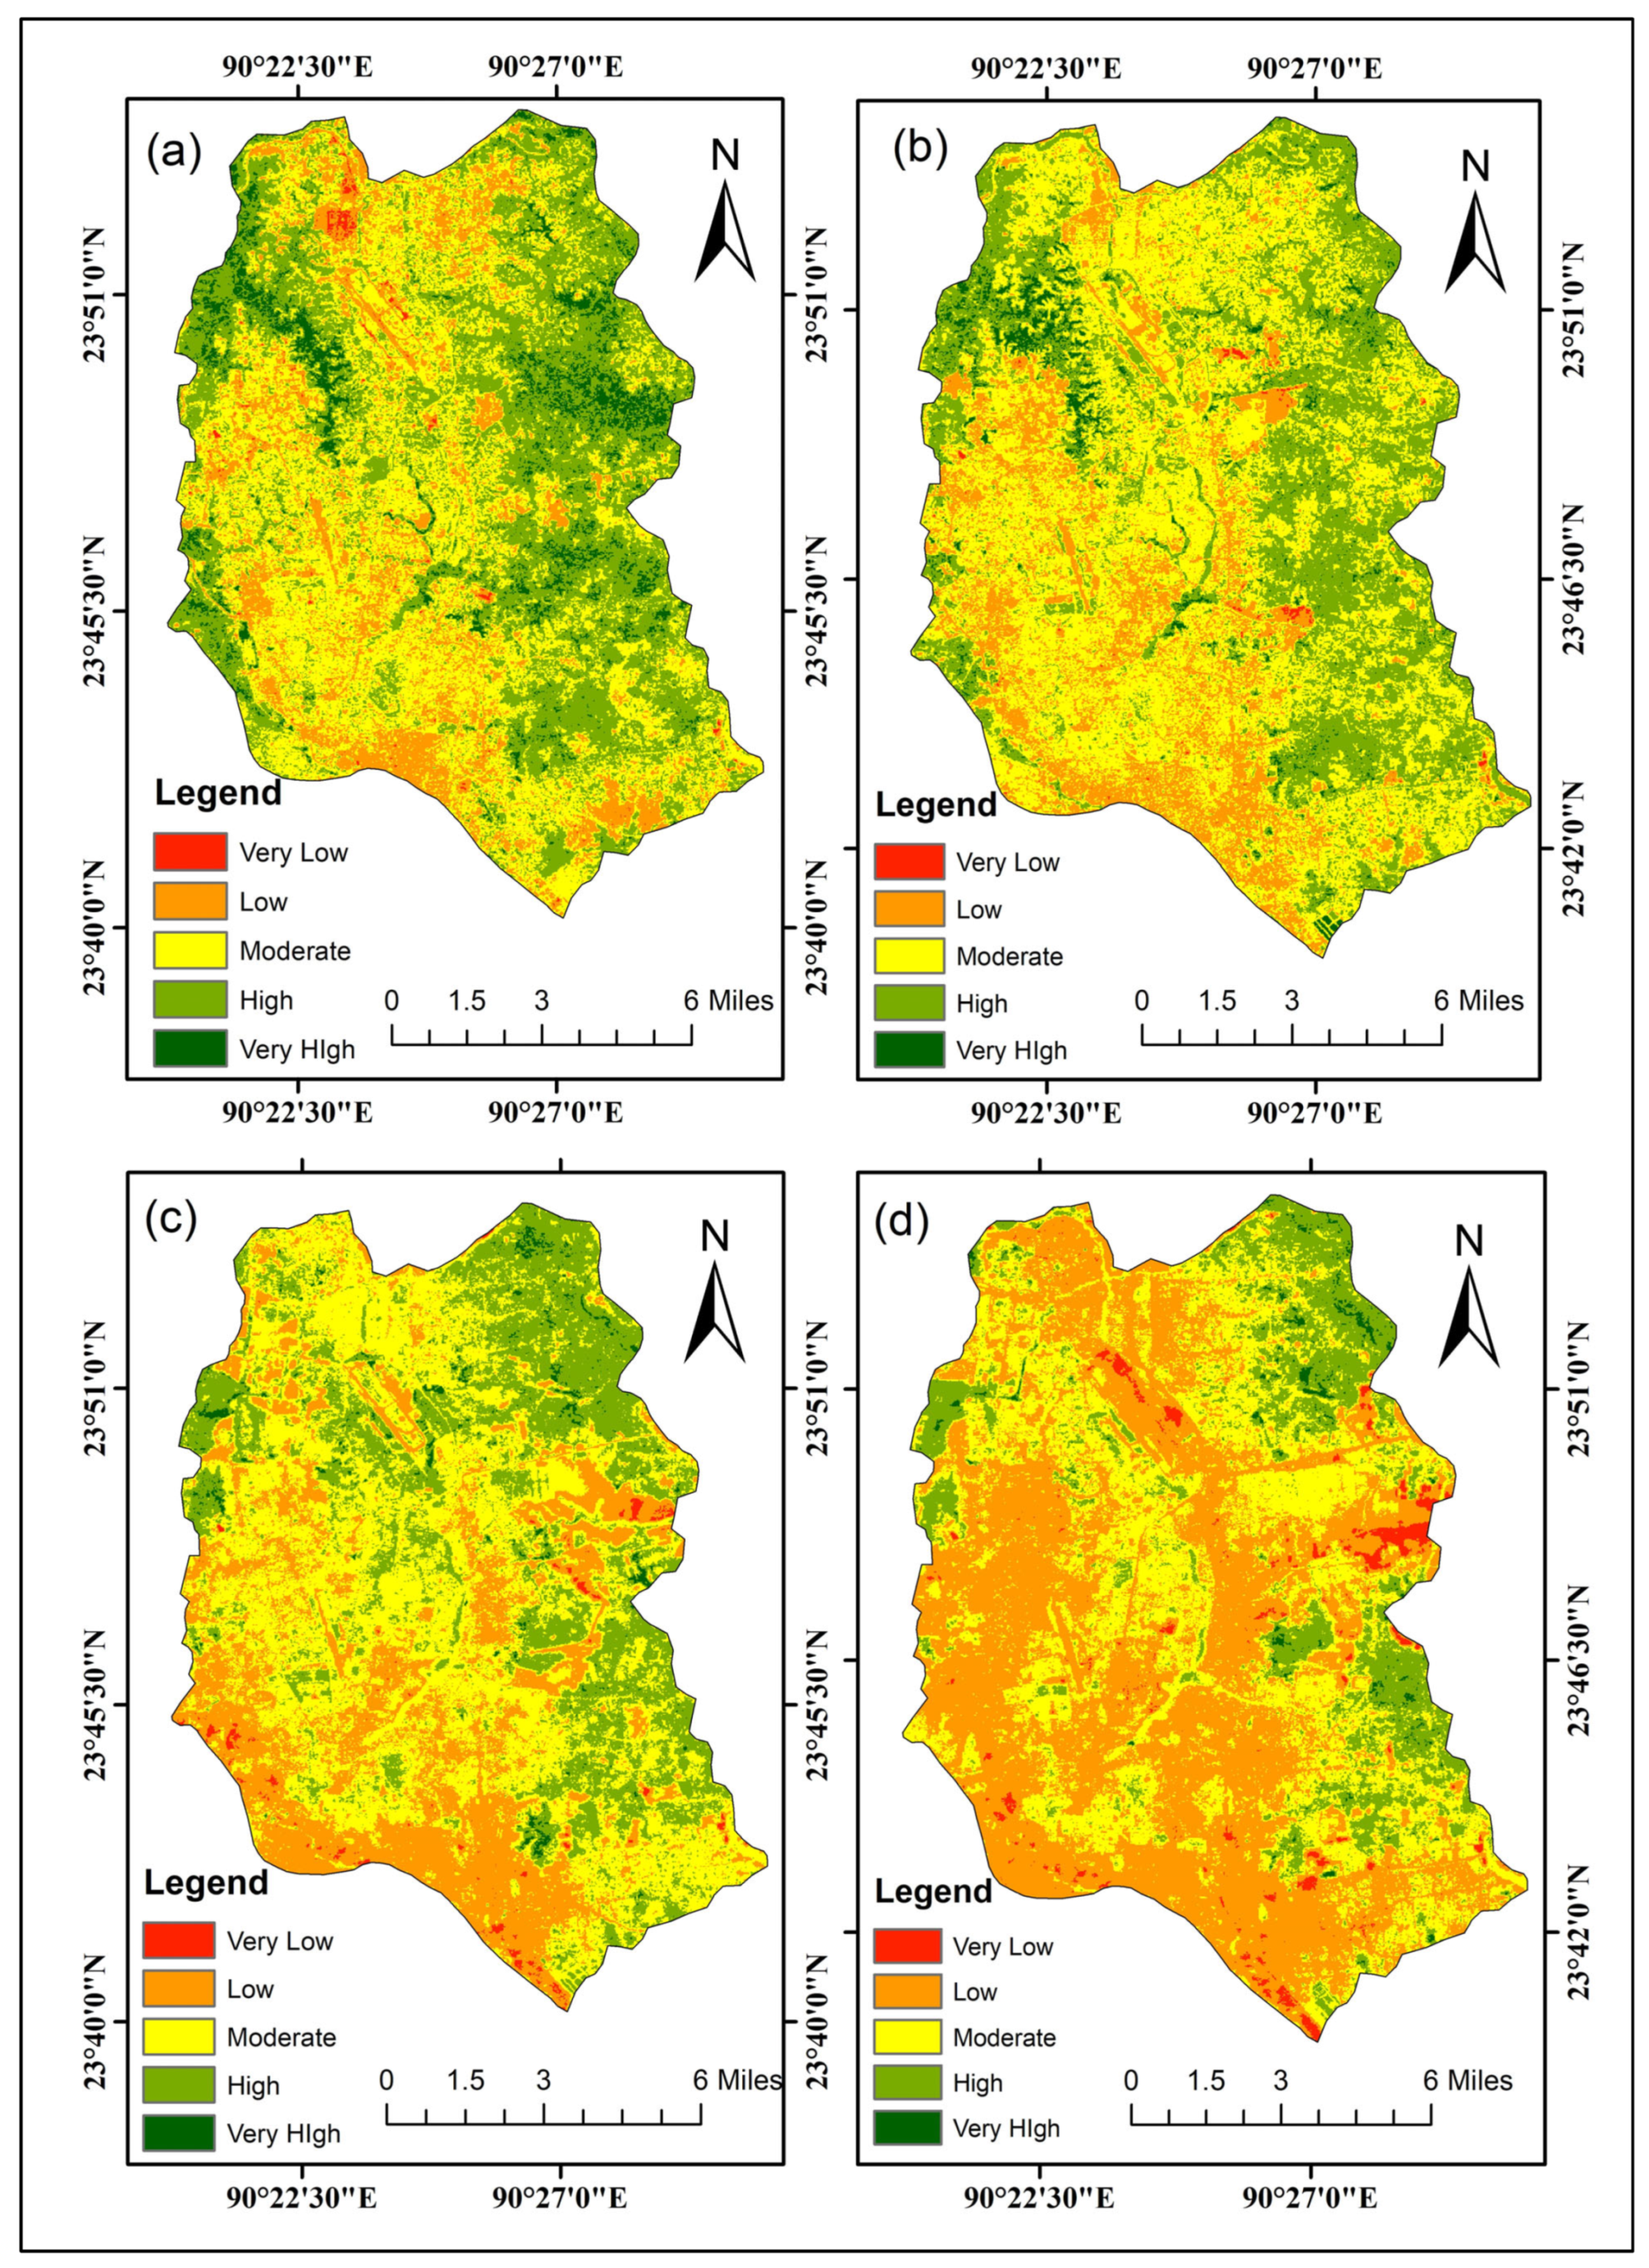
It is crucial to understand the relationship between the RSEI and its constituent factors (NDVI, LST, NDBSI, and LSM) across different time frames. Pearson correlation offers a quantitative measure of the linear relationship among these variables, aiding in comprehending their interrelations and ecological impacts. The correlation coefficient spans between −1 and 1. Values near 1 suggest an intense positive linear association, values closer to −1 show a severe negative linear relationship, and values near zero show no linear link. This study aims to identify the indicators that have the most significant impact on the ecological equation in Dhaka, as defined by [77]. These indicators were then used to calculate the correlation coefficients.
ρ = i = 1 N x i x ¯ y i y ¯ / i = 1 N ( x i x ¯ ) 2   i = 1 N ( y i y ¯ ) 2
The Pearson correlation coefficient is denoted as ρ . It calculates the linear relationship between two variables. N represents the spatial units; x i and y i correspond to the values of the variables and the RSEI for each unit, respectively; x ¯ represents the variable’s mean; and y ¯ signifies the RSEI mean value.

3. Results

3.1. Ecological Indicators and PCA Analysis

Four ecological factors—greenness (NDVI), heat index (LST), wetness (LSM), and dryness (NDBSI)—were used to evaluate Dhaka’s EEQ from 1993 to 2023. Principal component analysis (PCA) was applied to integrate these indicators and calculate the RSEI. The first principal component (PC1) captured most of the variance and effectively summarized the combined influence of the four ecological factors.
The results of the PCA are presented in Table 2. Based on the data, it can be shown that PC1 consistently exhibits the greatest eigenvalue among the four principal components during the whole research period, ranging from 58% to 66%. This illustrates that PC1 encompasses most of the variance in information derived from the four measures. Moreover, this study demonstrates that the four measures inside PC1 are categorized into two groups depending on their indications. The coexistence of opposing indicators in these categories indicates an inverse relationship between their importance and ecological state. The contributions of the four ecological components to PC1 remained fairly consistent across the years 1993, 2003, 2013, and 2023, as shown by the data for these years (Table 3). The positive loadings of LST and NDVI constantly indicate the advantageous impacts of vegetation abundance and moisture content on the natural ecosystem. In 2023, the loadings for NDVI and wetness were 0.488 and −0.584, respectively. These loadings accounted for 66.06% of the total variation. In contrast, NDBSI and LST show a steady load decrease due to the detrimental impacts of exposed soil, building activities, and elevated surface temperatures. The loadings for LST and NDBSI in 2023 were 0.102 and −0.640, respectively.
These findings corroborate the widely acknowledged concept of a reciprocal link between these factors and EEQ. The selection of PC1 as the basis for creating the RSEI was based on its substantial explanatory capability. This study effectively detected dynamic changes in the four ecological components by monitoring the fluctuations in PC1 across time. The research region was characterized mainly by vegetation and exposed soil, with the dryness index (NDBSI) making the most significant overall contribution, followed by the greenness index (NDVI). In 2003, the loadings for NDBSI and NDVI were 0.809 and −0.212, respectively. These values accounted for 62.69% of the overall variation. The results highlight the practical usefulness of the RSEI in evaluating the efficiency of widespread ecological management techniques in urban settings.

3.2. Dynamic Changes in the EEQ

The spatiotemporal evolution of the ecological quality over 30 years is depicted in Figure 4. Based on the findings, ecological quality was categorized into five equal-interval classes: very poor (0–0.2), poor (0.2–0.4), moderate (0.4–0.6), good (0.6–0.8), and very good (0.8–1) [78,79]. The proportions of each ecological quality level (very low, low, moderate, high, and very high) and the area were calculated for 1993, 2003, 2013, and 2023 (Figure 5). The results indicated that from 1993 to 2023, the total proportions of areas are moving in an increasing trend toward very low and low categories, while a decreasing trend was noted for moderate, high, and very high categories; such degradation sustained over time denotes significant ecological deterioration at the general level. Table 4 presents the changes in both area (km²) and percentage share for each ecological quality class over time.
Analysis of the dynamic variations in the ecological quality of the environment at ten-year intervals shows significant changes taking place in the area under study. The area marked as very low quality, which amounted to 0.26 km2 (0.08%), reached 0.66 km2 (0.20%), while the low-quality area expanded from 37.85 km2 (11.53%) to 58.64 km2 (17.87%). At the same time, areas of moderate quality decreased slightly from 162.15 km2 (49.41%) to 158.42 km2 (48.28%), high-quality areas reduced from 113.17 km2 (34.49%) to 102.04 km2 (31.10%), and very high-quality regions reduced from 14.72 km2 (4.49%) to 8.40 km2 (2.56%). Between 2003 and 2013, the very low-quality area increased further to 1.92 km2 (0.58%), and the low-quality areas increased. On the other hand, moderate-quality areas declined to 150.51 km2 (45.87%), high-quality areas to 86.17 km2 (26.26%), and very high-quality areas to 3.93 km2 (1.20%). From 2013 to 2023, the low-quality area increased significantly to 5.56 km2 (1.70%), whereas low-quality areas nearly doubled to 161.63 km2 (49.25%). Meanwhile, moderate-quality areas decreased to 111.64 km2 (34.02%), high-quality areas declined to 46.77 km2 (14.25%), and very high-quality areas further reduced to 2.55 km2 (0.78%).
From 1993 to 2023, very low- and low-quality regions experienced an intense increase in the study area. This specifies an increased region of bad ecological quality, probably due to intensified urbanization and industrial activities. Concretely, from 1993 to 2023, low and very low quality regions increased by 5.30 km2, while low quality areas expanded by 123.78 km2. This trend significantly reduced moderate-, high-, and very high-quality areas by 50.51 km2, 66.40 km2, and 12.17 km2, respectively. These changes indicate severe losses in regions with relatively good ecological conditions, likely due to urban expansion and environmental degradation, which cut them to a fraction of their initial extent. These results highlight the compelling need for proper implementation of environmental management and conservation to reduce further ecological degradation and conserve environmental health.

3.3. Correlation Analysis Between RSEI Variables

Table 5 shows the Pearson correlation coefficients between the RSEI and four key environmental indicators—NDVI, NDBSI, LSM, and LST—over a 30-year period: 1993, 2003, 2013, and 2023 in Dhaka, Bangladesh.
The data showed a modest negative correlation value of −0.49 between RSEI and NDVI for 1993; hence, the value denotes a modest inverse relationship. The correlation coefficient was strongly negative for RSEI against LSM (wetness) at −0.82, whereas it denoted a strong inverse relationship with considerable values. The association with NDBSI was strongly positive, 0.92, and robustly direct, while the correlation with LST was also strongly negative, −0.82. By 2003, the RSEI correlations with NDVI had changed to a positive 0.31, reflecting a mild direct relationship. The LSM correlation showed a strong positive relationship at 0.89, suggesting a substantial direct relationship with RSEI. The relation with NDBSI had become strongly negative at −0.98, meaning it had become almost perfectly inverse. The correlation with LST remained strongly negative at −0.75. In 2013, the positive relationship between RSEI and NDVI grew to 0.59; hence, it became more direct. The relation with LSM was moderate at 0.38. Those with NDBSI and LST remained strongly negative, at −0.88 and −0.85, respectively. By 2023, the correlation of RSEI with NDVI was significantly high to the extent of 0.73, portending a straightforward relationship, while that with LSM is relatively low but positive at 0.31. The correlations with NDBSI and LST remained strongly negative at −0.90 and −0.88, respectively.
These results indicate dynamic changes over the years in the relationships between RSEI and the environmental indicators that reflect changes in vegetation, moisture levels, urban development, and temperature. These correlations’ varying strengths and directions indicate a complicated interaction between these factors in different temporal contexts.

3.4. Spatial Autocorrelation Analysis of RSEI

A spatial autocorrelation analysis was performed for Dhaka to examine the possible spatial relationship of the RSEI over various periods. This analysis utilized Moran’s I index and LISA for 1993, 2003, 2013, and 2023. The scatter diagrams of Moran’s I, shown in Figure 6, indicate that most scatter points are concentrated in each year’s first and third quadrants. This suggests a strong positive spatial correlation of EEQ within the study area. Specifically, Moran’s I indices were recorded at 0.907 in 1993, 0.883 in 2003, 0.993 in 2013, and 0.939 in 2023. This pattern indicates that the spatial distribution of EEQ is characterized by significant clustering, with the most pronounced positive spatial correlation occurring in 2023. Notably, the temporal trend of Moran’s I index reflects a preliminary decline from 1993 to 2003, followed by a subsequent increase from 2003 to 2023, mirroring the fluctuations in the levels of ecological environmental quality over these years.
To comprehend the spatiotemporal patterns of environmental equity, an analysis was conducted on the local spatial correlation of the RSEI indicators using LISA clustering maps. The findings in Figure 7 show that the H-H clustering was predominant in Dhaka’s northeastern and eastern areas. In contrast, the L-L clustering dominated the northwestern regions from 1993 to 2023. Remarkably, it was also evident that, over those years, the L-L clustering further extended towards the parts of the study region that were western in orientation, suggesting the ecological deterioration associated with urbanization. Besides this, statistically insignificant regions were randomly distributed in nature, with low-high and high-low regions nearly nonexistent.

4. Discussion

The aim of this study was to evaluate the ecological conditions in Dhaka, Bangladesh, for a period of 30 years (1993–2023) using the RSEI. PCA was used to combine the four main indicators—heat index (LST), wetness (LSM), greenness (NDVI), and dryness (NDBSI)—into a single measure of EEQ. Investigating the key findings shows that the first principal component (PC1) dominates and captures 58% to 66% of the total variance across the study years, indicating that PC1 successfully assembled information from the four sub-indicators. On the other hand, the adverse effects of bare soil, construction activities, and higher surface temperatures are reflected in the negative loadings of NDBSI across study years, as shown in Table 3. This finding is consistent with previous studies indicating that increased bare soil and impervious surfaces are associated with ecological degradation and urban heat effects [80].
Dhaka has seen a fast population increase, wetlands and agricultural land conversion into built-up areas, and industrial sprawl over the past three decades, all of which define a highly intense and often uncontrolled urban expansion. Regardless of several government projects, including the Detailed Area Plan (DAP, completed in 2010 and revised later) and the Dhaka Metropolitan Development Plan (1995–2015), enforcement has been weak, resulting in significant environmental damage. Low-quality (L-L) clusters’ westward spread matches the rising informal settlements and industrial activity along Dhaka’s western periphery.
Explaining 58–66% of the ecological variability, PC1’s consistent dominance emphasizes the significant combined impact of surface moisture, urban dryness, and vegetation cover on Dhaka’s environment. The spatial autocorrelation results, particularly the westward expansion of Low–Low (L-L) clusters, reflect a pattern of increasing population density and declining green space, largely driven by poorly managed urbanization. The almost-complete absence of Low-High (L-H) and High-Low (H-L) clusters suggests that, driven by contiguous zones of urban development rather than scattered ecological transitions, Dhaka’s environmental conditions are generally regionally homogeneous.
Our findings align with previous RSEI-based studies in China and India, confirming that urbanization degrades the ecological quality [81]. In other studies, Wang et al. [82] also assessed changes in the ecosystem service values for Zhoushan Archipelago, China, and the results were somewhat similar; a positive relation of ecosystem services with vegetation and water areas was observed, as in the case of Dhaka, where NDVI and wetness had positive effects. This further confirms the essential role of vegetation and water bodies in sustaining ecological health. Chen et al. [83] revealed that the areas of good and excellent ecological conditions in most places across the Greater Khingan Range, China, were surrounded by vegetation; poor conditions mainly fell in the city areas. This is quite similar to the pattern seen in Dhaka; the urbanization scenario seems to affect the ecological quality. The influence of eco-parameters on LST in Xi’an, China—analyzed by [84,85]—showed that greenness and soil moisture were negatively correlated with LST, while dryness and built-up features had a positive correlation with LST. These results support those found in Dhaka, emphasizing the role of green spaces in mitigating urban heat effects. Yue et al. [48] indicated that substantial changes in ecological quality were measured among most of China’s major cities due to industrialization and urbanization, thereby establishing support for the observed downfall in high- and very high-quality areas in Dhaka. This underscores the critical importance of sustainable urban development practices in preserving ecological quality. Temporal consistency was also discovered under a time-series RSEI approach in assessing ecological quality by Sun et al. [86] from Hangzhou; moreover, they also observed spatial polarization, similar to the spatial autocorrelation patterns observed within Dhaka. Ecological trends, both positive and negative, have been identified using the RSEI with Change Vector Analysis (CVA) method in Fujian Province, China, by Xu et al. [19], again proving that there is a dual effect due to human activities. It goes without saying that both urbanization and industrialization in Dhaka contributed much to ecological worsening. Regional differences in China’s environmental quality and the colossal roles of human activities were highlighted by Li and Jiang [87]. In another comparative study [88] conducted by Halder and Bose in Indian urban centers, the use of RSEI and Comprehensive Ecological Evaluation Index (CEEI) indicates that multiple ecological indicators need to be included for a comprehensive evaluation. These findings are consistent with the previously mentioned results from Dhaka, where many variables were combined to deliver a more comprehensive assessment of the ecological quality. Zhang et al. [44] quantified the ecological environment degradation in the Yangtze River basin between 2008 and 2019, concluding that it has experienced a continuous and highly significant deterioration. A similar pattern of sustained ecological degradation was also observed in Dhaka during the study period, highlighting the urgent need to develop effective conservation strategies. Jia et al. [89] used the MRSEI to assess eco-environmental quality in the Qaidam Basin, China, revealing regional variations. They also highlighted the importance of remote sensing technologies in identifying these regional characteristics. Chen et al. [90] measured the alterations taking place in the Zhoushan Archipelago’s ecological surroundings. Their findings showed a general decline in ecological quality over the course of 35 years. These findings of substantial ecological destruction due to urbanization and industrial operations align with the trends mentioned above that are visible in Dhaka. This further underscores the need to implement effective development measures. Ding et al. [91] developed a methodology for evaluating the quality of ecosystems in Guangdong province using remote sensing data and spatial autocorrelation measures. Dynamic spatial organization patterns were determined to capture hotspots and cold spots of an ecological nature, following the footsteps of spatial autocorrelation analysis performed in Dhaka, or it could also mean that the results should not be interpreted without reference to a specific context. Halder and Bose [60], for instance, studied the ecological quality across five smart cities of India and stated that the ecological environment in Kochi and New Delhi will be superior compared to the others since they have a higher percentage share of greenness and wetness areas. This finding aligns with the observations in Dhaka, emphasizing the crucial role of green spaces and water bodies in maintaining urban ecological health. Sekertekin [64] evaluated the ecological quality of the environment in the Asansol Municipal Corporation region of India, an area severely impacted by urban expansion and industrialization. The results, therefore, confirm observations made in Dhaka and the necessity for targeted ecological management strategies there. As determined by the study conducted on seasonal optimum selection for RSEI construction conducted by Huang et al. [71] in the Beijing–Tianjin–Hebei region, the images should be chosen during times of active growth of the vegetative components. This favors what is happening in Dhaka, where the strength of vegetation contributes to the ecological quality studies. An assessment of ecological environment vulnerability in Pingtan Island by Huang et al. [71] revealed the significant impact of human development activities on the region’s environment. The results show that the initial stages of construction were associated with ecological decline, followed by recovery due to ecological measures. This pattern, which is also observed in Dhaka, reinforces the argument for balanced development and environmental conservation. The authors of [92] conducted similar research in China, focusing on temporal variations in NDVI-based time series data. Their findings showed notable ecological improvements in some areas, while signs of urban degradation were also evident in others. Their emphasis on the impact of urbanization, therefore, brings the idea of balanced development, which only affirms what is realized in Dhaka, where a critical need is exposed in sustainable urban planning. Studies in the Golden Quadrangle Region [93], five smart cities in India [60], Wuhan, China [94], and Kolkata [95] all found that ecological quality suffers from rapid urbanization but can improve with proper planning [86,95]. Remote sensing techniques were also successfully used to assess ecological quality [43].
An in-depth assessment of the ecological environment in Dhaka using RSEI and a set of many ecological indicators gives strong evidence for the significant degradation of the local ecology within the last three decades. The results are in good agreement with numerous studies from different regions, so they reinforce the validity of this study’s approach and results. The integration and application of PCA, spatial autocorrelation analysis, and correlation analysis in this study demonstrate strong potential for achieving this objective. The integration of these methods enables a comprehensive understanding of how ecological indicators interact dynamically with the impacts of urbanization and industrial development. The increasing low-quality areas and decreasing high-quality areas hint at the sustainable urban development practices and focused ecological management strategies required now. The relative consistencies of these patterns of environmental degradation due to urbanization and industrial activities, as observed in the current study, are well corroborated by other studies. Therefore, the current study’s findings agree with their global counterparts and underline the critical need for effective environmental management strategies. These strategies should focus on the mitigation of the adverse impacts of urbanization and industrialization to guarantee sustainable development and preservation of ecological quality in rapidly urbanizing regions like Dhaka, and this will guide policymakers, urban planners, and environmental managers in strategizing how to counteract ecological degradation. Integrated urban design plans are absolutely necessary to slow down more environmental damage. Preserving and restoring wetlands, implementing land-use zoning rules, improving urban greening projects, including rooftop gardens and urban parks, and using sustainable drainage systems (SuDS) should all take first priority. Furthermore, applying current frameworks such as the DAP, along with supporting community-based conservation initiatives, can help enhance Dhaka’s urban ecological resilience. However, several limitations of this study should be considered: the fact that most data originate from remote sensing might be an advantage in providing very broad temporal and spatial coverage but may also miss finer ecological details and local nuances that could be captured at the ground level. Some other important factors were neglected by this survey, including the most obvious ones like air and water pollution, biodiversity, and soil quality. A decadal temporal resolution may overlook short-term ecological variations and trends. In addition, it is specific to the context of Dhaka, which is informative but not fully representative of the conditions in other rapidly urbanizing areas.

5. Conclusions

The remote sensing-based ecological environment quality assessment (RSEI) results indicate a continuous degradation of Dhaka’s ecological environment over the past three decades. The analysis of Landsat imagery from 1993 to 2023 revealed a 39.3% increase in the areas classified as low- and very low-EEQ, while high- and very high-ecological quality areas decreased by 24% in Dhaka. PCA confirmed that all four components (LST, LSM, NDVI, and NDBSI) significantly contributed to the RSEI values. Among these, LST and NDBSI showed a strong negative correlation with RSEI, especially in 1993, while NDVI and LSM generally had a positive correlation, with a notable negative correlation in 1993. The increasing extent of bare soil and impervious surfaces contributes to ecological degradation and intensifies urban heat effects. About 58–66% of environmental disturbance is associated with the surface moisture, urban dryness, and vegetation cover. However, the environmental degradation is not spatially concentrated; it is rather scattered, as suggested by the L-H and H-L clusters. Industrial zones, in particular, exhibited severely degraded ecological conditions. To ensure urban ecological resilience, the promotion of sustainable urbanization practices, such as preserving green spaces and regulating land use, is essential. However, the analysis was constrained by limited spatial and temporal resolution, which may have affected the precision of the results. Incorporating additional parameters, such as air quality, socio-economic indicators, or hydrological data, in future analyses could enhance the robustness of ecological assessments. The findings of this study provide crucial spatial and temporal insights that can support policymakers and urban planners in formulating targeted strategies for improving Dhaka’s ecological sustainability.

Supplementary Materials

The following supporting information can be downloaded at https://www.mdpi.com/article/10.3390/land14061258/s1.

Author Contributions

Conceptualization, M.M.H., N.M.R.N. and M.Z.; methodology, M.M.H. and M.T.F.; software, M.M.H. and M.T.F.; validation, M.M.H. and M.T.F.; formal analysis, M.M.H. and M.T.F.; investigation, M.M.H. and M.Z.; resources, M.M.H. and F.F.B.H.; data curation, M.M.H. and M.T.F.; writing—original draft preparation, M.M.H., M.T.F., M.T. and P.M.; writing—review and editing, M.M.H., P.M., S.K.R., M.N.F.Z., M.M.A., F.F.B.H., M.B. and M.Z.; visualization, M.M.H. and M.T.F.; supervision, M.M.H. and N.M.R.N.; project administration, M.M.H. and M.Z. All authors have read and agreed to the published version of the manuscript.

Funding

This research was funded by Princess Nourah bint Abdulrahman University Researchers Supporting Project number (PNURSP2025R675), Princess Nourah bint Abdulrahman University, Riyadh, Saudi Arabia.

Data Availability Statement

Data can be made available on reasonable request.

Acknowledgments

The authors extend their appreciation to Princess Nourah bint Abdulrahman University Researchers Supporting Project number (PNURSP2025R675), Princess Nourah bint Abdulrahman University, Riyadh, Saudi Arabia. The authors are thankful to the reviewers for their constructive comments, which significantly improved the manuscript.

Conflicts of Interest

The authors declare no conflicts of interest.

References

  1. Walther, G.-R.; Post, E.; Convey, P.; Menzel, A.; Parmesan, C.; Beebee, T.J.C.; Fromentin, J.-M.; Hoegh-Guldberg, O.; Bairlein, F. Ecological Responses to Recent Climate Change. Nature 2002, 416, 389–395. [Google Scholar] [CrossRef] [PubMed]
  2. Song, X.-P.; Hansen, M.C.; Stehman, S.V.; Potapov, P.V.; Tyukavina, A.; Vermote, E.F.; Townshend, J.R. Global Land Change from 1982 to 2016. Nature 2018, 560, 639–643. [Google Scholar] [CrossRef] [PubMed]
  3. Liu, S.; Liu, L.; Wu, X.; Hou, X.; Zhao, S.; Liu, G. Quantitative Evaluation of Human Activity Intensity on the Regional Ecological Impact Studies. Acta Ecol. Sin. 2018, 38, 6797–6809. [Google Scholar] [CrossRef]
  4. Wang, J.; Lin, Y.; Zhai, T.; He, T.; Qi, Y.; Jin, Z.; Cai, Y. The Role of Human Activity in Decreasing Ecologically Sound Land Use in C Hina. Land Degrad. Dev. 2018, 29, 446–460. [Google Scholar] [CrossRef]
  5. Wang, H.; Tang, L.; Qiu, Q.; Chen, H. Assessing the Impacts of Urban Expansion on Habitat Quality by Combining the Concepts of Land Use, Landscape, and Habitat in Two Urban Agglomerations in China. Sustainability 2020, 12, 4346. [Google Scholar] [CrossRef]
  6. Wang, L.; Tian, F.; Wang, X.; Yang, Y.; Wei, Z. Attribution of the Land Surface Temperature Response to Land-Use Conversions from Bare Land. Glob. Planet. Chang. 2020, 193, 103268. [Google Scholar] [CrossRef]
  7. Wolters, M.L.; Sun, Z.; Huang, C.; Kuenzer, C. Environmental Awareness and Vulnerability in the Yellow River Delta: Results Based on a Comprehensive Household Survey. Ocean Coast. Manag. 2016, 120, 1–10. [Google Scholar] [CrossRef]
  8. Cui, L.; Shi, J. Urbanization and Its Environmental Effects in Shanghai, China. Urban Clim. 2012, 2, 1–15. [Google Scholar] [CrossRef]
  9. Nguyen, T.; Lin, T.-H.; Chan, H.-P. The Environmental Effects of Urban Development in Hanoi, Vietnam from Satellite and Meteorological Observations from 1999–2016. Sustainability 2019, 11, 1768. [Google Scholar] [CrossRef]
  10. Gazi, M.Y.; Rahman, M.Z.; Uddin, M.M.; Rahman, F.M.A. Spatio-Temporal Dynamic Land Cover Changes and Their Impacts on the Urban Thermal Environment in the Chittagong Metropolitan Area, Bangladesh. GeoJournal 2021, 86, 2119–2134. [Google Scholar] [CrossRef]
  11. Rahman, M.S.; Mohiuddin, H.; Kafy, A.-A.; Sheel, P.K.; Di, L. Classification of Cities in Bangladesh Based on Remote Sensing Derived Spatial Characteristics. J. Urban Manag. 2019, 8, 206–224. [Google Scholar] [CrossRef]
  12. Kafy, A.-A.; Abdullah-Al-Faisal; Rahman, M.S.; Islam, M.; Al Rakib, A.; Islam, M.A.; Khan, M.H.H.; Sikdar, M.S.; Sarker, M.H.S.; Mawa, J.; et al. Prediction of Seasonal Urban Thermal Field Variance Index Using Machine Learning Algorithms in Cumilla, Bangladesh. Sustain. Cities Soc. 2021, 64, 102542. [Google Scholar] [CrossRef]
  13. Kafy, A.-A.; Rahman, M.S.; Faisal, A.-A.; Hasan, M.M.; Islam, M. Modelling Future Land Use Land Cover Changes and Their Impacts on Land Surface Temperatures in Rajshahi, Bangladesh. Remote Sens. Appl. Soc. Environ. 2020, 18, 100314. [Google Scholar] [CrossRef]
  14. Naim, M.N.H.; Kafy, A.-A. Assessment of Urban Thermal Field Variance Index and Defining the Relationship between Land Cover and Surface Temperature in Chattogram City: A Remote Sensing and Statistical Approach. Environ. Chall. 2021, 4, 100107. [Google Scholar] [CrossRef]
  15. Sohel, M.S.I. Ecohydrology: A New Approach to Old Problems for Sustainable Management of Aquatic Ecosystem of Bangladesh for Ecosystem Service Provision. In Ecosystem Services and River Basin Ecohydrology; Chicharo, L., Müller, F., Fohrer, N., Eds.; Springer: Dordrecht, The Netherlands, 2015; pp. 293–317. ISBN 978-94-017-9845-7. [Google Scholar]
  16. Majed, N.; Islam, M.A.S. Contaminant Discharge from Outfalls and Subsequent Aquatic Ecological Risks in the River Systems in Dhaka City: Extent of Waste Load Contribution in Pollution. Front. Public Health 2022, 10, 880399. [Google Scholar] [CrossRef]
  17. Rahman, M.; Szabó, G. Impact of Land Use and Land Cover Changes on Urban Ecosystem Service Value in Dhaka, Bangladesh. Land 2021, 10, 793. [Google Scholar] [CrossRef]
  18. Wu, X.; Zhang, H. Evaluation of Ecological Environmental Quality and Factor Explanatory Power Analysis in Western Chongqing, China. Ecol. Indic. 2021, 132, 108311. [Google Scholar] [CrossRef]
  19. Xu, H.; Wang, Y.; Guan, H.; Shi, T.; Hu, X. Detecting Ecological Changes with a Remote Sensing Based Ecological Index (RSEI) Produced Time Series and Change Vector Analysis. Remote Sens. 2019, 11, 2345. [Google Scholar] [CrossRef]
  20. Willis, K.S. Remote Sensing Change Detection for Ecological Monitoring in United States Protected Areas. Biol. Conserv. 2015, 182, 233–242. [Google Scholar] [CrossRef]
  21. De Araujo Barbosa, C.C.; Atkinson, P.M.; Dearing, J.A. Remote Sensing of Ecosystem Services: A Systematic Review. Ecol. Indic. 2015, 52, 430–443. [Google Scholar] [CrossRef]
  22. Kwok, R. Ecology’s Remote-Sensing Revolution. Nature 2018, 556, 137–138. [Google Scholar] [CrossRef] [PubMed]
  23. Reza, M.I.H.; Abdullah, S.A. Regional Index of Ecological Integrity: A Need for Sustainable Management of Natural Resources. Ecol. Indic. 2011, 11, 220–229. [Google Scholar] [CrossRef]
  24. Kennedy, R.E.; Andréfouët, S.; Cohen, W.B.; Gómez, C.; Griffiths, P.; Hais, M.; Healey, S.P.; Helmer, E.H.; Hostert, P.; Lyons, M.B.; et al. Bringing an Ecological View of Change to Landsat-based Remote Sensing. Front. Ecol. Environ. 2014, 12, 339–346. [Google Scholar] [CrossRef]
  25. Xu, H.; Wang, M.; Shi, T.; Guan, H.; Fang, C.; Lin, Z. Prediction of Ecological Effects of Potential Population and Impervious Surface Increases Using a Remote Sensing Based Ecological Index (RSEI). Ecol. Indic. 2018, 93, 730–740. [Google Scholar] [CrossRef]
  26. Nichol, J.; Lee, C.M. Urban Vegetation Monitoring in Hong Kong Using High Resolution Multispectral Images. Int. J. Remote Sens. 2005, 26, 903–918. [Google Scholar] [CrossRef]
  27. Dewan, A.M.; Yamaguchi, Y. Using Remote Sensing and GIS to Detect and Monitor Land Use and Land Cover Change in Dhaka Metropolitan of Bangladesh during 1960–2005. Environ. Monit. Assess. 2009, 150, 237–249. [Google Scholar] [CrossRef]
  28. Rajasekar, U.; Weng, Q. Urban Heat Island Monitoring and Analysis Using a Non-Parametric Model: A Case Study of Indianapolis. ISPRS J. Photogramm. Remote Sens. 2009, 64, 86–96. [Google Scholar] [CrossRef]
  29. Joshi, K.; Kumari, M.; Mishra, V.N.; Prasad, R.; Zhran, M. Geoinformatics Based Evaluation of Heat Mitigation Strategies through Urban Green Spaces in a Rapidly Growing City of India: Implications for Urban Resilience. Theor. Appl. Climatol. 2025, 156, 188. [Google Scholar] [CrossRef]
  30. Kumar, D. Remote Sensing Based Vegetation Indices Analysis to Improve Water Resources Management in Urban Environment. Aquat. Procedia 2015, 4, 1374–1380. [Google Scholar] [CrossRef]
  31. Gulia, S.; Shiva Nagendra, S.M.; Khare, M.; Khanna, I. Urban Air Quality Management-A Review. Atmos. Pollut. Res. 2015, 6, 286–304. [Google Scholar] [CrossRef]
  32. Petrou, Z.I.; Manakos, I.; Stathaki, T. Remote Sensing for Biodiversity Monitoring: A Review of Methods for Biodiversity Indicator Extraction and Assessment of Progress towards International Targets. Biodivers. Conserv. 2015, 24, 2333–2363. [Google Scholar] [CrossRef]
  33. Behling, R.; Bochow, M.; Foerster, S.; Roessner, S.; Kaufmann, H. Automated GIS-Based Derivation of Urban Ecological Indicators Using Hyperspectral Remote Sensing and Height Information. Ecol. Indic. 2015, 48, 218–234. [Google Scholar] [CrossRef]
  34. Coutts, C.; Hahn, M. Green Infrastructure, Ecosystem Services, and Human Health. Int. J. Environ. Res. Public Health 2015, 12, 9768–9798. [Google Scholar] [CrossRef] [PubMed]
  35. Rouse, J.W.; Haas, R.H.; Schell, J.A.; Deering, D.W. Monitoring Vegetation Systems in the Great Plains with ERTS; NASA: Washington, DC, USA, 1974.
  36. Price, J.C. Land Surface Temperature Measurements from the Split Window Channels of the NOAA 7 Advanced Very High Resolution Radiometer. J. Geophys. Res. 1984, 89, 7231–7237. [Google Scholar] [CrossRef]
  37. Nguyen, C.T.; Chidthaisong, A.; Kieu Diem, P.; Huo, L.-Z. A Modified Bare Soil Index to Identify Bare Land Features during Agricultural Fallow-Period in Southeast Asia Using Landsat 8. Land 2021, 10, 231. [Google Scholar] [CrossRef]
  38. Tucker, C.J. Red and Photographic Infrared Linear Combinations for Monitoring Vegetation. Remote Sens. Environ. 1979, 8, 127–150. [Google Scholar] [CrossRef]
  39. Bouzekri, S.; Lasbet, A.A.; Lachehab, A. A New Spectral Index for Extraction of Built-Up Area Using Landsat-8 Data. J. Indian Soc. Remote Sens. 2015, 43, 867–873. [Google Scholar] [CrossRef]
  40. Huete, A.R. A Soil-Adjusted Vegetation Index (SAVI). Remote Sens. Environ. 1988, 25, 295–309. [Google Scholar] [CrossRef]
  41. Xu, H. Modification of Normalised Difference Water Index (NDWI) to Enhance Open Water Features in Remotely Sensed Imagery. Int. J. Remote Sens. 2006, 27, 3025–3033. [Google Scholar] [CrossRef]
  42. Xu, H. A Remote Sensing Urban Ecological Index and Its Application. Shengtai Xuebao/Acta Ecol. Sin. 2013, 33, 7853–7862. [Google Scholar]
  43. Wu, S.; Gao, X.; Lei, J.; Zhou, N.; Guo, Z.; Shang, B. Ecological Environment Quality Evaluation of the Sahel Region in Africa Based on Remote Sensing Ecological Index. J. Arid Land 2022, 14, 14–33. [Google Scholar] [CrossRef]
  44. Zhang, T.; Yang, R.; Yang, Y.; Li, L.; Chen, L. Assessing the Urban Eco-Environmental Quality by the Remote-Sensing Ecological Index: Application to Tianjin, North China. ISPRS Int. J. Geo-Inf. 2021, 10, 475. [Google Scholar] [CrossRef]
  45. Boori, M.S.; Choudhary, K.; Paringer, R.; Kupriyanov, A. Spatiotemporal Ecological Vulnerability Analysis with Statistical Correlation Based on Satellite Remote Sensing in Samara, Russia. J. Environ. Manag. 2021, 285, 112138. [Google Scholar] [CrossRef] [PubMed]
  46. Hu, X.; Xu, H. A New Remote Sensing Index Based on the Pressure-State-Response Framework to Assess Regional Ecological Change. Environ. Sci. Pollut. Res. 2019, 26, 5381–5393. [Google Scholar] [CrossRef] [PubMed]
  47. Wang, Y. Evaluation of Lake Wetland Ecotourism Resources Based on Remote Sensing Ecological Index. Arab. J. Geosci. 2021, 14, 559. [Google Scholar] [CrossRef]
  48. Yue, H.; Liu, Y.; Li, Y.; Lu, Y. Eco-Environmental Quality Assessment in China’s 35 Major Cities Based On Remote Sensing Ecological Index. IEEE Access 2019, 7, 51295–51311. [Google Scholar] [CrossRef]
  49. Dewan, A.; Corner, R. (Eds.) Dhaka Megacity: Geospatial Perspectives on Urbanisation, Environment and Health; Springer: Dordrecht, The Netherlands, 2014; ISBN 978-94-007-6734-8. [Google Scholar]
  50. Pu, C.; Yang, F.; Wang, X. Flood Risk Assessment of Slums in Dhaka City. Geocarto Int. 2024, 39, 2341802. [Google Scholar] [CrossRef]
  51. Dhaka Tribune Dhaka Ranks World’s Sixth Most Populous City. Available online: https://www.dhakatribune.com/bangladesh/261898/dhaka-ranks-world%E2%80%99s-sixth-most-populous-city (accessed on 1 January 2025).
  52. Hossain, S. Social Formations of the Megacity of Dhaka: A Review Essay. Cities 2013, 30, 252–254. [Google Scholar] [CrossRef]
  53. Benedetti, Y.; Callaghan, C.T.; Ulbrichová, I.; Galanaki, A.; Kominos, T.; Abou Zeid, F.; Ibáñez-Álamo, J.D.; Suhonen, J.; Díaz, M.; Markó, G.; et al. EVI and NDVI as Proxies for Multifaceted Avian Diversity in Urban Areas. Ecol. Appl. 2023, 33, e2808. [Google Scholar] [CrossRef]
  54. Guha, S.; Govil, H. An Assessment on the Relationship between Land Surface Temperature and Normalized Difference Vegetation Index. Environ. Dev. Sustain. 2021, 23, 1944–1963. [Google Scholar] [CrossRef]
  55. Jin, S.; Sader, S.A. Comparison of Time Series Tasseled Cap Wetness and the Normalized Difference Moisture Index in Detecting Forest Disturbances. Remote Sens. Environ. 2005, 94, 364–372. [Google Scholar] [CrossRef]
  56. Li, H.; Liu, F.; Zhang, S.; Zhang, C.; Zhang, C.; Ma, W.; Luo, J. Drying–Wetting Changes of Surface Soil Moisture and the Influencing Factors in Permafrost Regions of the Qinghai-Tibet Plateau, China. Remote Sens. 2022, 14, 2915. [Google Scholar] [CrossRef]
  57. McColl, K.A.; Alemohammad, S.H.; Akbar, R.; Konings, A.G.; Yueh, S.; Entekhabi, D. The Global Distribution and Dynamics of Surface Soil Moisture. Nat. Geosci. 2017, 10, 100–104. [Google Scholar] [CrossRef]
  58. Crist, E.P. A TM Tasseled Cap Equivalent Transformation for Reflectance Factor Data. Remote Sens. Environ. 1985, 17, 301–306. [Google Scholar] [CrossRef]
  59. Zanchetta, A.; Bitelli, G.; Karnieli, A. Monitoring Desertification by Remote Sensing Using the Tasselled Cap Transform for Long-Term Change Detection. Nat. Hazards 2016, 83, 223–237. [Google Scholar] [CrossRef]
  60. Halder, S.; Bose, S. Ecological Quality Assessment of Five Smart Cities in India: A Remote Sensing Index-Based Analysis. Int. J. Environ. Sci. Technol. 2024, 21, 4101–4118. [Google Scholar] [CrossRef]
  61. Barsi, J.; Schott, J.; Hook, S.; Raqueno, N.; Markham, B.; Radocinski, R. Landsat-8 Thermal Infrared Sensor (TIRS) Vicarious Radiometric Calibration. Remote Sens. 2014, 6, 11607–11626. [Google Scholar] [CrossRef]
  62. Essa, W.; Verbeiren, B.; Van Der Kwast, J.; Van De Voorde, T.; Batelaan, O. Evaluation of the DisTrad Thermal Sharpening Methodology for Urban Areas. Int. J. Appl. Earth Obs. Geoinf. 2012, 19, 163–172. [Google Scholar] [CrossRef]
  63. Xu, H. A New Index for Delineating Built-up Land Features in Satellite Imagery. Int. J. Remote Sens. 2008, 29, 4269–4276. [Google Scholar] [CrossRef]
  64. Sekertekin, A. Validation of Physical Radiative Transfer Equation-Based Land Surface Temperature Using Landsat 8 Satellite Imagery and SURFRAD in-Situ Measurements. J. Atmos. Sol.-Terr. Phys. 2019, 196, 105161. [Google Scholar] [CrossRef]
  65. Chakrabortty, R.; Pramanik, M.; Hasan, M.M.; Halder, B.; Pande, C.B.; Moharir, K.N.; Zhran, M. Mitigating Urban Heat Islands in the Global South: Data-Driven Approach for Effective Cooling Strategies. Earth Syst. Environ. 2025, 9, 447–474. [Google Scholar] [CrossRef]
  66. Kasniza Jumari, N.A.S.; Ahmed, A.N.; Huang, Y.F.; Ng, J.L.; Koo, C.H.; Chong, K.L.; Sherif, M.; Elshafie, A. Analysis of Urban Heat Islands with Landsat Satellite Images and GIS in Kuala Lumpur Metropolitan City. Heliyon 2023, 9, e18424. [Google Scholar] [CrossRef]
  67. Tomlinson, C.J.; Chapman, L.; Thornes, J.E.; Baker, C. Remote Sensing Land Surface Temperature for Meteorology and Climatology: A Review. Meteorol. Appl. 2011, 18, 296–306. [Google Scholar] [CrossRef]
  68. Rozenstein, O.; Qin, Z.; Derimian, Y.; Karnieli, A. Derivation of Land Surface Temperature for Landsat-8 TIRS Using a Split Window Algorithm. Sensors 2014, 14, 5768–5780. [Google Scholar] [CrossRef]
  69. Zhong, X.; Zhao, L.; Wang, J.; Zheng, H.; Yan, J.; Jin, R.; Ren, P. Empirical Models on Urban Surface Emissivity Retrieval Based on Different Spectral Response Functions: A Field Study. Build. Environ. 2021, 197, 107882. [Google Scholar] [CrossRef]
  70. Boori, M.S.; Choudhary, K.; Paringer, R.; Kupriyanov, A. Eco-Environmental Quality Assessment Based on Pressure-State-Response Framework by Remote Sensing and GIS. Remote Sens. Appl. Soc. Environ. 2021, 23, 100530. [Google Scholar] [CrossRef]
  71. Huang, S.; Li, Y.; Hu, H.; Xue, P.; Wang, J. Assessment of Optimal Seasonal Selection for RSEI Construction: A Case Study of Ecological Environment Quality Assessment in the Beijing-Tianjin-Hebei Region from 2001 to 2020. Geocarto Int. 2024, 39, 2311224. [Google Scholar] [CrossRef]
  72. Rsei; Xu, H. A Remote Sensing Index for Assessment of Regional Ecological Changes. Zhongguo Huanjing Kexue/China Environ. Sci. 2013, 33, 889–897. [Google Scholar]
  73. Fan, G.Y.; Cowley, J.M. Auto-Correlation Analysis of High Resolution Electron Micrographs of near-Amorphous Thin Films. Ultramicroscopy 1985, 17, 345–355. [Google Scholar] [CrossRef]
  74. Martin, D. An Assessment of Surface and Zonal Models of Population. Int. J. Geogr. Inf. Syst. 1996, 10, 973–989. [Google Scholar] [CrossRef]
  75. Jing, Y.; Zhang, F.; He, Y.; Kung, H.; Johnson, V.C.; Arikena, M. Assessment of Spatial and Temporal Variation of Ecological Environment Quality in Ebinur Lake Wetland National Nature Reserve, Xinjiang, China. Ecol. Indic. 2020, 110, 105874. [Google Scholar] [CrossRef]
  76. Anselin, L. Local Indicators of Spatial Association—LISA. Geogr. Anal. 1995, 27, 93–115. [Google Scholar] [CrossRef]
  77. Ahlgren, P.; Jarneving, B.; Rousseau, R. Requirements for a Cocitation Similarity Measure, with Special Reference to Pearson’s Correlation Coefficient. J. Am. Soc. Inf. Sci. 2003, 54, 550–560. [Google Scholar] [CrossRef]
  78. Liu, H.; Jiang, Y.; Misa, R.; Gao, J.; Xia, M.; Preusse, A.; Sroka, A.; Jiang, Y. Ecological Environment Changes of Mining Areas around Nansi Lake with Remote Sensing Monitoring. Environ. Sci. Pollut. Res. 2021, 28, 44152–44164. [Google Scholar] [CrossRef]
  79. Liu, Q.; Yu, F.; Mu, X. Evaluation of the Ecological Environment Quality of the Kuye River Source Basin Using the Remote Sensing Ecological Index. Int. J. Environ. Res. Public Health 2022, 19, 12500. [Google Scholar] [CrossRef]
  80. Trong Nguyen, C.; Noszczyk, T.; Iabchoon, S. Soil Textures and Urban Heat. In Remote Sensing for Geophysicists; CRC Press: New York, NY, USA, 2025; pp. 472–484. ISBN 978-1-00-348527-8. [Google Scholar]
  81. He, L.; Shen, J.; Zhang, Y. Ecological Vulnerability Assessment for Ecological Conservation and Environmental Management. J. Environ. Manag. 2018, 206, 1115–1125. [Google Scholar] [CrossRef]
  82. Wang, L.; Chen, C.; Xie, F.; Hu, Z.; Zhang, Z.; Chen, H.; He, X.; Chu, Y. Estimation of the Value of Regional Ecosystem Services of an Archipelago Using Satellite Remote Sensing Technology: A Case Study of Zhoushan Archipelago, China. Int. J. Appl. Earth Obs. Geoinf. 2021, 105, 102616. [Google Scholar] [CrossRef]
  83. Chen, Z.; Chen, J.; Zhou, C.; Li, Y. An Ecological Assessment Process Based on Integrated Remote Sensing Model: A Case from Kaikukang-Walagan District, Greater Khingan Range, China. Ecol. Inform. 2022, 70, 101699. [Google Scholar] [CrossRef]
  84. Zhu, X.; Wang, X.; Yan, D.; Liu, Z.; Zhou, Y. Analysis of Remotely-Sensed Ecological Indexes’ Influence on Urban Thermal Environment Dynamic Using an Integrated Ecological Index: A Case Study of Xi’an, China. Int. J. Remote Sens. 2019, 40, 3421–3447. [Google Scholar] [CrossRef]
  85. Ansari, N.; Rukhsana; Pramanik, M.; Alkhuraiji, W.S.; Zhran, M. An Assessment of the Seasonally Dependent Biophysical Mechanism and Dynamic Land Use Change: A Research Effort from Emerging Urban Agglomeration of West Bengal. Results Eng. 2024, 24, 103291. [Google Scholar] [CrossRef]
  86. Sun, C.; Li, J.; Liu, Y.; Cao, L.; Zheng, J.; Yang, Z.; Ye, J.; Li, Y. Ecological Quality Assessment and Monitoring Using a Time-Series Remote Sensing-Based Ecological Index (Ts-RSEI). GIScience Remote Sens. 2022, 59, 1793–1816. [Google Scholar] [CrossRef]
  87. Liao, W.; Jiang, W. Evaluation of the Spatiotemporal Variations in the Eco-Environmental Quality in China Based on the Remote Sensing Ecological Index. Remote Sens. 2020, 12, 2462. [Google Scholar] [CrossRef]
  88. Halder, S.; Bose, S. Comparative Study on Remote Sensing-Based Indices for Urban Ecology Assessment: A Case Study of 12 Urban Centers in the Metropolitan Area of Eastern India. J. Earth Syst. Sci. 2024, 133, 100. [Google Scholar] [CrossRef]
  89. Jia, H.; Yan, C.; Xing, X. Evaluation of Eco-Environmental Quality in Qaidam Basin Based on the Ecological Index (MRSEI) and GEE. Remote Sens. 2021, 13, 4543. [Google Scholar] [CrossRef]
  90. Chen, C.; Wang, L.; Yang, G.; Sun, W.; Song, Y. Mapping of Ecological Environment Based on Google Earth Engine Cloud Computing Platform and Landsat Long-Term Data: A Case Study of the Zhoushan Archipelago. Remote Sens. 2023, 15, 4072. [Google Scholar] [CrossRef]
  91. Ding, Q.; Wang, L.; Fu, M.; Huang, N. An Integrated System for Rapid Assessment of Ecological Quality Based on Remote Sensing Data. Environ. Sci. Pollut. Res. 2020, 27, 32779–32795. [Google Scholar] [CrossRef]
  92. Jiang, L.; Liu, Y.; Wu, S.; Yang, C. Analyzing Ecological Environment Change and Associated Driving Factors in China Based on NDVI Time Series Data. Ecol. Indic. 2021, 129, 107933. [Google Scholar] [CrossRef]
  93. Zhang, X.; Hong, L. Monitoring and Evaluating Ecological Environment Quality Change Based on RSEI Model in the Golden Quadrangle Region in the Border of China, Myanmar, Thailand and Laos. In Proceedings of the 2022 International Conference on Information System, Computing and Educational Technology (ICISCET), Montreal, QC, Canada, 23–25 May 2022; IEEE: Piscataway, NJ, USA, 2022; pp. 195–199. [Google Scholar]
  94. Yang, P.; Zhang, X.; Hua, L. Analysis of Urban Ecological Quality Spatial Patterns and Influencing Factors Based on Remote Sensing Ecological Indices and Multi-Scale Geographically Weighted Regression. Sustainability 2023, 15, 7216. [Google Scholar] [CrossRef]
  95. Maity, S.; Das, S.; Pattanayak, J.M.; Bera, B.; Shit, P.K. Assessment of Ecological Environment Quality in Kolkata Urban Agglomeration, India. Urban Ecosyst. 2022, 25, 1137–1154. [Google Scholar] [CrossRef]
Figure 1. (a) Dhaka city, location of the study area; (b) Dhaka district; (c) Bangladesh boundary.
Land 14 01258 g001
Figure 2. RSEI Components: Greenness (NDVI), Wetness (LSM), Dryness (NDBSI), and Heat Index (LST).
Land 14 01258 g002
Figure 3. Methodological flowchart of the study.
Land 14 01258 g003
Figure 4. RSEI of Dhaka in (a) 1993, (b) 2003, (c) 2013, and (d) 2023.
Land 14 01258 g004
Figure 5. Area distribution of RSEI Classes.
Land 14 01258 g005
Figure 6. Global Moran’s I value from 1993 to 2023 in the study.
Land 14 01258 g006
Figure 7. LISA cluster map (a) 1993, (b) 2003, (c) 2013, and (d) 2023.
Land 14 01258 g007
Table 1. The data sources for satellite images used in the current research.
No.Acquisition DateSatelliteGEE Product IdentifierCloud Cover
1January, 1993Landsat 5 TMLANDSAT/LT05/C02/T1_TOA<1%
2January, 2003Landsat 5 TMLANDSAT/LT05/C02/T1_TOA<1%
3January, 2013Landsat 8 OLI/TIRSLANDSAT/LC08/C02/T1_TOA<1%
4January, 2023Landsat 8 OLI/TIRSLANDSAT/LC08/C02/T1_TOA<1%
Table 2. RSEI value classification for ecological quality.
Data RangeClass Name
0–0.20Very Low
0.20–0.40Low
0.40–0.60Moderate
0.60–0.80High
0.80–1.0Very High
Table 3. PCA results of RSEI in 1993, 2003, 2013, and 2023, respectively.
YearIndicatorsPC1PC2PC3PC4
1993NDVI0.286−0.6550.680−0.163
LSM0.562−0.458−0.687−0.038
NDBSI−0.567−0.298−0.224−0.735
LST0.5300.5210.122−0.658
Eigenvalue0.0260.0120.0030.000
Percent eigenvalue62.00%29.95%7.20%0.85%
2003NDVI−0.212−0.957−0.137−0.143
LSM0.3410.052−0.9380.046
NDBSI0.809−0.1410.262−0.507
LST−0.4290.248−0.184−0.849
Eigenvalue0.0180.0080.0020.000
Percent eigenvalue62.69%29.76%6.21%1.35%
2013NDVI−0.456−0.853−0.097−0.237
LSM0.601−0.241−0.7610.021
NDBSI0.646−0.3160.601−0.348
LST−0.1150.339−0.223−0.907
Eigenvalue0.0200.0100.0040.000
Percent eigenvalue58.5330.4610.400.61
2023NDVI0.4880.7560.266−0.344
LSM−0.5840.0910.806−0.006
NDBSI−0.6400.415−0.513−0.393
LST0.102−0.4980.124−0.852
Eigenvalue0.0250.0090.0040.000
Percent eigenvalue66.06%23.13%9.82%0.99%
Table 4. Area percentages of RSEI Classes.
Class1993200320132023
Area (km2)PercentageArea (km2)PercentageArea (km2)PercentageArea (km2)Percentage
Very low0.260.080.660.201.920.585.561.70
Low37.8511.5358.6417.8785.6326.09161.6349.25
Moderate162.1549.41158.4248.28150.5145.87111.6434.02
High113.1734.49102.0431.1086.1726.2646.7714.25
Very high14.724.498.402.563.931.202.550.78
Total328.15100328.15100328.15100328.15100
Table 5. The Pearson correlation between RSEI and four indices.
YearLSMLSTNDBSINDVI
1993−0.82−0.820.92−0.49
20030.89−0.75−0.980.31
20130.38−0.85−0.880.59
20230.31−0.88−0.900.73
Disclaimer/Publisher’s Note: The statements, opinions and data contained in all publications are solely those of the individual author(s) and contributor(s) and not of MDPI and/or the editor(s). MDPI and/or the editor(s) disclaim responsibility for any injury to people or property resulting from any ideas, methods, instructions or products referred to in the content.

