Article

Study on 2007–2021 Drought Trends in Basilicata Region Based on the AMSU-Based Soil Wetness Index

1
University of Basilicata, Health Science Department, 85100 Potenza, Italy
2
Institute of Geosciences and Earth Resources (IGG), National Research Council (CNR), 56126 Pisa, Italy
3
Basilicata Region, Local Autonomy and Integrated Security Office, 85100 Potenza, Italy
4
University of Science and Technology of Hanoi, Vietnam Academy of Science and Technology, Hanoi 10000, Vietnam
5
Institute of Methodologies for Environmental Monitoring (IMAA), National Research Council (CNR), 85050 Tito Scalo, Italy
*
Author to whom correspondence should be addressed.
Land 2025, 14(6), 1239; https://doi.org/10.3390/land14061239 (registering DOI)
Submission received: 29 April 2025 / Revised: 28 May 2025 / Accepted: 6 June 2025 / Published: 9 June 2025
(This article belongs to the Section Land – Observation and Monitoring)

Abstract

:
Soil moisture (SM) plays a fundamental role in the water cycle and is an important variable for all processes occurring at the lithosphere–atmosphere interface, which are strongly affected by climate change. Among the different fields of application, accurate SM measurements are becoming more relevant for all studies related to extreme event (e.g., floods, droughts, and landslides) mitigation and assessment. In this study, data acquired by the advanced microwave sounding unit (AMSU) onboard the European Meteorological Operational Satellite Program (MetOP) satellites were used for the first time to extract information on the variability of SM by implementing the original soil wetness index (SWI). Long-term monthly SWI time series collected for the Basilicata region (southern Italy) were analyzed for drought assessment during the period 2007–2021. The accuracy of the SWI product was tested through a comparison with SM products derived by the Advanced SCATterometer (ASCAT) over the 2013–2016 period, while the Standardized Precipitation-Evapotranspiration Index (SPEI) was used to assess the relevance of the long-term achievements in terms of drought analysis. The results indicate a satisfactory accuracy of the SWI, with the mean correlation coefficient values with ASCAT higher than 0.7 and a mean normalized root mean square error less than 0.155. A negative trend in SWI during the 15-year period was found using both the original and deseasonalized series (linear and Sen’s slope ~−0.00525), confirmed by SPEI (linear and Sen’s slope ~−0.00293), suggesting the occurrence of a marginal long-term dry phase in the region. Although further investigations are needed to better assess the intensity and main causes of the phenomena, this result indicates the contribution that satellite data/products can offer in supporting drought assessment.

1. Introduction

The ongoing climate crisis threatens communities and natural ecosystems through extreme events. Weather-related phenomena, such as heavy downpours, tornadoes, flash flooding, and heat waves, are usually short-lived and often related to specific regions. Climate-related extreme events often have a lower evolution in the spatiotemporal domain than previous events and may occur because of persistent weather or climate phenomena [1]. Droughts, resulting from prolonged periods of precipitation below the expected normal level for a specific location, are examples of climate-related extreme events. The consequences of these episodes may be worse than those of short-term events. Five main types of droughts have been recognized by the scientific community: meteorological, agricultural, hydrological, socioeconomic, and ecological [2,3,4]. The latest has been introduced recently, and indicates a water level in natural ecosystems beyond the thresholds of vulnerability, threatening the flora, fauna, and ecosystem services [4]. Although each drought type has its own characteristics and impacts, they are closely interconnected and originate from a lack of precipitation. Among them, agricultural drought, namely the one caused by a deficit in soil moisture (SM) during the plant growing season, is the most complex phenomenon, representing one of the main natural risks under a rapidly changing climate [5]; therefore, its monitoring and assessment are crucial for risk management [6]. Italy, given its location in the middle of the western Mediterranean and its peculiar shape, extending over a wide latitude from north to south, is affected by drought events involving the Mediterranean area, particularly from 1980 onwards [7]. In recent years, it experienced a prolonged drought period between 2021 and 2023, affecting almost the entire country, similar to those that occurred in 2017–2018 and 2011–2013, mostly related to changes in precipitation patterns due to atmospheric circulation variation [8]. Other recent studies investigating the drought impact in Italy have mostly focused on specific areas, such as the Po Plain [9], central Italy [10], Calabria [11], and Umbria [12], leaving room for further studies related to specific areas or regions.
In recent years, remote sensing-based approaches have been widely demonstrated to provide reliable SM measurements with a good trade-off between temporal and spatial resolution, which is useful for many applications concerning water cycle management [13,14,15,16,17]. Satellite-based SM products acquired by several active and/or passive sensors have already been applied to drought assessment and monitoring at different spatial scales (e.g., [6,18,19,20]). Focusing only on SM products generated using “pure” satellite-based records, data acquired by the sensors aboard the Soil Moisture and Ocean Salinity (SMOS) and Soil Moisture Active Passive (SMAP) missions as well as by the Advanced Microwave Scanning Radiometer (AMSR-E) and its next generation (AMSRE-2) or the Advanced SCAtterometer (ASCAT) have recently been used to evaluate drought conditions [21,22,23,24,25,26,27,28,29,30,31,32,33,34,35,36,37]. In these studies, different approaches were considered, working on daily soil moisture products as well as on SM anomalies or considering their aggregation at different temporal scales for investigating spatial scales ranging from regional to global, highlighting the relevant contribution of satellite-based SM measurements for drought assessment and management. Almost all these sensors have been developed specifically for SM retrieval, exploiting the lower frequency microwave spectral region, which assures high soil penetration, in any case not deeper than 10 cm in the L-band (1.6 Ghz) as well as less perturbation from atmospheric constituents and vegetation cover [30]. A few issues have affected these sensors after their launch, such as radio frequency interference (RFI) in the L- and X-bands limiting the areal coverage of SMOS and AMSR-E as well as the failure of the radar onboard SMAP that limited the accuracy of SM retrieval [32]. Moreover, all of these sensors typically have low native spatial resolution (25–50 km for SMOS, 36 km for SMAP, 38–50 for AMSRE, 25–34 km for ASCAT), which are improved in the postprocessing process, attempting to minimize the effect of the different and heterogeneous elements present in the satellite footprint [13,22,28]. Therefore, other satellite sensors, such as the Special Sensor Microwave/Imager (SSM/I, [38]), WindSat [39], and the Advanced Microwave Sounding Radiometer (AMSU, [40]), with similar characteristics but not specifically aimed at retrieving SM, have been used.
Focusing on AMSU, which was mostly developed for atmospheric sounding at approximately 50 km spatial resolution, Lacava et al. [40] demonstrated its potential for SM monitoring by exploiting two of the available window channels of the sensors [41]. Specifically, the difference between the brightness temperatures measured at channel 15 (89 Ghz) and channel 1 (23 GHz), defined as the soil wetness index (SWI), was used for this purpose, exploiting the variation in the surface emissivity of wetter soil at these two frequencies [42]. This index was standardized following the Robust Satellite Techniques (RST—[43]) philosophy to develop the soil wetness variation index (SWVI). The latter has been used with satisfactory results for monitoring the daily SM variability at a 20 km spatial resolution in correspondence with several flooding events that previously occurred in Europe [40,44,45]. Both the SWI and SWVI were previously computed using data acquired by the National Oceanic and Atmospheric Administration (NOAA) satellites and have been successfully tested and compared with in situ and modeled data to assess their capability of describing the soil moisture variability [46,47]. In addition to being onboard NOAA satellites since 1998, the AMSU has been aboard the Meteorological Operational Satellite (MetOp) constellation of satellites since 2006, when MetOp-A began its acquisitions. Thereafter, the radiometer has been flying on MetOp-B since 2012 and MetOp-C since 2018, hence assuring long-term historical series fundamental for trend and climatological analyses. In this study, we aimed to test the potential of SWI when computed using MetOp data to infer information about SM variability that is useful for drought assessments. In contrast to the previous studies, in this work, apart from assessing whether the AMSU-MetOp signal can confirm the accuracy of the SWI, we focused on monthly scale data and a larger spatial scale of investigation without applying the RST approach. The Basilicata region (southern Italy) was considered as the area of interest for this study. Even if several studies based on satellite data have already demonstrated that some areas of this region are particularly prone to land degradation [48,49,50] as well as the occurrence of agricultural area abandonment [51], there has not been a work, to our knowledge, which used remote Earth observation data to assess the drought risk of the entire Basilicata region.
Unfortunately, there are no ground-based SM measurements available for the region; hence, we assessed the accuracy of the SWI when computed using both MetOp-A and -B data, considering a well-established SM product developed using data acquired by the ASCAT instrument [23,52,53] onboard MetOp satellites, whose high-quality performance at the European ecoregion scale has recently been confirmed [13]. The almost equivalent and sometimes better accuracy of the ASCAT SM product with respect to SMAP, SMOS, and AMSRE has largely been demonstrated [28,54,55], confirming its high reliability. Furthermore, flying together with AMSU on MetOp satellites, ASCAT permits useful coherence in terms of orbits and observation conditions, allowing for more consistent comparisons. Although we are aware that such an approach might introduce some uncertainty related to potential errors affecting ASCAT SM data, we did not consider other methods, such as a multi-sensor validation strategy or a cross-comparison with independent ground measurements, because they were beyond the scope of this paper. Once the reliability of the MetOp-AMSU-based SWI was assessed and the long-term trends were determined, we used the Standardized Precipitation Evapotranspiration Index (SPEI, [56]) to assess the potential of historical SWI variability over the period 2007–2021 in being considered as a potential indicator of drought occurrence. Understanding the sources and changes in regional droughts is extremely relevant for areas with high agricultural vocation, such as the Basilicata region, where the spatiotemporal dynamics of droughts have not been studied extensively. In this context, long-term satellite-based robust soil moisture measurements can provide useful support.

2. Materials and Methods

2.1. The Study Area

The Basilicata region is located in southern Italy (Figure 1). The territory of Basilicata is mainly mountainous (47%) and hilly (45%), with a small flat percentage (8%), mostly concentrated on the Metaponto Plain. The major mountains, with heights of up to 2250 m (Monte Pollino), belong to the Lucanian Apennines and are located in the central and western sectors of the region [57]. Climatic conditions are specifically related to the complex orography of the region, with mountain and hill areas (i.e., above 800 asl) characterized by a temperate-cool climate with dry summers, while the remaining sectors of the region typically show Mediterranean features [58,59]. The average rainfall, which shows a typical seasonal variability with high precipitation in winter and lower in summer, ranges from 529 mm to 2000 mm, and the southwest sector of the region is more affected by precipitation [57]. The evolution of the territory has mostly been related to the activity of the five main rivers flowing in the northwest–southwest direction, starting from the western sector of the region: Sinni, Agri, Cavone, Basento, and Bradano [60]. The Sinni originates on the eastern slopes of Mount Sirino and flows through the far south of Basilicata. Its basin, covering approximately 1292 km2, is characterized by Apennine reliefs with limestone and sandstone/clay formations. The Agri River, with a basin area of 1770 km2, runs through mountainous and hilly areas composed primarily of sedimentary rocks. The Cavone River has a basin of 675 km2 and originates in the central-southern mountainous area of Basilicata. Its torrential regime is influenced by the region’s geological characteristics, which are primarily composed of sedimentary rocks. The Basento River, the longest in Basilicata, has a basin area of 1537 km2. It rises in the northern sector of the region and crosses various geological formations including limestone and clay-rich rocks. The Bradano River, with a basin area of 2765 km2, runs through areas with sedimentary and alluvial substrates. Orography and distance from the sea are the main factors affecting the extent and type of land cover in the region (Figure A1). Dense forests, grass, and pastures are located in mountainous areas, and sparsely vegetated areas dominate the central-eastern part of the region. Moreover, anthropic covers devoted to agriculture are prevalently located in lowland areas [57].

2.2. Data Source

2.2.1. Satellite Dataset

The AMSU can acquire data in 20 channels in the microwave spectral region, with a native spatial resolution of 50 km due to two different modules (A and B) [41]. Although the AMSU spectral features are not ideal for soil moisture retrieval, some of its channels (those at 23.8, 31.4, 50.3, 89.0, and 150.0 GHz) are localized in window regions [61] and can provide information on land surface parameters [62] such as soil moisture [42].
The relationship between surface emissivity and soil water content is well-established. Primarily, adding water to the soil decreases the surface emissivity [63]; for the same soil water content, the emissivity is higher at higher frequencies [64]. Specifically, the slope between the low and high frequencies directly responds to the amount of radiating surface that is liquid water [65,66]. In the presence of water, any surface can be viewed as a combination of dry soil and water, with f representing the fractional amount of the water-covered area within an AMSU pixel. Then, the microwave emissivity of the wet soil in each pixel can be calculated as follows [65]:
ε w s = ( 1 f )     ε d s + ε w s f = ε d s f ( ε d s ε w )
where εws, εds, and εw are the emissivity of wet soil, dry soil, and water. As the fractional amount of wet soil increases, the emissivity decreases, and the difference between the low and high frequencies increases [65]. This behavior is the basis of the SWI, which is built on the basis of the difference between two AMSU channels, as follows:
S W I x , y = T 89 ( x , y ) T 23 ( x , y )
where T is the brightness temperature measured in the AMSU channels 15 (89.0 Ghz) and 1 (23 Ghz) measured in the cell (x,y). Positive and high values (at least >5 K) of SWI are expected in the presence of wet soil [42]. One general assumption of the SWI is that roughness and vegetation, unlike soil moisture, have the same effects on microwave radiances measured in the AMSU channels at 89 and 23 GHz. Therefore, these site effects should not affect the capability of the SWI to discriminate between dry and wet soils. Regarding soil penetration, working in the K band, the AMSU can provide information about the first 1–2 cm of soil, slightly lower than sensors working in the C- and X-band. Finally, it is worth mentioning that, like other sensors working in the microwave region, the orography variability may impact the accuracy of SM retrieval at the pixel level. A spatial average over a larger area can help reduce this effect.
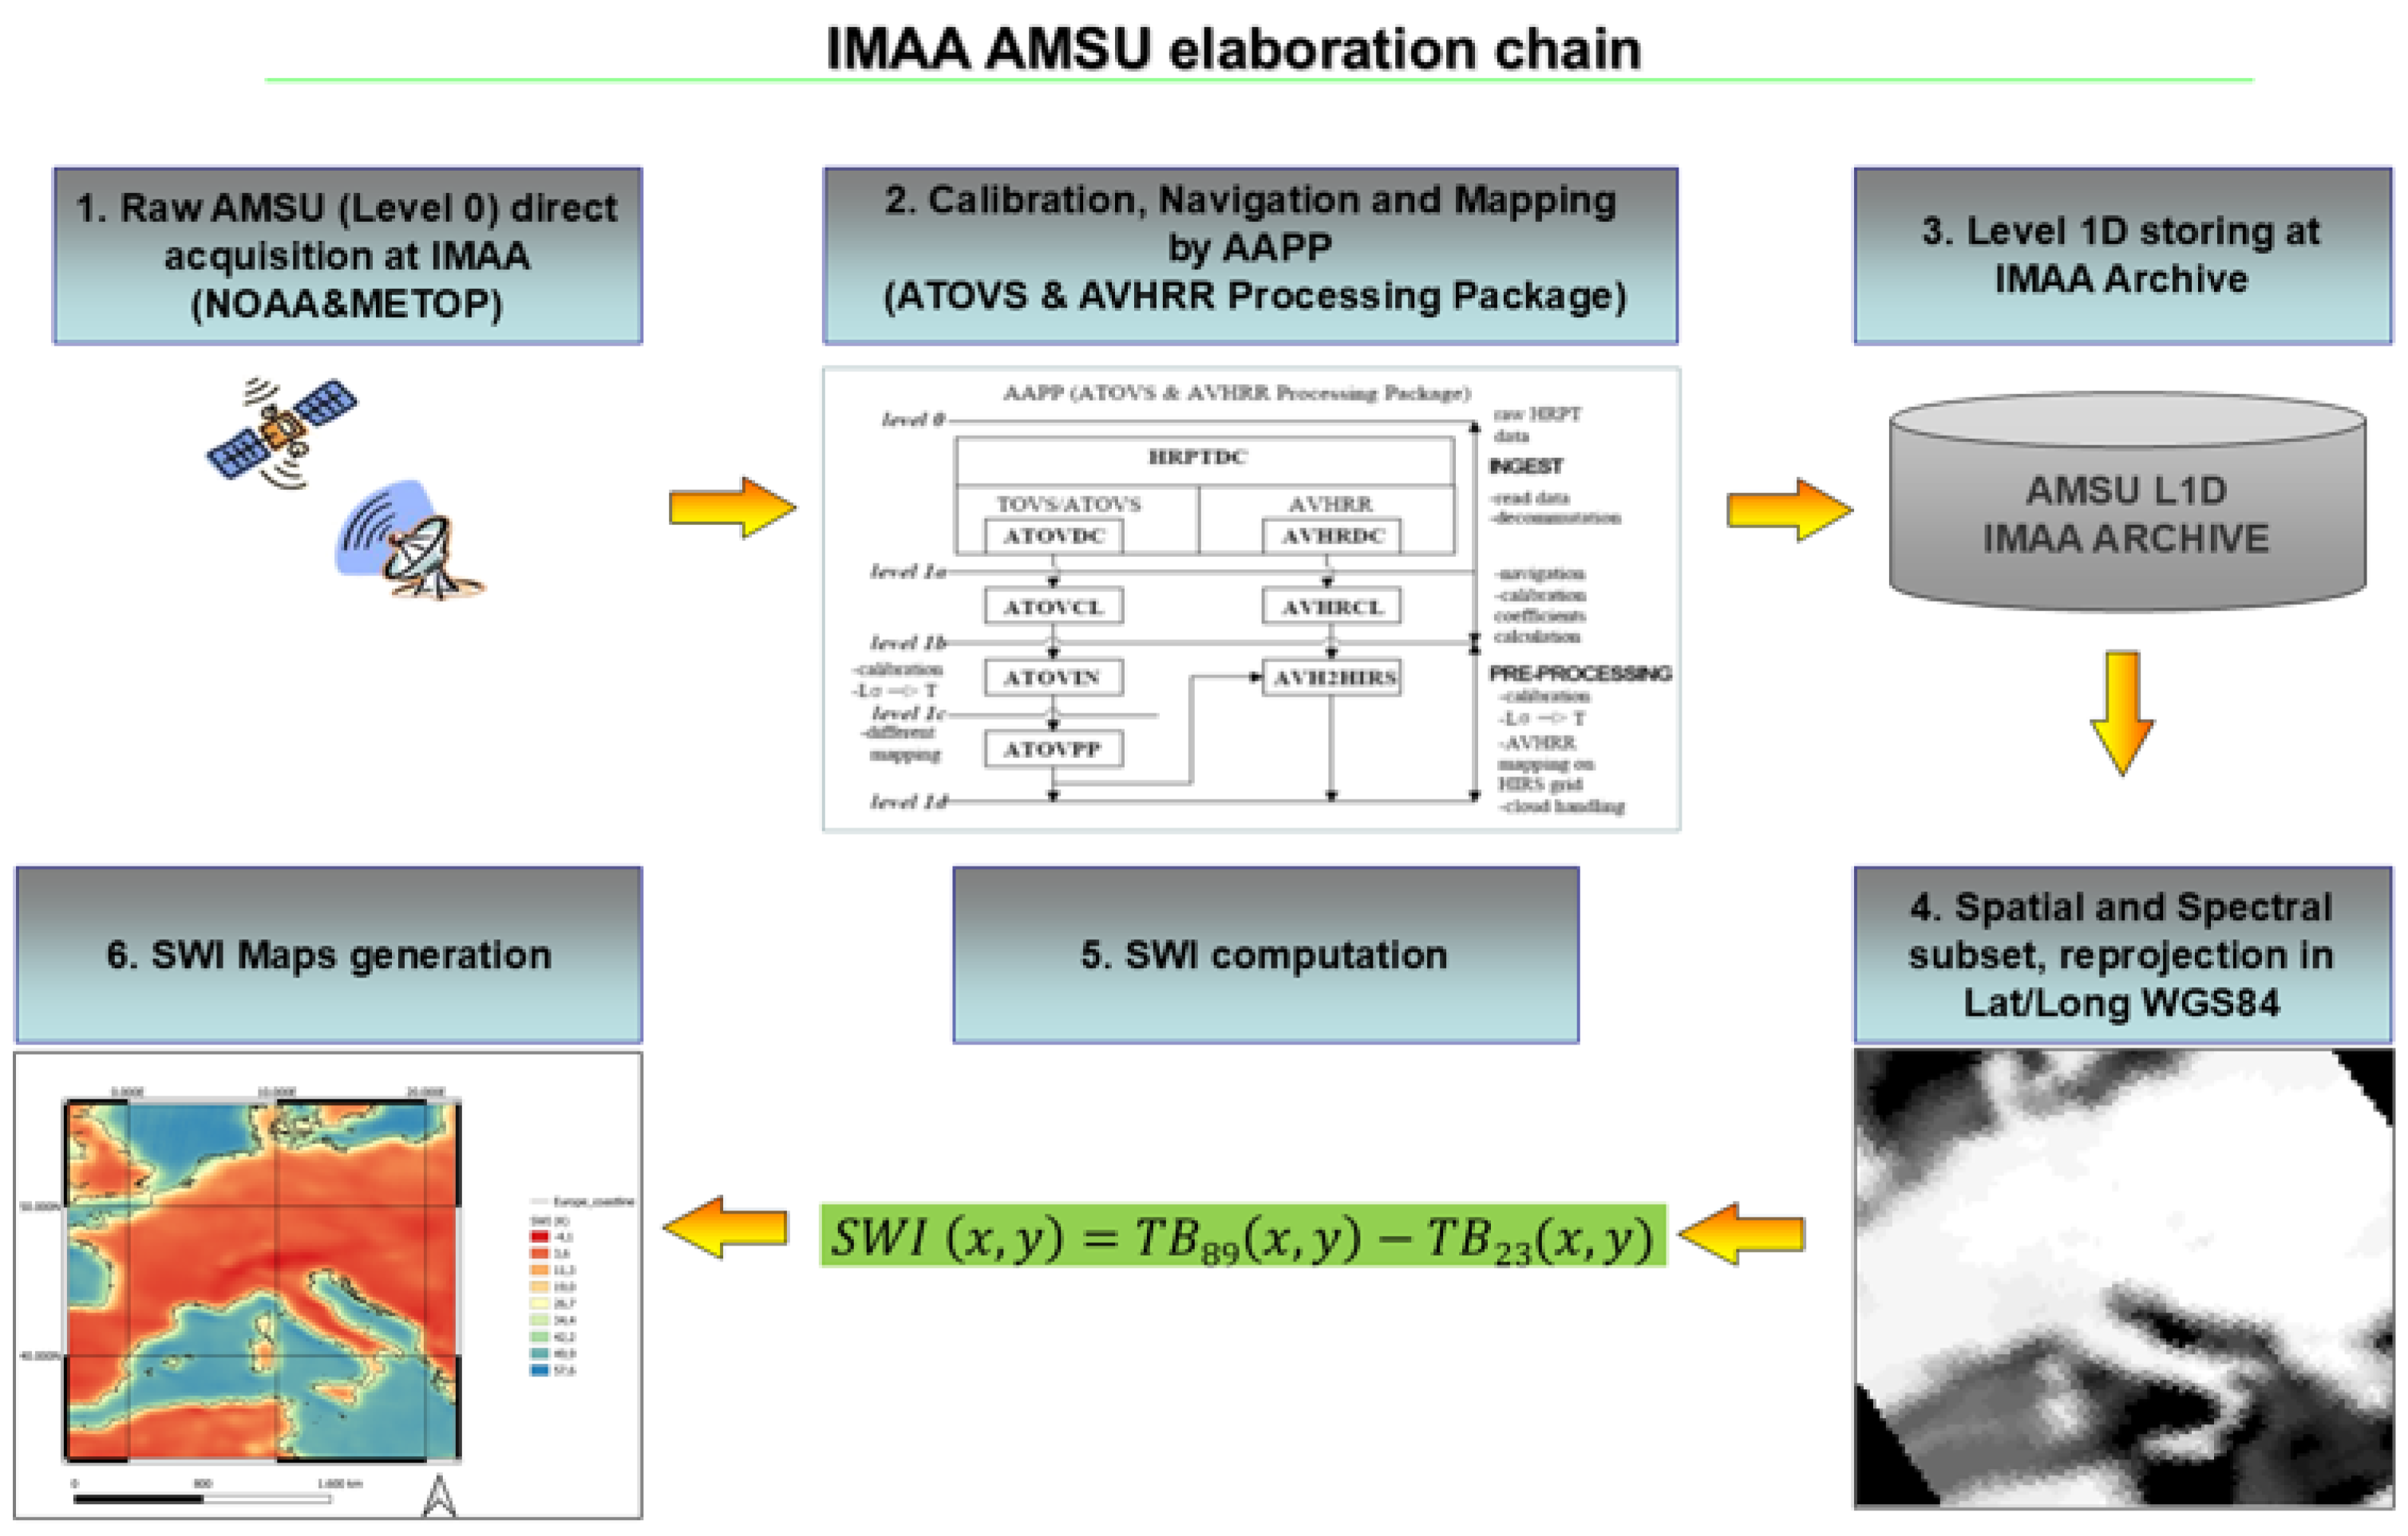
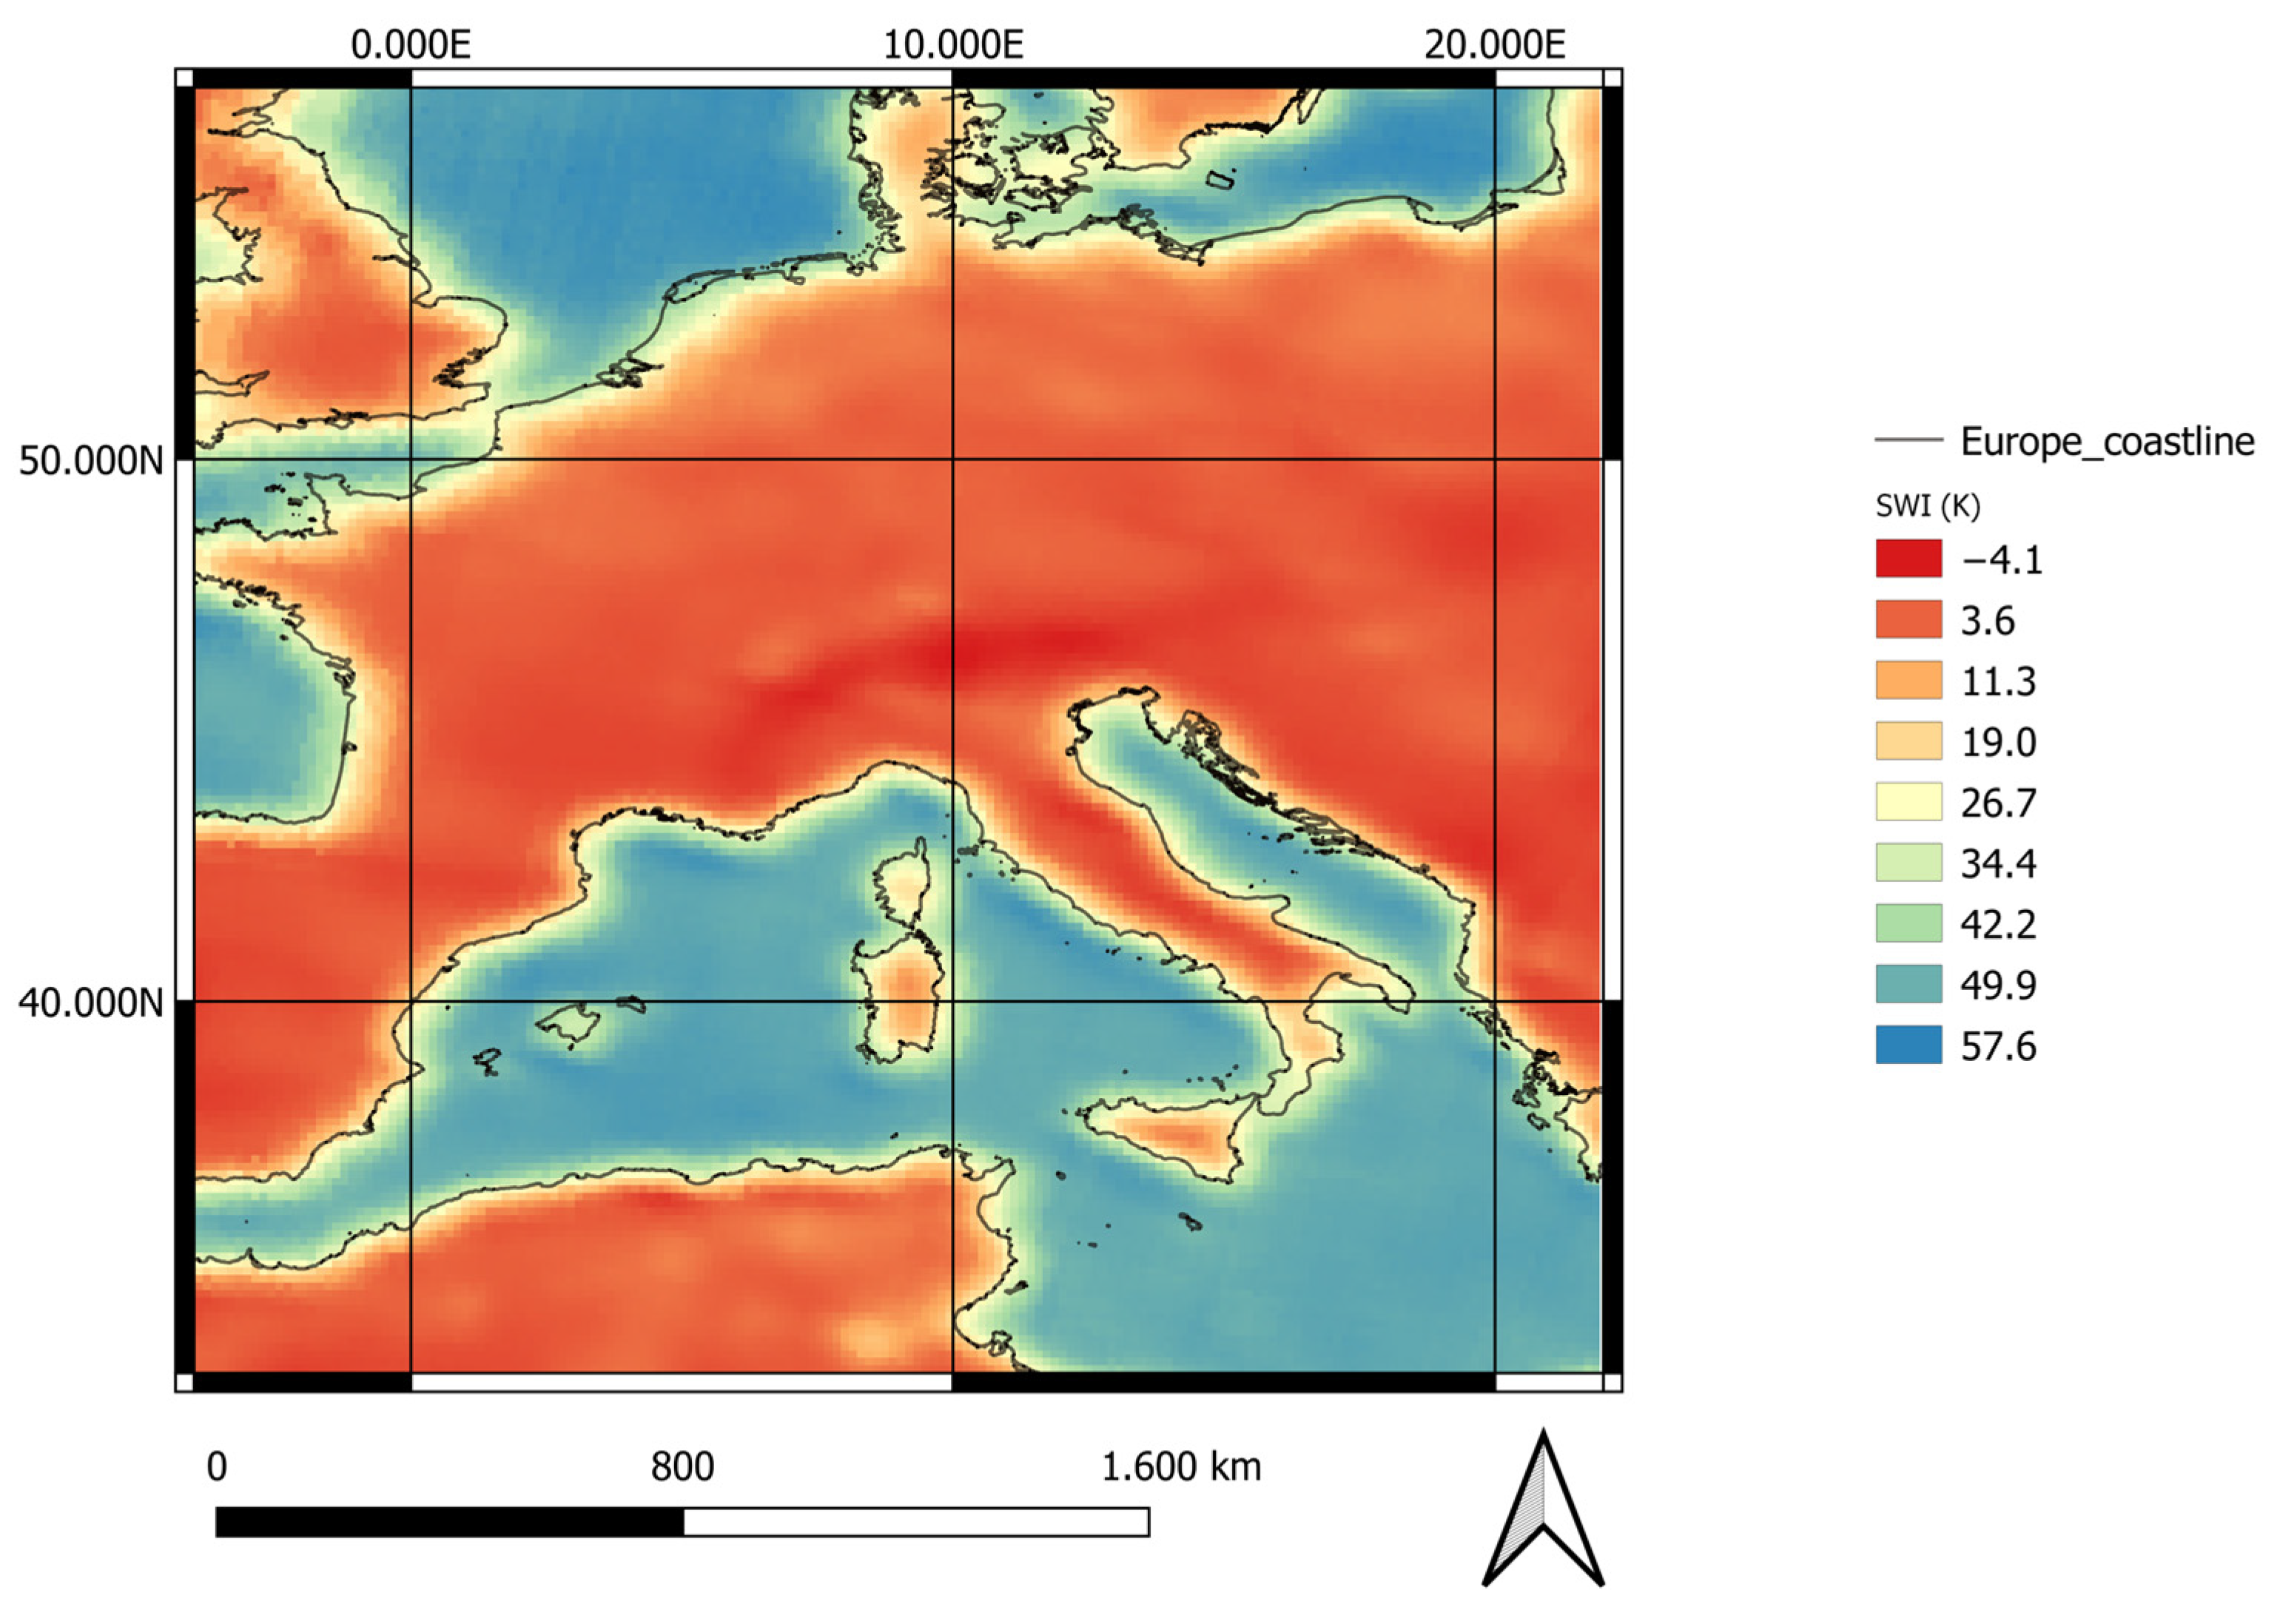
This study used data directly collected and processed at the satellite receiving station of the Institute of Methodologies for Environmental Analysis (IMAA) of the Italian National Research Council (CNR), located in Tito Scalo, close to Potenza, the capital of the Basilicata region (Figure 1). The acquired raw data were processed using the ATOVS and AVHRR Pre-processing Package (AAPP) software [67]) to produce Level1D records, which consisted of calibrated, navigated, and mapped data. In more detail, the AMSU data calibrated in brightness temperature were mapped at the spatial resolution of the High-Resolution Infrared Radiation Sounder (HIRS), namely at 20 km. The produced L1 data were stored in the IMAA archive. Several automatic Level2 elaboration chains, written in Bash Shell and the Fortran language, performed further steps devoted to the data subset in the spatiotemporal domain as well as to the SWI computation. A specific LAT-LONG WGS84 grid with a spatial resolution of 20 km covering the entire Mediterranean area was used to save the images. An example of an SWI map is shown in Figure 2, and the entire processing is depicted in Figure A2. In Figure 2, the high sensitivity of the SWI to water was confirmed by the high values achieved for seawater.
The collected historical series were limited by a few instrumental issues, such as those related to the High Resolution Picture Transmission (HRPT) transmitter onboard MetOp-A since 2007, which forced the transmission of nighttime (descending pass) data over Europe to stop [68] as well as the failure of the MetOp-B AMSU channel 15 in October 2016 [69]. In early April 2021, a failure at the shaft encoder of the IMAA antenna stopped the acquisition for almost nine months, thereby interrupting the long-series acquisition. Table 1 summarizes the availability of MetOp-A and-B data at the IMAA archive, highlighting that a comparison between ascending and descending orbits can be carried out considering MetOp-B data from the 2013 to 2016 period, and an intercomparison between the two satellites should be based on ascending data acquired in the same period. MetOp-A data in the ascending orbit can be used for long-term trend analysis.
ASCAT is another instrument onboard MetOp satellites that has been widely used to infer SM information [23,52,53]. It is a real-aperture radar system operating in the C-band (VV polarization) using three fan-beam antennas with different incident angles. The main geophysical parameter sensed by ASCAT is the backscatter coefficient σ°, whose variability is strongly influenced by the presence of water in the soil. Wet soils tend to exhibit higher backscatter than dry soils because of the increased dielectric properties of water [70].
In this study, we used H115 and H116 data, which consist of daily soil moisture products at a 12.5 km spatial resolution in the discrete global grid [71]. H115 covers the period 2007–2018, with H116 adding the interval 2019–2022. MetOp-B ASCAT data have been integrated since 2013 with those from MetOp-A, which have been available since 2007, to enlarge the data archive. The EUMETSAT H SAF TU Wien soil moisture retrieval algorithm [53,70] was used to derive the relative surface soil moisture information from long-term backscatter measurements. In this approach, soil moisture is considered to have a linear relationship to backscatter in the decibel space, while the noise sources include the instrument noise, speckle, and azimuthal anisotropies. The surface roughness is assumed to have a constant contribution over time and is therefore not accounted for in the change detection algorithm. By knowing the typical yearly vegetation cycle and how it influences the backscatter-incidence angle relationship for each location on Earth, the vegetation effects can be removed [70], revealing variations in soil moisture. The relative surface soil moisture estimates are represented in degrees of saturation ranging between 0% (completely dry) and 100% (completely saturated) and were derived by scaling the normalized backscatter between the lowest/highest backscatter values corresponding to the driest/wettest soil conditions, respectively. ASCAT SM daily products were collected in the same temporal interval as the AMSU data. The available metadata were used to separate the MetOp-A from the MetOp-B data as well as ascending from descending orbits. It is worth noting that we used ASCAT data to assess the AMSU-based SM product accuracy because reliable in situ measurements were not available for the Basilicata region.

2.2.2. SPEI Data

Various indicators have been developed and implemented for drought monitoring. Among them, one of the most reliable and widely used is the Standardized Precipitation–Evapotranspiration Index (SPEI), which is a long-term meteorological indicator with precipitation and temperature as the input parameters, the quality of which clearly affects the SPEI accuracy, especially in data-sparse areas [56]. Recent studies in Italy (e.g., [9,11] also indicated the good performance of the indicator for comparison with the Standardized Precipitation Index (SPI), although it might not reflect fine-scale drought dynamics in complex terrains like Basilicata. However, working at a monthly temporal scale, we were less interested in high-frequency drought changes.
Historical SPEI time series were easily obtained from the Global SPEI Database [72] with a spatial resolution of 0.5° and a monthly time resolution. This index uses the AO-56 Penman–Monteith estimation of potential evapotranspiration [72]. The SPEI 01 series from 2007 to 2021 for the six pixels covering most of the Basilicata region (Figure 1) was downloaded, and the monthly spatial average for the entire region was calculated. We chose SPEI 01 to provide a more homogeneous comparison with the SWI, which was developed to infer short-term changes in soil moisture.

2.3. Method

The flowchart of the proposed methodology is shown in Figure 3, and the main steps are described below.
The AMSU-based SWI was computed at the pixel level on a daily scale for ascending or descending orbits, and the monthly temporal mean for the investigated periods was then computed. Once all the maps were produced, the spatial average was computed at the scale of each watershed and at the scale of the Basilicata region. Among the 56 AMSU pixels covering the entire region, 11 were related to the Basento River Basin, 4 to Cavore, 8 to Sirino, and 14 to Bradano. Due to the small size of the Cavone River Basin as well as its continuity and homogeneity in terms of climatic conditions and soil features with the Basento Basin, we considered one single basin as the sum of 11 + 4 pixels, referring to it hereafter as the Basento Basin. The number of processed images depends on the length of the analyzed historical series, as described in Table 1. For the MetOp-A data in the ascending orbit, we produced a maximum of 314 SWI maps/values for each of the river basins investigated [Sinni, Agri, Basento (and Cavone), and Bradano], one for each month of the year from May 2007 to March 2021, for a total of approximately 4500 images analyzed. For the MetOp-B data, we produced a maximum of 46 SWI maps/values for each orbit, one for each month of the year from January 2013 to October 2016, analyzing approximately 2500 images. To avoid any signal perturbation in the detected trends, we performed a quality check analysis focused on assessing the impact of the number of images used for monthly map generation. A threshold of 70% of daily imagery for a month (approximately 20 images) was found to be robust enough to ensure consistent achievements. Considering that in the next steps we conducted a comparison only for common months, there was no concern with this restrictive choice, which allowed us to perform a more robust analysis. Considering the data used in the first part of the paper, the one related to the 2013–2016 period, only two months were discarded from the analysis, namely December 2013 and May 2014. For the long-term trend analysis, gaps were related to several periods: September–December 2011, August–September 2012, April–May 2014, September–November 2016, and June 2019, indicating that the fall season was the most affected season (twice over the 15-year period investigated).
ASCAT H115 and H116 data were processed to assure that the historical series co-located with the AMSU data in the spatiotemporal domain. To this aim, after stratifying the daily data based on the platform and orbits, the SM values at each of the EASE Grid nodes were extracted and resampled at the same grid of the AMSU-MetOp data by the nearest-neighbor method using a routine written in R language. Then, the same scheme used for the SWI was applied, first computing the monthly temporal mean at the pixel scale, and then the spatial average at the scale of each of the investigated watersheds. The AMSU ASCAT time series was completed over the investigated period and was more populated than the IMAA AMSU MetOp series because the latter suffers from some gaps due to the overlapping of several satellites with different priorities at the IMAA satellite station, which limited the MetOP acquisitions as well as some interruptions related to short-term technical issues.
Once the trends for all of the analyzed signals and periods of interest (see Table 1) were computed, we moved to their assessment as follows:
  • SWI MetOp-B data—2013–2016: Agreement between series achieved considering diurnal (ascending) and nighttime (descending) orbits at the river basin scale. An intra-comparison between the basins was also conducted.
  • SWI MetOp-A and -B data—2013–2016: Agreement between series achieved by considering nighttime (descending) orbits at the river basin scale.
  • SWI MetOp-A and -B data, SM ASCAT MetOp-A and -B data—2013–2016: Agreement between series achieved by considering nighttime (descending) orbits at the river basin scale
  • SWI MetOp-A—2007–2021: Analysis of the long-term trend of SWI variability for MetOp-A data in ascending orbits at the regional scale, also performing an intra-comparison between the basins. Finally, a comparison was made using SPEI measurements.
The latter analysis was performed by spatially averaging both the monthly SWI data and SPEI output at the Basilicata region scale. For the SWI, we used the data available for all 56 AMSU pixels covering the region, whereas for the SPEI, such a value was achieved as the spatial average of the six cells highlighted in Figure 1. Even if spatial averaging the values may smooth the series, reducing the opportunity to identify some high frequency signal, it allows for the impact of the mismatch between the original spatial resolution of the data to be reduced.

Statistical Analysis

We performed different analyses to investigate the behavior of the data studied. The obtained trends were analyzed in terms of p-values to assess their statistical significance. Furthermore, the Durbin–Watson [73] and Shapiro–Wilk [74] tests were performed to assess the level of autocorrelation and the distribution of the series. The agreement between the produced time series was then assessed using the Pearson coefficient of correlation [75], the root mean square (RMSE) and the normalized root mean square (NRMSE). The latter, computed by normalizing the RSME by the difference between the highest and lowest values of the series, was used when comparing different signals such as the AMSU-based SWI and ASCAT-based SM. All of these tests were performed by using the free and open Jamovi Desktop tool [https://www.jamovi.org/] and considered only common months between the investigated signals.
For the 2007–2021 analysis, namely that linked to drought assessment, further tests were performed to evaluate the general behavior of the detected trends, such as the linear slope regression and Sen’s slope [76], with the latter being less affected by outliers than the former, resulting in a more robust test than the linear regression test. All tests were implemented in Python 3.9.5. The SWI trends achieved for the four investigated basins over the 15-year period were also analyzed in terms of confidence level. To this aim, the multitemporal SWI mean and standard deviation were computed at the pixel level and at the monthly scale, and the spatial average was then computed. Finally, the 2007–2021 trend, computed by averaging data at the regional scale, was subjected to a time-series decomposition using a standard multiplicative model to assess the effect of seasonality on the detected trend. To achieve this aim, the gaps in the time series were filled by considering the previously achieved multitemporal mean values for the missing months. If the SWI map/value for June 2019 was not computed, its value was obtained as the spatial mean of the multitemporal average computed using all of the SWI data recorded for June from 2007 to 2020.
The results of the above-mentioned tests are reported in Appendix A.

3. Results

The different analyses performed and the results obtained are described in detail in the following sections. In the graphs shown in Section 3.1, Section 3.2 and Section 3.3, information about the achieved Pearson coefficient, RMSE or NMRSE, and the p-value is reported. When both series had p-values < 0.001, this information was indicated only once. All of these outputs together with the results of the Durbin–Watson and Shapiro–Wilk were also reported in the corresponding images in Appendix A. It is worth noting that all of the series had Shapiro–Wilk values close to 1, satisfying the normality test, which justified the use of the Pearson coefficient as a reliable test for the correlation assessment as well as for the definition of the confidence level considered in Section 3.4.

3.1. The Consistency of SWI Product

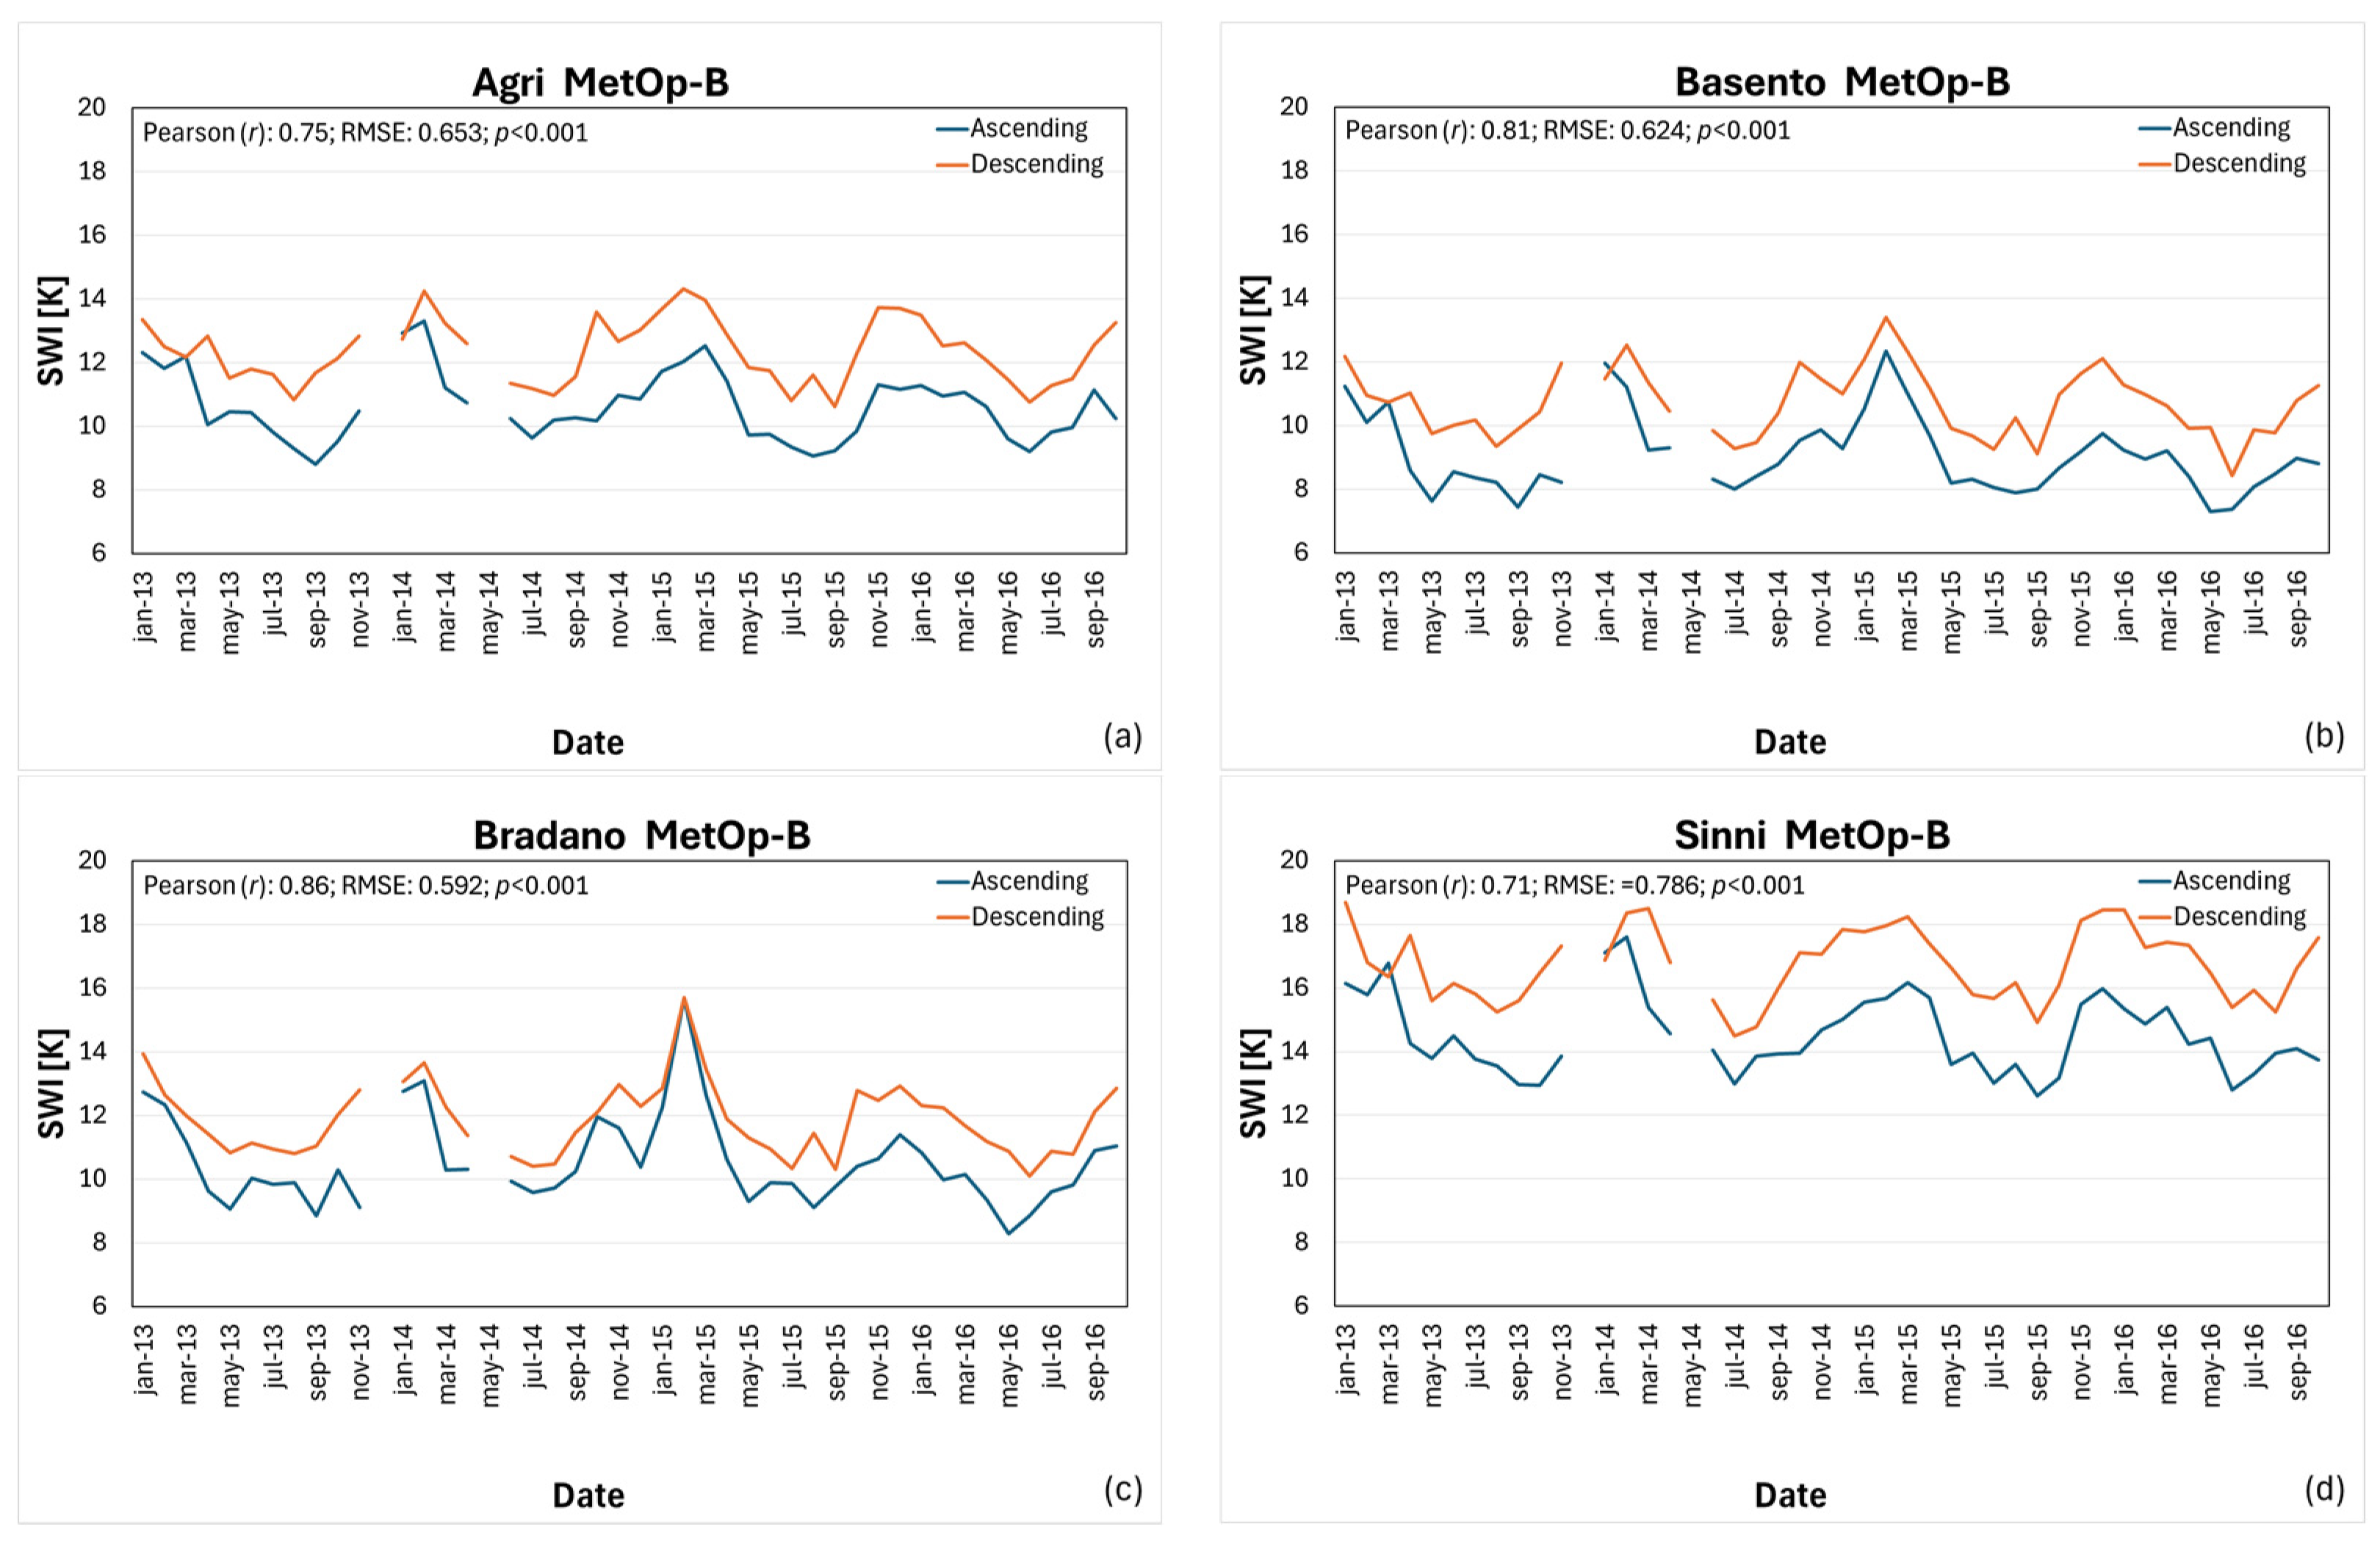
The first analysis focused on assessing the consistency of the SWI when using the same platform, namely MetOp-B, but considered the ascending and descending orbits separately in the 2013–2016 period. In Figure 4, the SWI trends for the ascending and descending orbits are shown for each basin, whereas in Figure A3, all of the results of the statistical analysis are reported. All trends had p-values < 0.001, indicating their statistical significance, and the Shapiro–Wilk test results were close to 1, satisfying the normality test. Durbin–Watson tests were very close to 2, indicating almost no autocorrelation, or a very small positive or negative autocorrelation of the considered trends.
A clear seasonality was evident in all graphs, with the highest values recorded during the rainy season (i.e., winter) and the lowest values in the driest period of the year. As expected, higher mean values were obtained for the descending (i.e., nighttime) passes because the ascending passes were affected by the solar radiation contribution, which tends to dry the soil. The Sinni Basin (Figure 4b) showed a higher SWI time series, indicating that the area was wetter than the other three regions. This result is consistent with the precipitation features of the region, with the southwestern sector being more affected by rain as well as the geological features of the Sinni catchment, which has a higher limestone formation than the others. The trends showed very high similarity, apart from some intra-and inter-shifts in a few positive/negative peaks, indicating a time-lag in and among the basin behaviors. The highest SWI values were recorded in all basins in February and March 2013 and 2015, respectively. In any case, the good agreement between the trends was confirmed by the Pearson coefficient of correlation r, which ranged from 0.71 for Sinni to 0.85 for Bradano. The highest variability in the orography of the Sinni River Basin explains this achievement. A low RMSE error was found, generally around 0.6 K and was not higher than 0.8 K for the Sinni River Basin, confirming the low level of discrepancy between the measured series. In the absence of any intercalibration between the data acquired in diurnal and nighttime conditions, the achieved difference may be associated mostly with this variability. Such an analysis was not useful in the context of this study, nor one focused on assessing the impact of seasonality on the achieved short-term trends, because in this section, we only assessed the consistency of the AMSU-based SWI regardless of the orbit.
Further analysis focused on assessing the intercorrelations among the basins. Table 2 presents the corresponding matrix of the obtained correlation coefficients (r). Contiguous basins showed higher correlations than distant basins, indicating their high similarity in precipitation patterns and soil characteristics. Furthermore, all basins showed a high correlation with the analysis performed at the whole Basilicata region scale, suggesting good representativeness of the mean conditions of the investigated area. In the absence of any spatial statistical testing, it is quite difficult to understand whether observed correlations reflect true physical processes or merely spatial redundancy due to the proximity of the measurement units. This aspect will be the object of future investigation,

3.2. Correlation of SWI Variations by Using Different Satellites

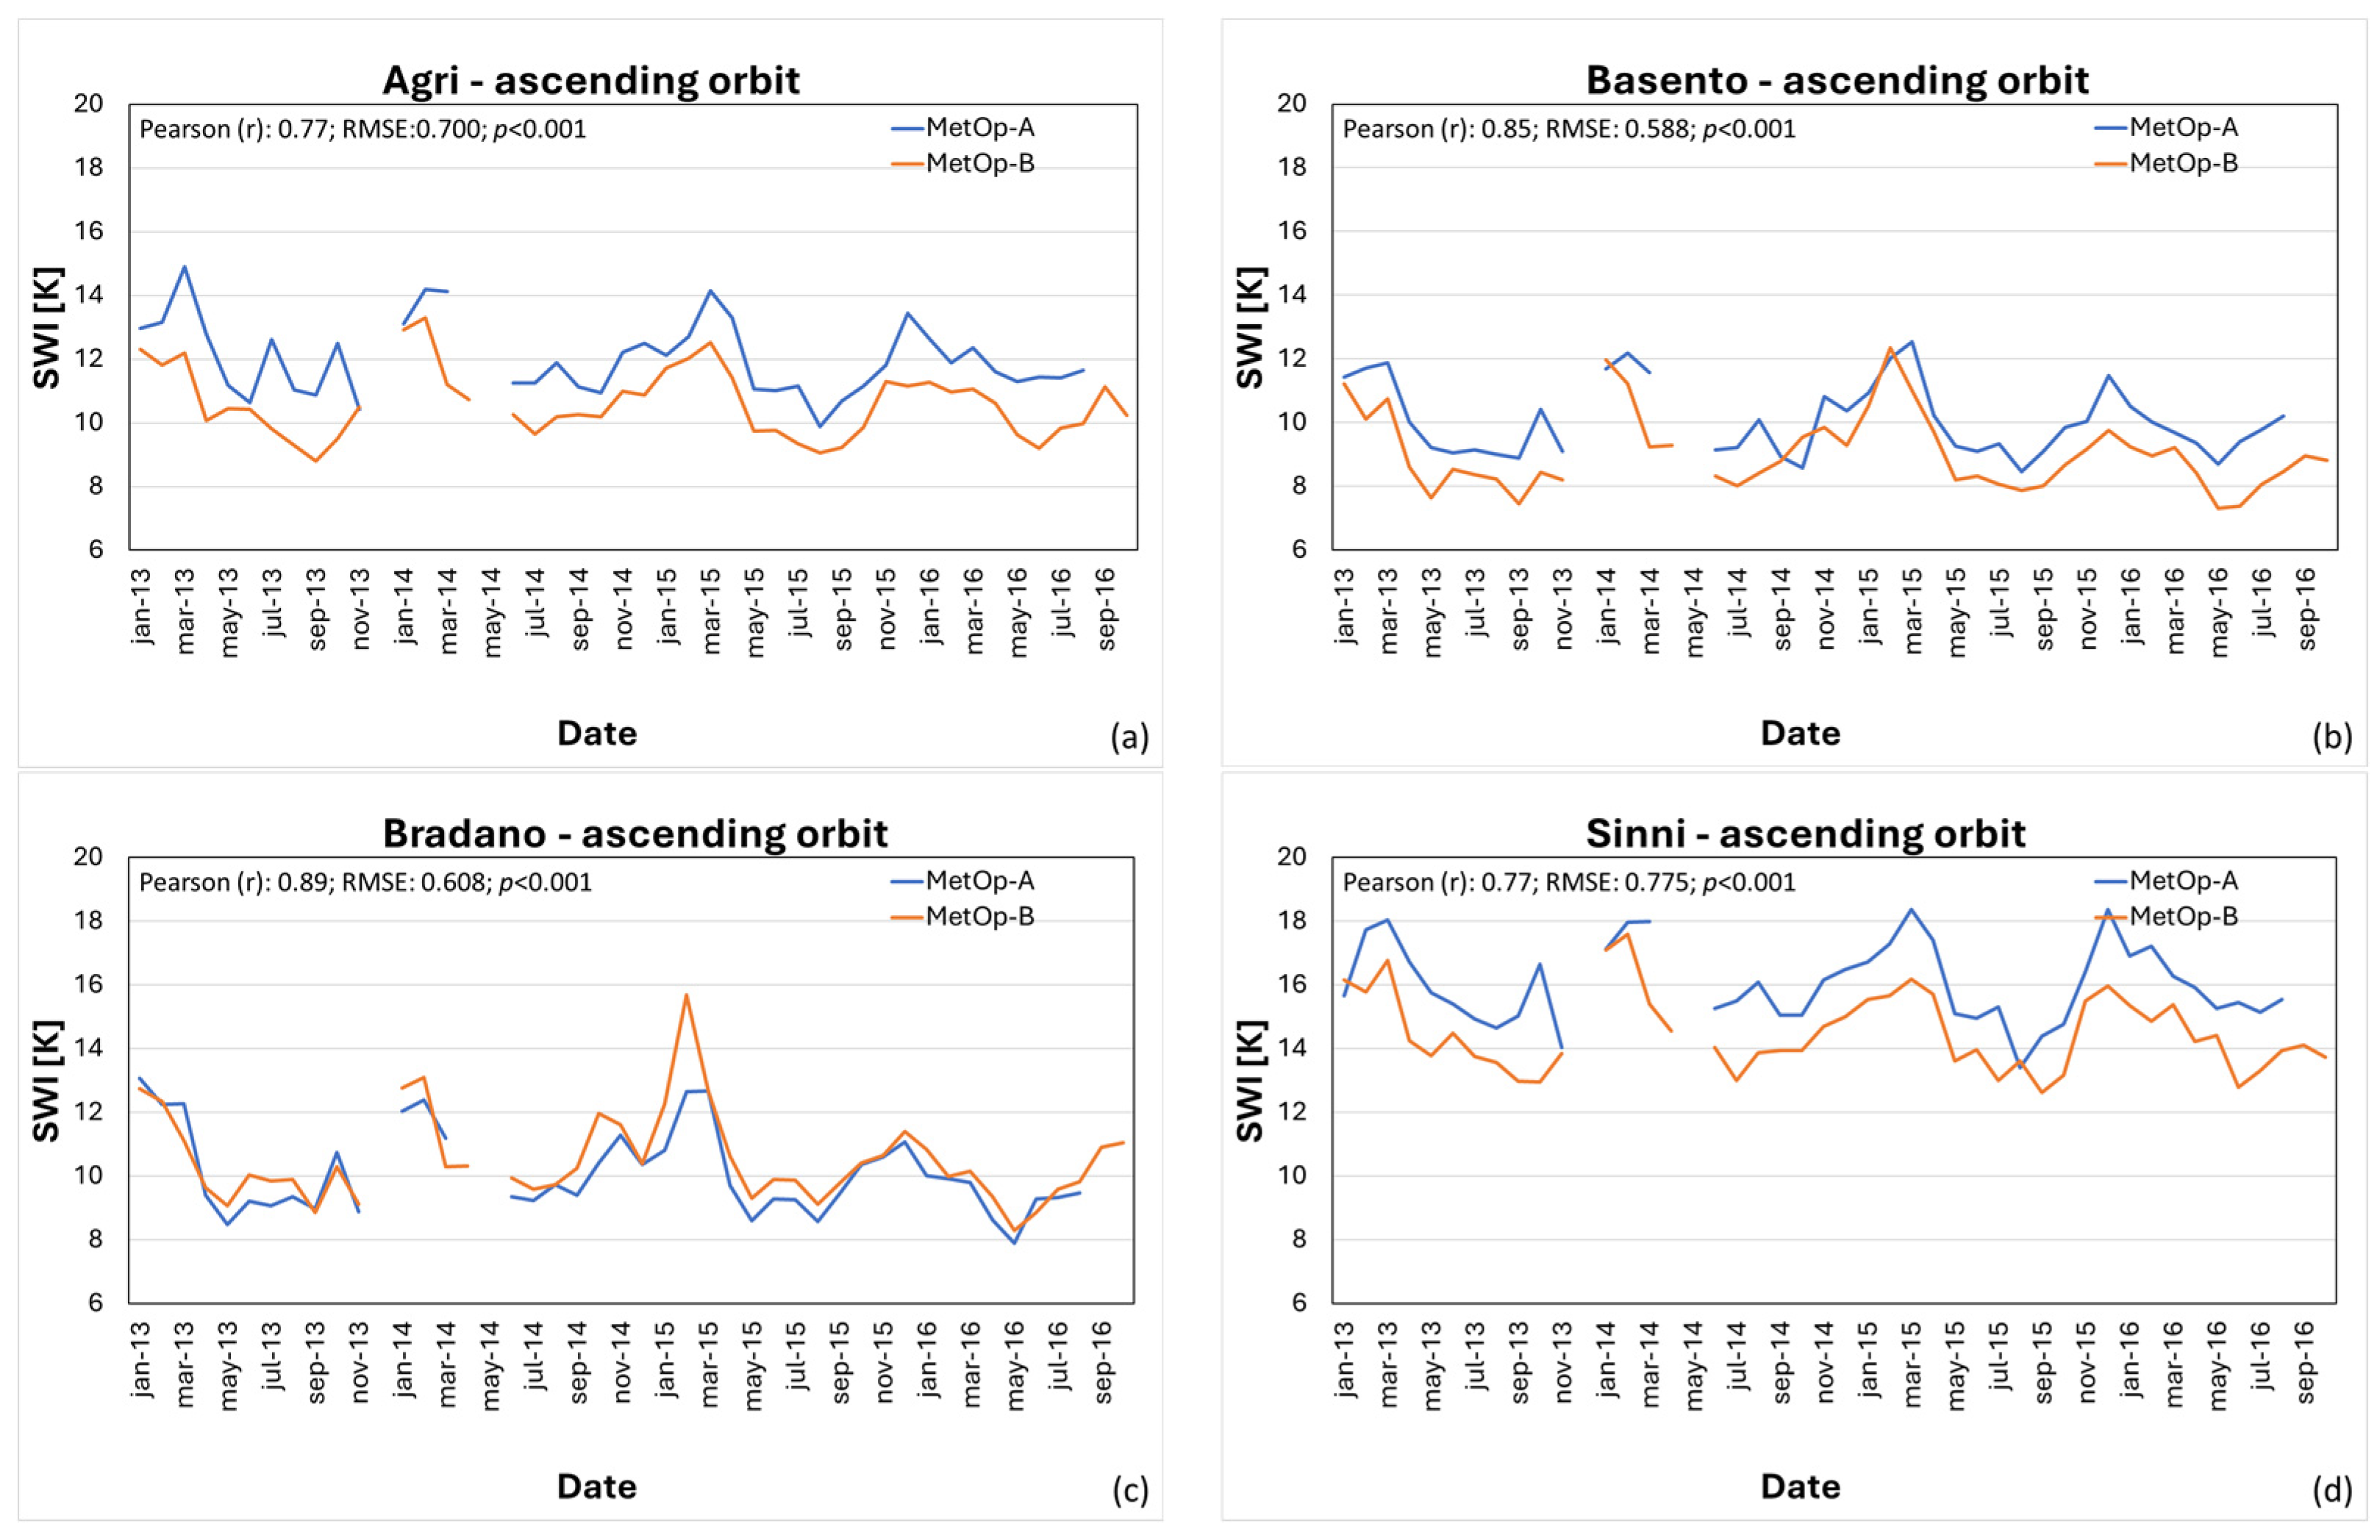
We then checked whether such independence was also confirmed by moving from one platform to another by comparing the SWI values collected by both MetOp-A and -B during their overlapping period (i.e., 2013–2016) for ascending passes, as shown in Figure 5. The same layout as in Figure 4 was used, with the full results of the statistical tests shown in Figure A4. All trends had p-values < 0.001, indicating their statistical significance, and the Shapiro–Wilk test results were close to 1, satisfying the normality test. The Durbin–Watson tests were very close to 2, indicating almost no autocorrelation, or a very small positive or negative autocorrelation of the considered trends.
The overall results were similar to those shown in Figure 4, confirming the presence of a clear seasonality, the wetter behavior of the Sinni River Basin, and the presence of some positive SWI peaks in late winter 2013 and 2015. Again, apart from some discrepancies, good agreement was evident, as confirmed by the reported r values. The Basento and Bradano River Basins showed the best performance, with an r value higher than 0.85, while both Agri and Sinni reached an r of 0.77. The coherence among the results was more evident when considering the RMSE values, which were never higher than 0.8 K. Considering that we did not perform any calibration between the sensors, these results confirm the independence of the SWI from the platform considered, highlighting the sensitivity of the AMSU sensors as well as the indicator to different soil moisture conditions.

3.3. Correlation of SWI Products Derived from AMSU and ASCAT

After assessing the capability of the SWI to provide consistent results regardless of the orbit and platform used, we proceeded with the accuracy assessment of the results. To this end, we used the SM reference values provided by ASCAT, and to obtain homogenous datasets, we normalized the MetOP-B-SWI values based on the maximum and minimum values acquired over the period in each basin, following the same approach used for ASCAT [54]. The results are shown in Figure 6, which has the same layout as in Figure 4 and Figure 5. In each panel, the main metrics are indicated, and full details are provided in Figure A5. As previously mentioned, considering the different signals measured by the AMSU on the MetOp and ASCAT satellites, the NRMSE was used in this analysis. All of the trends had p-values < 0.001, indicating their statistical significance, and the Shapiro–Wilk test results were close to 1, satisfying the normality test. The Durbin–Watson tests were generally slower than 2, indicating a small positive autocorrelation of the considered trends.
Generally, a high similarity between the two sensors was observed: seasonality was confirmed, and the main peaks were almost equivalent in terms of temporal occurrence, with some discrepancies in terms of relative intensity. This difference was due to the different periods used for the maximum–minimum value research, which in the case of AMSU data were forced to the 2013–2016 period, while for ASCAT, they ranged in the 2007–2022 temporal interval considering both H115 and H116 data. Notwithstanding this issue, plus the difference between AMSU and ASCAT in terms of observation technology, spatial resolution, and spectral range of observation, a good agreement was observed between the two sensors, as confirmed by both the correlation values, which ranged from 0.67 to 0.80, and the achieved NRMSE, which varied from 0.129 to 0.177. While the mean NRMSE values achieved under diurnal and nighttime conditions were equivalent (~0.15), r was slightly higher for descending orbits (0.77 instead of 0.75).
Considering the well-known reliability of ASCAT SM data [17,40], this result confirms the findings of previous studies in which the SWVI and SWI computed from the NOAA satellite data were compared with in situ data [59,63], indicating the good capability of the AMSU sensors, regardless of the satellite system considered, in providing useful and accurate SM variability information for the study area.

3.4. Long-Term Variation of SWI for Basilicata Region

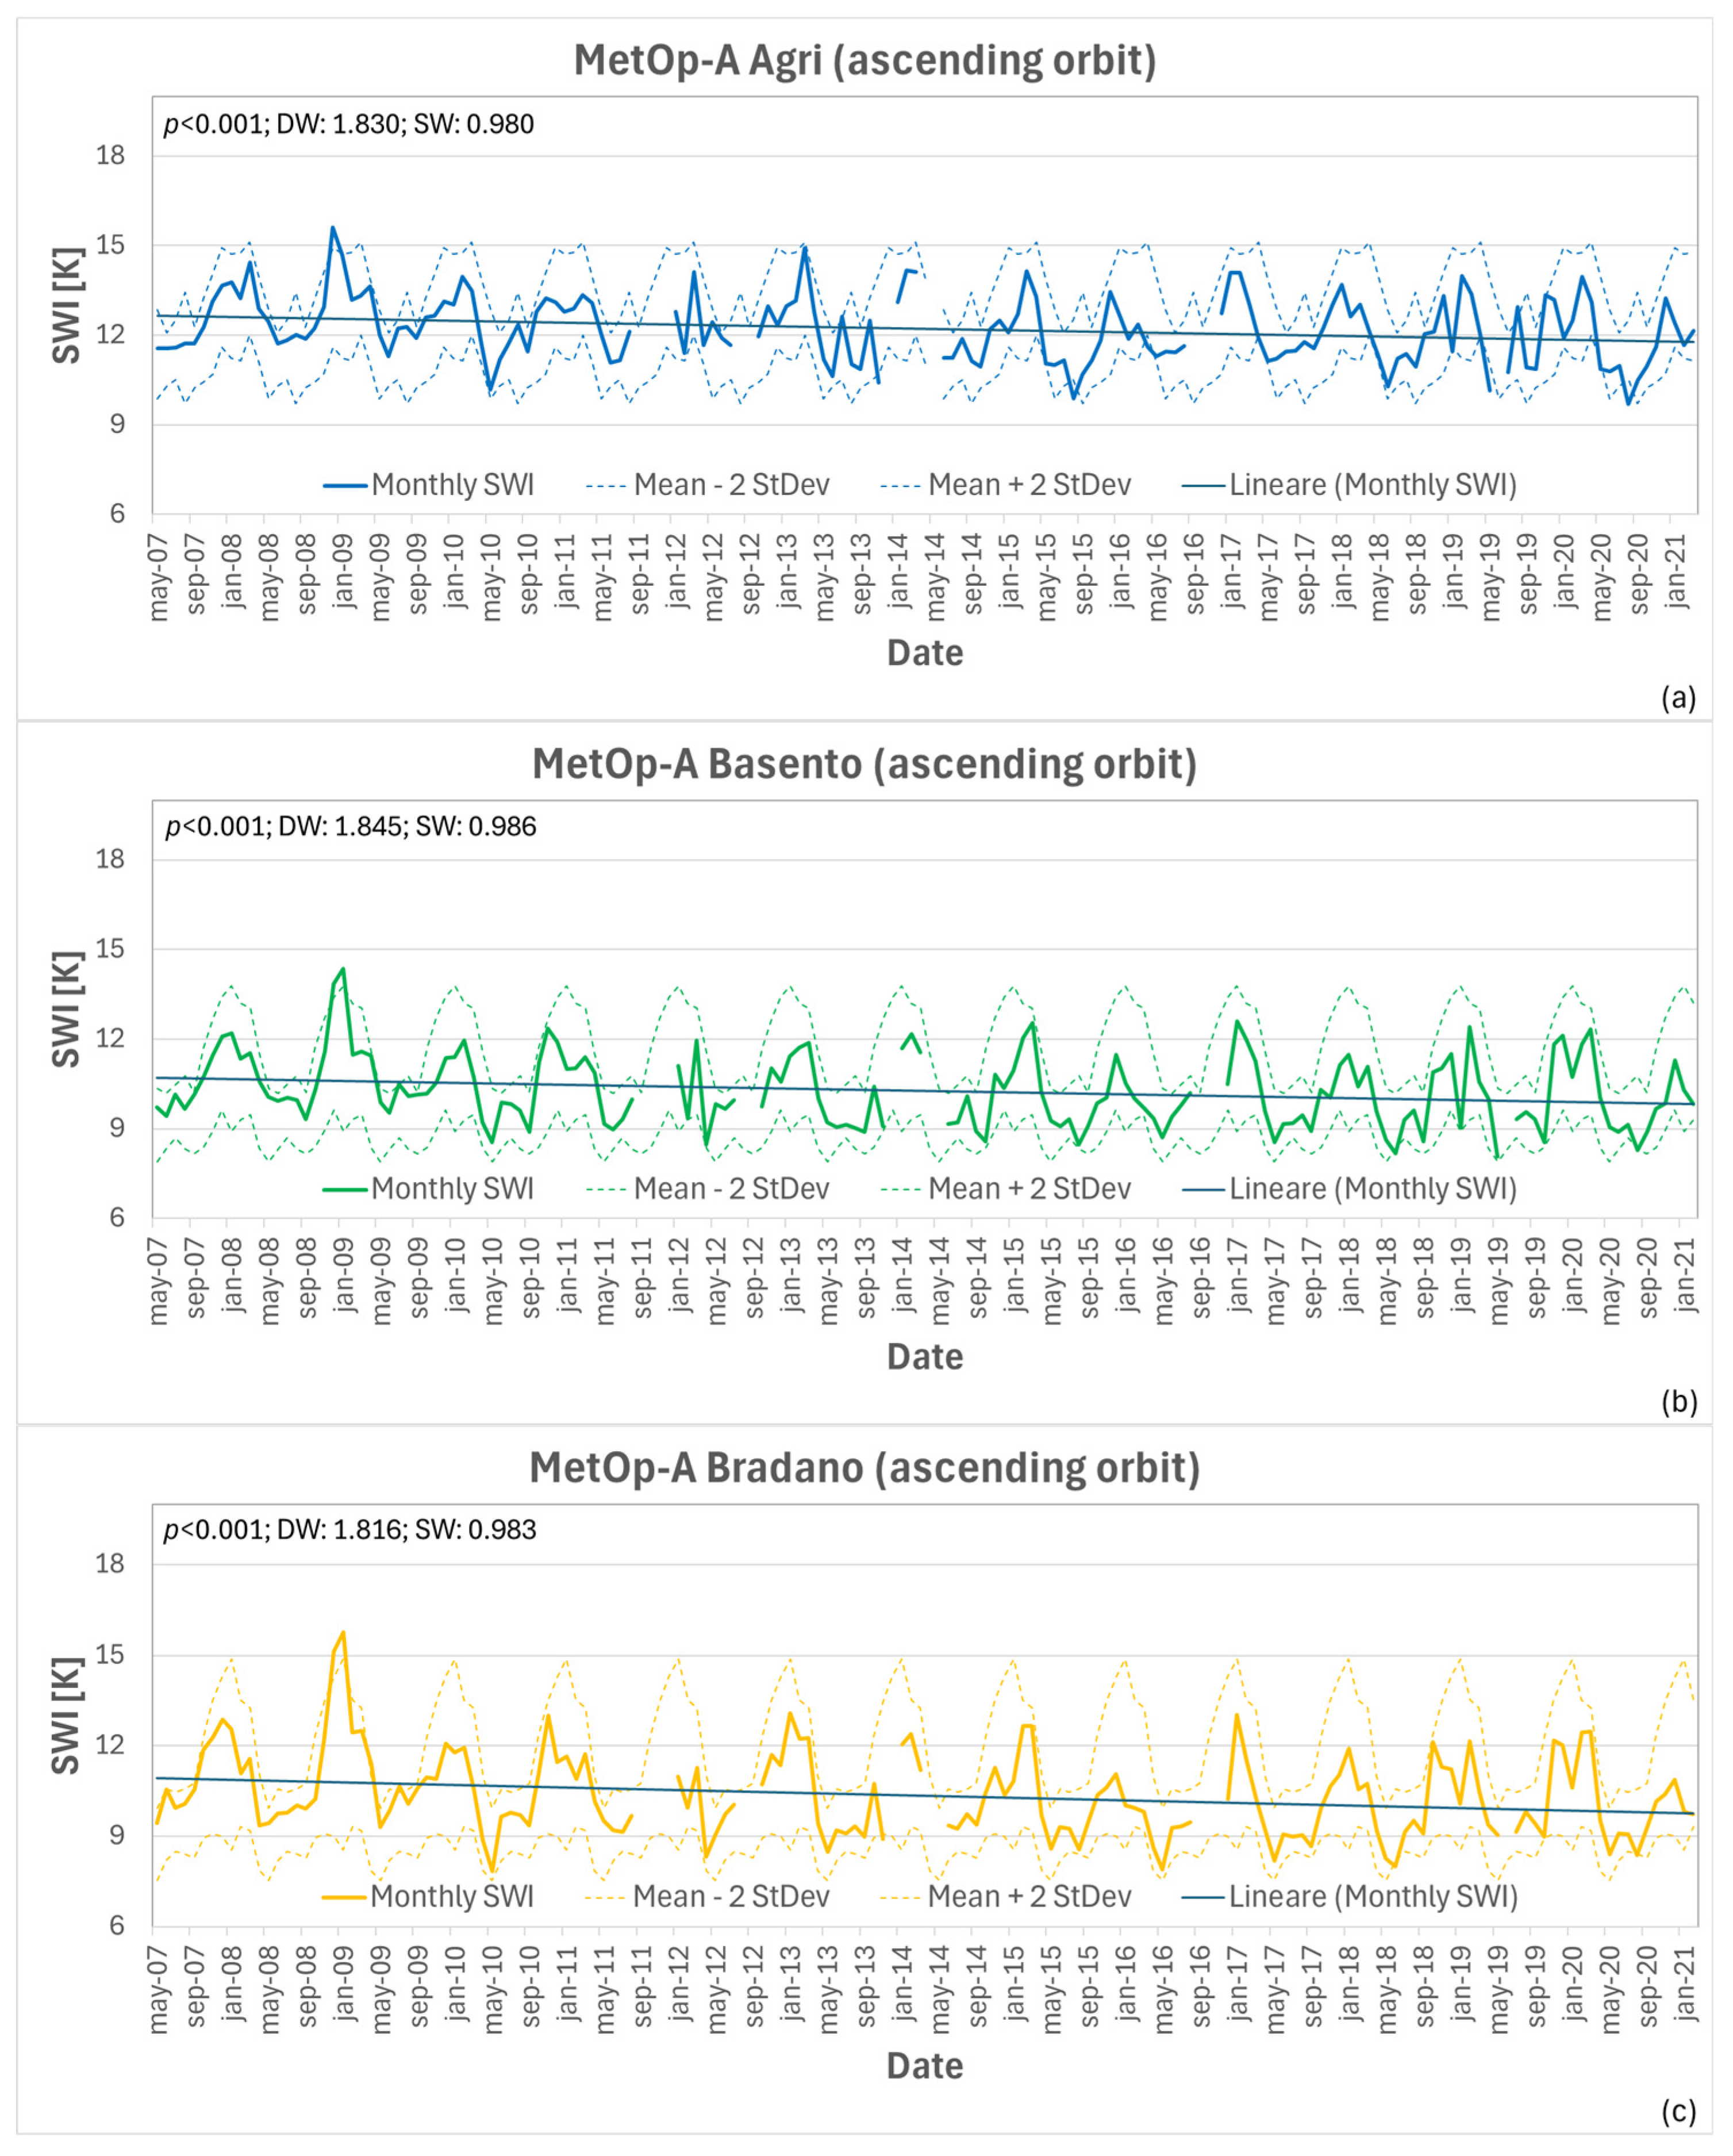
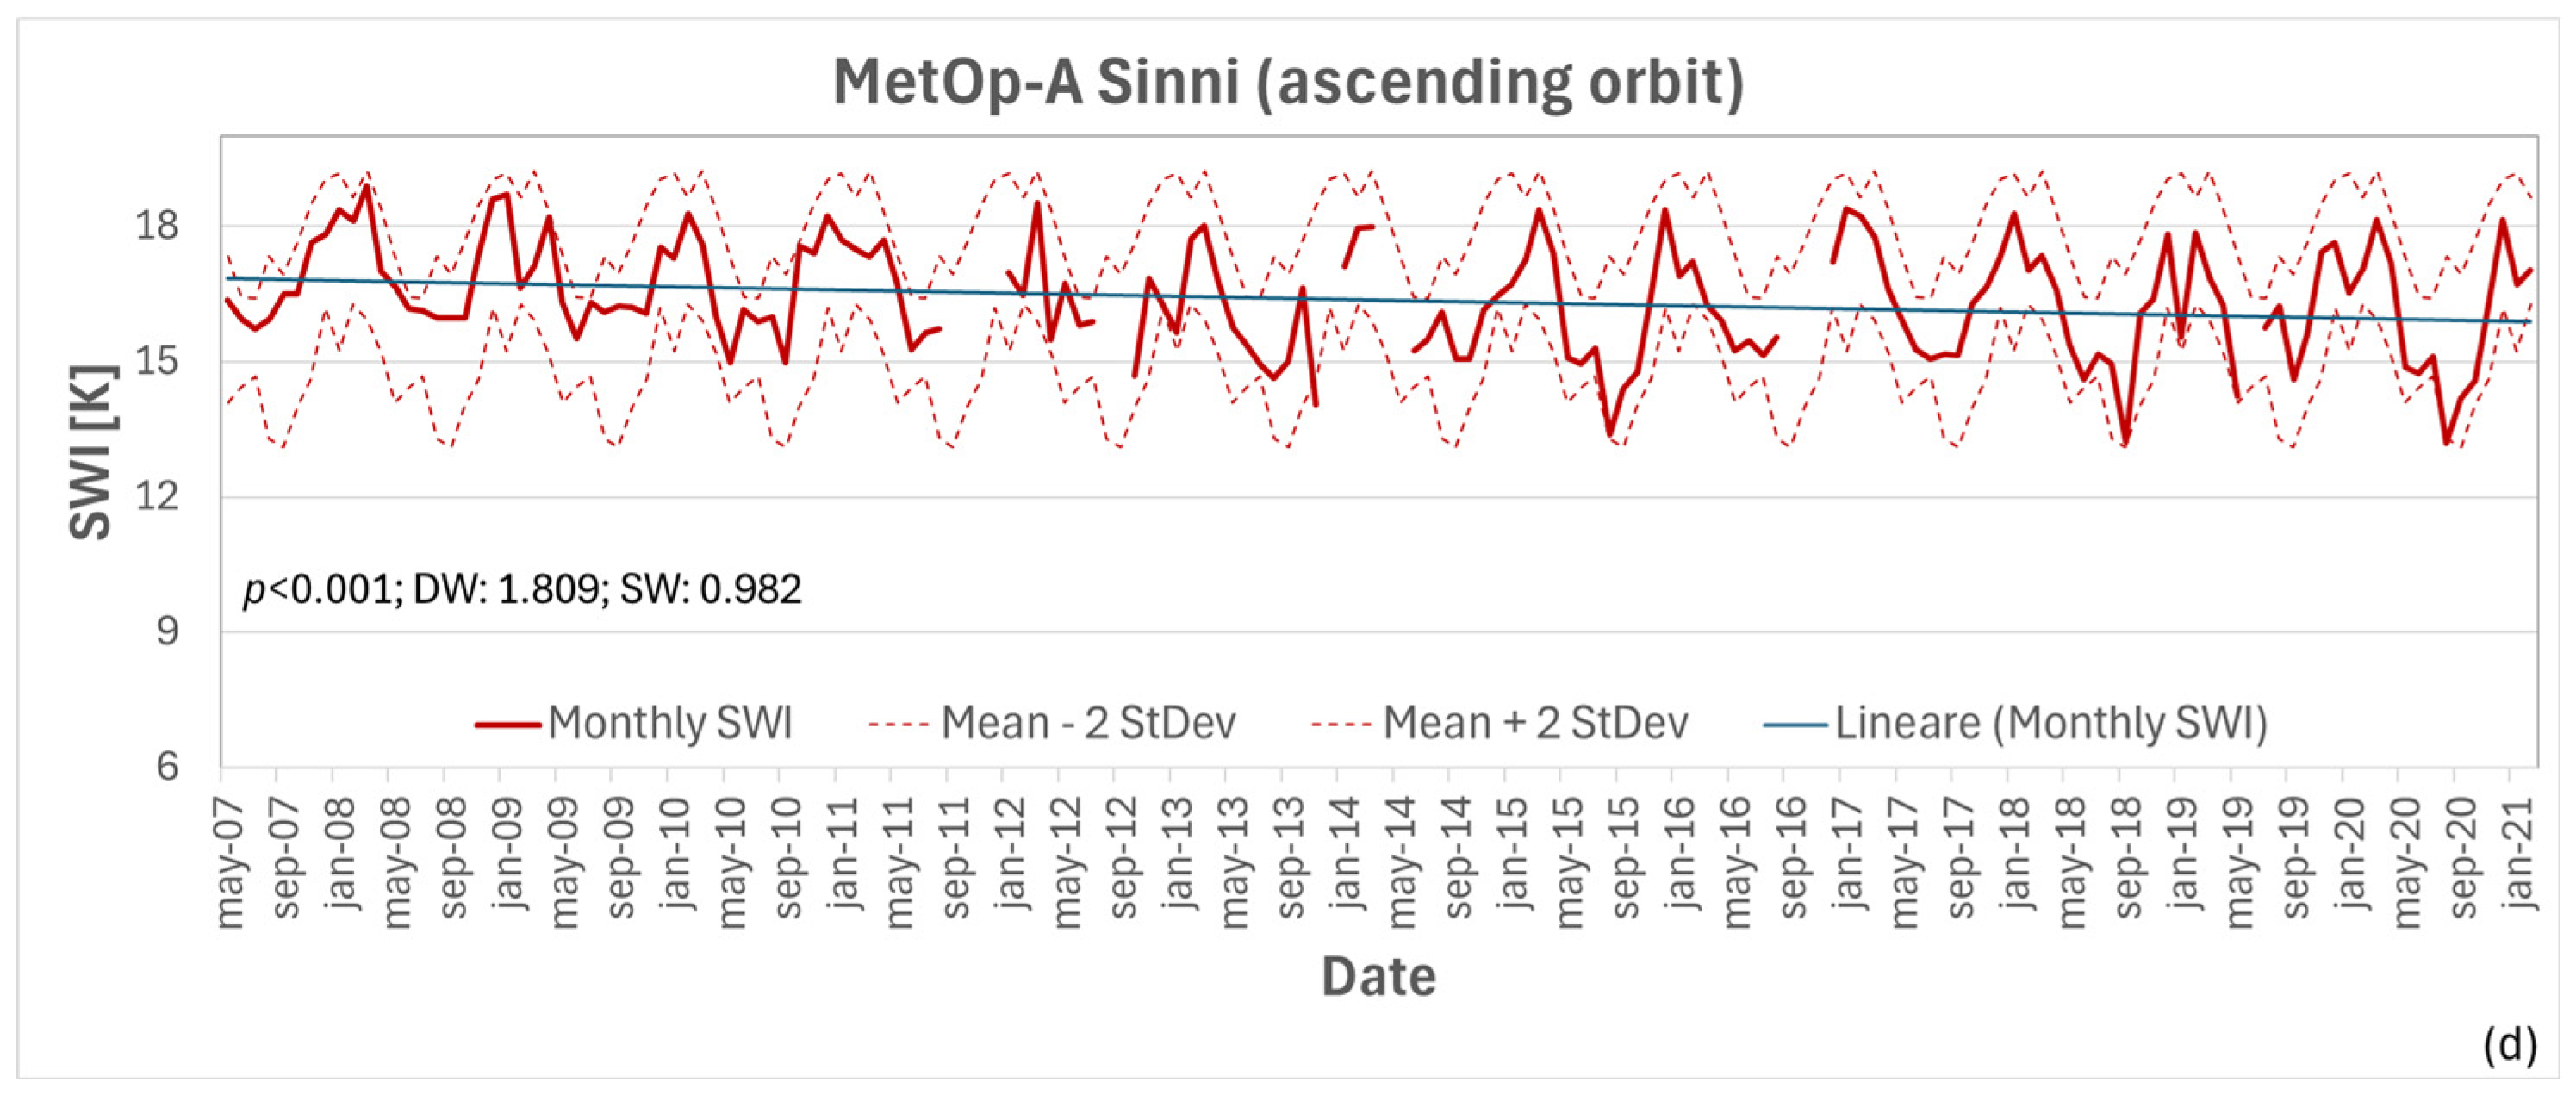
Once such a capability was assessed, we moved to a long-term analysis considering the data acquired by MetOp-A in the ascending orbit in the 2007–2021 period; the results are shown in Figure 7. The results of the Durbin–Watson (DA) and Shapiro–Wilk (SW) tests are reported in the figure. All of the trends had p-values < 0.001, indicating their statistical significance, and the Shapiro–Wilk test results were close to 1, satisfying the normality test. The Durbin–Watson tests were slightly less than 2, indicating a small positive autocorrelation of the trends considered. The confidence interval of each series is also reported in the graph, built as the multitemporal mean ± 2 standard deviation. Considering the high level of normality shown by the series, this interval encompassed 95% of the data.
A clear coherence with the results achieved for the short period investigated was evident (Figure 5). Seasonal variations were confirmed as well as a wetter behavior of the Sinni River Basin with respect to the others, with the Bradano and Basento showing almost similar patterns. This was confirmed by the matrix of the correlation coefficient values reported in Table 3, which also confirmed the results of the previous analysis based on MetOp-B in the 2013–2016 period.
Considering the confidence interval, the monthly trends showed a few outliers. An evident increase in SWI was observed for all basins, except for Sinni, in December 2018–January 2019. A negative peak occurred in November 2013 for all basins except Basento, while a common one was observed in Jul–Aug 2020. The Agri River Basin was the most affected by negative outliers. The causes of these signal anomalies deserve further analysis beyond the scope of this study.
The trends were analyzed in terms of their slopes to assess their general behavior (Table 4). The two tests aimed at identifying trend slopes showed very similar results, indicating a declining trend in the SWI in all of the investigated basins. This suggests the occurrence of a dry phase that affected the entire Basilicata region during the study period.

3.5. Assessing Drought Process

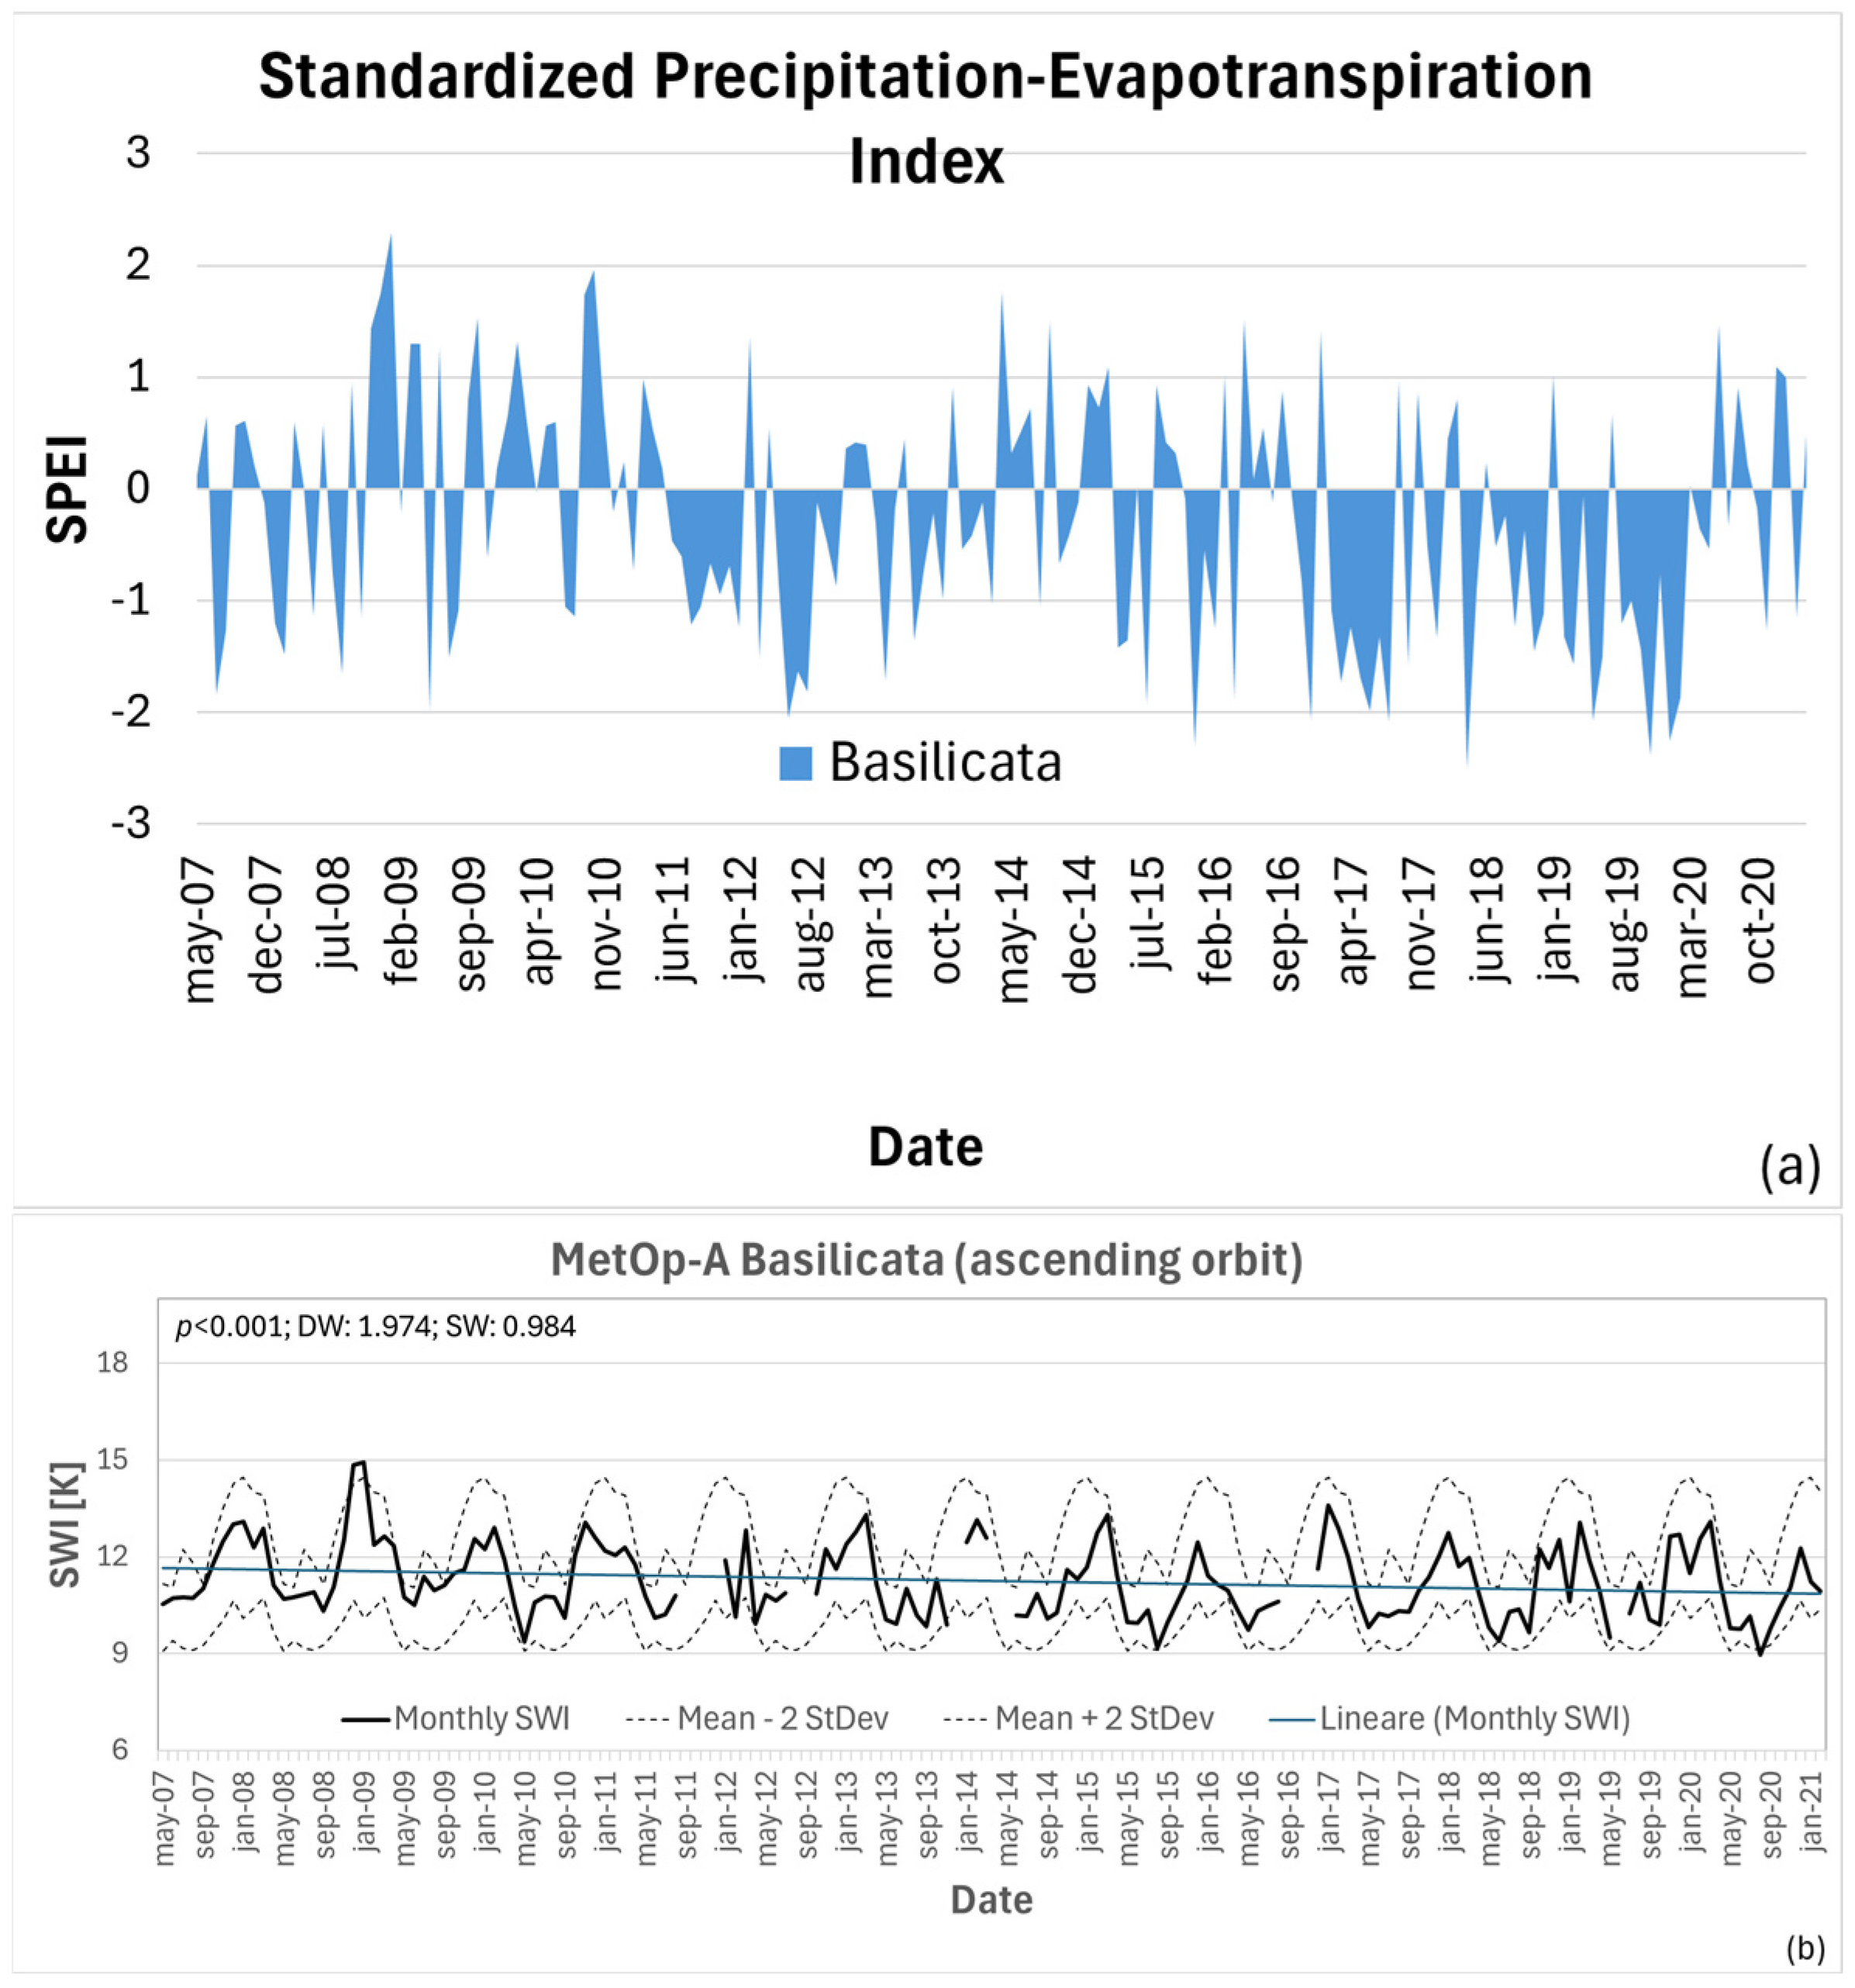
The 2007–2021 SPEI 01 series for the six pixels covering most of the Basilicata region was downloaded, and the corresponding monthly spatial average is shown in Figure 8a. The SWI trend for the entire Basilicata territory is shown in Figure 8b.
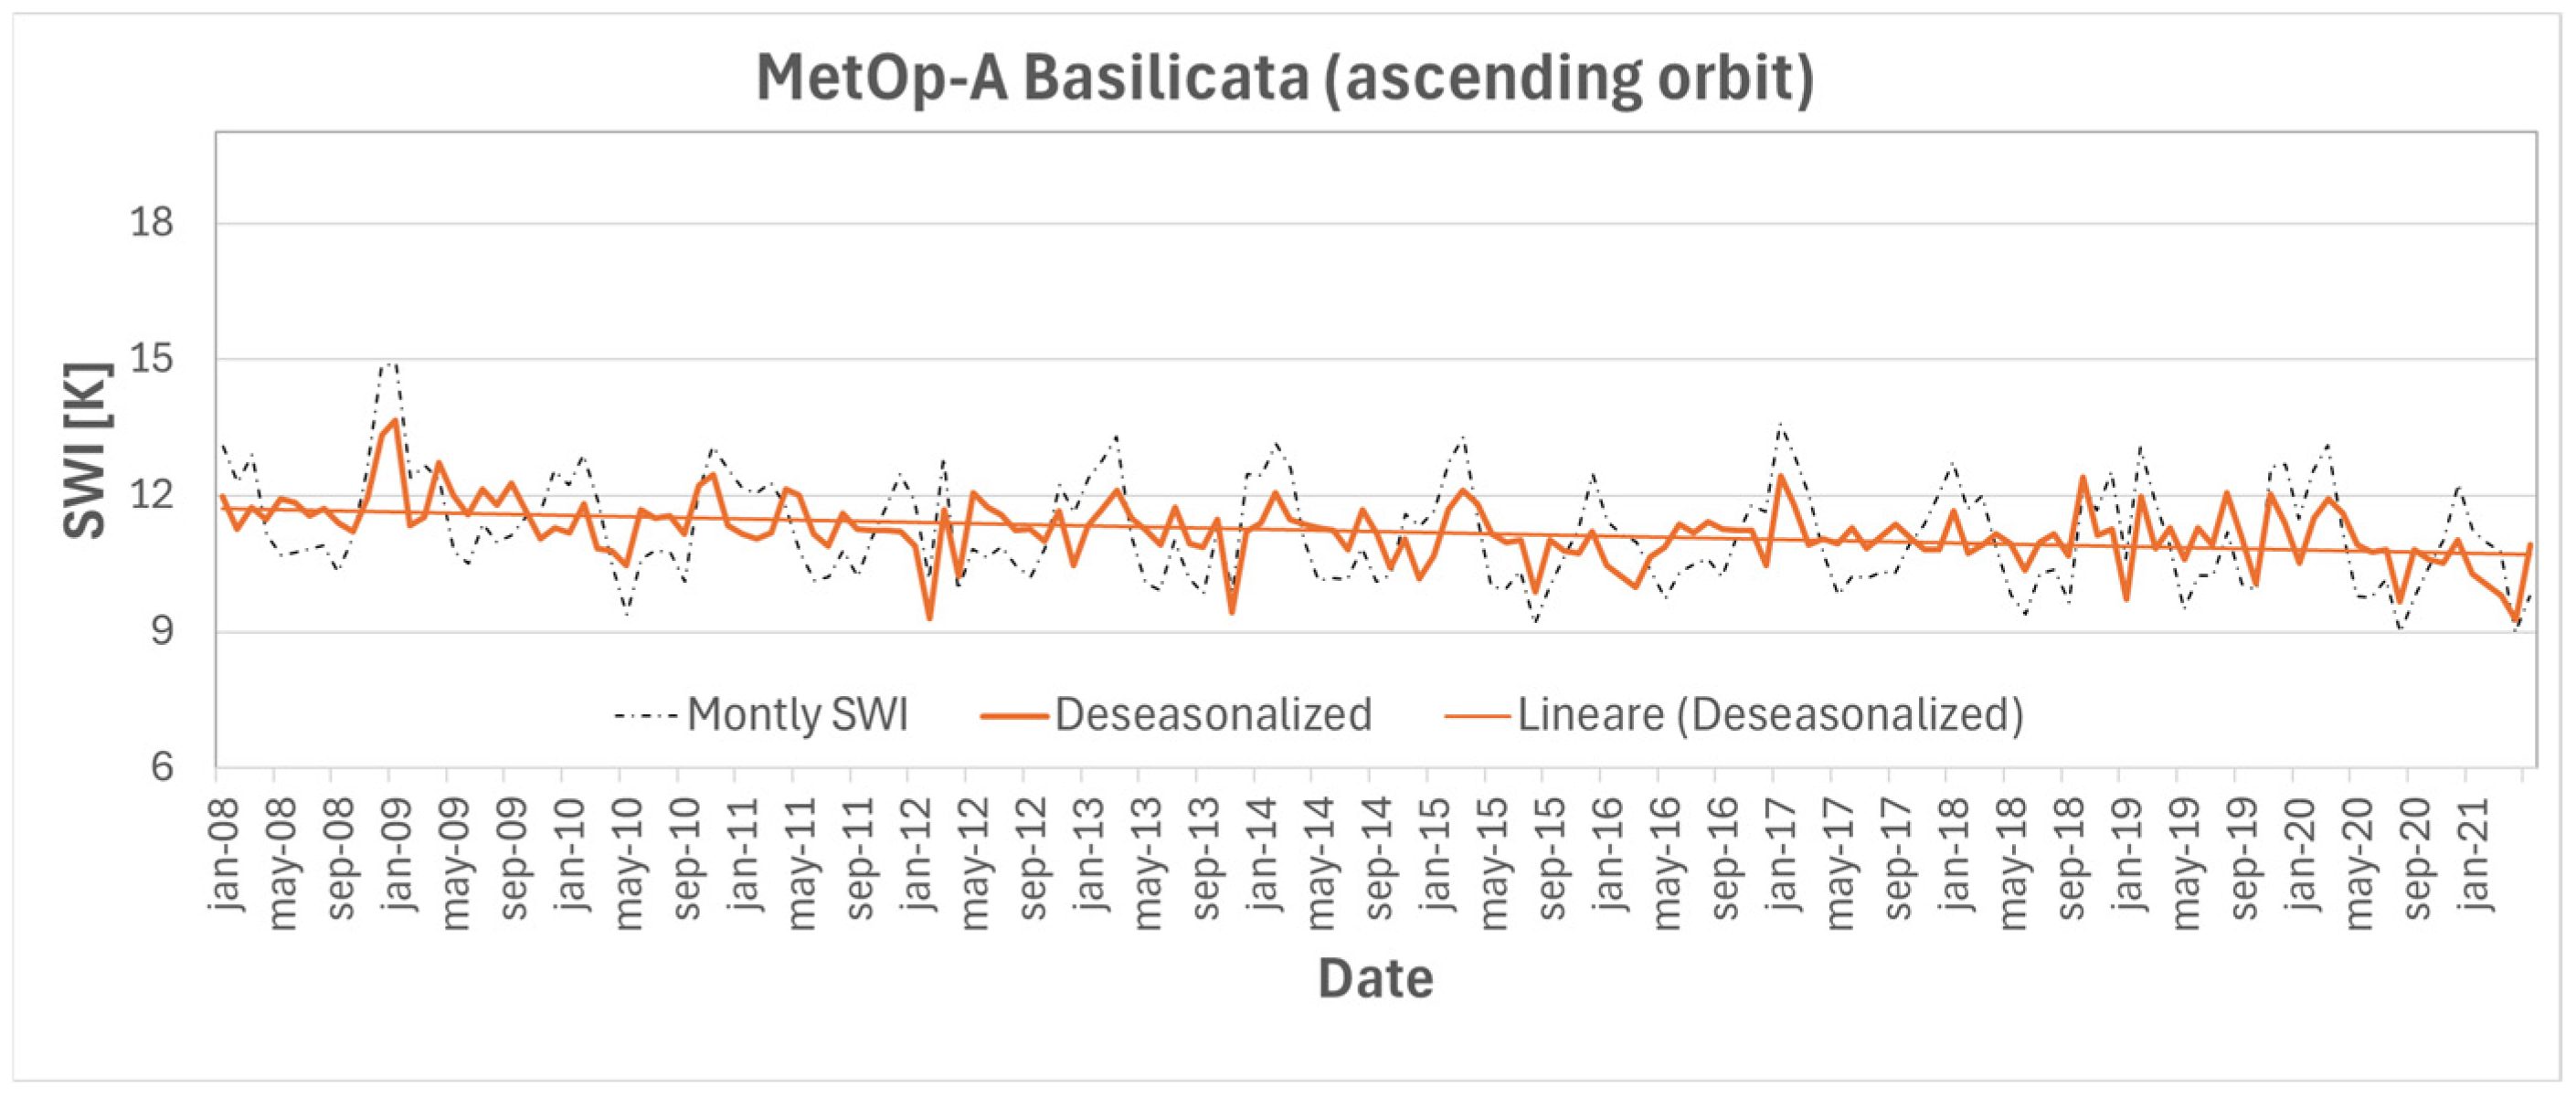
The SPEI indicated an increasing occurrence of droughts characterized by different temporal durations in Basilicata, with fewer short episodes (i.e., flash droughts), especially in the first half of the considered period (2007–2014). However, recent studies have indicated that droughts can also develop rapidly under extreme atmospheric conditions (e.g., precipitation deficits and heat waves) within a few pentads (i.e., five days) or weeks [67]. In the second half of this period (2014–2021), more prolonged events were observed. Linear regression and Sen’s slopes were also evaluated for the SPEI trend, with values ranging from −0.00284 to −0.00303, indicating a declining evolution of the indicator, with drought phases exceeding the wet period. Similar results were obtained for the SWI trend at the Basilicata region scale, with similar results of approximately −0.00525, indicating a decrease in the SM content. To better assess the relevance of this result, we applied a standard multiplicative model to the series, achieving the deseasonalized trend shown in Figure 9. Linear regression and Sen’s slopes provided almost similar results of approximately −0.00575, confirming the value previously achieved.

4. Discussion

Understanding the soil moisture dynamics is essential for managing water resources, forecasting droughts, and developing sustainable agricultural practices [77]. In this study, we analyzed the SM variability using an SM index extracted from the AMSU radiance and applied it to drought analysis in the Basilicata region for the first time. The achievement indicated a marginal decrease in the values of the soil wetness index, with a negative trend of 0.00525 over the 15-year period investigated. In the absence of any ground information about the soil moisture content variation, it is quite difficult to assess the relevance of the detected phenomenon and its impact on water resources at the regional scale. However, several studies have demonstrated that the region is affected by land degradation [48,49,50,51,57,78], confirming the presence of favorable environmental conditions for drought development. As an example, in late 2024, some portions of northern Basilicata experienced very low levels of precipitation, which limited the delivery of drinking water to 39 municipalities in the region, including Potenza, the capital of Basilicata [79], highlighting the need of implementing more comprehensive monitoring systems, where information about the soil moisture variability can play a crucial role.
As previously mentioned, this study is the first to investigate the Basilicata region’s behavior in terms of the soil moisture variability for drought assessment. The entire Mediterranean area, also defined as southern Europe, was analyzed in [80,81,82]. Their findings generally agree with each other regarding the detection of drought conditions in the latest year. More recently, Mirauda [83] investigated a small subset in the northern area of the Bradano River Basin by analyzing ground-based precipitation and temperature trends from 2000 to 2022, with the main aim of assessing the impact of climate change on agriculture in the study area. Ground-based measurements were used to develop and test different standard drought indices, the SPI [84], the Reconnaissance Drought Index (RDI) [85], and the SPEI, whose analyses revealed a trend toward more severe drought conditions in the most recent years of the period investigated, confirming the results achieved in this study. Among the indices, the SPI was found to be the best for achieving the aim of their work. Moreover, precipitation data were identified as being more relevant for drought assessment, with temperature variability playing a minor role.
The proposed approach has several limitations, which have already been introduced. The absence of ground-based soil moisture data is the main limitation, which we tried to address using the ASCAT SM product, exploiting the concurrent presence of the AMSU on MetOp satellites that allowed for common observations. Although the high reliability of the ASCAT product is well-recognized, unknown biases or uncertainties may have affected the analysis of the SWI accuracy. The use of other sensors, a multi-sensor validation strategy, or a cross-comparison with independent ground measurements were beyond the scope of this study and will be object of future work. In any case, the installation of in situ SM monitoring stations would help collect data that are useful for assessing both the reliability of satellite measurements and drought occurrence. The recent Space It Up project, funded by the Italian Space Agency [86], would allow for such an installation in the near future, focusing on the development of an SM network that integrates low-cost small sensors with at least one cosmic-ray station. This would allow for a homogenous cover of the entire region, representing an added value for all future studies focusing on analyzing climate change impacts in southern Mediterranean areas. The idea is to have one station on each of the main watersheds analyzed in this study to allow for total coverage of the region in terms of geographic location, climatic conditions, and soil characteristics. As for the SMAP, SMOS, AMSRE, and ASCAT, the coarse spatial resolution of the AMSU allows for the recording of a radiance value that is a combination of signals by the different elements present in the scene, which have different emissivities. Even if the band combination used for the SWI computation reduced the impact of some of them, a residual contribution may have affected the results. Variations in the roughness of the surface as well as in the topography have also contributed to the impact that we tried to minimize by working at a large spatial scale. The different spatial resolutions of the data used in this study were addressed by resampling the ASCAT data at the same spatial resolution as the AMSU. For the comparison with the SPEI, considering that it was made at the entire Basilicata region scale, we did not perform any rescaling. Finally, it is worth mentioning that using other drought indicators, such as the SPI, could have allowed for a better understanding of the phenomenon at the regional scale.
A clear understanding of the root causes of the detected trends, which was beyond the scope of this study, will be the focus of future studies. The integration of other information about long-term temperature variability with precipitation using ground data would allow for a broader view of the problem including an analysis of the impact of evapotranspiration. These data can also be used to develop and test some of the most common drought indicators (such as the SPEI, the Standardized Precipitation Index—SPI, the Drought Observatories Soil Moisture Index Anomaly—SMA, the Drought Severity Index—DSI, the Palmer Drought Severity Index—PDSI, …). Moreover, the SM data produced by other microwave active and/or passive sensors (for example, SMOS, SMAP, and Sentinel-1 SAR) could be used and combined to perform a more comprehensive analysis. Finally, the extension of the SWI variability study to the NOAA satellite datasets would allow for a longer time-series analysis, starting in 1998, which could be extended in the spatial domain. Several precautions should be taken during this dataset enlargement because, in contrast to the MetOp satellite, which can assure a stable orbit during the entire platform life, the NOAA satellites are exposed to orbital drifts. Using only a subset of the NOAA data when the orbits were still stable would allow for a consistent extension of this dataset. Such long-term data availability will also allow for implementing different strategies for data analysis, aggregating data at different temporal scales (from weekly to multi-year scales), and investigating the corresponding temporal anomalies. The SWVI can be used to infer high-frequency soil moisture variation, thereby reducing the impact of site effects.
The analysis performed in this study, based only on satellite data, can be easily exported to other geographic locations, which could also be characterized by climatic conditions different from those of the Basilicata region.

5. Conclusions

Constant and continuous monitoring and the forecasting/early warning of droughts are essential for implementing adequate mitigation strategies at the onset of the phenomenon. In this study, we used soil moisture information developed using the AMSU radiances acquired by the MetOp-A and -B satellites to infer drought occurrence in the Basilicata region (southern Italy). The data were directly acquired and collected at the satellite station of the Institute of Methodologies for Environmental Analysis, located in Basilicata.
The proposed indicator, the SWI, achieved mean correlation coefficient values with an ASCAT higher than 0.7 and a mean normalized root mean square error less than 0.155, indicating its good reliability in assessing the SM variability. A marginal negative trend in the SWI during the 2007–2021 period was found using both the original and deseasonalized series (linear and Sen’s slope ~−0.00525). In the absence of any ground information about the soil moisture content variation, it was quite difficult to assess the relevance of this detected trend, even if it was confirmed by the SPEI (linear and Sen’s slope ~−0.00293). Further work is needed to better assess the relevance and intensity of the process and to link it to the land degradation process affecting the region. Using satellite sensors that are more focused on soil moisture, such as the SMOS, SMAP, and AMSR-E, or at high spatial resolution (Sentinel-1), would allow for a more detailed view of the phenomenon in progress. This information could be crucial for several stakeholders, such as regional governments, civil protection agencies, and individual farmers, fostering better management of water resources. In addition to the agricultural scope, water collected in Basilicata is essential for the citizens living in the region and the neighboring Puglia region, and the recent emergency related to water availability in Basilicata highlights the relevance of the study and the results obtained.

Author Contributions

R.A.: Writing—original draft preparation; writing—review and editing; M.L.: Data curation; formal analysis; A.M.: Methodology; data curation; B.P.-D.: Data curation; writing—review and editing; T.L.: Conceptualization; methodology; writing—original draft preparation; writing—review and editing; funding acquisition; supervision. All authors have read and agreed to the published version of the manuscript.

Funding

This research was carried out in the framework of the project ‘OT4CLIMA’, which was funded by the Italian Ministry of Education, University and Research (D.D. 2261 del 6.9.2018, PON R&I 2014–2020 and FSC), and the project ‘Space It Up’, funded by the Italian Space Agency and the Ministry of University and Research—Contract No. 2024-5-E.0—CUP No. I53D24000060005.

Data Availability Statement

AMSU data can be downloaded after registration at the EUMETSAT User Portal (https://user.eumetsat.int/dashboard). ASCAT data can be downloaded after registration at the EUMETSA User Portal (https://user.eumetsat.int/dashboard). SPEI data are available at the Global SPEI database after registration (https://spei.csic.es/spei_database/).

Acknowledgments

The authors wish to thank their colleagues at the IMAA, who helped with the acquisition and processing of the AMSU data.

Conflicts of Interest

The authors declare no conflicts of interest.

Appendix A

Figure A1. Basilicata region. Corine Land Cover Class 2018, version 2020.
Land 14 01239 g0a1
Figure A2. The AMSU elaboration chain implemented at the IMAA.
Land 14 01239 g0a2
Figure A3. Results of the statistical analysis of graphs shown in Figure 4.
Land 14 01239 g0a3
Figure A4. Results of the statistical analysis of graphs shown in Figure 5.
Land 14 01239 g0a4
Figure A5. Results of the statistical analysis of graphs shown in Figure 6. (a) Ascending orbits (i.e., left column of Figure 6). (b) Descending orbits (i.e., right column of Figure 6).
Land 14 01239 g0a5aLand 14 01239 g0a5b

References

  1. Stott, P.A.; Christidis, N.; Otto, F.E.L.; Sun, Y.; Vanderlinden, J.-P.; van Oldenborgh, G.J.; Vautard, R.; von Storch, H.; Walton, P.; Yiou, P.; et al. Attribution of extreme weather and climate-related events. WIREs Clim. Change 2016, 7, 23–41. [Google Scholar] [CrossRef] [PubMed]
  2. Martínez-Fernández, J.; González-Zamora, A.; Sánchez, N.; Gumuzzio, A. A soil water based index as a suitable agricultural drought indicator. J. Hydrol. 2015, 522, 265–273. [Google Scholar] [CrossRef]
  3. Carrão, H.; Russo, S.; Sepulcre-Canto, G.; Barbosa, P. An empirical standardized soil moisture index for agricultural drought assessment from remotely sensed data. Int. J. Appl. Earth Obs. Geoinf. 2016, 48, 74–84. [Google Scholar] [CrossRef]
  4. Crausbay, S.D.; Ramirez, A.R.; Carter, S.L.; Cross, M.S.; Hall, K.R.; Bathke, D.J.; Betancourt, J.L.; Colt, S.; Cravens, A.E.; Dalton, M.S.; et al. Defining Ecological Drought for the Twenty-First Century. Bull. Am. Meteorol. Soc. 2017, 98, 2543–2550. [Google Scholar] [CrossRef]
  5. Maracchi, G. Agricultural Drought—A Practical Approach to Definition, Assessment and Mitigation Strategies. In Drought and Drought Mitigation in Europe; Vogt, J.V., Somma, F., Eds.; Advances in Natural and Technological Hazards Research; Springer: Dordrecht, The Netherlands, 2000; Volume 14. [Google Scholar] [CrossRef]
  6. Afshar, M.H.; Bulut, B.; Duzenli, E.; Amjad, M.; Yilmaz, M.T. Global spatiotemporal consistency between meteorological and soil moisture drought indices. Agric. For. Meteorol. 2022, 316, 108848. [Google Scholar] [CrossRef]
  7. Spinoni, J.; Naumann, G.; Vogt, J. Spatial patterns of European droughts under a moderate emission scenario. Adv. Sci. Res. 2015, 12, 179–186. [Google Scholar] [CrossRef]
  8. Pascale, S.; Ragone, F. Widespread Multi-Year Droughts in Italy: Identification and Causes of Development. Int. J. Climatol. 2025, e8827. [Google Scholar] [CrossRef]
  9. Baronetti, A.; González-Hidalgo, J.C.; Vicente-Serrano, S.M.; Acquaotta, F.; Fratianni, S. A weekly spatio-temporal distribution of drought events over the Po Plain (North Italy) in the last five decades. Int. J. Climatol. 2020, 40, 4463–4476. [Google Scholar] [CrossRef]
  10. Romano, E.; Petrangeli, A.B.; Salerno, F.; Guyennon, N. Do recent meteorological drought events in central Italy result from long-term trend or increasing variability. Int. J. Climatol. 2021, 42, 4111–4128. [Google Scholar] [CrossRef]
  11. Coscarelli, R.; Caloiero, T.; Filice, E.; Marsico, L.; Rotundo, R. Meteorological Drought Characterization in the Calabria Region (Southern Italy). Climate 2023, 11, 160. [Google Scholar] [CrossRef]
  12. Venturi, S.; Dunea, D.; Mateescu, E.; Virsta, A.; Petrescu, N.; Casadei, S. SPEI and SPI correlation in the study of drought phenomena in Umbria region (central Italy). Environ. Sci. Pollut. Res. 2025, 32, 168–188. [Google Scholar] [CrossRef] [PubMed]
  13. Mazzariello, A.; Albano, R.; Lacava, T.; Manfreda, S.; Sole, A. Intercomparison of recent microwave satellite soil moisture products on European ecoregions. J. Hydrol. 2023, 626, 130311. [Google Scholar] [CrossRef]
  14. Albano, R.; Lacava, T.; Mazzariello, A.; Manfreda, S.; Adamowski, J.; Sole, A. How Can Seasonality Influence the Performance of Recent Microwave Satellite Soil Moisture Products? Remote Sens. 2024, 16, 3044. [Google Scholar] [CrossRef]
  15. Li, Y.X.; Leng, P.; Kasim, A.A.; Li, Z.L. Spatiotemporal variability and dominant driving factors of satellite observed global soil moisture from 2001 to 2020. J. Hydrol. 2025, 654, 132848. [Google Scholar] [CrossRef]
  16. Normandin, C.; Frappart, F.; Bourrel, L.; Blarel, F.; Biancamaria, S.; Wigneron, J.P.; Galenon, L.; Bernard, E.; Coulon, L.; Lubac, B.; et al. Sharp decline in surface water resources for agriculture and fisheries in the Lower Mekong Basin over 2000–2020. Sci. Total Environ. 2024, 950, 175259. [Google Scholar] [CrossRef] [PubMed]
  17. Sylvestre, F.; Mahamat-Nour, A.; Naradoum, T.; Alcoba, M.; Gal, L.; Paris, A.; Cretaux, J.-F.; Pham-Duc, B.; Lescoulier, C.; Recouvreur, R.; et al. Strengthening of the hydrological cycle in the Lake Chad Basin under current climate change. Sci. Rep. 2024, 14, 24639. [Google Scholar] [CrossRef]
  18. Brown, J.F.; Wardlow, B.D.; Tadesse, T.; Hayes, M.J.; Reed, B.C. The Vegetation Drought Response Index (VegDRI): A new integrated approach for monitoring drought stress in vegetation. GISci. Remote Sens. 2008, 45, 16–46. [Google Scholar] [CrossRef]
  19. Martínez-Fernández, J.; González-Zamora, A.; Sánchez, N.; Gumuzzio, A. Herrero-Jiménez CM. Satellite soil moisture for agricultural drought monitoring: Assessment of the SMOS derived Soil Water Deficit Index. Remote Sens. Environ. 2016, 177, 277–286. [Google Scholar] [CrossRef]
  20. West, H.; Quinn, N.; Horswell, M. Remote sensing for drought monitoring & impact assessment: Progress, past challenges and future opportunities. Remote Sens. Environ. 2019, 232, 111291. [Google Scholar] [CrossRef]
  21. Bhardwaj, J.; Kuleshov, Y.; Chua, Z.W.; Watkins, A.B.; Choy, S.; Sun, Q. Evaluating satellite soil moisture datasets for drought monitoring in Australia and the Southwest Pacific. Remote Sens. 2022, 14, 3971. [Google Scholar] [CrossRef]
  22. Bolten, J.D.; Crow, W.T.; Zhan, X.; Jackson, T.J. Reynolds CA. Evaluating the Utility of Remotely Sensed Soil Moisture Retrievals for Operational Agricultural Drought Monitoring. IEEE J. Sel. Top. Appl. Earth Obs. Remote Sens. 2010, 3, 57–66. [Google Scholar] [CrossRef]
  23. Brocca, L.; Crow, W.T.; Ciabatta, L.; Massari, C.; de Rosnay, P.; Enenkel, M.; Hahn, S.; Amarnath, G.; Camici, S.; Tarpanelli, A.; et al. A Review of the Applications of ASCAT Soil Moisture Products. IEEE J. Sel. Top. Appl. Earth Obs. Remote Sens. 2017, 10, 2285–2306. [Google Scholar] [CrossRef]
  24. Chakraborty, A.; Seshasai, M.V.R.; Murthy, C.S.; Rao, S.V.C.K. Assessing early season drought condition using AMSR-E soil moisture product. Geomat. Nat. Hazards Risk 2012, 4, 164–186. [Google Scholar] [CrossRef]
  25. Crocetti, L.; Forkel, M.; Fischer, M.; Jurečka, F.; Grlj, A.; Salentinig, A.; Trnka, M.; Anderson, M.; Ng, W.-T.; Kokalj, Ž.; et al. Earth Observation for agricultural drought monitoring in the Pannonian Basin (southeastern Europe): Current state and future directions. Reg. Environ. Chang. 2020, 20, 123. [Google Scholar] [CrossRef]
  26. Du, J.; Kimball, J.S.; Velicogna, I.; Zhao, M.; Jones, L.A.; Watts, J.D.; Kim, Y. Multicomponent Satellite Assessment of Drought Severity in the Contiguous United States from 2002 to 2017 Using AMSR-E and AMSR2. Water Resour. Res. 2019, 55, 5394–5412. [Google Scholar] [CrossRef]
  27. Kędzior, M.; Zawadzki, J. SMOS data as a source of the agricultural drought information: Case study of the Vistula catchment, Poland. Geoderma 2017, 306, 167–182. [Google Scholar] [CrossRef]
  28. El Hajj, M.; Baghdadi, N.; Zribi, M.; Rodríguez-Fernández, N.; Wigneron, J.P.; Al-Yaari, A.; Al Bitar, A.; Albergel, C.; Calvet, J.C. Evaluation of SMOS, SMAP, ASCAT and Sentinel-1 soil moisture products at sites in Southwestern France. Remote Sens. 2018, 10, 569. [Google Scholar] [CrossRef]
  29. Jung, H.C.; Kang, D.H.; Kim, E.; Getirana, A.; Yoon, Y.; Kumar, S.; Peters-lidard, C.D.; Hwang, E. Towards a soil moisture drought monitoring system for South Korea. J. Hydrol. 2020, 589, 125176. [Google Scholar] [CrossRef]
  30. Mishra, A.; Vu, T.; Veettil, A.V.; Entekhabi, D. Drought monitoring with soil moisture active passive (SMAP) measurements. J. Hydrol. 2017, 552, 620–632. [Google Scholar] [CrossRef]
  31. Rassl, A.; Michel, D.; Hirschi, M.; Duguay-Tetzlaff, A.; Seneviratne, S.I. Climatological Drought Monitoring in Switzerland Using EUMETSAT SAF Satellite Data. Remote Sens. 2022, 14, 5961. [Google Scholar] [CrossRef]
  32. Sadri, S.; Pan, M.; Wada, Y.; Vergopolan, N.; Sheffield, J.; Famiglietti, J.S.; Kerr, Y.; Wood, E. A global near-real-time soil moisture index monitor for food security using integrated SMOS and SMAP. Remote Sens. Environ. 2020, 246, 111864. [Google Scholar] [CrossRef]
  33. Sánchez, N.; González-Zamora, Á.; Piles, M.; Martínez-Fernández, J. A new Soil Moisture Agricultural Drought Index (SMADI) integrating MODIS and SMOS products: A case of study over the Iberian Peninsula. Remote Sens. 2016, 8, 287. [Google Scholar] [CrossRef]
  34. Thi, N.Q.; Govind, A.; Ha, T.V. Spatial and temporal variability of soil moisture active and passive (SMAP) droughts and their impacts on vegetation in the Central Highlands of Vietnam. Environ. Monit. Assess. 2025, 197, 203. [Google Scholar] [CrossRef] [PubMed]
  35. Velpuri, N.M.; Senay, G.B.; Morisette, J.T. Evaluating new SMAP soil moisture for drought monitoring in the rangelands of the us high plains. Rangelands 2016, 38, 183–190. [Google Scholar] [CrossRef]
  36. Xu, Y.; Wang, L.; Ross, K.W.; Liu, C.; Berry, K. Standardized Soil Moisture Index for Drought Monitoring Based on Soil Moisture Active Passive Observations and 36 Years of North American Land Data Assimilation System Data: A Case Study in the Southeast United States. Remote Sens. 2018, 10, 301. [Google Scholar] [CrossRef]
  37. Zhu, Q.; Luo, Y.; Xu, Y.-P.; Tian, Y.; Yang, T. Satellite soil moisture for agricultural drought monitoring: Assessment of SMAP-derived Soil Water Deficit Index in Xiang River Basin, China. Remote Sens. 2019, 11, 362. [Google Scholar] [CrossRef]
  38. De Ridder, K. Surface soil moisture monitoring over Europe using Special Sensor Microwave/Imager (SSM/I) imagery. J. Geophys. Res. 2003, 108, ACL6.1–ACL6.10. [Google Scholar] [CrossRef]
  39. Li, L.; Gaiser, P.W.; Gao, B.C.; Bevilacuqa, R.M.; Jackson, T.J.; Njoku, E.G. WindSat Global Soil Moisture Retrieval and Validation. IEEE Trans. Geosci. Remote Sens. 2010, 48, 2224–2241. [Google Scholar] [CrossRef]
  40. Lacava, T.; Cuomo, V.; Di Leo, E.V.; Pergola, N.; Romano, F.; Tramutoli, V. Improving soil wetness variations monitoring from passive microwave satellite data: The case of April 2000 Hungary flood. Remote Sens. Environ. 2005, 96, 135–148. [Google Scholar] [CrossRef]
  41. Yang, W.; Meng, H.; Ferraro, R.R.; Chen, Y. Inter-Calibration of AMSU-A Window Channels. Remote Sens. 2020, 12, 2988. [Google Scholar] [CrossRef]
  42. Grody, N.C.; Weng, F.; Ferraro, R.R. Application of AMSU for hydrological parameters. In Microwave Radiometry and Remote Sensing of the Earth’s Surface and Atmosphere; Pampaloni, P., Paloscia, S., Eds.; VSP: Delft, The Netherlands, 2000; pp. 339–352. [Google Scholar]
  43. Tramutoli, V. Robust Satellite Techniques (RST) for natural and environmental hazards monitoring and mitigation: Theory and applications. In Proceedings of the 2007 International Workshop on the Analysis of Multi-Temporal Remote Sensing Images, Leuven, Belgium, 18–20 July 2007. [Google Scholar] [CrossRef]
  44. Lacava, T.; Greco, M.; Di Leo, E.V.; Martino, G.; Pergola, N.; Sannazzaro, F.; Tramutoli, V. Monitoring soil wetness variations by means of satellite passive microwave observations: The HYDROPTIMET study cases. Nat. Hazards Earth Syst. Sci. 2005, 5, 583–592. [Google Scholar] [CrossRef]
  45. Lacava, T.; Greco, M.; Di Leo, E.V.; Martino, G.; Pergola, N.; Romano, F.; Sannazzaro, F.; Tramutoli, V. Assessing the potential of SWVI (Soil Wetness Variation Index) for hydrological risk monitoring by satellite microwave observations. Adv. Geosci. 2005, 2, 221–227. [Google Scholar] [CrossRef]
  46. Lacava, T.; Brocca, L.; Calice, G.; Melone, F.; Moramarco, T.; Pergola, N.; Tramutoli, V. Soil moisture variations monitoring by AMSU-based soil wetness indices: A long-term inter-comparison with ground measurements. Remote Sens. Environ. 2010, 114, 2317–2325. [Google Scholar] [CrossRef]
  47. Manfreda, S.; Lacava, T.; Onorati, B.; Pergola, N.; Di Leo, M.; Margiotta, M.R.; Tramutoli, V. On the use of AMSU-based products for the description of soil water content at basin scale. Hydrol. Earth Syst. Sci. 2011, 15, 2839–2852. [Google Scholar] [CrossRef]
  48. Coluzzi, R.; D’emilio, M.; Imbrenda, V.; Giorgio, G.A.; Lanfredi, M.; Macchiato, M.; Ragosta, M.; Simoniello, T.; Telesca, V. Investigating climate variability and long-term vegetation activity across heterogeneous Basilicata agroecosystems. Geomat. Nat. Hazards Risk 2018, 10, 168–180. [Google Scholar] [CrossRef]
  49. Marzia, G.; Previtali, M. A GIS and Remote Sensing Approach for Desertification Sensitivity Assessment in Basilicata Region (Italy), Paper presented at ICGDA 2020. In Proceedings of the 2020 3rd International Conference on Geoinformatics and Data Analysis (ICGDA ‘20), New York, NY, USA, 1 July 2020; pp. 62–66. [Google Scholar] [CrossRef]
  50. Canora, F.; D’Angella, A.; Aiello, A. Quantitative assessment of the sensitivity to desertification in the Bradano River basin (Basilicata, southern Italy). J. Maps 2014, 11, 745–759. [Google Scholar] [CrossRef]
  51. Cillis, G.; Tucci, B.; Santarsiero, V.; Nolè, G.; Lanorte, A. Understanding Land Changes for Sustainable Environmental Management: The Case of Basilicata Region (Southern Italy). Pollutants 2021, 1, 217–233. [Google Scholar] [CrossRef]
  52. Bartalis, Z.; Naeimi, V.; Hasenauer, S.; Wagner, W. ASCAT Soil Moisture Product Handbook. In ASCAT Soil Moisture Report Series; Institute of Photogrammetry and Remote Sensing, Vienna University of Technology: Vienna, Austria, 2008; Volume 15. [Google Scholar]
  53. Wagner, W.; Hahn, S.; Kidd, R.; Melzer, T.; Bartalis, Z.; Hasenauer, S.; Figa, J.; De Rosnay, P.; Jann, A.; Schneider, S.; et al. The ASCAT Soil Moisture Product: A Review of its Specifications, Validation Results, and Emerging Applications. Meteorol. Z. 2013, 22, 5–33. [Google Scholar] [CrossRef]
  54. Escorihuela, M.J.; Quintana-Seguí, P. Comparison of remote sensing and simulated soil moisture datasets in Mediterranean landscapes. Remote Sens. Environ. 2016, 180, 99–114. [Google Scholar] [CrossRef]
  55. Brocca, L.; Ciabatta, L.; Massari, C.; Camici, S.; Tarpanelli, A. Soil Moisture for Hydrological Applications: Open Questions and New Opportunities. Water 2017, 9, 140. [Google Scholar] [CrossRef]
  56. Vicente-Serrano, S.M.; Beguería, S.; López-Moreno, J.I. A Multi-scalar drought index sensitive to global warming: The Standardized Precipitation Evapotranspiration Index—SPEI. J. Clim. 2010, 23, 1696–1718. [Google Scholar] [CrossRef]
  57. Imbrenda, V.; Lanfredi, M.; Coluzzi, R.; Simoniello, T. A smart procedure for assessing the health status of terrestrial habitats in protected areas: The case of the natura 2000 ecological network in Basilicata (southern Italy). Remote Sens. 2022, 14, 2699. [Google Scholar] [CrossRef]
  58. Coda, S.; Allocca, P.; Calcaterra, D.; Castello, N.; Cusano, D.; De Vita, P.; Lepore, D.; Petrone, P.; Prosser, G.; Allocca, V. Hydrogeology of the lower sector of Basento and Cavone river basins (southern Italy). J. Maps 2025, 21, 2451786. [Google Scholar] [CrossRef]
  59. Romano, S.; Cozzi, M.; Viccaro, M.; di Napoli, F. The Green Economy for Sustainable Development: A Spatial Multi-Criteria Analysis—Ordered Weighted Averaging Approach in the Siting Process for Short Rotation Forestry in the Basilicata Region, Italy. Ital. J. Agron. 2013, 8, e21. [Google Scholar] [CrossRef]
  60. Autorità di Bacino della Basilicata. Piano di Gestione del Rischio di Alluvioni. 2015. Available online: https://www.distrettoappenninomeridionale.it/wp-content/uploads/2024/01/r.4.5-rel.-basilicata.pdf (accessed on 3 June 2025).
  61. Goodrum, G.; Kidwell, K.B.; Winston, W. (Eds.) NOAA KLM User’s Guide; NOAA: Suitland, MD, USA, 1997; NOAA-NESDIS/NCDC.
  62. Ferraro, R.R.; Weng, F.; Grody, N.C.; Zhao, L.; Meng, H.; Kongoli, C.; Pellegrino, P.; Qiu, S.; Dean, C. NOAA operational hydrological products derived from the advanced microwave sounding unit. IEEE Trans. Geosci. Remote Sens. 2005, 43, 1036–1049. [Google Scholar] [CrossRef]
  63. Lakshmi, V.; Wood, E.F.; Choudhury, B.J. Evaluation of special sensor microwave/imager satellite data for regional soil moisture estimation over the red river basin. J. Appl. Meteorol. 1997, 36, 1309–1328. [Google Scholar] [CrossRef]
  64. Prigent, C.; Rossow, W.B.; Matthews, E. Microwave land surface emissivity estimated from SSM/I. J. Geophys. Res. 1997, 102, 867–890. [Google Scholar]
  65. Basist, A.; Grody, N.; Peterson, T.C.; Williams, C.N. Using the special sensor microwave/imager to monitor land surface temper atures, wetness, and snow cover. J. Appl. Meteorol. 1998, 37, 888–911. [Google Scholar] [CrossRef]
  66. Basist, A.; Williams, C., Jr.; Ross, T.F.; Menne, M.J.; Grody, N.; Ferraro, R.; Shen, S.; Chang, A.T. Using the special sensor microwave/imager to monitor surface wetness. J. Hydrol. 2001, 2, 297–308. [Google Scholar]
  67. NWP SAF. ATOVS and AVHRR Pre-Processing Package (AAPP). 2024. Available online: https://nwp-saf.eumetsat.int/site/software/aapp/ (accessed on 3 June 2025).
  68. ESA. MetOp Status, ESA Bulletin, No 145, February 2011, p. 84. 2011. Available online: https://esamultimedia.esa.int/multimedia/publications/ESA-Bulletin-145/ESA-Bulletin-145.pdf (accessed on 3 June 2025).
  69. EUMETSAT. Anomaly Channel-15 AMSU-A on MetOp-B, Service Alert n. 2294. 2016. Available online: https://uns.eumetsat.int/?filter=permanentfailures (accessed on 3 June 2025).
  70. Wagner, W.; Lemoine, G.; Rott, H. A Method for Estimating Soil Moisture from ERS Scatterometer and Soil Data. Remote Sens. Environ. 1999, 70, 191–207. [Google Scholar] [CrossRef]
  71. H SAF. ASCAT Surface Soil Moisture Climate Data Record v5 12.5 km Sampling—Metop; EUMETSAT SAF on Support to Operational Hydrology and Water Management: Darmstadt, Germany, 2020. [Google Scholar] [CrossRef]
  72. Beguería, S.; Latorre, B.; Reig, F.; Vicente-Serrano, S.M. Global SPEI Database. 2024. Available online: https://spei.csic.es/database.html (accessed on 3 June 2025).
  73. Durbin, J.; Watson, G.S. Testing for serial correlation in least squares regression. I. Biometrika. 1950, 37, 409–428. [Google Scholar] [PubMed]
  74. Shapiro, S.S.; Wilk, M.B. An Analysis of Variance Test for Normality (Complete Samples). Biometrika 1965, 52, 591–611. [Google Scholar] [CrossRef]
  75. Pearson, K. Notes on Regression and Inheritance in the Case of Two Parents. Proc. R. Soc. Lond. 1895, 58, 240–242. [Google Scholar] [CrossRef]
  76. Sen, P.K. Estimates of the regression coefficient based on Kendall’s tau. J. Am. Stat. Assoc. 1968, 63, 1379–1389. [Google Scholar] [CrossRef]
  77. Zeng, Z.; Wu, W.; Peñuelas, J.; Li, Y.; Jiao, W.; Li, Z.; Ren, X.; Wang, K.; Ge, Q. Increased risk of flash droughts with raised concurrent hot and dry extremes under global warming. npj Clim. Atmos. Sci. 2023, 6, 134. [Google Scholar] [CrossRef]
  78. Gabriele, M.; Brumana, R.; Previtali, M.; Cazzani, A. A combined GIS and remote sensing approach for monitoring climate change-related land degradation to support landscape preservation and planning tools: The Basilicata case study. Appl. Geomat. 2023, 15, 497–532. [Google Scholar] [CrossRef]
  79. The Blue Community. Italy: Water Crisis in Basilicata. 2024. Available online: https://blue-community.net/2024/12/09/italy-water-crisis-in-basilicata/ (accessed on 3 June 2025).
  80. Ionita, M.; Nagavciuc, V. Changes in drought features at the European level over the last 120 years. Nat. Hazards Earth Syst. Sci. 2021, 21, 1685–1701. [Google Scholar] [CrossRef]
  81. Iturbide, M.; Gutiérrez, J.M.; Alves, L.M.; Bedia, J.; Cerezo-Mota, R.; Cimadevilla, E.; Cofiño, A.S.; Di Luca, A.; Faria, S.H.; Gorodetskaya, I.V.; et al. An update of IPCC climate reference regions for subcontinental analysis of climate model data: Definition and aggregated datasets. Earth Syst. Sci. Data. 2020, 12, 2959–2970. [Google Scholar] [CrossRef]
  82. Vicente-Serrano, S.M.; Domínguez-Castro, F.; Murphy, C.; Hannaford, J.; Reig, F.; Peña-Angulo, D.; Tramblay, Y.; Trigo, R.M.; Mac Donald, N.; Luna, M.Y.; et al. Long-term variability and trends in meteorological droughts in Western Europe (1851–2018). Int. J. Clim. 2021, 41, E690–E717. [Google Scholar] [CrossRef]
  83. Mirauda, D.; Cirigliano, S. A comparative analysis of drought indices in evaluating climate change impacts on agriculture in Southern Italy. 21 May 2024; PREPRINT (Version 1). [Google Scholar] [CrossRef]
  84. McKee, T.B.; Doesken, N.J.; Kleist, J. The relationship of drought frequency and duration to time scales. In Proceedings of the 8th Conference on Applied Climatology, Anaheim, CA, USA, 17–22 January 1993; Americ Meteorol Soc: Fort Collins, CO, USA; pp. 179–184, Mass. [Google Scholar]
  85. Tsakiris, G.; Vangelis, H. Establishing a drought index incorporating evapotranspiration. Eur. Water 2005, 9, 3–11. [Google Scholar]
  86. Space It up. 2025. Available online: https://spaceitup.it/ (accessed on 3 June 2025).
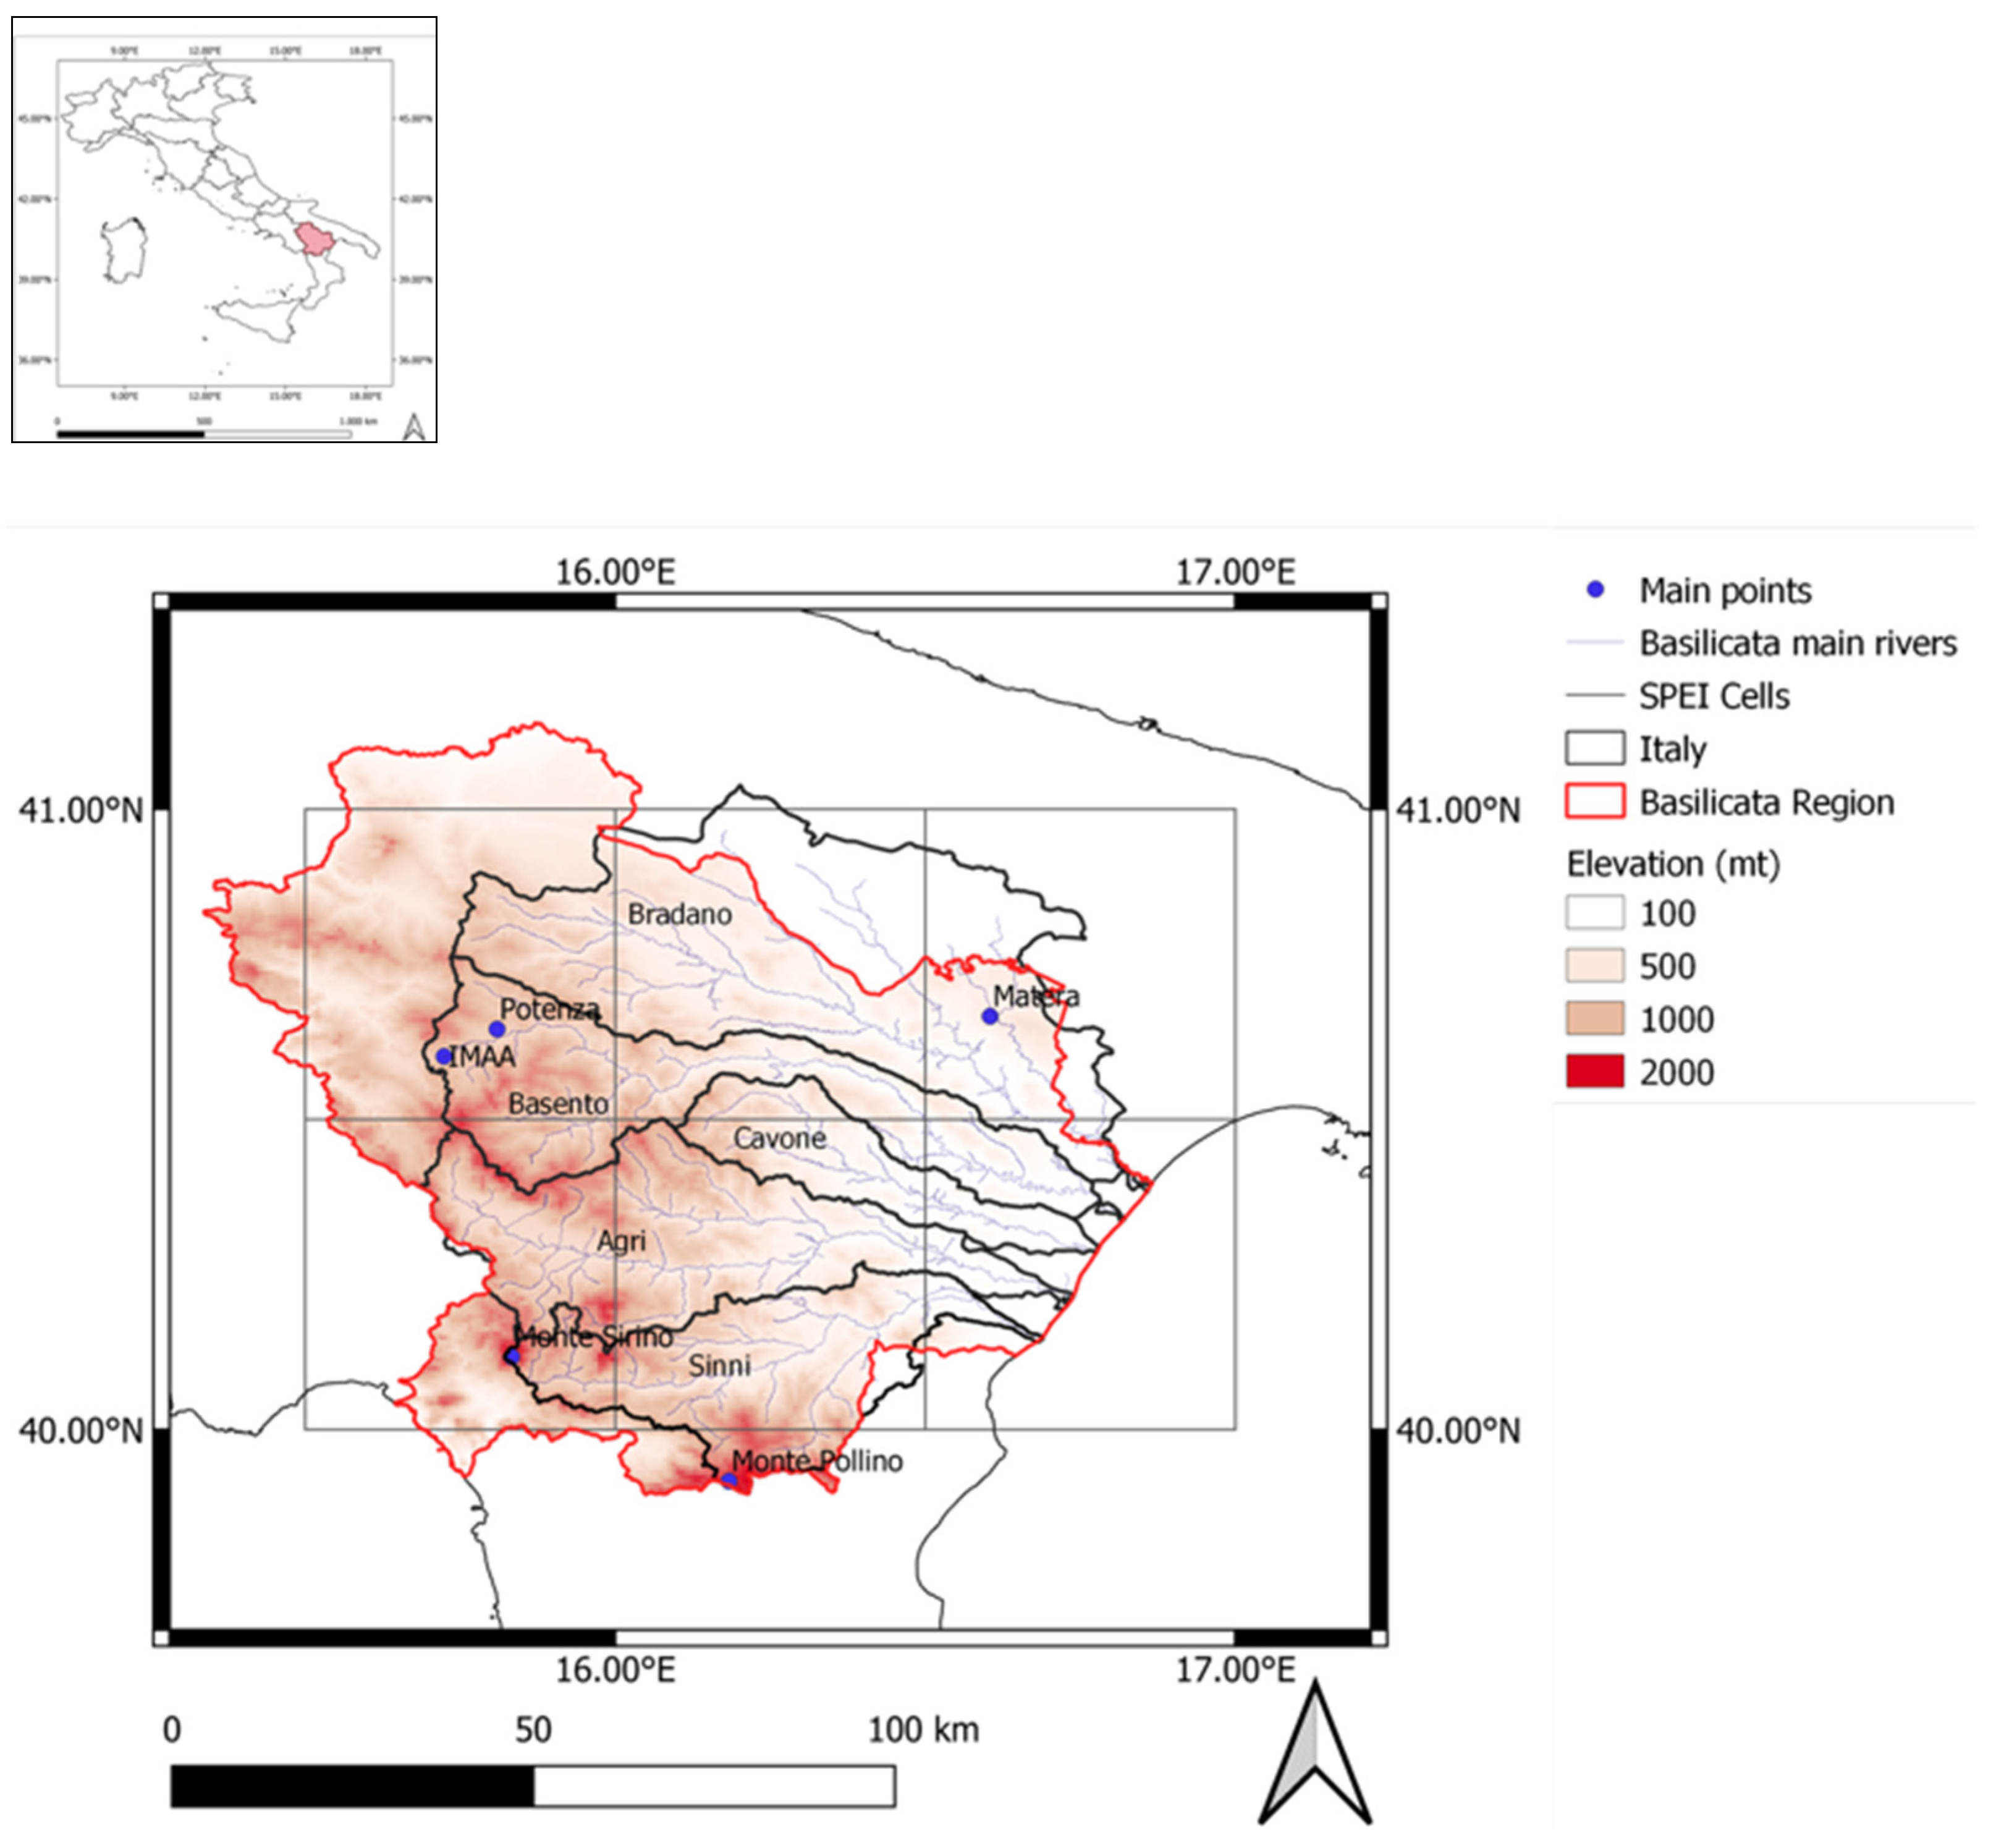
Figure 1. Basilicata region localization with an indication of the main rivers and corresponding basins. In the gray lines, the SPEI cells are depicted, while the terrain elevation is shown in the background. The location of the main points cited in the text is also indicated.
Land 14 01239 g001
Figure 2. SWI map of the AMSU MetOp-A data acquired on 13 September 2010.
Land 14 01239 g002
Figure 3. Workflow of the proposed methodology.
Land 14 01239 g003
Figure 4. Monthly variability of the SWI values spatially averaged over: (a) Agri Basin; (b) Basento Basin; (c) Bradano Basin; (d) Sinni Basin. Data were collected by MetOp-B in ascending (blue line) and descending orbits. In each panel, the p-values of both the series, the Pearson coefficient of correlation (r), and the RMSE between the series are also reported.
Land 14 01239 g004
Figure 5. Monthly variability of the SWI values spatially averaged over: (a) Agri Basin; (b) Basento Basin; (c) Bradano Basin; (d) Sinni Basin. Data were collected by MetOp-A (blue line) and MetOp-B (red line). In each panel, the p-values of both the series, the Pearson coefficient of correlation (r), and the RMSE between the series are also reported.
Land 14 01239 g005
Figure 6. Monthly variability of the normalized MetOP-B SWI values and ASCAT measurements spatially averaged over (a,b) the Agri Basin, (c,d) Basento Basin, (e,f) Bradano Basin, and (g,h) Sinni Basin.
Land 14 01239 g006
Figure 7. Monthly variability and corresponding confidence interval of the normalized MetOP-A SWI values and the ASCAT measurements spatially averaged over (a) the Agri Basin, (b) Basento Basin, (c) Bradano Basin, and (d) Sinni Basin. The linear trend for each series is also reported.
Land 14 01239 g007aLand 14 01239 g007b
Figure 8. Representation of the (a) SPEI01 variability and corresponding confidence interval averaged over the Basilicata region territory. (b) Monthly variability of the MetOP-A SWI values averaged over the Basilicata region territory.
Land 14 01239 g008
Figure 9. The dashed line is the monthly variability of the MetOP-A SWI values averaged over the Basilicata region territory (as black line in Figure 8b). The orange lines are the corresponding deseasonalized series and trend.
Land 14 01239 g009
Table 1. AMSU-MetOp data availability at the IMAA archive.
Ascending Orbit
(Around 09:30 UTC)
Descending Orbit
(Around 21:30 UTC)
MetOp-AMay 2007–March 2021May 2007–February 2010
MetOp-BJanuary 2013–October 2016January 2013–October 2016
Table 2. Correlation (r) matrix for all of the trends shown in Figure 4.
MetOp-B Asc
AgriBasentoBradanoSinniBasilicata
Agri---
Basento0.90---
Bradano0.780.94---
Sinni0.940.850.69---
Basilicata0.950.980.920.90---
Mean0.910.940.860.880.95
MetOp-B Des
AgriBasentoBradanoSinniBasilicata
Agri---
Basento0.95---
Bradano0.880.94---
Sinni0.910.850.78---
Basilicata0.970.970.950.90---
Mean0.940.940.850.890.96
Table 3. Correlation matrix (r) for all of the trends shown in Figure 7.
AgriBasentoBradanoSinni
Agri--- Agri
Basento0.90--- Basento
Bradano0.810.92--- Bradano
Sinni0.900.900.73---Sinni
Basilicata0.940.940.920.86Basilicata
Mean0.870.910.870.83Mean
Table 4. Main features of the trend shown in Figure 7.
AgriBasentoBradanoSinni
Linear regression slope−0.00598−0.00595−0.00797−0.00646
Sen’s slope−0.00580−0.00588−0.00693−0.00668
Disclaimer/Publisher’s Note: The statements, opinions and data contained in all publications are solely those of the individual author(s) and contributor(s) and not of MDPI and/or the editor(s). MDPI and/or the editor(s) disclaim responsibility for any injury to people or property resulting from any ideas, methods, instructions or products referred to in the content.