Article

Spatiotemporal Variations of Cropland Quality and Morphology Under the Requisition–Compensation Balance Policy

1
School of Geography and Remote Sensing, Guangzhou University, Guangzhou 510006, China
2
Huangpu Research School of Guangzhou University, Guangzhou 510006, China
*
Author to whom correspondence should be addressed.
Land 2025, 14(6), 1235; https://doi.org/10.3390/land14061235
Submission received: 30 April 2025 / Revised: 2 June 2025 / Accepted: 6 June 2025 / Published: 8 June 2025

Abstract

:
The Requisition–Compensation Balance of Cropland (RCBC) policy is important for ensuring food security. Previous studies have mainly focused on the quantity and quality of cropland when assessing the impacts of this policy. In terms of morphology, previous studies have primarily relied on landscape indicators. Therefore, this study aims to thoroughly analyze the impacts of the RCBC policy on the quality and morphology of cropland (especially morphological spatial pattern analysis, MSPA) in the Pearl River Delta (PRD) during 1996–2021. To this end, we constructed a comprehensive evaluation index system by combining MSPA, landscape indicators, and field research. The results show that the cropland quality in the PRD has exhibited a consistent improvement trend. High-quality cropland is spreading from central cities to the periphery, and the spatial distribution is becoming more even. Nonetheless, MSPA reveals an increasing trend of cropland fragmentation. The results indicate a decline in the area of the “core”, an increase in the area of the “island”, and a decrease in the connectivity of the cropland. Our field research confirms that the RCBC policy has indirectly exacerbated cropland fragmentation. In many regions of the PRD, the fragmentation of cropland hinders the application of agricultural mechanization and increases the cost of cultivation, resulting in severe cropland abandonment. Therefore, local governments should implement rigorous planning and prioritize cropland morphology when compensating cropland. Our findings are expected to provide empirical evidence for improving the RCBC policy and protecting cropland.

1. Introduction

Cropland resource plays a pivotal role in ensuring food security, which is the foundation of national economy, people’s livelihood, and social stability [1,2]. However, with the accelerated development of the global economy, the increasing demand for construction land has inevitably led to a significant reduction in available cropland [3,4,5,6]. To address this challenge while maintaining the minimum amount of cropland, the Chinese government formulated the Requisition–Compensation Balance of Cropland (RCBC) policy in 1997 [7]. This policy stipulates that the amount of newly added cropland must equal the amount of cropland occupied by non-agricultural development, thereby maintaining the dynamic balance of the total cropland area [8]. Since its implementation, the RCBC policy has undergone several stages of development, from the initial quantity balance to the consideration of both quantity and quality balance [9].
The RCBC policy has made a valuable contribution to addressing the rapid loss of cropland, and has generally achieved a quantitative balance of cropland at the national scale [10]. However, the implementation process at the local government level has encountered certain challenges. For example, the quality of compensatory cropland has been found to be substandard, with difficulty in achieving the initial level of occupied cropland [11,12]. In some provinces, there is a shortage of reserve cropland, and the reclamation of compensatory cropland faces great difficulties [13]. Furthermore, the predominance of non-grain production in cropland has been observed in specific regions, which severely reduces grain yield [14,15]. The fragmentation and marginalization of compensatory cropland are becoming increasingly pronounced [16,17]. This indicates that the cropland is divided into small and dispersed patches, which in turn leads to a reduction in spatial connectivity. Consequently, the quality of the cropland deteriorates, and its remote location results in inefficient utilization or eventual abandonment. These challenges not only diminish the utilization efficiency of cropland, but also complicate the protection of this vital resource. Therefore, a thorough assessment of the impact of RCBC policy is essential to provide decision support for cropland management and protection.
Previous studies have primarily centered on the impact of the RCBC policy on the quantity and quality of cropland. For example, Chen et al. examined the implementation of cropland balance in the middle reaches of the Yangtze River Delta in China [18]. They revealed that high-quality cropland has been occupied and replaced by low-quality cropland within the region. Su et al. identified disparities in quality between the occupied cropland and compensatory cropland in the Taihu Lake watershed [19].
While previous studies have extensively analyzed the changes in the quantity and quality of cropland, less attention has been paid to the impact of the RCBC policy on cropland morphology. Cropland morphology exhibits a close correlation with food productivity [20,21]. Many studies have shown that cropland morphology can affect the types of crops cultivated, the scale of cultivation, and the use of modern techniques, which in turn affects grain yield. For example, Xu et al. found that the fragmentation of cropland has a negative impact on the degree of agricultural specialization [22]. By analyzing the relationship between the distribution of cropland and economic costs, Janus et al. found that the changes in cultivation costs were related to the size of cropland and its distance from built-up areas [23]. Shao et al. found that the adoption of new agricultural technologies to enhance cultivation efficiency is more challenging in fragmented cropland than in contiguous cropland [24].
In fact, landscape indicators were commonly used for analyzing cropland morphology. For example, Liang et al. analyzed the landscape pattern of cropland in the Huaihe Basin of China using landscape indicators, and found that the overall degree of fragmentation has been increasing [25]. Cao et al. examined the dispersion and fragmentation of cropland based on landscape indicators, and explored its relationship with the utilization and eco-efficiency of cropland [26]. Although landscape indicators can easily reflect the landscape pattern of cropland, it is difficult to spatially reveal the dynamic changes in land use morphology. In contrast, morphological spatial pattern analysis (MSPA) can identify different land use elements at the micro-scale, thereby intuitively depicting their spatial distribution characteristics [27,28,29].
Therefore, this study aims to investigate the dual impacts of the RCBC policy on cropland quality and morphology (especially MSPA) from a long time series perspective. We focused on the period from 1996 to 2021, covering the key situations before and after the implementation of the RCBC policy. The Pearl River Delta was selected as the study area because the quality and morphology of cropland are facing great challenges under rapid urban expansion. Specifically, we explored the spatiotemporal characteristics of cropland occupation and compensation from the perspectives of quality and morphology. Moreover, we investigated the specific situation of cropland fragmentation in typical regions through field research. The findings of this study are expected to contribute to the development of a more effective RCBC policy and the strengthening of cropland protection.

2. Materials and Methods
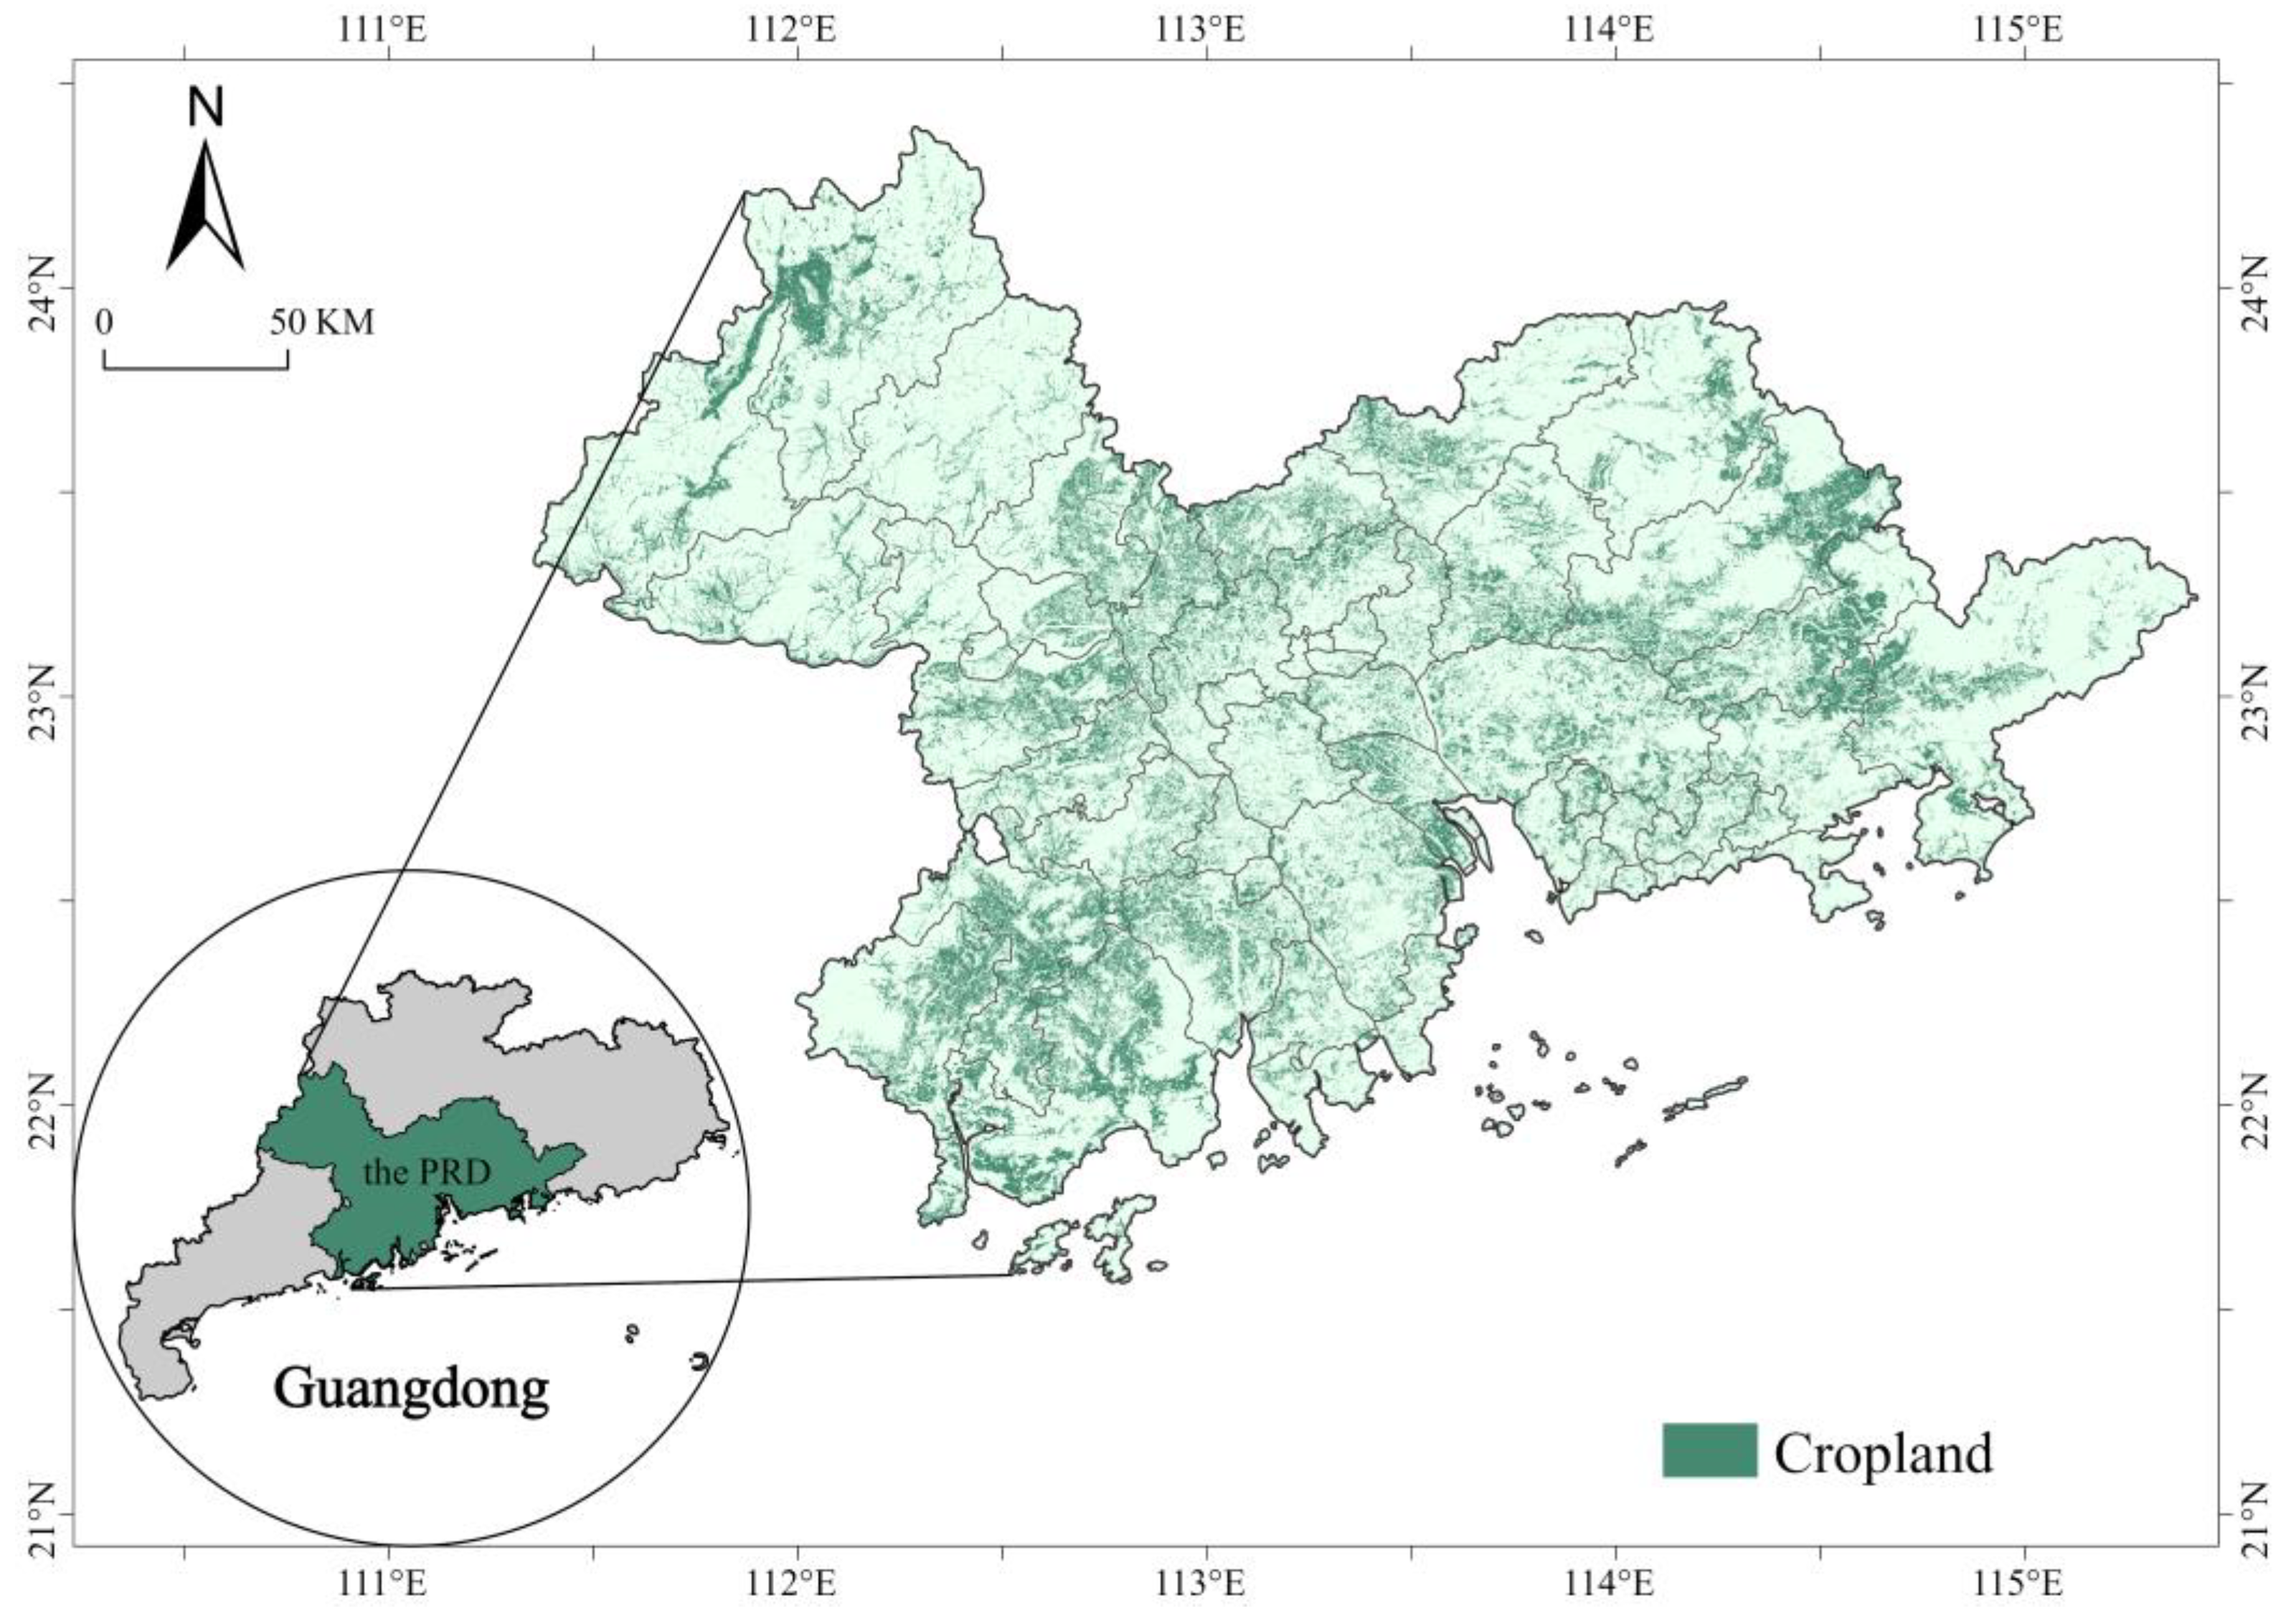
2.1. Study Area

The ever-increasing demand for urban land in the Pearl River Delta (PRD) has inevitably exerted an adverse impact on cropland [30]. A large amount of cropland has been occupied by commercial, industrial, and residential areas [31]. These processes have further led to the increasing fragmentation of cropland, which not only reduces the efficiency of cropland utilization, but also complicates the management and protection of cropland [32,33]. The connectivity between cropland is also weakened, leading to lower agricultural productivity [34,35]. For these reasons, we chose the PRD as a study area to examine the changes in the quality and morphology of cropland before and after the implementation of the RCBC policy (Figure 1).

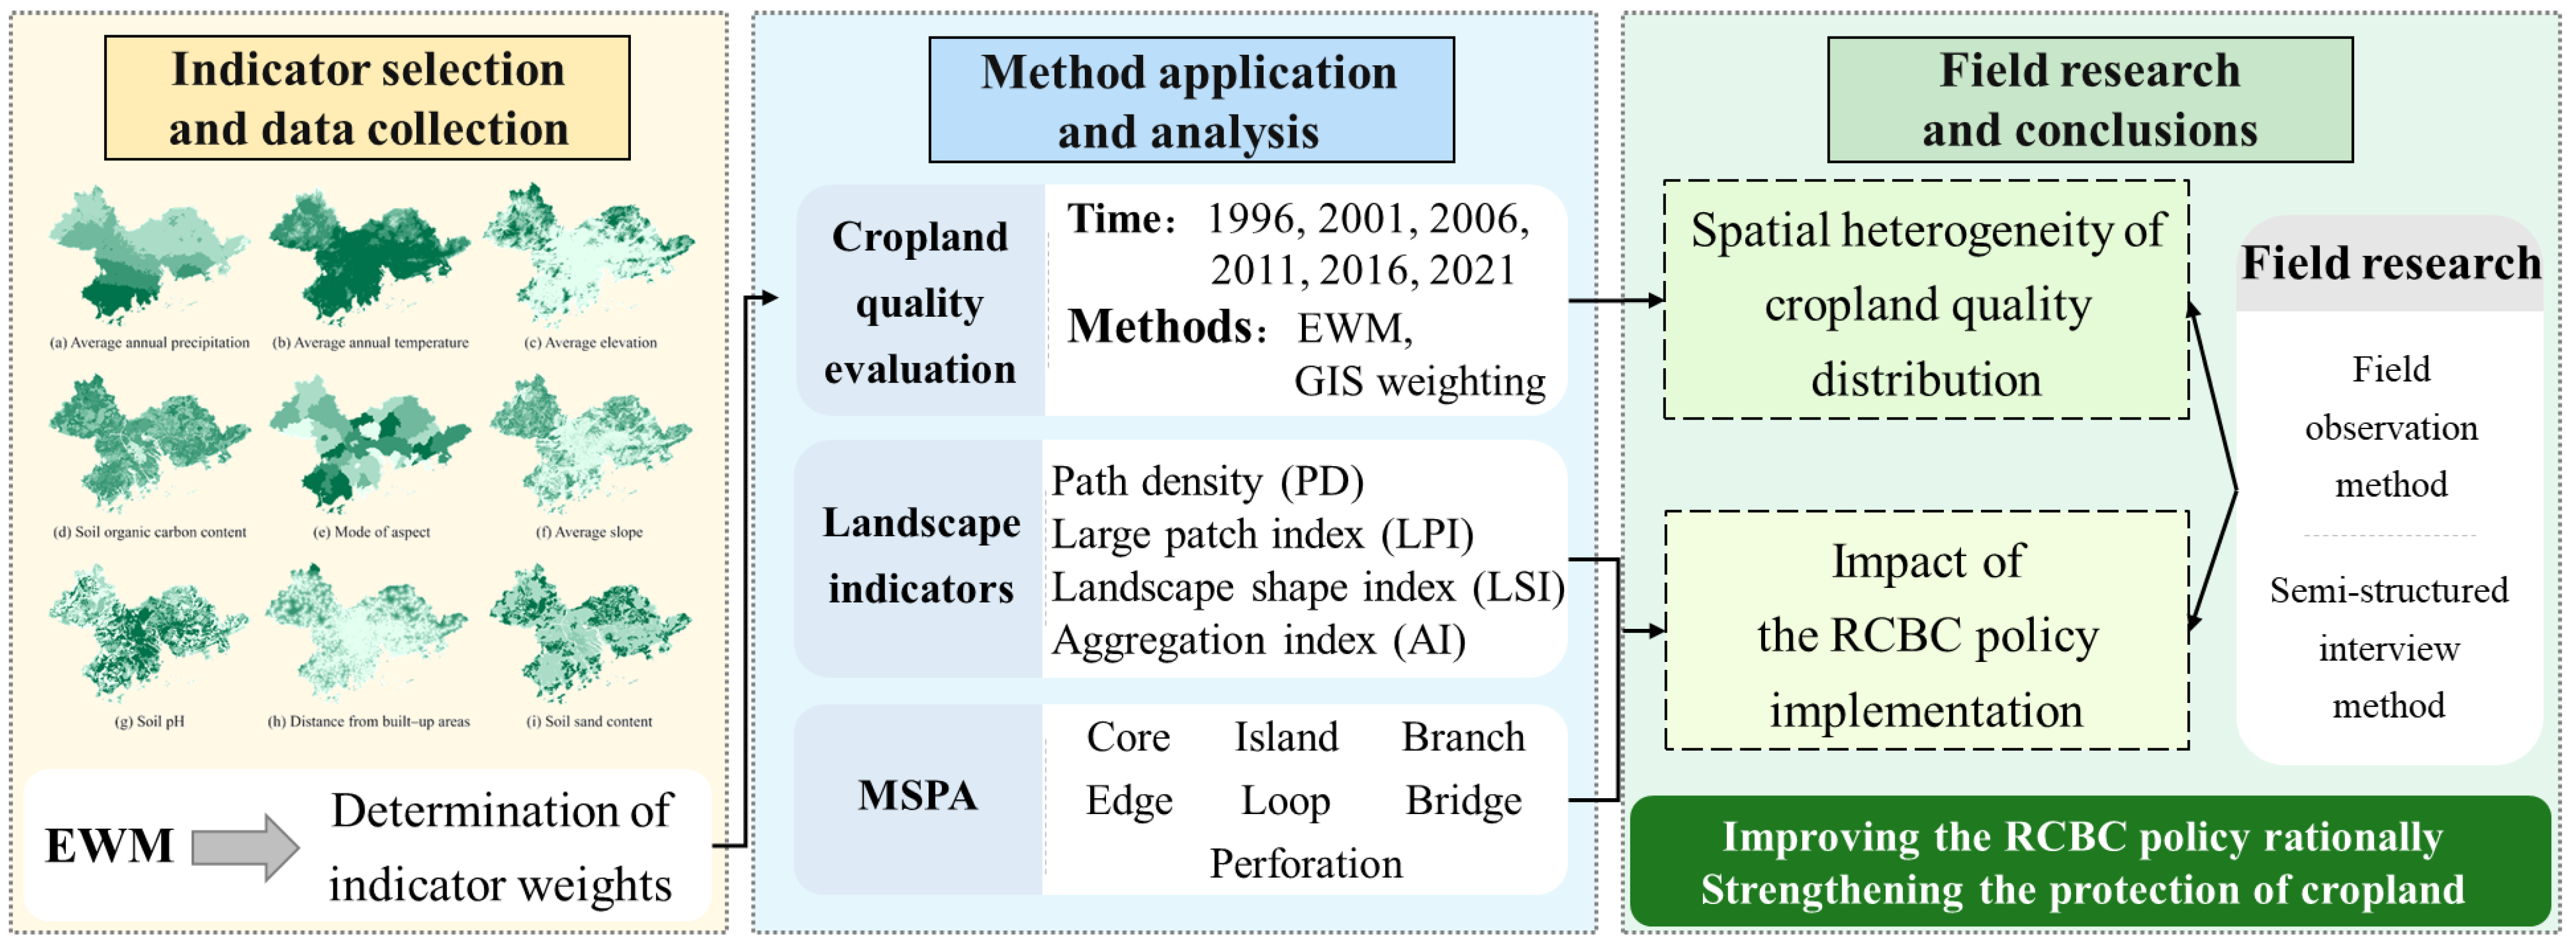
2.2. Research Framework

The aim of this study is to investigate the dual impacts of the RCBC policy on cropland quality and morphology during 1996–2021 (Figure 2). First, a comprehensive evaluation index system for assessing cropland quality was constructed based on previous studies. Second, the changes in cropland morphology were analyzed by combining landscape indicators, MSPA, and field research. Finally, we proposed some recommendations for improving the RCBC policy based on the findings.

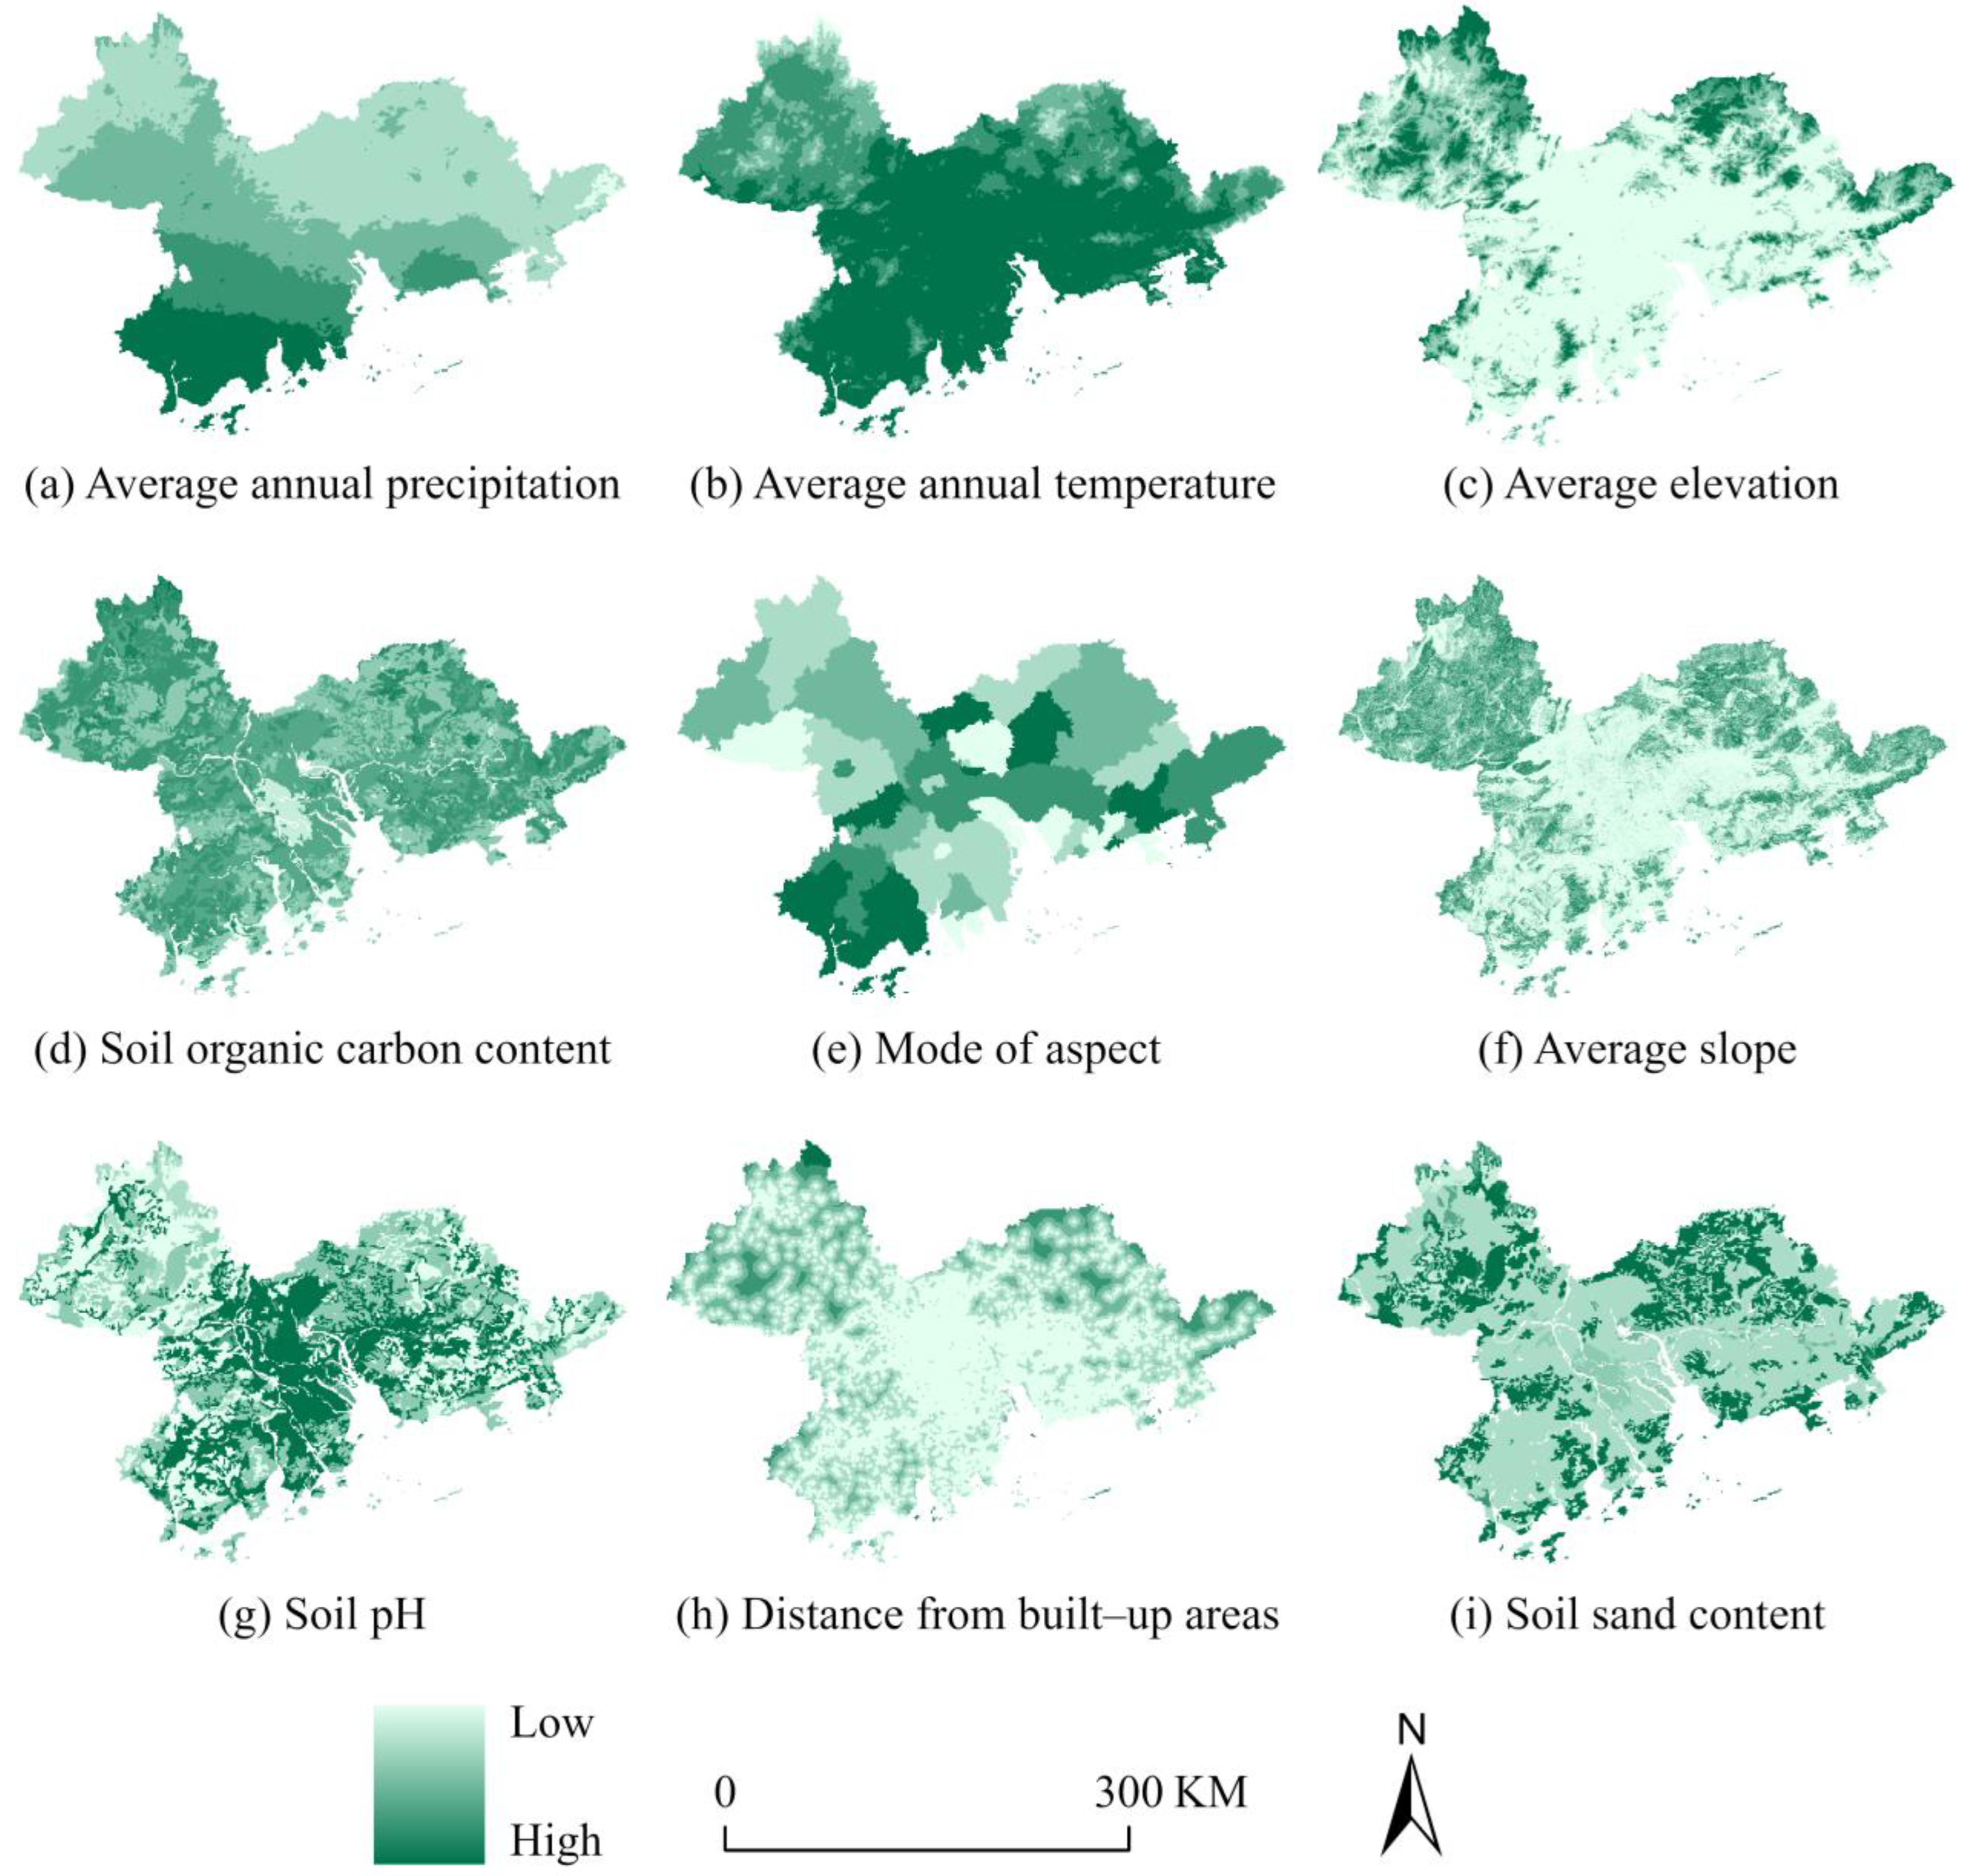
2.3. Data Sources and Processing

The objective of cropland quality evaluation is to comprehensively measure the ability of cropland to meet the needs of agricultural production under the combined influence of natural conditions and human activities [36]. In accordance with previous studies [37,38,39,40,41], average annual precipitation, average annual temperature, average elevation, soil organic carbon content, mode of aspect, average slope, soil pH, distance from built-up areas, and soil sand content were selected as indicators of cropland quality (Table 1 and Figure 3). The entropy weight method (EWM) is an objective weighting approach rooted in information entropy theory. It assigns weights to indicators based on data dispersion. Specifically, greater informational value, as indicated by higher dispersion, is associated with larger weights [42]. We used the EWM to calculate the weight of each indicator (Table 2).

2.4. Methods

2.4.1. Landscape Indicators

The spatial distribution of cropland in the PRD from 1996 to 2021 was first analyzed based on a series of landscape indicators. In accordance with previous studies [47,48,49], four indicators (Table 3) reflecting fragmentation, largest patch dominance, shape complexity, and spatial aggregation (path density (PD), the large patch index (LPI), landscape shape index (LSI), and aggregation index (AI)) were adopted. First, PD is the number of patches per unit area, and a larger PD suggests higher fragmentation of cropland. Second, the LPI increases with the dominance of cropland. Third, the LSI reflects the complexity of cropland parcels, with higher values implying more complex shapes. Fourth, the AI increases with the aggregation degree of cropland parcels.

2.4.2. MSPA

MSPA is a methodology for the identification and segmentation of raster images based on morphological principles, with the objective of effectively distinguishing between different land use elements [50] (Table 4). Compared with traditional landscape indicators, MSPA exhibits two key advantages. First, it offers a rich source of spatial information. Second, it possesses a robust capacity for identifying morphological elements. Consequently, MSPA facilitates a more intuitive analysis of spatial patterns associated with land use [51,52]. In this study, MSPA was used to analyze the morphological spatial pattern of cropland in the PRD from 1996 to 2021, and to calculate the proportion of each morphological element in cropland.
In this study, MSPA was conducted in Guidos Toolbox 3.0 software with an eight-neighborhood configuration. Cropland and non-cropland were defined as foreground and background, respectively. Through multiple parameter adjustments, we observed that larger edge width settings led to more pronounced fragmentation of cropland in the MSPA results. Therefore, the edge width was ultimately calibrated to 2 pixels. The natural breaks method was employed to classify the “core” into four categories by size: “small core” (0–1.216 km2), “medium core” (1.216–7.919 km2), “large core” (7.919–24.231 km2), and “super-large core” (≥24.231 km2).

2.4.3. Field Research

To thoroughly investigate the issues of cropland occupation–compensation and fragmentation, we selected typical regions for field research based on the above quantitative analysis. First, we conducted preliminary interviews with 20 people concerned in rural areas of the PRD to ascertain their perspectives on issues related to cropland occupation–compensation and fragmentation. Based on the insights gathered through these interviews, we identified the following categories of potential interviewees: farmers, retired farmers, village officials, and agricultural technicians, and designed interview contents corresponding to each category of interviewees (Table 5).
Then, we traveled extensively to typical regions that exhibited severe cropland fragmentation. Specifically, we visited six regions, including Enping City, Boluo County, Huiyang District, Haizhu District, Guangming District, and Nanshan District, over a period of 42 days from July to September 2024. By combining field observation and semi-structured interview methods, we thoroughly investigated the distribution of cropland, land use status, and the implementation of the RCBC policy. Finally, we performed stratified sampling based on interviewee categories and conducted formal interviews with 87 interviewees. The audio recordings of these interviews were transcribed into text. Subsequently, we employed a keyword analysis methodology to extract and analyze pertinent content from the transcriptions.

3. Results

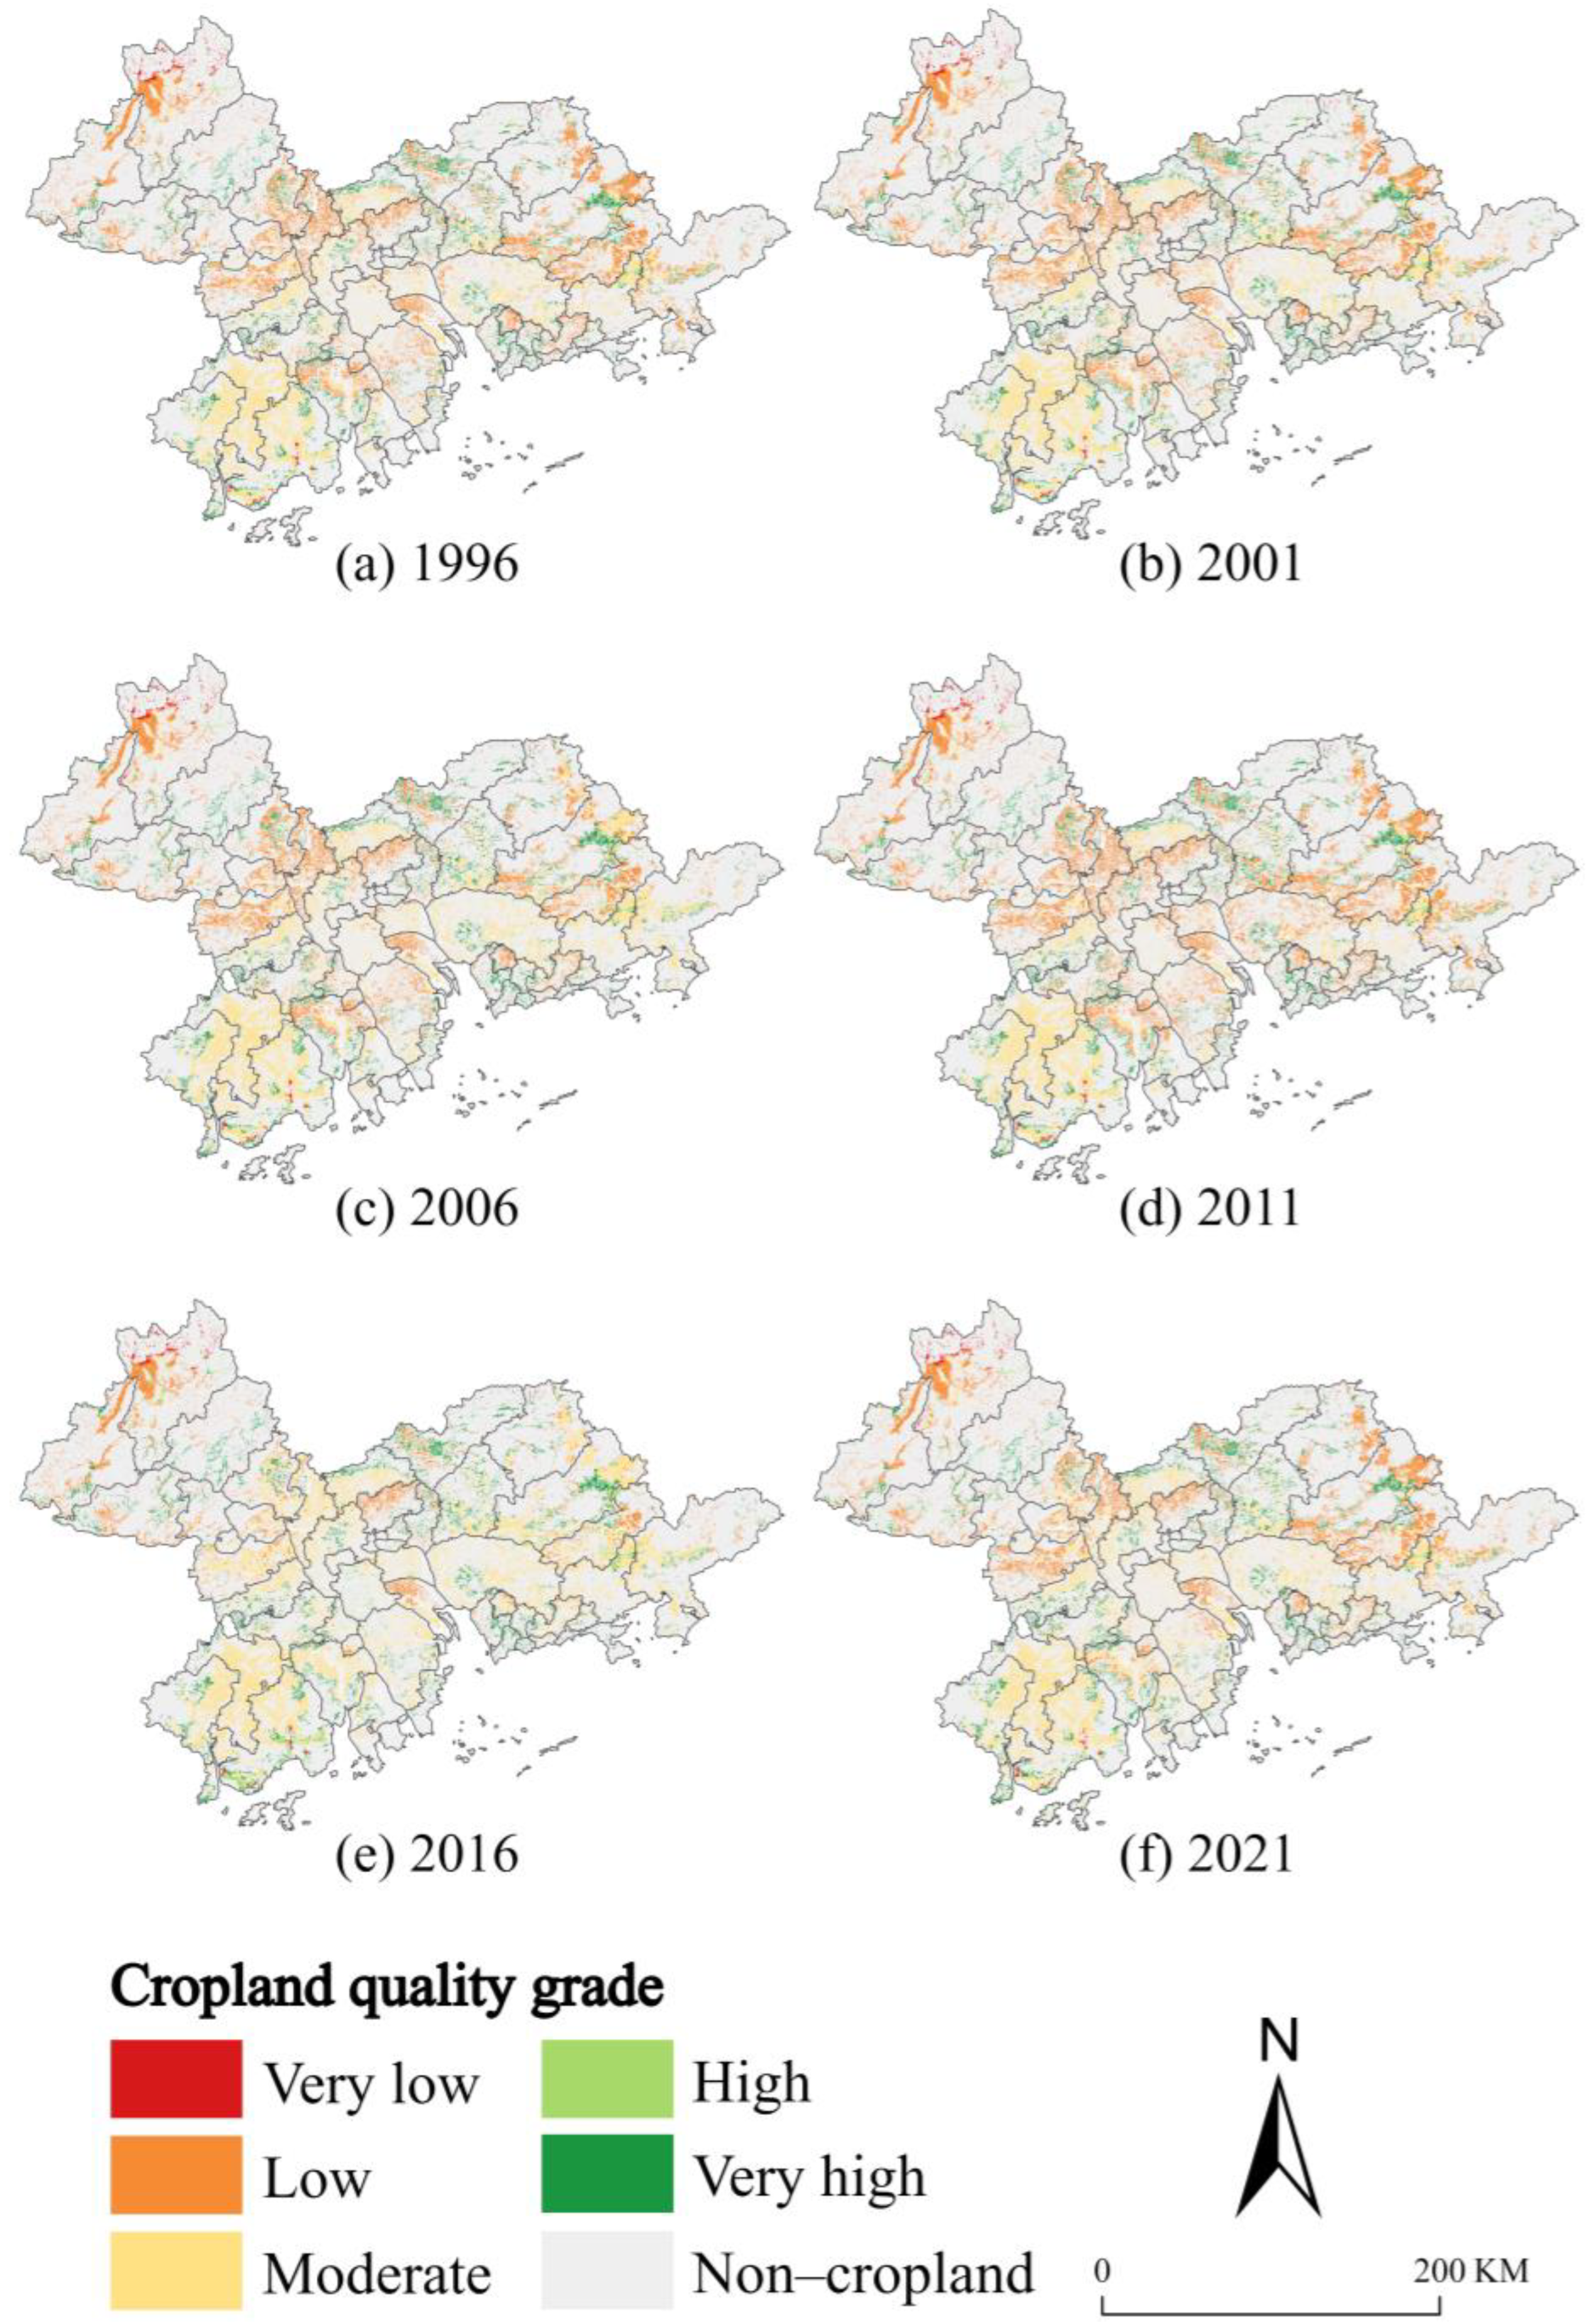
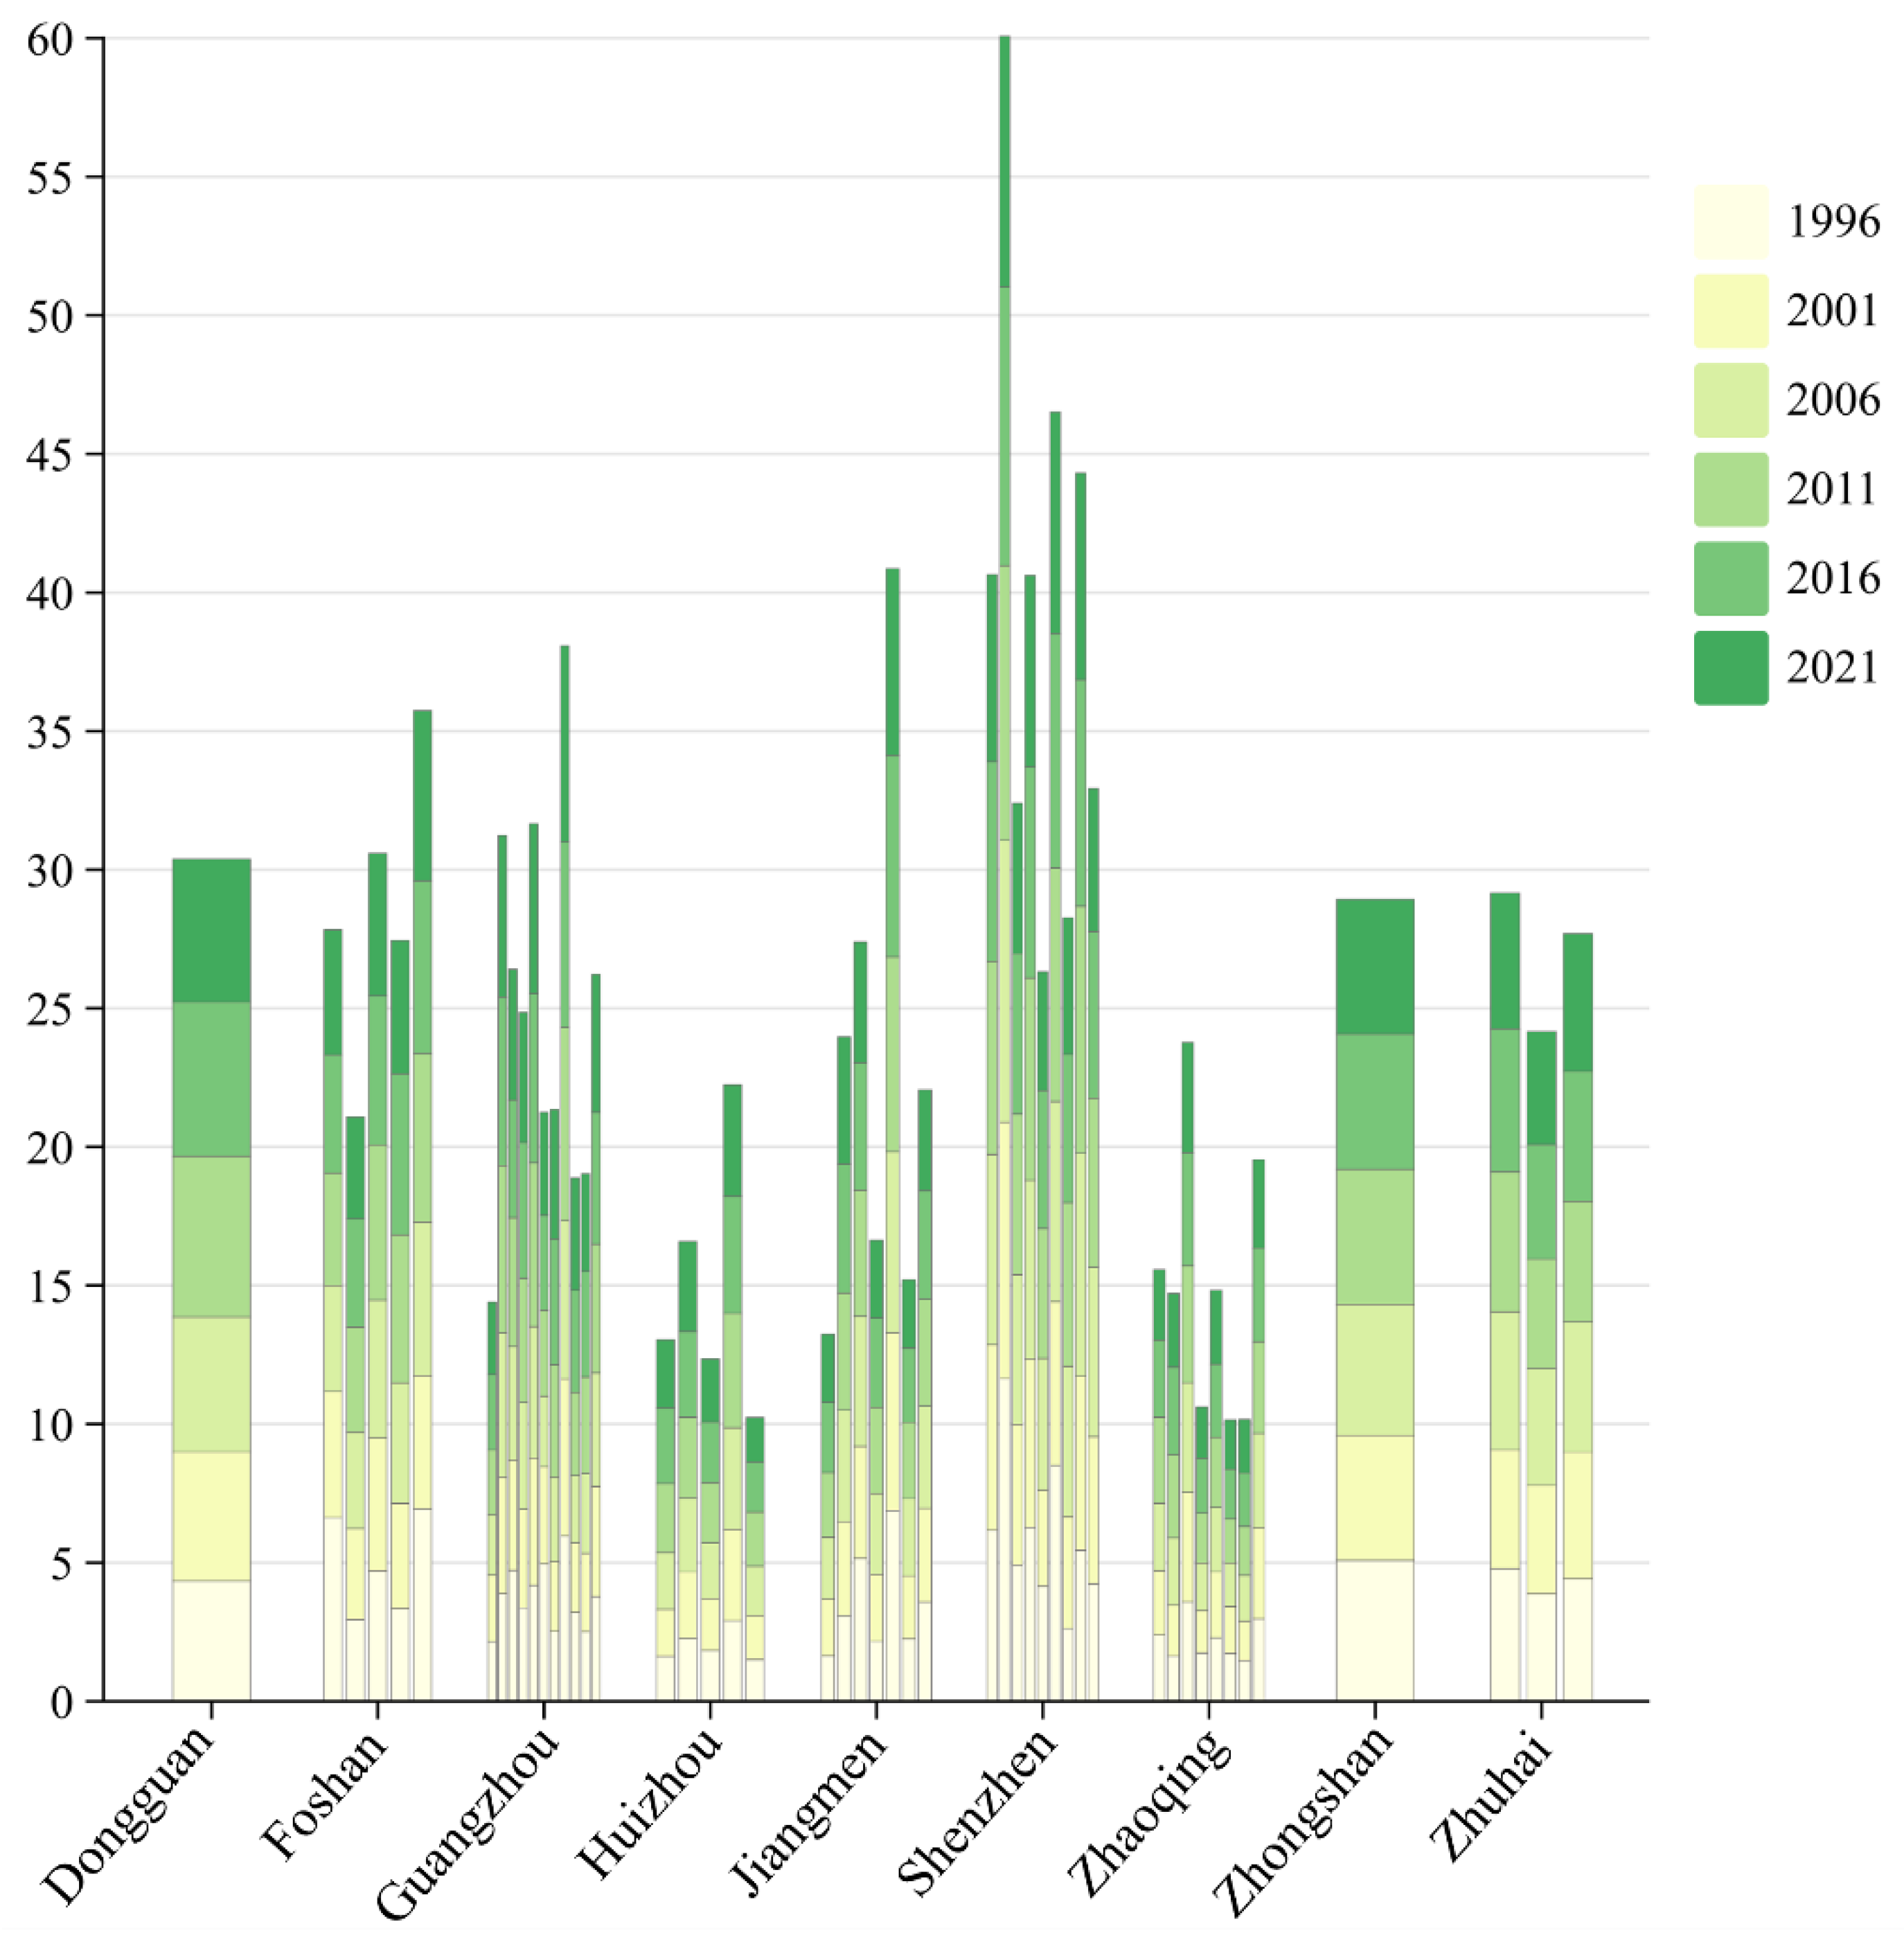
3.1. Changes in Cropland Quality

First, we quantitatively examined the spatiotemporal changes in cropland quality before and after the implementation of the RCBC policy. Based on the evaluation index system depicted in Figure 3 and Table 2, we measured the cropland quality scores of the PRD in 1996, 2001, 2006, 2011, 2016, and 2021. The scores were then classified using the well-accepted natural breaks method (Figure 4). The results indicate that the cropland quality in the PRD exhibits significant spatiotemporal differentiation.
In 1996, there were obvious spatial variations in cropland quality across the PRD, with the northern mountainous areas (e.g., Conghua District and Zengcheng District) generally having low grades due to complex topography and limited infrastructure. Conversely, the coastal regions in the south (e.g., Guangzhou and Shenzhen) benefited from their geographical advantages and the accumulation of agricultural technology, resulting in higher cropland quality. During 1996–2001, a large proportion of the low- and lower-quality cropland underwent an upgrade to medium quality, with the majority of these changes occurring in the central PRD (e.g., Shunde District, Panyu District, and Dongguan City).
By 2006, the northeastern PRD (e.g., Conghua District, Zengcheng District, and Boluo County) maintained its position as a leading region in terms of cropland quality. In these counties, although there is a large amount of high-quality cropland, its distribution is relatively fragmented. Conversely, the southern coast (e.g., Futian District, Longhua District) has emerged as a notable area for improving cropland quality. Since 2011, however, a substantial proportion of medium-quality cropland in the northern regions has experienced a decline in quality, possibly due to urban construction. By 2016, the expansion of high-quality cropland had become predominant. By 2021, the coverage of high-grade cropland had continued to expand, and the number of high-grade counties had increased from 13 in 1996 to 18.
During this period, the RCBC policy has facilitated the optimization of land resource allocation. In particular, the spatial expansion of high-quality cropland has occurred evenly from the urban core to the periphery. In addition, there has been a discernible enhancement in the quality of cropland, accompanied by an increase in the proportion of high-quality cropland. These phenomena were ultimately conducive to the enhancement of food productivity in the PRD.

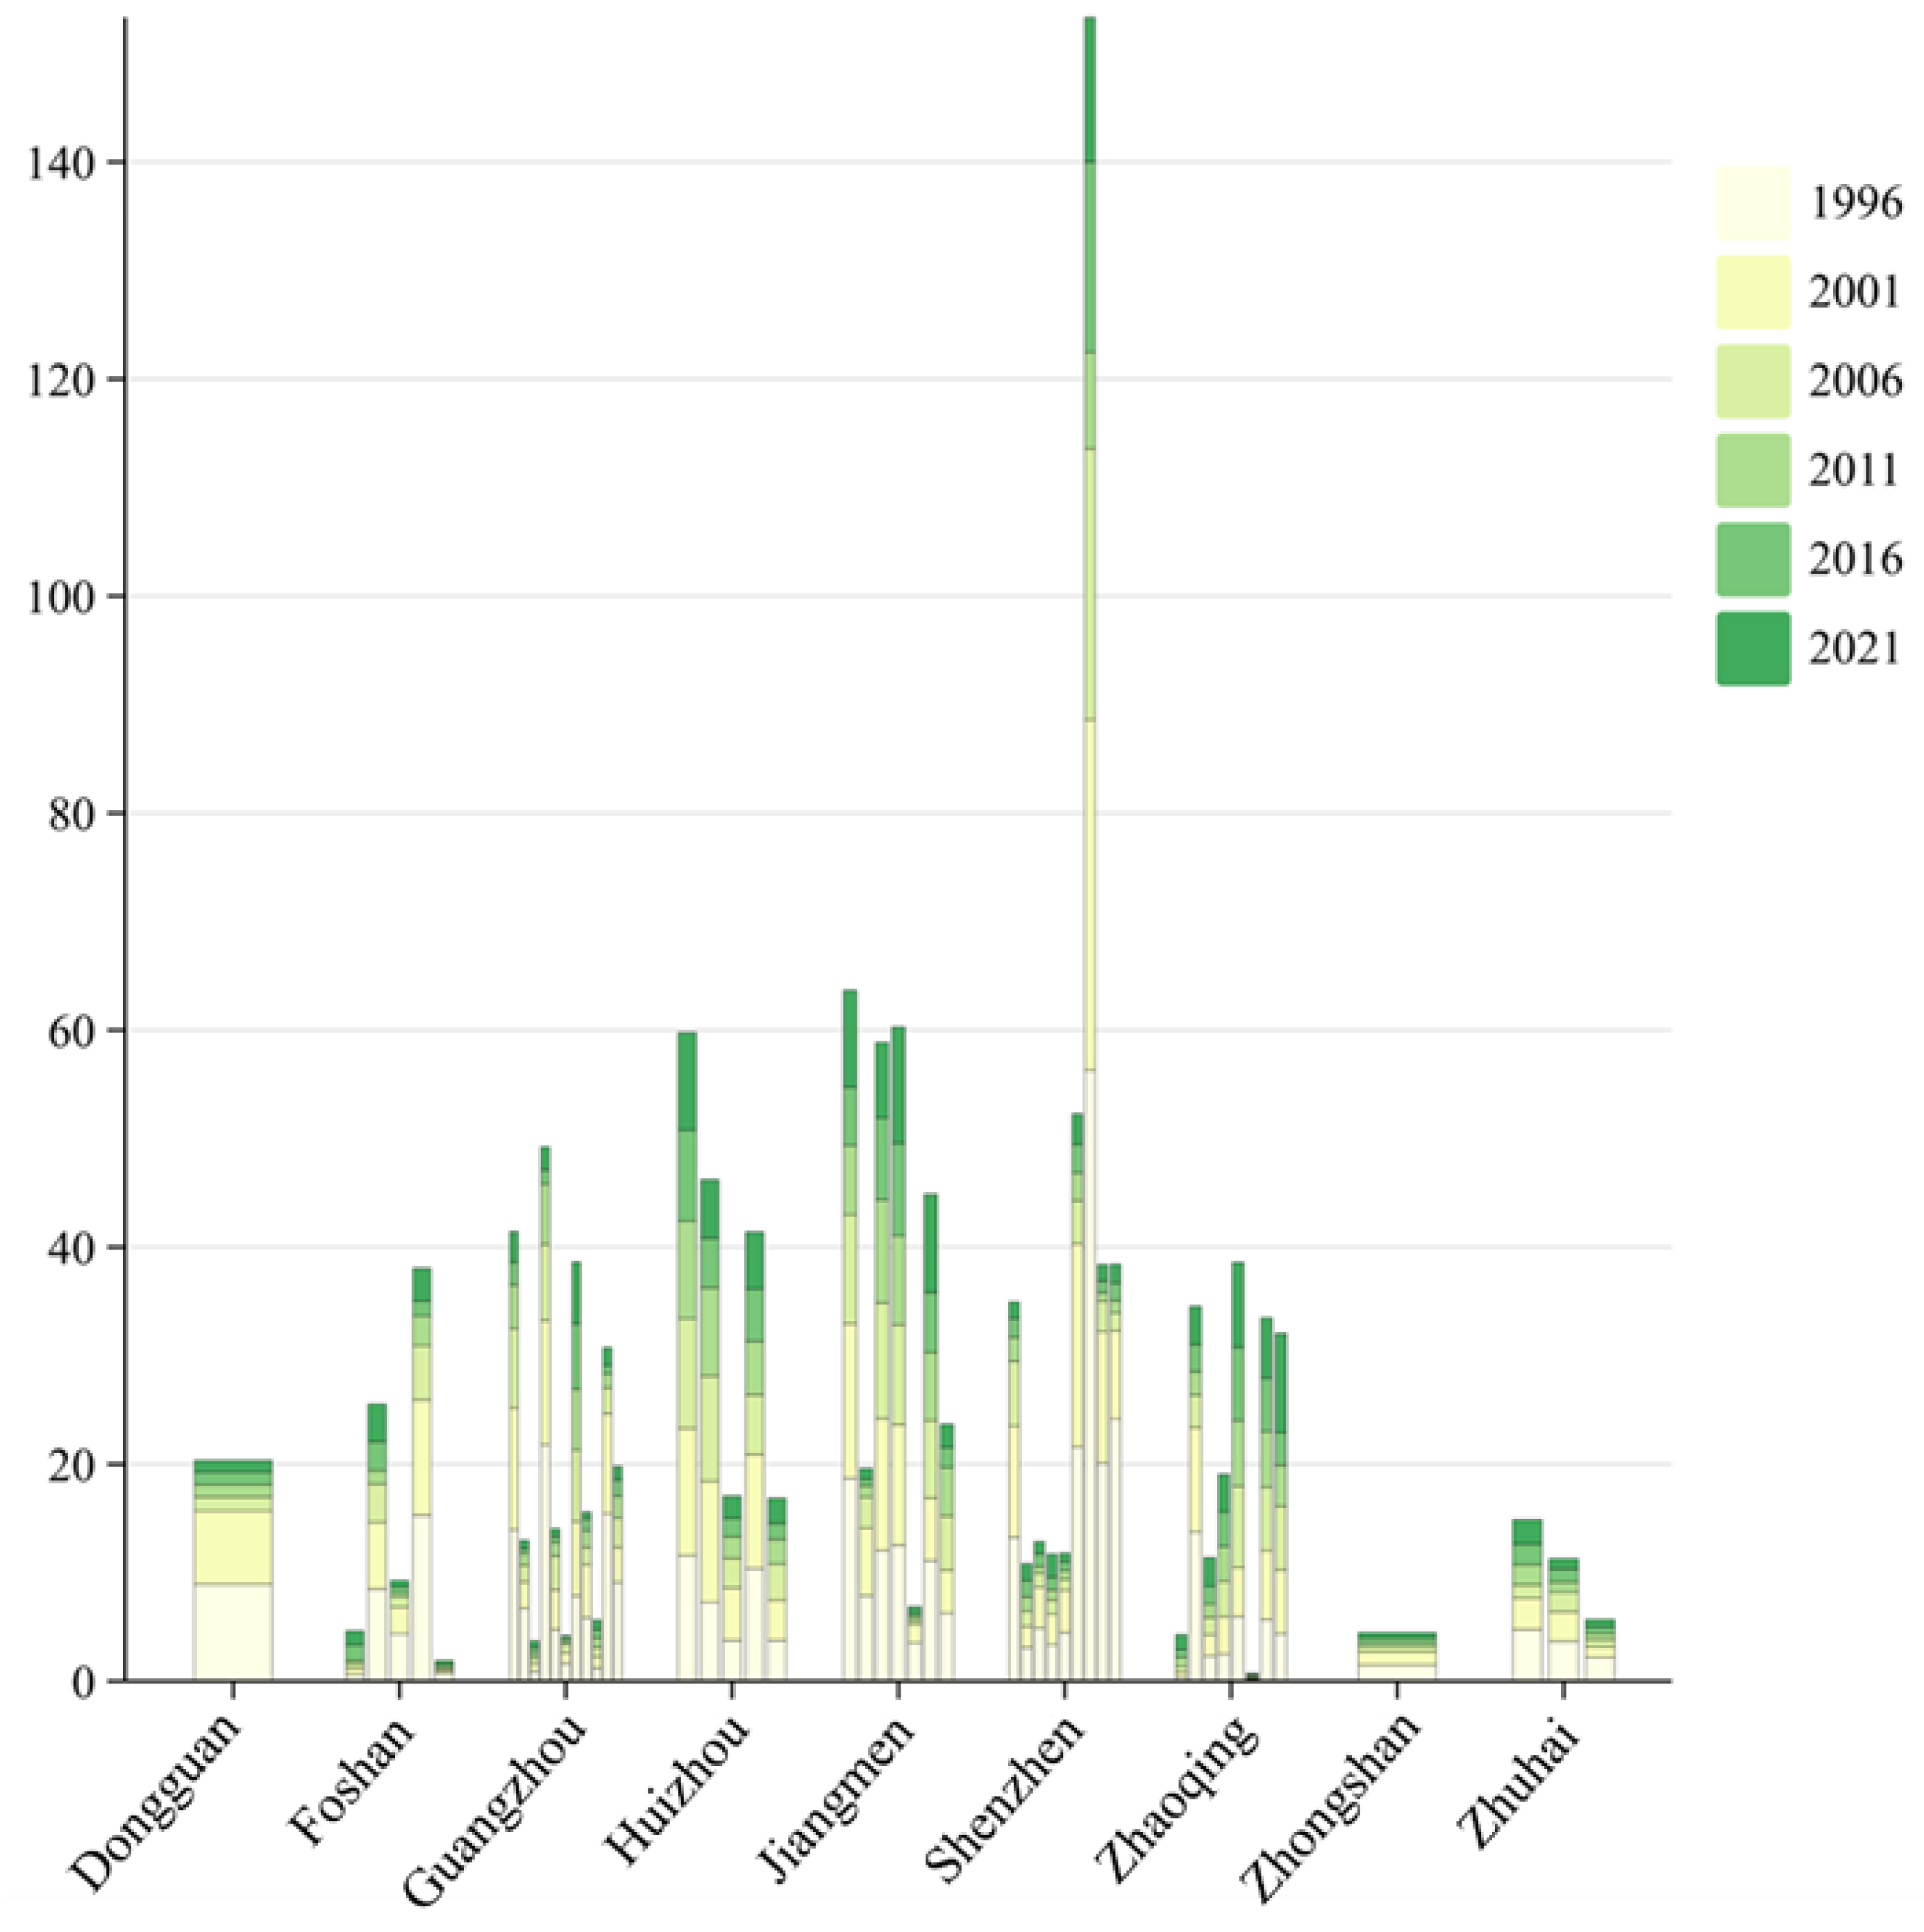
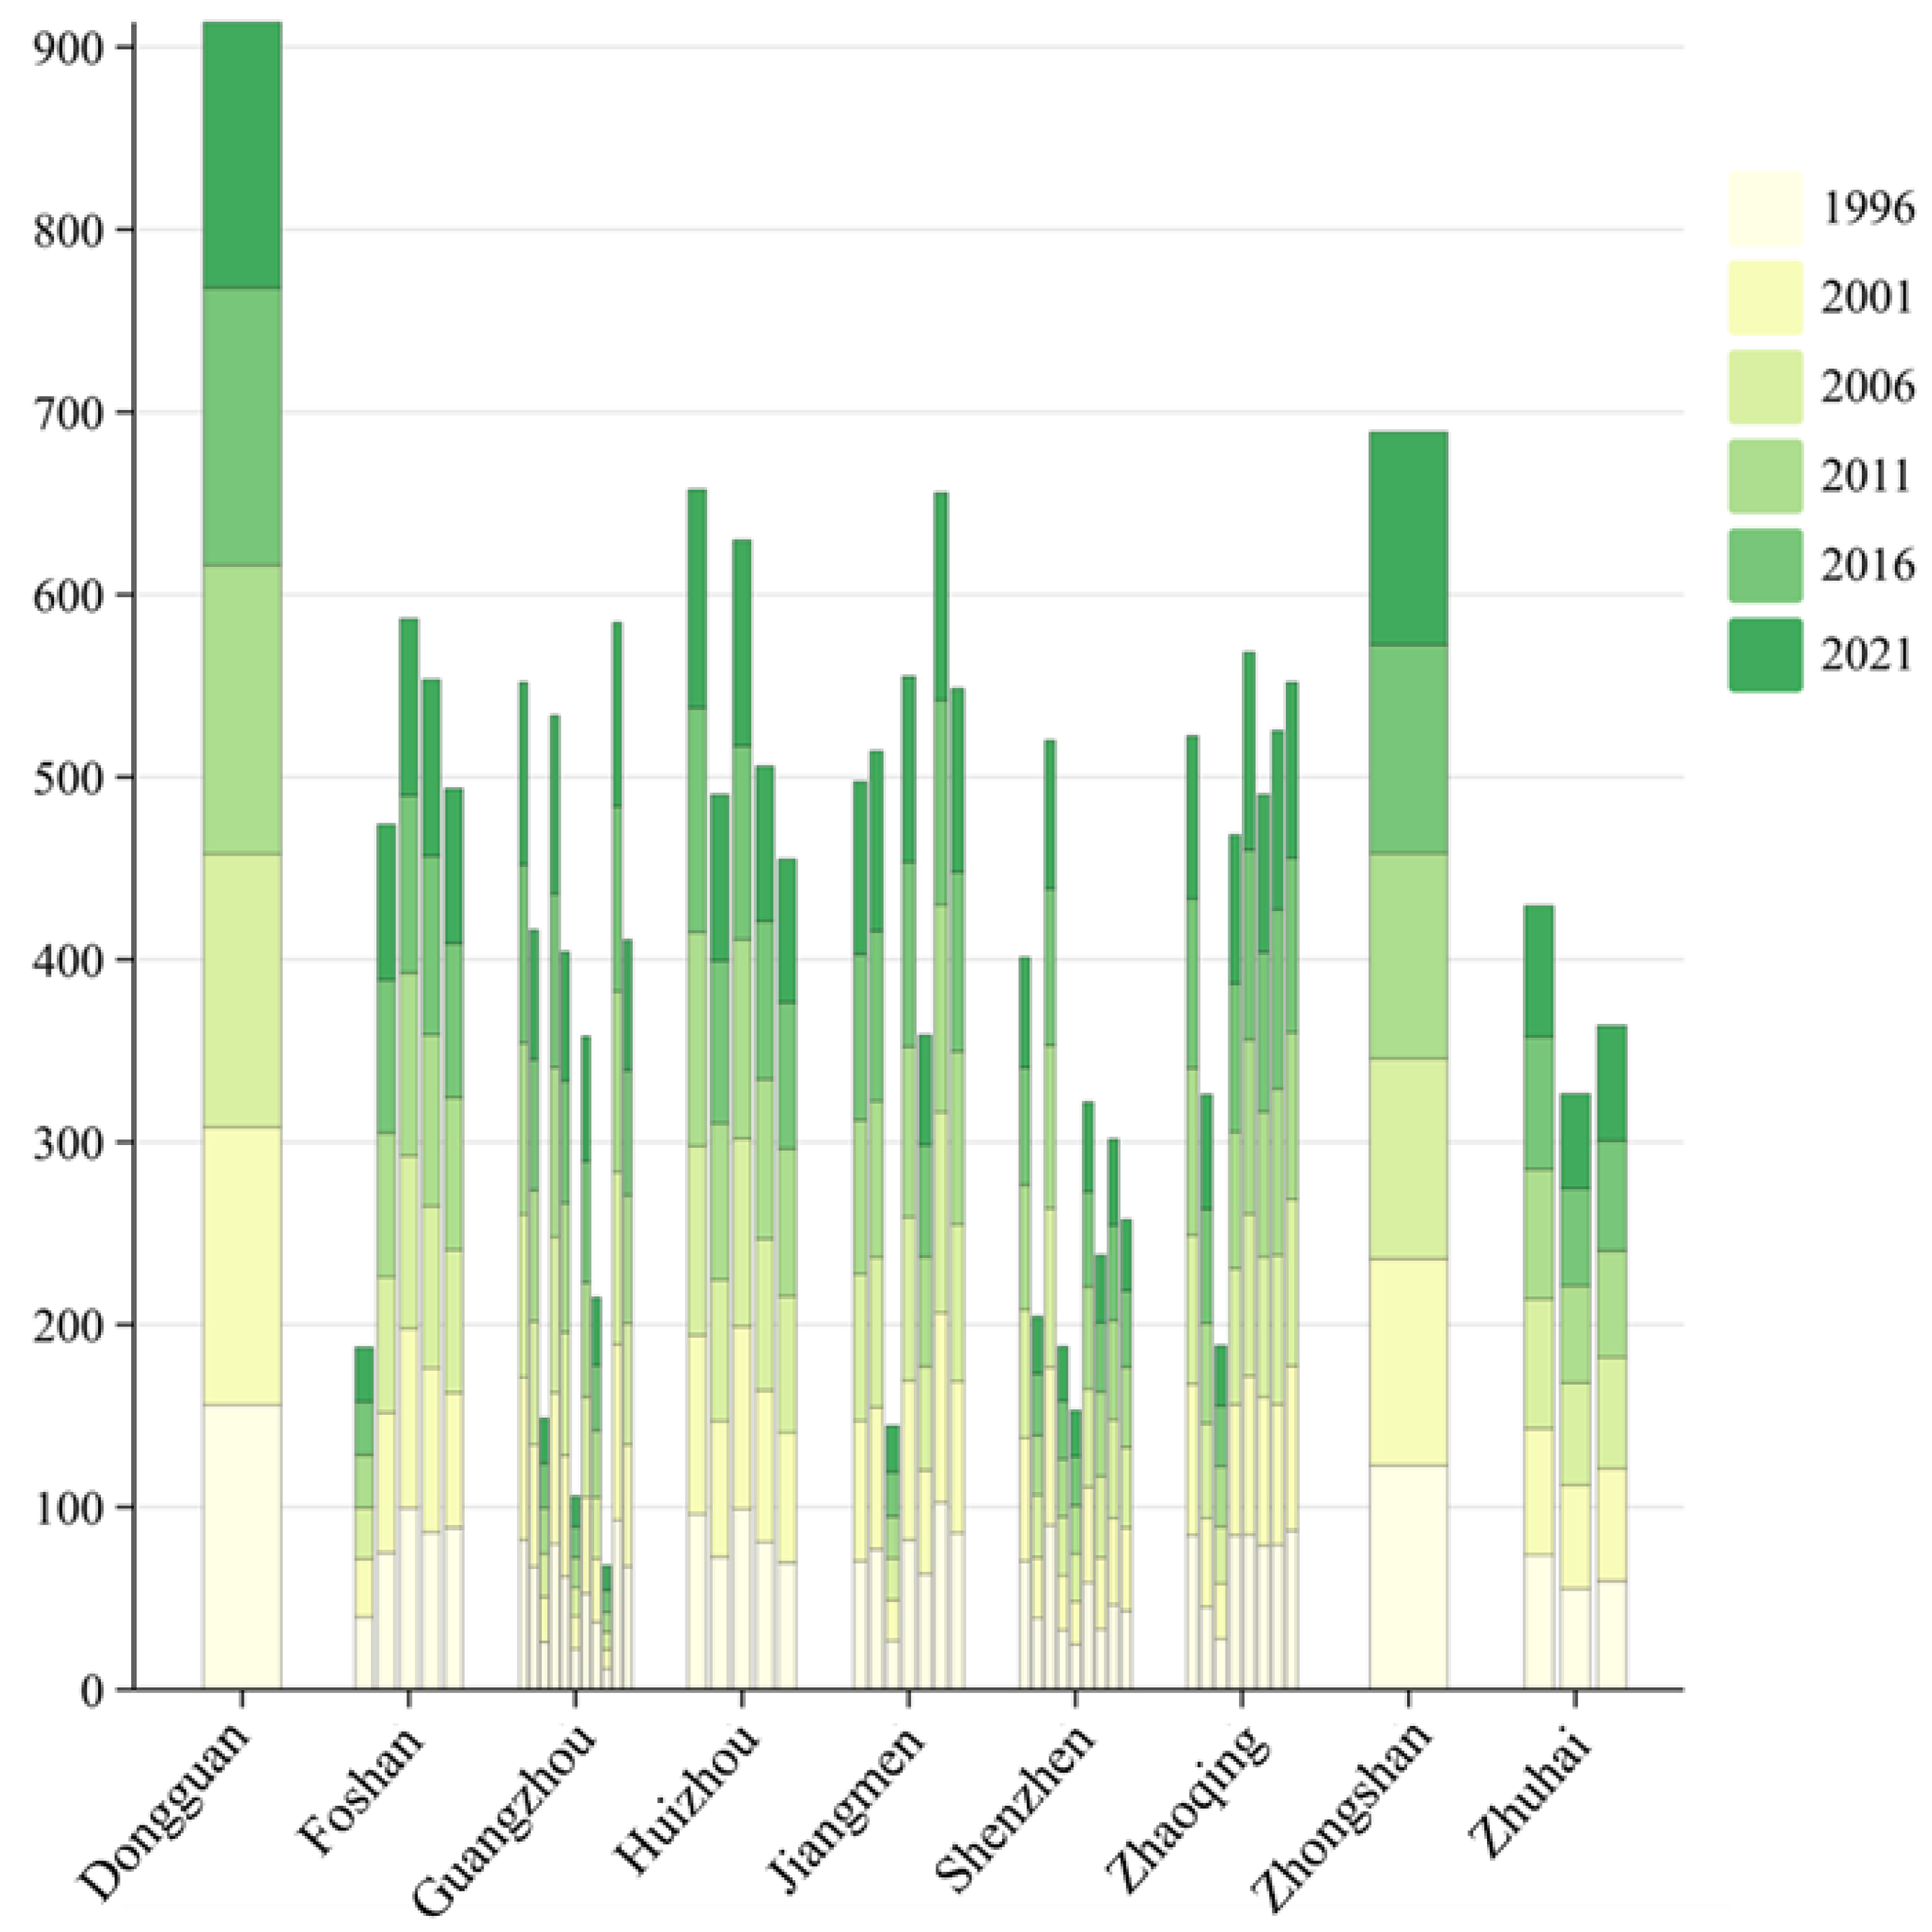
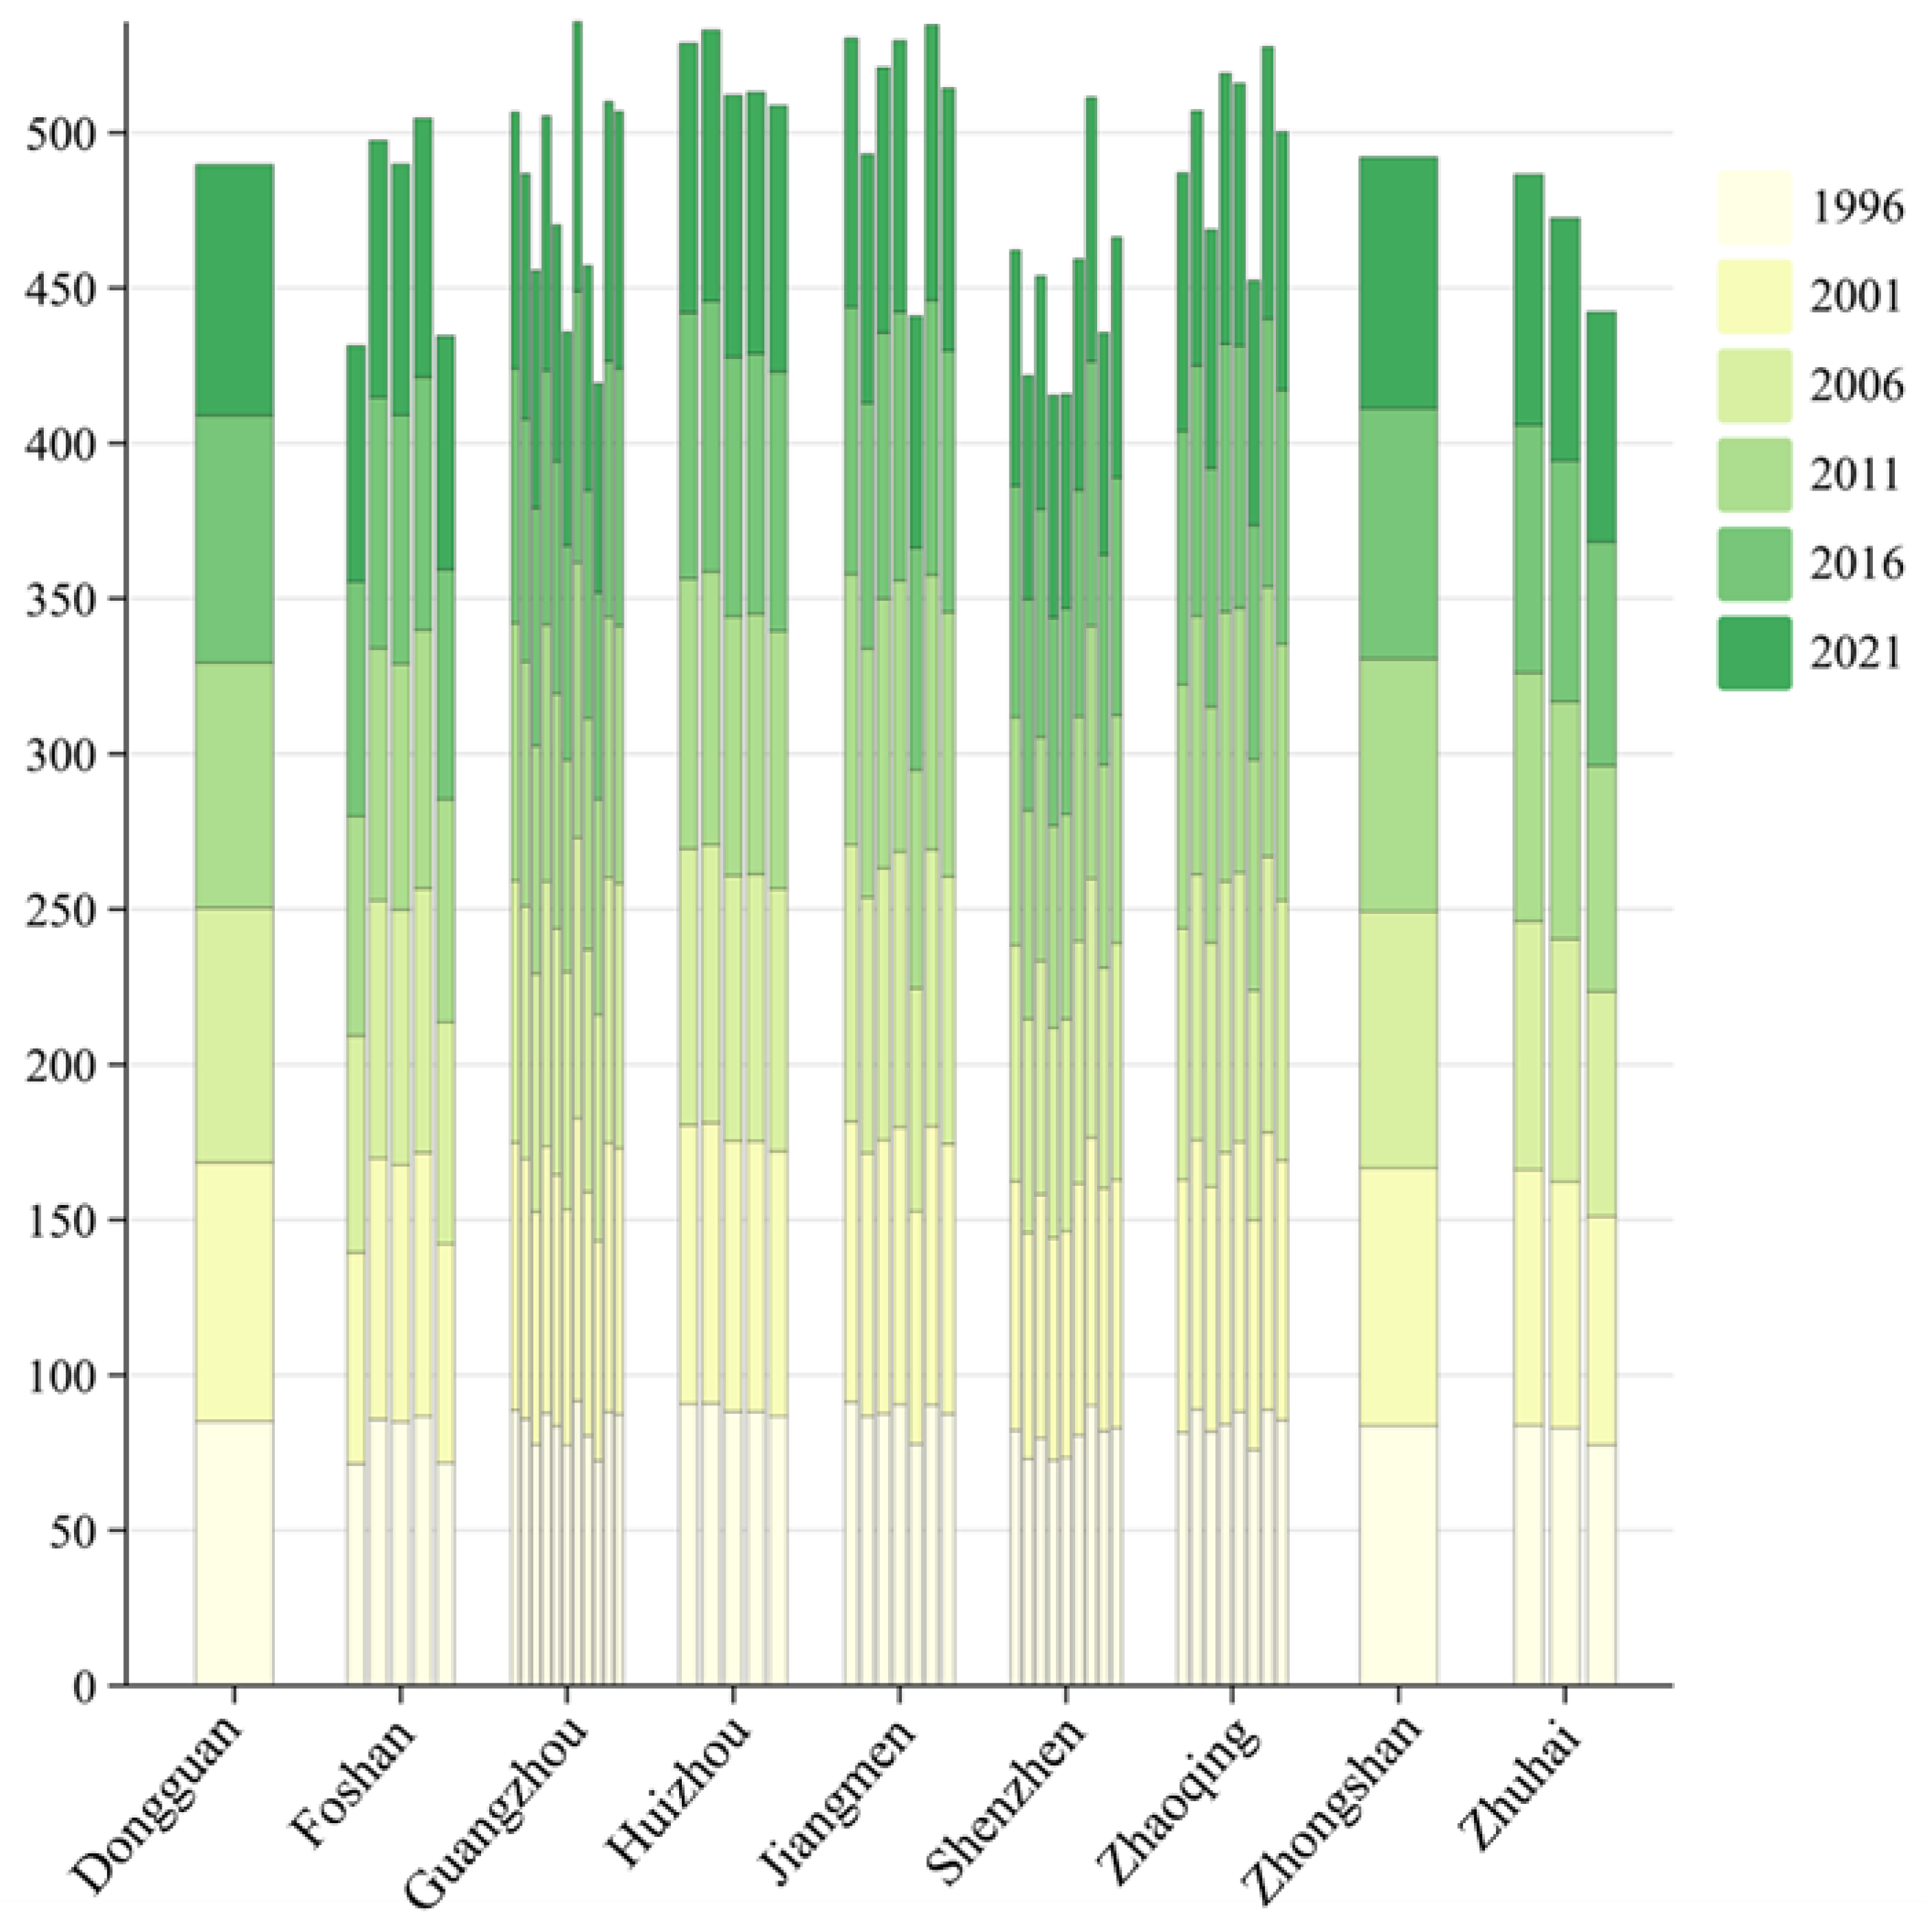
3.2. Changes in the Landscape Pattern of Cropland

Landscape indicators can reflect dynamic changes in the landscape pattern of cropland. First, a higher PD suggests greater fragmentation of cropland. The results indicate that the PD values of the 50 counties in the PRD showed an overall upward trend between 1996 and 2021, with an average increase of 15% (Figure 5). Among them, the PD values of highly urbanized areas such as Futian District in Shenzhen, Panyu District in Guangzhou, and Shunde District in Foshan have consistently exceeded 4 for a long time, and the PD value of Futian District even reached 11.65 in 2021. The cropland in these counties may have been fragmented by dense roads and built-up areas. The above phenomenon may be attributed to the encroachment of cropland during urban expansion or the formation of physical barriers by infrastructure construction, resulting in the division of the original contiguous cropland into multiple small isolated patches.
Second, LPI values reflect the dominance of large croplands, with higher values indicating larger contiguous patches. Specifically, the maximum LPI value in the PRD declined sharply from 24.16 in 1996 to 10.71 in 2021, representing a 55.7% reduction (Figure 6). A notable recovery was observed in the LPI value of Guangming District in Shenzhen, reaching 10.71 in 2021. However, this figure remains significantly lower than the 1996 baseline. This phenomenon suggests a rapid and accelerated disappearance of large ecologically and productively dominant cropland patches. This finding indicates that, despite the RCBC policy’s emphasis on the quantity and quality of cropland, intensive urban development has fragmented large croplands into isolated patches.
Third, the increase in the LSI values reflects the growing complexity of cropland patch shape. The average LSI value across the PRD exhibited a steady upward trend between 1996 and 2021 (Figure 7). This finding suggests that cropland patch shapes became more complex as cropland fragmentation intensified. Such changes have a dual impact on agricultural production. First, the presence of irregular boundaries can increase the proportion of non-productive land, such as field ridges and irrigation ditches. Second, the complex geometries of cropland can hinder the smooth operation of agricultural machinery, thereby undermining the efficiency of modern farming.
Fourth, the spatial differentiation of AI values reflects the dynamic changes in the aggregation pattern of cropland patches. A higher AI value implies a more concentrated distribution of cropland. In 2021, 92% of the counties in the PRD exhibited AI values that remained below the 1996 level, with only four regions (Deqing County, Fengkai County, Guangning County in Zhaoqing, and Chancheng District in Foshan) witnessing a slight increase (Figure 8). Notably, regions experiencing the most pronounced decline in AI values (e.g., Bao’an District, Shenzhen) frequently exhibit concurrent rises in PD and LSI values. The decrease in AI values suggests a transition in the spatial distribution of cropland patches from concentrated to dispersed configurations, leading to a significant reduction in ecological connectivity. This dispersal trend can weaken the capacity of cropland ecosystems for material and energy exchange, thereby potentially exacerbating the risk of pest and disease transmission.

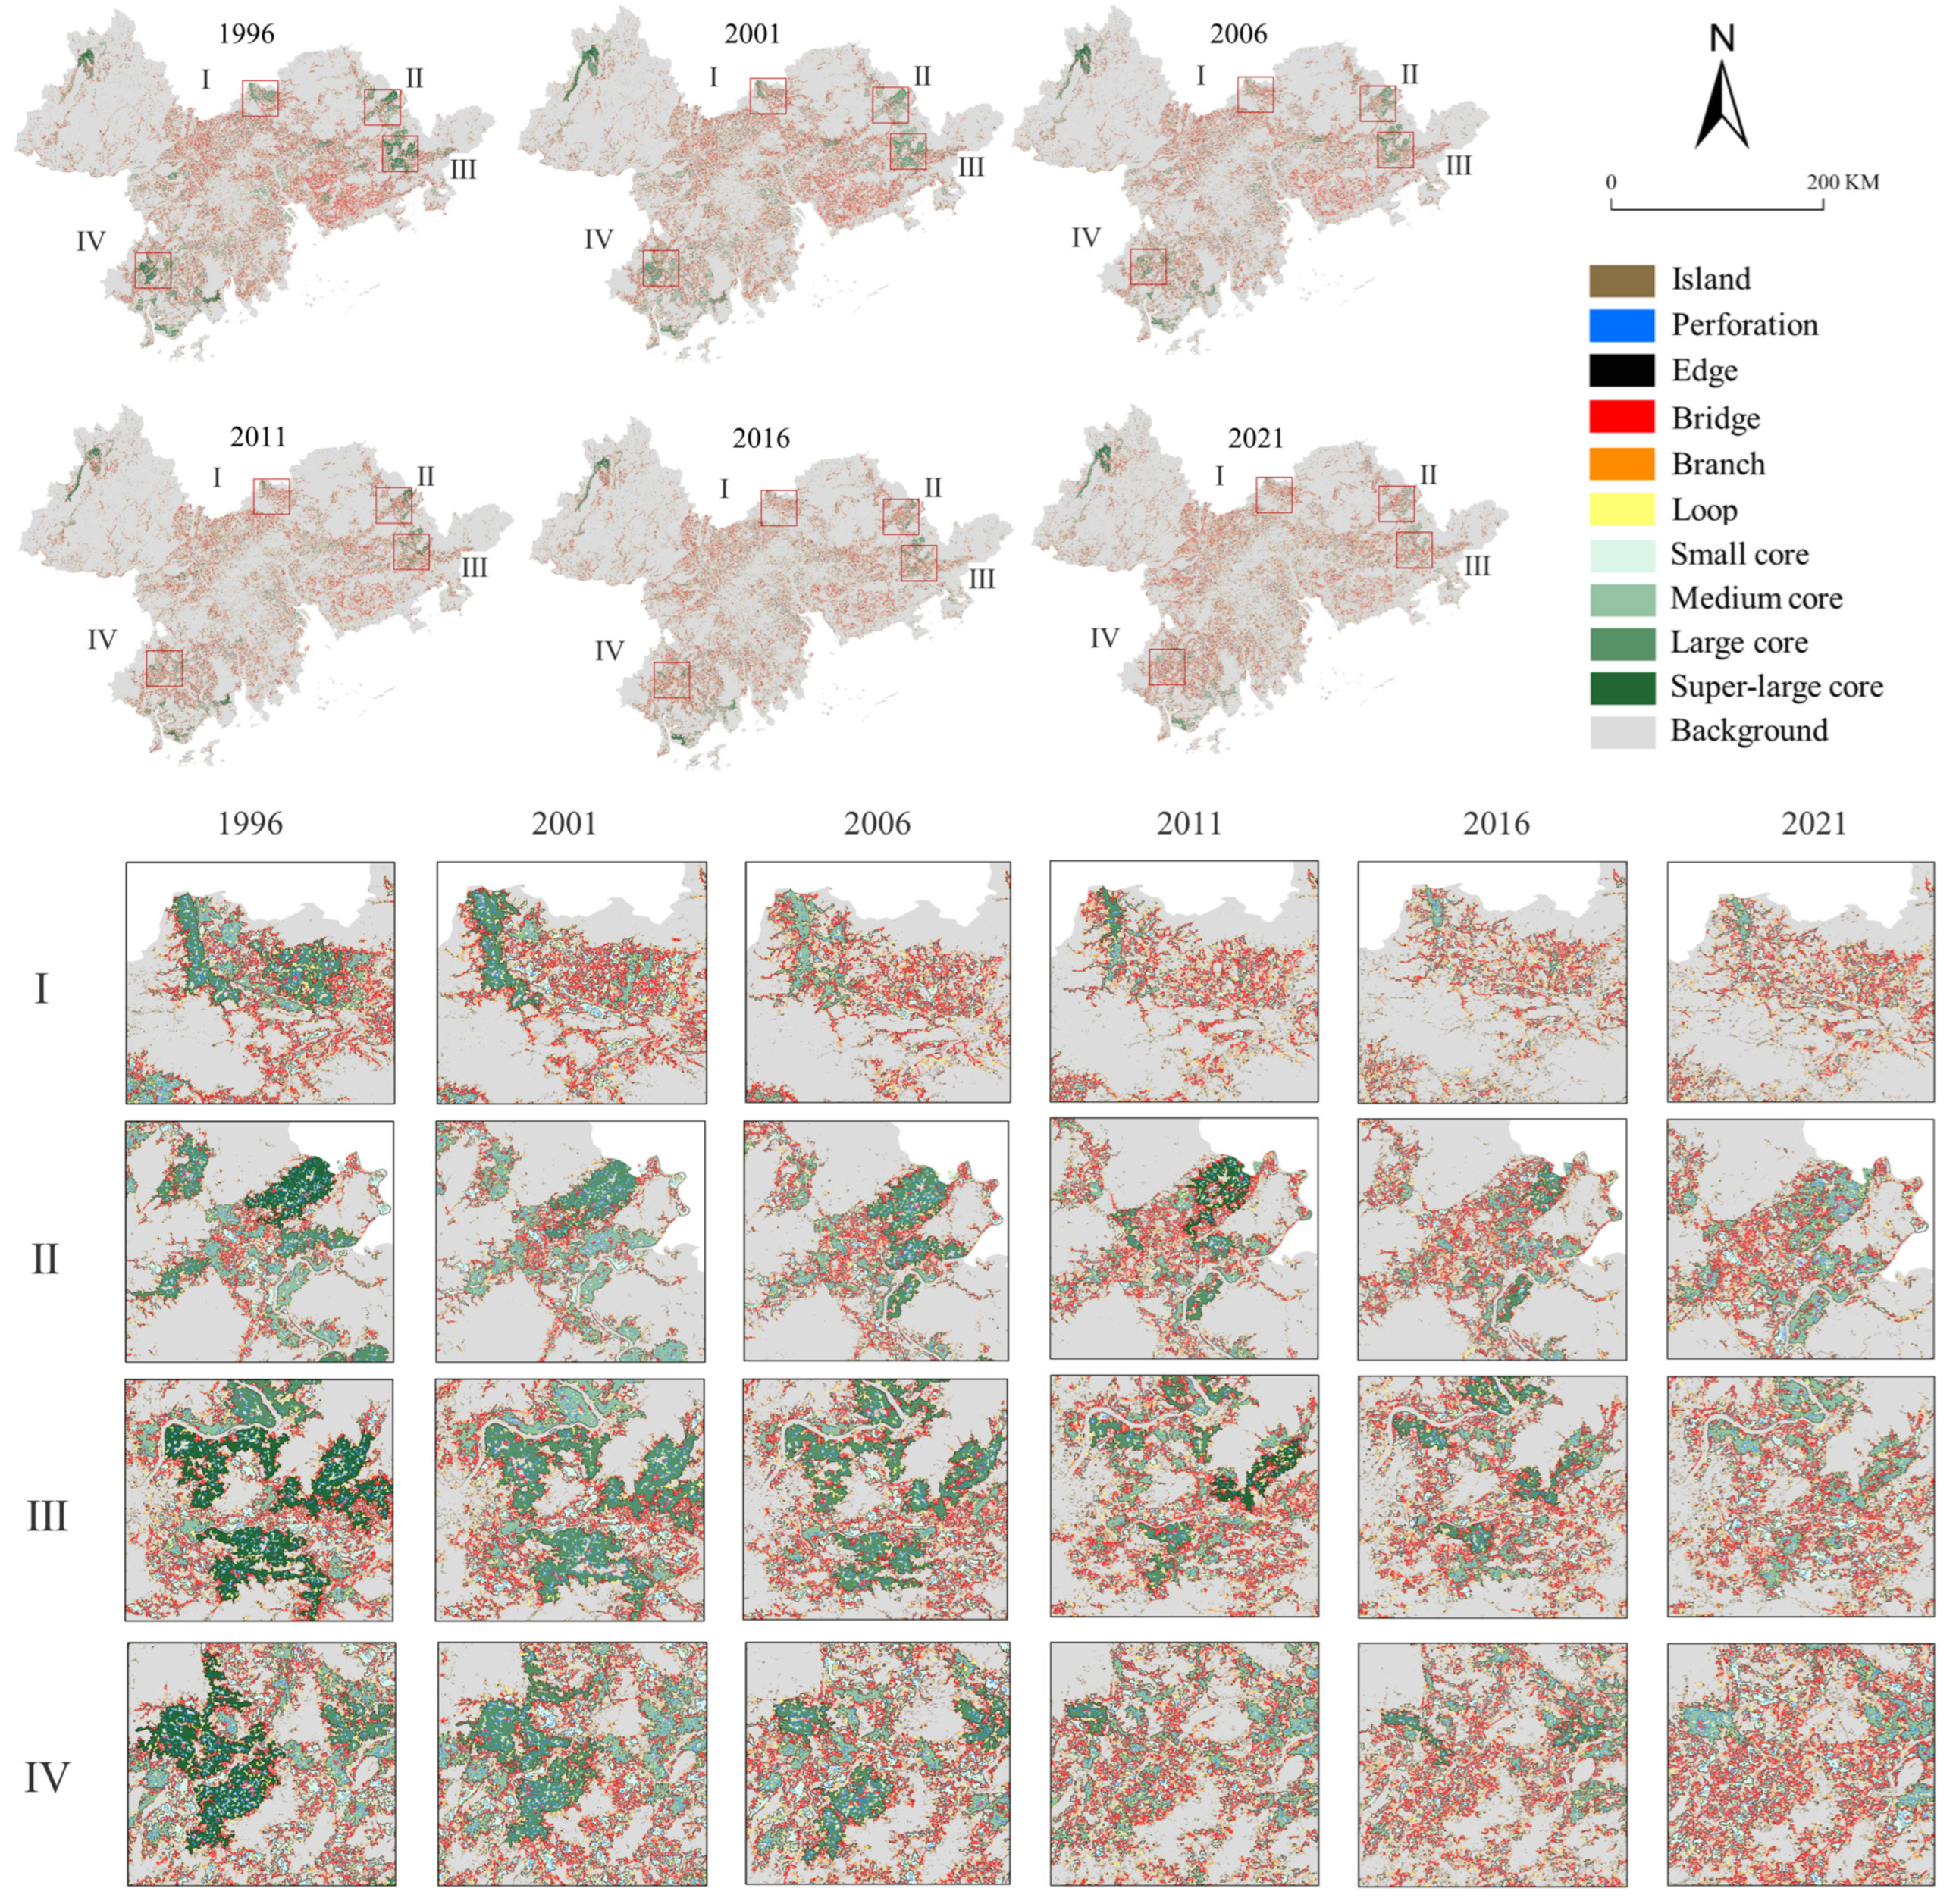
3.3. Changes in the MSPA of Cropland

Figure 9 illustrates the MSPA results for cropland during 1996–2021. Large cores were primarily distributed in the northeast of Huizhou and the south of Jiangmen, while super-large cores were concentrated in the northwest of Zhaoqing. In general, regions characterized by relatively flat terrain (e.g., Shenzhen, Dongguan, Foshan, Guangzhou, Jiangmen) exhibit more severe cropland fragmentation. Notably, certain regions (e.g., I, II, III, IV in Figure 9) show a trend of significant reduction in cropland “core” areas, where some super-large cores gradually transitioned into small cores, medium cores, islands, bridges, and branches.
By comparing the dynamic change rates in seven MSPA elements (Table 6), we found that the core area exhibited an overall downward trend. This indicates an increasing trend of cropland fragmentation in the PRD, with the larger cores gradually being divided into small patches. Additionally, the inadequate connectivity between small and large croplands has led to a substantial increase in the proportion of islands. The observed decline in the proportion of bridges can be attributed to a decrease in connectivity between different cores. Moreover, the ongoing expansion of urban land within cropland continues to split core patches, resulting in a decrease in the proportions of perforations and loops.
Next, we analyzed and compared the patch number, area, and area proportion of the four categories of “cores” (Table 7). The results show that the patch number of small cores significantly exceeds that of the other categories, indicating a scarcity of centralized and contiguous cropland in the PRD. The area and area proportion of small cores and medium cores have generally exhibited an upward trend, with their combined total reaching 63.932% in 2016 and 67.560% in 2021. In contrast, the patch number, area, and area proportion of large cores and super-large cores exhibit a downward trend.

4. Discussion

4.1. Verification of Results Through Field Research

The cropland quality in Southwest China declined due to the improper implementation of the RCBC policy [53,54]. By contrast, the PRD experienced an overall upward trend in cropland quality, characterized by an increase in high-quality cropland and a more uniform spatial distribution. In addition, through long-term analysis of land use changes and landscape indicators, previous studies have found that the implementation of the RCBC policy has intensified cropland fragmentation and marginalization in many regions throughout the country [8,55]. Similarly, the quantitative research mentioned above also shows that cropland fragmentation has become increasingly pronounced in the PRD. Our field survey results also confirmed this phenomenon.
Given the observed changes in cropland quality and morphology, we conducted field research in typical areas of cropland fragmentation (Enping City, Boluo County, Huiyang District, Haizhu District, Guangming District, and Nanshan District) to verify the quantitative results. Through on-site visits and investigations in these areas, we found that the total area of cropland was low in rapidly urbanizing regions such as Guangming District in Shenzhen and Haizhu District in Guangzhou.
The interviewees acknowledged that the local governments’ inadequate implementation of the RCBC policy has negatively affected agricultural production, particularly noting the exacerbation of cropland fragmentation. Due to regional complexity, compensatory cropland frequently manifests as dispersed patches. In some areas (e.g., Guangming, Shenzhen), cropland is either spatially scattered or morphologically connected but functionally fragmented, which significantly limits the scale and intensification of agricultural production. Key transportation infrastructure projects have inevitably led to the expropriation of contiguous cropland, leading to regional cropland shrinkage and fragmentation. Field research has confirmed that while the RCBC policy promotes efficient cropland use, it has indirectly exacerbated cropland fragmentation. Government-led construction activities often involve the occupation of cropland, resulting in a more fragmented pattern. Due to cropland fragmentation and uneven implementation of the RCBC policy, only a portion of relatively contiguous cropland is suitable for efficient cultivation.
During the implementation of the RCBC policy, local departments that manage cropland resources conduct regular inspections of cropland cultivation status, such as once or twice a year. However, farmers frequently receive plots of varying qualities and locations during cropland compensation, which can lead to the fragmentation of their agricultural landholdings. Such fragmentation poses significant barriers to agricultural mechanization and increases cultivation and management costs. Consequently, many farmers engage in negligent cultivation solely to meet inspection requirements, resulting in the prolonged abandonment of the land on an annual basis. This phenomenon, in turn, undermines the overall productivity of cropland.
In summary, the RCBC policy promotes effective land use. However, its implementation focuses solely on quantity and quality targets, with insufficient attention paid to cropland fragmentation. This has posed considerable challenges to agricultural production and management. Our field research process has verified this perspective. We recommend that the impact on cropland morphology should also be prioritized during policy implementation.

4.2. Recommendations for the RCBC Policy

Based on quantitative analysis and field research, some recommendations are proposed for improving the RCBC policy.
First, when requisitioning cropland, construction land must undergo strict approval procedures, with priority given to the use of unused land and strategic planning of requisitioned cropland to minimize cropland loss. Enterprises should prioritize the development of fragmented land in order to mitigate cropland fragmentation.
Second, local compensation of high-quality cropland is challenging in the PRD, especially in cities with limited cropland resources including Shenzhen and Guangzhou. In such cases, the strategy of off-site requisition and compensation can be adopted. More specifically, cropland that is occupied but cannot be replenished within the city can be offset by acquiring cropland from cities with abundant and high-quality resources. This approach achieves a balance of cropland in terms of both quantity and quality. For example, compensation quotas could be purchased from Heyuan and Huizhou. Local governments must prioritize patch contiguity and cultivability when designing compensatory cropland.
Third, although most regions strictly regulate land use functions and require cropland to fulfill farming tasks, cropland management remains lax in some regions. In these regions, only cropland within basic farmland protection zones is monitored or even no cropland is monitored at all, leading to partial cropland abandonment. To address this issue, local governments should collaborate with relevant authorities and utilize GIS-based observation data to implement long-term dynamic tracking of cropland conditions. This approach will facilitate the enforcement of stringent zoning boundaries between agricultural and construction land, as well as the identification of high-quality cropland areas that are prone to fragmentation.
Fourth, the implementation of the RCBC policy should adhere to the principle of “building where appropriate, farming where appropriate” based on local conditions. Priority should be given to the protection of high-quality cropland from construction encroachment, while simultaneously enhancing cropland connectivity to facilitate large-scale agricultural production. This strategy not only reduces mechanization costs but also improves crop yields, thereby ensuring the rational and efficient utilization of land resources.

4.3. Key Contributions of This Study

Previous studies on the impact of the RCBC policy have primarily focused on changes in the quantity and quality of cropland. This study took a step forward by comprehensively analyzing changes in cropland morphology and quality, which further aids in examining the impact of the RCBC policy on food security. An indicator system was constructed to evaluate cropland quality. Through parameter optimization, we determined the most suitable edge width parameter for constructing MSPA of cultivated land in the PRD, and the MSPA results reveals the changes in cropland morphology. The results were verified through field research. The comprehensive findings can offer decision support for optimizing the RCBC policy.
Moreover, the temporal scope of previous studies was generally limited. In contrast, our study covers the key nodes of the long time series both before and after the implementation of the RCBC policy. Regarding spatial scope, this study selected the PRD as a case study. This region is characterized by its developed economy, rapid urbanization, and intricate land use patterns. Expanding the spatial and temporal scope renders the results more representative and enables them to offer more practical guidance for cropland protection and management in many other regions.
Finally, we also verified the multi-source data-based quantitative results through field research. The integration of field observation and semi-structured interview facilitates an in-depth analysis of cropland distribution, the implementation of the RCBC policy, and the problems encountered during the implementation process. The integration of quantitative and qualitative analysis not only validates the rationality of the findings, but also offers a targeted empirical basis for policy formulation and optimization.

4.4. Limitations of This Study

This study still has certain limitations. First, there are limitations in the data sources. The spatial resolution of certain datasets may be insufficient to accurately characterize the features of smaller cropland patches, and temporal gaps in time series data may affect dynamic analyses over long periods. Second, potential classification errors may arise in land use and land cover datasets (CACD and CLCD) due to the inherent limitations of remote sensing classification methods. Third, the spatial resolution of data might affect the classification of core and island. These limitations could consequently impact the accuracy of the results to some extent.
Further research is required in the future. For example, the influence mechanism of the RCBC policy on cropland is more complex in the real world. In future studies, the incorporation of additional economic, social, and natural factors into the index system will facilitate a more comprehensive exploration of cropland quality. In addition, although MSPA can guarantee the accuracy of morphological element identification, analyzing the scale effect of MSPA elements on cropland quality and fragmentation is a research direction that deserves further exploration in the future. This has the potential to further inform the optimization of cropland management systems and promote the development of agricultural productivity.

5. Conclusions

In this study, the impact of the RCBC policy on cropland was thoroughly examined. We assessed the changes in cropland quality and morphology in the PRD during 1996–2021 through cropland quality evaluation, landscape indicators, and MSPA. The results indicate that the overall cropland quality exhibited an upward trend, the amount of high-quality cropland increased, and the spatial distribution became more uniform. However, cropland fragmentation was increasingly pronounced in the PRD. Landscape indicators and MSPA indicate a downward trend in the area of “core” cropland. Many super-large cores gradually fragmented into multiple medium cores, small cores, and even islands, accompanied by a decline in the area of bridges. These changes suggest a reduction in the connectivity and integrity of cropland morphology.
Field research further validated the above quantitative results. Our findings indicate that the total cropland area is limited in rapidly urbanizing regions, accompanied by severe fragmentation issues. Moreover, the combination of cropland fragmentation and the inadequate implementation of the RCBC policy has resulted in the unsuitability of certain croplands for efficient cultivation, thereby compromising the overall productivity quality of cropland.
In summary, while the RCBC policy has achieved remarkable success in enhancing cropland quality, insufficient attention has been paid to cropland morphology during policy implementation in certain regions. Local governments should leverage technological innovation and policy guidance to address the challenge of cropland fragmentation. This will facilitate the ongoing enhancement of cropland quality and the optimization of cropland morphology. This strategy endeavors to align with the United Nations Sustainable Development Goals (SDG 2) and contribute to the development of a more resilient and ecologically sustainable food production system.

Author Contributions

Conceptualization, J.L. (Jinyao Lin); methodology, Z.L.; formal analysis, Z.L. and Z.C.; writing—original draft preparation, Z.L. and Z.C.; data curation, F.Z. and J.L. (Jiapei Li); visualization, F.Z. and J.L. (Jiapei Li); validation, Y.L. and L.C.; supervision, J.L. (Jinyao Lin); project administration, J.L. (Jinyao Lin); funding acquisition, J.L. (Jinyao Lin). All authors have read and agreed to the published version of the manuscript.

Funding

The study was supported by Humanities and Social Sciences Research Program of China (Grant No. 23YJCZH125), Guangdong Basic and Applied Basic Research Foundation (Grant No. 2023A1515030300), and National College Students Innovation and Entrepreneurship Training Program (Grant No. 202511078005).

Data Availability Statement

The data presented in this study are available on request from the corresponding author.

Conflicts of Interest

The authors declare no conflicts of interest.

References

  1. Akbari, M.; Foroudi, P.; Shahmoradi, M.; Padash, H.; Parizi, Z.S.; Khosravani, A.; Ataei, P.; Cuomo, M.T. The Evolution of Food Security: Where Are We Now, Where Should We Go Next? Sustainability 2022, 14, 3634. [Google Scholar] [CrossRef]
  2. Skaf, L.; Buonocore, E.; Dumontet, S.; Capone, R.; Franzese, P.P. Applying network analysis to explore the global scientific literature on food security. Ecol. Inform. 2020, 56, 101062. [Google Scholar] [CrossRef]
  3. Zhao, S.X.; Yin, M.M. Change of urban and rural construction land and driving factors of arable land occupation. PLoS ONE 2023, 18, e0286248. [Google Scholar] [CrossRef]
  4. Chen, Y.; Zhang, F.; Lin, J. Projecting Future Land Use Evolution and Its Effect on Spatiotemporal Patterns of Habitat Quality in China. Appl. Sci. 2025, 15, 1042. [Google Scholar] [CrossRef]
  5. Liu, X.Y.; Xin, L.J. Assessment of the Efficiency of Cultivated Land Occupied by Urban and Rural Construction Land in China from 1990 to 2020. Land 2022, 11, 941. [Google Scholar] [CrossRef]
  6. Hou, D.W.; Meng, F.H.; Prishchepov, A.V. How is urbanization shaping agricultural land-use? Unraveling the nexus between farmland abandonment and urbanization in China. Landsc. Urban Plan. 2021, 214, 104170. [Google Scholar] [CrossRef]
  7. Li, W.B.; Wang, D.Y.; Liu, S.H.; Zhu, Y.L.; Yan, Z.R. Reclamation of Cultivated Land Reserves in Northeast China: Indigenous Ecological Insecurity Underlying National Food Security. Int. J. Environ. Res. Public Health 2020, 17, 1211. [Google Scholar] [CrossRef]
  8. He, Q.; Jiang, X.; Zhang, Y. The Gains and Losses of Cultivated Land Requisition–Compensation Balance: Analysis of the Spatiotemporal Trade-Offs and Synergies in Ecosystem Services Using Hubei Province as a Case Study. Land 2024, 13, 1641. [Google Scholar] [CrossRef]
  9. Lu, Q.; Lijie, P.; Pengfei, T.; Rongjuan, L.; Sihua, H.; Fei, X.; Taiyang, Z. Gains and losses of farmland associated with farmland protection policy and urbanization in China: An integrated perspective based on goal orientation. Land Use Policy 2023, 129, 106643. [Google Scholar] [CrossRef]
  10. Song, W.; Pijanowski, B.C. The effects of China’s cultivated land balance program on potential land productivity at a national scale. Appl. Geogr. 2014, 46, 158–170. [Google Scholar] [CrossRef]
  11. Wang, L.Y.; Anna, H.; Zhang, L.Y.; Xiao, Y.; Wang, Y.Q.; Xiao, Y.; Liu, J.G.; Ouyang, Z.Y. Spatial and Temporal Changes of Arable Land Driven by Urbanization and Ecological Restoration in China. Chin. Geogr. Sci. 2019, 29, 809–819. [Google Scholar] [CrossRef]
  12. Kuang, W.H.; Liu, J.Y.; Tian, H.Q.; Shi, H.; Dong, J.W.; Song, C.Q.; Li, X.Y.; Du, G.M.; Hou, Y.L.; Lu, D.S.; et al. Cropland redistribution to marginal lands undermines environmental sustainability. Natl. Sci. Rev. 2022, 9, nwab091. [Google Scholar] [CrossRef]
  13. Li, J.D.; Zhang, Z.C.; Ma, L.G.; Gu, Q.; Wang, K.; Xu, Z.H. Assessment on the Impact of Arable Land Protection Policies in a Rapidly Developing Region. ISPRS Int. J. Geo-Inf. 2016, 5, 69. [Google Scholar] [CrossRef]
  14. Chen, J.; Lin, Z.; Lin, J.; Wu, D. Investigating the Spatial Distribution and Influencing Factors of Non-Grain Production of Farmland in South China Based on MaxEnt Modeling and Multisource Earth Observation Data. Foods 2024, 13, 3385. [Google Scholar] [CrossRef]
  15. Xie, Z.; Zhang, Q.Q.; Jiang, C.; Yao, R.B. Cropland compensation in mountainous areas in China aggravates non-grain production: Evidence from Fujian Province. Land Use Policy 2024, 138, 107026. [Google Scholar] [CrossRef]
  16. Zou, L.L.; Liang, Y.F.; Hu, X.D.; Bai, M.D.; Wen, Q. A multidimensional assessment and analysis of farmland fragmentation in the southeast coastal area of China. Land Degrad. Dev. 2023, 34, 4021–4034. [Google Scholar] [CrossRef]
  17. Lin, J.; Wang, Y.; Lin, Z.; Li, S. National-scale connectivity analysis and construction of forest networks based on graph theory: A case study of China. Ecological Engineering 2025, 216, 107639. [Google Scholar] [CrossRef]
  18. Chen, W.X.; Ye, X.Y.; Li, J.F.; Fan, X.; Liu, Q.S.; Dong, W.C. Analyzing requisition-compensation balance of farmland policy in China through telecoupling: A case study in the middle reaches of Yangtze River Urban Agglomerations. Land Use Policy 2019, 83, 134–146. [Google Scholar] [CrossRef]
  19. Su, W.Z.; Ye, G.B. Differences of Soil Fertility in Farmland Occupation and Supplement Areas in the Taihu Lake Watershed during 1985–2010. Int. J. Environ. Res. Public Health 2014, 11, 5598–5612. [Google Scholar] [CrossRef]
  20. Zheng, W.W.; Li, S.M.; Ke, X.L.; Li, X.Y.; Zhang, B.B. The impacts of cropland balance policy on habitat quality in China: A multiscale administrative perspective. J. Environ. Manag. 2022, 323, 116182. [Google Scholar] [CrossRef]
  21. Strek, Z.; Len, P.; Wójcik-Len, J.; Postek, P.; Mika, M.; Dawid, L. A Proposed Land Exchange Algorithm for Eliminating the External Plot Patchwork. Land 2021, 10, 64. [Google Scholar] [CrossRef]
  22. Xu, W.Y.; Jin, X.B.; Liu, J.; Zhou, Y.K. Impact of cultivated land fragmentation on spatial heterogeneity of agricultural agglomeration in China. J. Geogr. Sci. 2020, 30, 1571–1589. [Google Scholar] [CrossRef]
  23. Janus, J.; Ertunç, E.; Muchová, Z.; Tomić, H. Impact of selected land fragmentation parameters and spatial rural settlement patterns on the competitiveness of agriculture: Examples of selected European and Asian countries. Habitat Int. 2023, 140, 102911. [Google Scholar] [CrossRef]
  24. Shao, Y.T.; Zhu, L.J.; Jia, W.W. Contiguous planting on fragmented cultivated land and reduction of chemical pesticides and chemical fertilizers: Evidence from rice farmer in China. J. Environ. Manag. 2025, 374, 124062. [Google Scholar] [CrossRef]
  25. Liang, J.L.; Pan, S.P.; Chen, W.X.; Li, J.F.; Zhou, T. Cultivated Land Fragmentation and Its Influencing Factors Detection: A Case Study in Huaihe River Basin, China. Int. J. Environ. Res. Public Health 2022, 19, 138. [Google Scholar] [CrossRef]
  26. Cao, W.; Zhou, W.; Wu, T.; Wang, X.; Xu, J. Spatial-temporal characteristics of cultivated land use eco-efficiency under carbon constraints and its relationship with landscape pattern dynamics. Ecol. Indic. 2022, 141, 109140. [Google Scholar] [CrossRef]
  27. Zhang, W.L.; Qiu, S.X.; Lin, Z.C.; Chen, Z.X.; Yang, Y.C.; Lin, J.Y.; Li, S.Y. Assessing the influence of green space morphological spatial pattern on urban waterlogging: A case study of a highly-urbanized city. Environ. Res. 2025, 266, 120561. [Google Scholar] [CrossRef] [PubMed]
  28. Nickayin, S.S.; Salvati, L.; Coluzzi, R.; Lanfredi, M.; Halbac-Cotoara-Zamfir, R.; Salvia, R.; Quaranta, G.; Alhuseen, A.; Gaburova, L. What Happens in the City When Long-Term Urban Expansion and (Un)Sustainable Fringe Development Occur: The Case Study of Rome. ISPRS Int. J. Geo-Inf. 2021, 10, 231. [Google Scholar] [CrossRef]
  29. Hu, C.; Wang, Z.; Wang, Y.; Sun, D.; Zhang, J. Combining MSPA-MCR Model to Evaluate the Ecological Network in Wuhan, China. Land 2022, 11, 213. [Google Scholar] [CrossRef]
  30. Hong, K.R.; Qiu, L.S.; Yang, D.X.; Jiang, M.X. Spatio-Temporal Evolution and Correlation Analysis of Urban Land Use Patterns and Air Quality in Pearl River Delta, China. Front. Environ. Sci. 2021, 9, 698383. [Google Scholar] [CrossRef]
  31. Li, Z.T.; Li, M.; Xia, B.C. Spatio-temporal dynamics of ecological security pattern of the Pearl River Delta urban agglomeration based on LUCC simulation. Ecol. Indic. 2020, 114, 102557. [Google Scholar] [CrossRef]
  32. Su, M.Y.; Sun, K.Y.; Deng, B.Y.; Cheng, N.; Cao, Y. Quantification and Driving Factors of Cultivated Land Fragmentation in Rapidly Urbanizing Area: A Case Study in Guangdong Province. Remote Sens. 2024, 16, 2633. [Google Scholar] [CrossRef]
  33. Ye, S.J.; Ren, S.Y.; Song, C.Q.; Cheng, C.X.; Shen, S.; Yang, J.Y.; Zhu, D.H. Spatial patterns of county-level arable land productive-capacity and its coordination with land-use intensity in mainland China. Agric. Ecosyst. Environ. 2022, 326, 107757. [Google Scholar] [CrossRef]
  34. Wang, Z.; Yang, H.; Hu, Y.; Peng, Y.; Liu, L.; Su, S.; Wang, W.; Wu, J. Multifunctional trade-off/synergy relationship of cultivated land in Guangdong: A long time series analysis from 2010 to 2030. Ecol. Indic. 2023, 154, 110700. [Google Scholar] [CrossRef]
  35. Hu, P.P.; Li, F.; Sun, X.; Liu, Y.L.; Chen, X.C.; Hu, D. Assessment of Land-Use/Cover Changes and Its Ecological Effect in Rapidly Urbanized Areas-Taking Pearl River Delta Urban Agglomeration as a Case. Sustainability 2021, 13, 5075. [Google Scholar] [CrossRef]
  36. Li, X.; Zhang, X.; Jin, X. Spatio-temporal characteristics and driving factors of cultivated land change in various agricultural regions of China: A detailed analysis based on county-level data. Ecol. Indic. 2024, 166, 112485. [Google Scholar] [CrossRef]
  37. Tan, Y.Z.; Chen, H.; Lian, K.; Yu, Z.N. Comprehensive Evaluation of Cultivated Land Quality at County Scale: A Case Study of Shengzhou, Zhejiang Province, China. Int. J. Environ. Res. Public Health 2020, 17, 1169. [Google Scholar] [CrossRef]
  38. Zhao, Y.; Feng, Q. Identifying spatial and temporal dynamics and driving factors of cultivated land fragmentation in Shaanxi province. Agric. Syst. 2024, 217, 103948. [Google Scholar] [CrossRef]
  39. Song, W.; Zhang, H.; Zhao, R.; Wu, K.; Li, X.; Niu, B.; Li, J. Study on cultivated land quality evaluation from the perspective of farmland ecosystems. Ecol. Indic. 2022, 139, 108959. [Google Scholar] [CrossRef]
  40. Sarğın, B.; Alaboz, P.; Karaca, S.; Dengiz, O. Pythagorean fuzzy SWARA weighting technique for soil quality modeling of cultivated land in semi-arid terrestrial ecosystems. Comput. Electron. Agric. 2024, 227, 109466. [Google Scholar] [CrossRef]
  41. Qiao, L.; Wang, X.H.; Smith, P.; Fan, J.L.; Lu, Y.L.; Emmett, B.; Li, R.; Dorling, S.; Chen, H.Q.; Liu, S.G.; et al. Soil quality both increases crop production and improves resilience to climate change. Nat. Clim. Change 2022, 12, 574–580. [Google Scholar] [CrossRef]
  42. Zhu, Y.; Tian, D.; Yan, F. Effectiveness of Entropy Weight Method in Decision-Making. Math. Probl. Eng. 2020, 2020, 3564835. [Google Scholar] [CrossRef]
  43. Tu, Y.; Wu, S.; Chen, B.; Weng, Q.; Bai, Y.; Yang, J.; Yu, L.; Xu, B. A 30 m annual cropland dataset of China from 1986 to 2021. Earth Syst. Sci. Data 2024, 16, 2297–2316. [Google Scholar] [CrossRef]
  44. Yang, J.; Huang, X. The 30 m annual land cover dataset and its dynamics in China from 1990 to 2019. Earth Syst. Sci. Data 2021, 13, 3907–3925. [Google Scholar] [CrossRef]
  45. Shouzhang, P. 1-km Monthly Mean Temperature Dataset for China (1901–2023); National Tibetan Plateau/Third Pole Environment Data Center, 2019. [Google Scholar] [CrossRef]
  46. Shouzhang, P. High-spatial-resolution monthly precipitation dataset over China during 1901–2017. Earth Syst. Sci. Data 2024, 11, 1931–1946. [Google Scholar] [CrossRef]
  47. Maity, N.; Mishra, V.N. Urban Growth Analysis Using Multi-Temporal Remote Sensing Image and Landscape Metrics for Smart City Planning of Lucknow District, India. Eng. Proc. 2024, 82, 59. [Google Scholar] [CrossRef]
  48. Jia, Y.; Tang, L.; Xu, M.; Yang, X. Landscape pattern indices for evaluating urban spatial morphology—A case study of Chinese cities. Ecol. Indic. 2019, 99, 27–37. [Google Scholar] [CrossRef]
  49. Li, Q.; Zhou, Y.; Wang, L.; Zuo, Q.; Yi, S.Q.; Liu, J.Y.; Su, X.P.; Xu, T.; Jiang, Y. The Link between Landscape Characteristics and Soil Losses Rates over a Range of Spatiotemporal Scales: Hubei Province, China. Int. J. Environ. Res. Public Health 2021, 18, 11044. [Google Scholar] [CrossRef]
  50. Wang, S.; Wu, M.; Hu, M.; Fan, C.; Wang, T.; Xia, B. Promoting landscape connectivity of highly urbanized area: An ecological network approach. Ecol. Indic. 2021, 125, 107487. [Google Scholar] [CrossRef]
  51. Lin, J.; Wei, K.; Guan, Z. Exploring the connection between morphological characteristic of built-up areas and surface heat islands based on MSPA. Urban Clim. 2024, 53, 101764. [Google Scholar] [CrossRef]
  52. Li, Y.; Liu, W.; Feng, Q.; Zhu, M.; Yang, L.; Zhang, J.; Yin, X. The role of land use change in affecting ecosystem services and the ecological security pattern of the Hexi Regions, Northwest China. Sci. Total Environ. 2023, 855, 158940. [Google Scholar] [CrossRef] [PubMed]
  53. Lu, D.; Wang, Z.P.; Li, X.X.; Zhou, Y.J. Evaluation of the efficiency and drivers of complemented cropland in Southwest China over the past 30 years from the perspective of cropland abandonment. J. Environ. Manag. 2024, 351, 119909. [Google Scholar] [CrossRef] [PubMed]
  54. Li, Y.H.; Shangguan, S.H.; Li, W.Y.; Liu, S.; Li, Y.J.; Han, R.; Xu, J.W. Spatial-temporal distribution of farmland occupation and compensation and its impact on ecological service value in China from 1990 to 2021. Sci. Rep. 2025, 15, 14010. [Google Scholar] [CrossRef]
  55. Chen, H.; Tan, Y.; Xiao, W.; Li, G.; Meng, F.; He, T.; Li, X. Urbanization in China drives farmland uphill under the constraint of the requisition–compensation balance. Sci. Total Environ. 2022, 831, 154895. [Google Scholar] [CrossRef]
Figure 1. Distribution of cropland in the PRD.
Land 14 01235 g001
Figure 2. Framework of this study.
Land 14 01235 g002
Figure 3. Indicators of cropland quality evaluation.
Land 14 01235 g003
Figure 4. Results of the cropland quality evaluation in the PRD.
Land 14 01235 g004
Figure 5. Stacked histogram of PD values grouped by counties.
Land 14 01235 g005
Figure 6. Stacked histogram of LPI values grouped by counties.
Land 14 01235 g006
Figure 7. Stacked histogram of LSI values grouped by counties.
Land 14 01235 g007
Figure 8. Stacked histogram of AI values grouped by counties.
Land 14 01235 g008
Figure 9. The changes in the MSPA of cropland in the PRD.
Land 14 01235 g009
Table 1. Detailed information on the datasets.
DataResolutionSource
Cropland30 mCACD [43]
Average elevationNASA SRTM v3.0
Average slope
Mode of aspect
Distance from built-up areasCLCD [44]
Soil organic carbon content250 msoilgrids.org
Soil pH
Soil sand content
Average annual precipitation1 kmNational Tibetan Plateau Data [45,46]
Average annual temperature
Table 2. Weights for cropland quality evaluation.
DataWeight
Average annual precipitation0.106797397
Average annual temperature0.138212732
Average elevation0.028354329
Soil organic carbon content0.157631204
Mode of aspect0.11605875
Average slope0.060333843
Soil pH0.149299092
Distance from built-up areas0.120892324
Soil sand content0.122420329
Table 3. Definition and mathematical expression of landscape indicators.
IndicatorDefinitionMathematical Expression
PDIt measures the number of patches per unit area. PD = N u m b e r   o f   P a t c h e s T o t a l   L a n d s c a p e   A r e a
LPIIt measures the percentage of the landscape area occupied by the largest patch. LPI = A r e a   o f   t h e   L a r g e s t   P a t c h T o t a l   L a n d s c a p e   A r e a × 100 %
LSIIt quantifies the complexity of patch shapes, standardized by landscape area. LSI = T o t a l   P a t c h   B o u n d a r y   L e n g t h 2 π × T o t a l   L a n d s c a p e   A r e a  
AIIt measures the degree of spatial clustering of patches of the same type. AI = i = 1 n j = 1 n P i j ln P i j 2 ln n × 100 %
(Pij: probability that patch, i is adjacent to patch j)
Table 4. MSPA elements and definitions.
ElementDefinition
CoreInterior part excluding perimeter
IslandDisjoint and too small to become the core
PerforationInternal perimeter
EdgeExternal perimeter
LoopConnected to the same core
BridgeConnected to different cores
BranchConnected at one end to the edge, perforation, bridge, or loop
Table 5. Interviewee categories and interview focus.
Interviewee CategoriesInterview Focus
FarmersPolicy awareness, current farming status, development expectations
Retired farmersHistorical review, policy changes, and social impacts
Village officialsPolicy implementation and impacts, resource management, responses to challenges
Agricultural techniciansProfessional assessment, technical applications, policy recommendations
Table 6. Change rates in the MSPA elements of cropland in the PRD (km²).
199620012006201120162021
Core4289.19 726.61 2885.28 2198.25 2020.67 2425.41
Change −83% 297% −24% −8% 20%
Island1180.86 218.91 1314.90 1478.28 1606.10 1571.60
Change −81% 501% 12% 9% −2%
Perforation250.63 63.71 141.54 78.43 71.61 92.98
Change −75% 122% −45% −9% 30%
Edge2594.14 382.41 2063.41 1826.75 1858.22 2146.32
Change −85% 440% −11% 2% 16%
Loop625.99 108.31 473.44 407.30 348.89 385.84
Change −83% 337% −14% −14% 11%
Bridge2737.23 360.70 1949.08 1815.77 1742.76 2010.96
Change −87% 440% −7% −4% 15%
Branch1359.81 200.61 1192.74 1179.28 1287.15 1437.91
Change −85% 495% −1% 9% 12%
Table 7. Patch number and area for the four categories of “cores”.
1996 2001
NumberAreaArea (%)NumberAreaArea (%)
Small core56,7001991.3246.4353,1411906.1848.10
Medium core4311146.6026.73380980.3924.74
Large core43565.1513.1833409.3210.33
Super-large core13586.1213.6713666.9716.83
2006 2011
NumberAreaArea (%)NumberAreaArea (%)
Small core47,3311576.4754.6445,6051405.3863.93
Medium core278686.4923.79226578.4926.32
Large core27329.5211.4210143.716.54
Super-large core6292.8010.15270.673.22
2016 2021
NumberAreaArea (%)NumberAreaArea (%)
Small core47,9371365.1767.5654,6381544.2563.67
Medium core170412.2320.40205499.5120.60
Large core14171.968.5115191.097.88
Super-large core271.313.533190.567.86
Disclaimer/Publisher’s Note: The statements, opinions and data contained in all publications are solely those of the individual author(s) and contributor(s) and not of MDPI and/or the editor(s). MDPI and/or the editor(s) disclaim responsibility for any injury to people or property resulting from any ideas, methods, instructions or products referred to in the content.

