Article

Understanding Urban Growth and Shrinkage: A Study of the Modern Manufacturing City of Dongguan, China

by
Tingting Chen
1,2,
Zhoutong Wu
1,2 and
Wei Lang
1,2,*
1
School of Geography and Planning, Sun Yat-sen University, Guangzhou 510006, China
2
China Regional Coordinated Development and Rural Construction Institute, Sun Yat-sen University, Guangzhou 510275, China
*
Author to whom correspondence should be addressed.
Land 2025, 14(8), 1507; https://doi.org/10.3390/land14081507
Submission received: 26 May 2025 / Revised: 17 July 2025 / Accepted: 19 July 2025 / Published: 22 July 2025

Abstract

Since the early 21st century, urban shrinkage has become a significant global phenomenon. Dongguan, in Guangdong Province, China, is known as a “world factory”. It experienced notable urban shrinkage following the 2008 financial crisis. However, the city demonstrated remarkable recovery and ongoing development in subsequent years. On that basis, this study focuses on the following three points: (1) identifying the spatiotemporal factors contributing to the growth and shrinkage of manufacturing cities, taking Dongguan as an example; (2) explaining the influencing factors of the growth and shrinkage of Dongguan City during three critical periods, 2008–2014 (post-crisis), 2015–2019 (as machinery replaced human work), and 2020–2023 (the COVID-19 pandemic and recovery); and (3) selecting representative towns and streets for on-site observation and investigation, analyzing the measures they have taken to cope with growth and shrinkage during different periods. The key findings include the following: (1) The spatial dynamics of growth and shrinkage in Dongguan show significant temporal patterns, with traditional manufacturing areas shrinking from 2008 to 2014, central urban areas recovering from 2015 to 2019, and renewed shrinkage from 2020 to 2023. However, some regions maintained stability through strategic innovations. (2) Various factors, particularly industrial upgrading and technological innovation, drove the urban dynamics, enhancing economic resilience. (3) The case study of Houjie Town revealed successful adaptive mechanisms supported by policy while facing challenges like labor mismatches and inadequate R&D investment. This research offers insights for improving urban resilience and promoting sustainable development in Dongguan.

1. Introduction

As complex social ecosystems, cities have faced various external shocks and internal disturbances since their formation. Modern cities, characterized by high spatial and population concentration, diversified social organization, and complex economic structures, confront increasingly intricate contradictions and risks. External shocks and internal disturbances, such as economic crises, social transformations, and natural disasters, profoundly impact cities [1]. Notably, the 2008 global financial crisis has accelerated the shrinkage of once-prosperous towns [2]. Currently, the world is experiencing a development in globalization. Urban shrinkage has been widely observed in industrialized cities and metropolises across Europe, North America, Australia, Russia, and Japan [3,4]. Even China, which is undergoing rapid urbanization, has not escaped this trend [5]. Between 2000 and 2010, 40 prefectures and 139 county-level cities in China experienced population displacements [6], primarily concentrated in resource-depleted cities and small-to-medium-sized towns [7,8,9]. Cities exhibit significant differences in their capacity to respond to shrinkage: some effectively adapt, recover, and even transform and upgrade through such challenges, demonstrating strong urban resilience [10,11], while others may fall into prolonged decline [12].
Chinese cities demonstrate high economic resilience and strong internationalization capabilities when facing potential crises [13,14]. Dongguan, known as a world factory and a key manufacturing city in the Pearl River Delta, underwent immense challenges during the 2008 global financial crisis due to fluctuations in international market demand [15]. As China deepened its economic transformation, Dongguan confronted industrial upgrading and economic restructuring demands. Despite multiple external disturbances, Dongguan stabilized its economic foundation in 2014 through policies such as machines replacing human workers and market adaptation strategies. It gradually transitioned from low-end manufacturing to high-tech and service-oriented industries, showcasing remarkable flexibility and innovation. In 2019, the COVID-19 pandemic again pushed Dongguan into a shrinkage phase. Further in-depth research is needed on the temporal and spatial characteristics and the factors contributing to its growth and shrinkage, in order to better cope with current and potential development shocks.
Based on this, the three goals of this study are as follows: (1) to conduct an in-depth analysis of the temporal and spatial characteristics of growth and shrinkage in Dongguan during different development phases; (2) to compare the similarities and differences in explanatory factors for growth and shrinkage in manufacturing cities under different external events; and (3) to select representative towns in Dongguan for case studies of their development status and propose targeted strategies to cope with urban shrinkage. Dongguan provides an excellent perspective for observing how cities achieve sustainable development when facing shrinkage phenomena caused by major external shocks.

2. Literature Review

2.1. Urban Shrinkage

The concept of urban shrinkage was first introduced by the German scholar Häußermann to describe post-industrial population displacements and economic structural decline in Europe and East Germany [16]. The Shrinking City International Research Network defines shrinking cities as densely populated urban areas with at least 10,000 residents, experiencing population displacements across most regions for over two years and undergoing economically transformative structural crises [17]. Academic research has comprehensively explored definitions [18,19], classifications [20], spatial forms [21,22], drivers [23,24], and coping strategies for shrinking cities [25]. Case studies reveal that urban shrinkage in Germany stems from deindustrialization, suburbanization, post-Soviet transitions, and population outmigration [26]. In the U.S. “Rust Belt”, deindustrialization and suburbanization reduced employment levels, and outward migration triggered real estate decay. Japan’s shrinkage is driven by aging populations and labor shortages [27]. Central and Eastern European countries have also experienced urban shrinkage due to deindustrialization at an early stage. Over time, suburbanization driven by citizens’ pursuit of a higher quality of life and the decline in fertility rates have become the main factors contributing to urban shrinkage [28]. Urban shrinkage in Serbia is characterized by a continuous decline in population, an increase in aging, and the disorderly expansion of urban space leading to a decrease in density (expansion-based shrinkage). This stems from natural negative population growth, emigration, and the imbalance of the urban system, along with planning failures [29].
In contrast to Western countries, where both the industrialization process and the phenomenon of urban shrinkage and related concepts began earlier, in China, the phenomenon of urban shrinkage in has only gradually emerged in recent years [6,30,31]. However, unlike Western countries, China, as a rapidly urbanizing nation, has a unique pattern of urban development where growth and shrinkage coexist. In China, resource-based cities, such as Hegang City in Northeast China, have experienced recessionary shrinkage due to resource depletion; they have long relied on coal and other mineral industries, with a single industrial structure and lagging industrial transformation. The decline in the mining industry has triggered an economic downturn and job market shrinkage with a 4–5 year lag effect, which in turn leads to an exodus of the labor force and an acceleration of aging in the population [32]. In addition, some economically active regions in China, such as the Pearl River Delta and the Yangtze River Delta, have experienced local functional shrinkage due to industrial upgrading [7,15,33]. For example, the urban shrinkage in Dongguan City is characterized as local shrinkage within an overall growth pattern. This shrinkage is mainly caused by external shocks, the decline of the demographic dividend, and policy adjustments [15].

2.2. Factors of Urban Growth and Shrinkage

Under globalization, the interpretation of urban shrinkage using cyclical models is limited [34,35]. Instead, it is increasingly viewed as a short-term phenomenon driven by global events like financial crises, which alter labor and capital flows. Correspondingly, the research has expanded to explore dynamic interactions between shrinkage and revitalization [2,36] as manifestations of resilience. Scholars have examined cities’ performance during crises, such as the financial crisis, from different dimensions, proposing and validating different hypotheses for factors influencing urban growth and shrinkage. Firstly, socioeconomic factors—including economic diversification, human capital, and innovation—are crucial for revitalization. Regions have diversified economies, exhibit greater resilience, and recover from external shocks more easily [37], as has been seen in the Ruhr region in Germany and Cambridge in the UK; they can cope with recessions due to their socioeconomic factors [38]. Secondly, industrial specialization influences resilience; cities reliant on single industries are more vulnerable to crises and may experience more serious shrinkage [39]. Thirdly, governance and social factors shape resilience. Effective policies enhancing adaptive capacity can help cities adapt, innovate, and recover [40]. Lastly, cities with innovative ecosystems and skilled workforces recover faster through the development of new industries because they can replace lost ones with new ones [41].
The COVID-19 pandemic in 2020 represented a significant event for urban development [42]. It exacerbated urban shrinkage, similarly to the 2008 crisis [43,44]. The factors influencing urban shrinkage in the 2008 crisis and those in the COVID-19 pandemic in 2020 were not exactly the same. The 2008 crisis primarily triggered an economic recession due to financial instability. While the COVID-19 pandemic had a broader impact, the economics involved were more complex [45,46]. The COVID-19 pandemic necessitated extensive government intervention to manage public health and economic recovery. The measures taken by governments to contain the pandemic, such as lockdowns and mobility restrictions, have directly impacted the resilience of regional economies. Government interventions, particularly control measures and subsequent recovery policies, play a crucial role in mitigating the economic impacts of COVID-19 [47,48]. Higher transportation accessibility during economic downturns enhances the resilience of regional economies. The pandemic has highlighted the importance of transportation infrastructure in bolstering regional economic resilience. Cities with better transportation accessibility are more capable of withstanding economic shocks. Well-configured public services enable cities to maintain economic stability and support faster recovery [46]. Cities with high levels of public services are better equipped to adapt to changes in demand caused by the pandemics, such as promptly responding to increased demands for digital services, healthcare, and logistics [49,50].

2.3. Study Hypothesis

Manufacturing cities, which are central to the process of industrialization, often experience a shrinkage process accompanied by significant adjustments in the industrial structure and external shocks. Therefore, their spatial shrinkage patterns possess typicality and mechanism characteristics. On one hand, a large number of empirical studies on multiple case studies in both the West and China have shown that cities in regions with a high concentration of traditional manufacturing industries often exhibit spatial fragmentation and shrinkage, forming a perforated structure, whether in Leipzig, Detroit, or the old industrial base in Northeast China [21,51,52]. This not only reflects the decline of the old industrial areas but also implies structural change in the city where the core area is empty and disconnected from the external receiving space. On the other hand, manufacturing cities experience significant phased shrinkage due to industrial transformation, macroeconomic fluctuations, or policy shocks, manifesting as an intensification of shrinkage at specific points or periods, such as during the 2008 financial crisis or the COVID-19 pandemic, which were particularly notable.
Meanwhile, the growth and shrinkage process of manufacturing cities is profoundly influenced by the dynamic changes in industrial structure transformation and industrial innovation capabilities [53,54]. However, these industry-related factors may vary in terms of their direction and intensity of influence during different periods and under different economic circumstances. Therefore, the growth and shrinkage of manufacturing cities are not simply positively or negatively correlated with industrial-related factors. Instead, they depend on the specific phase and background of urban development, exhibiting dynamic characteristics.
Based on the aforementioned theoretical and empirical background, the following research hypotheses are proposed:
H1: 
previous studies hold that industrial transformation and external shocks (such as financial crises and pandemics) can lead to the shrinkage of manufacturing cities. But does this relationship also apply to Dongguan City? In particular, in terms of spatial form, do manufacturing cities more likely exhibit perforated shrinkage and show nonlinear fluctuations at different stages?
H2: 
the traditional view holds that industrial upgrading and innovation investment can promote urban growth. Does this mechanism still hold true in Dongguan City? Particularly, in different development phases and under different external economic environments, do the impacts of these factors exhibit dynamic heterogeneity?

3. Materials and Methods
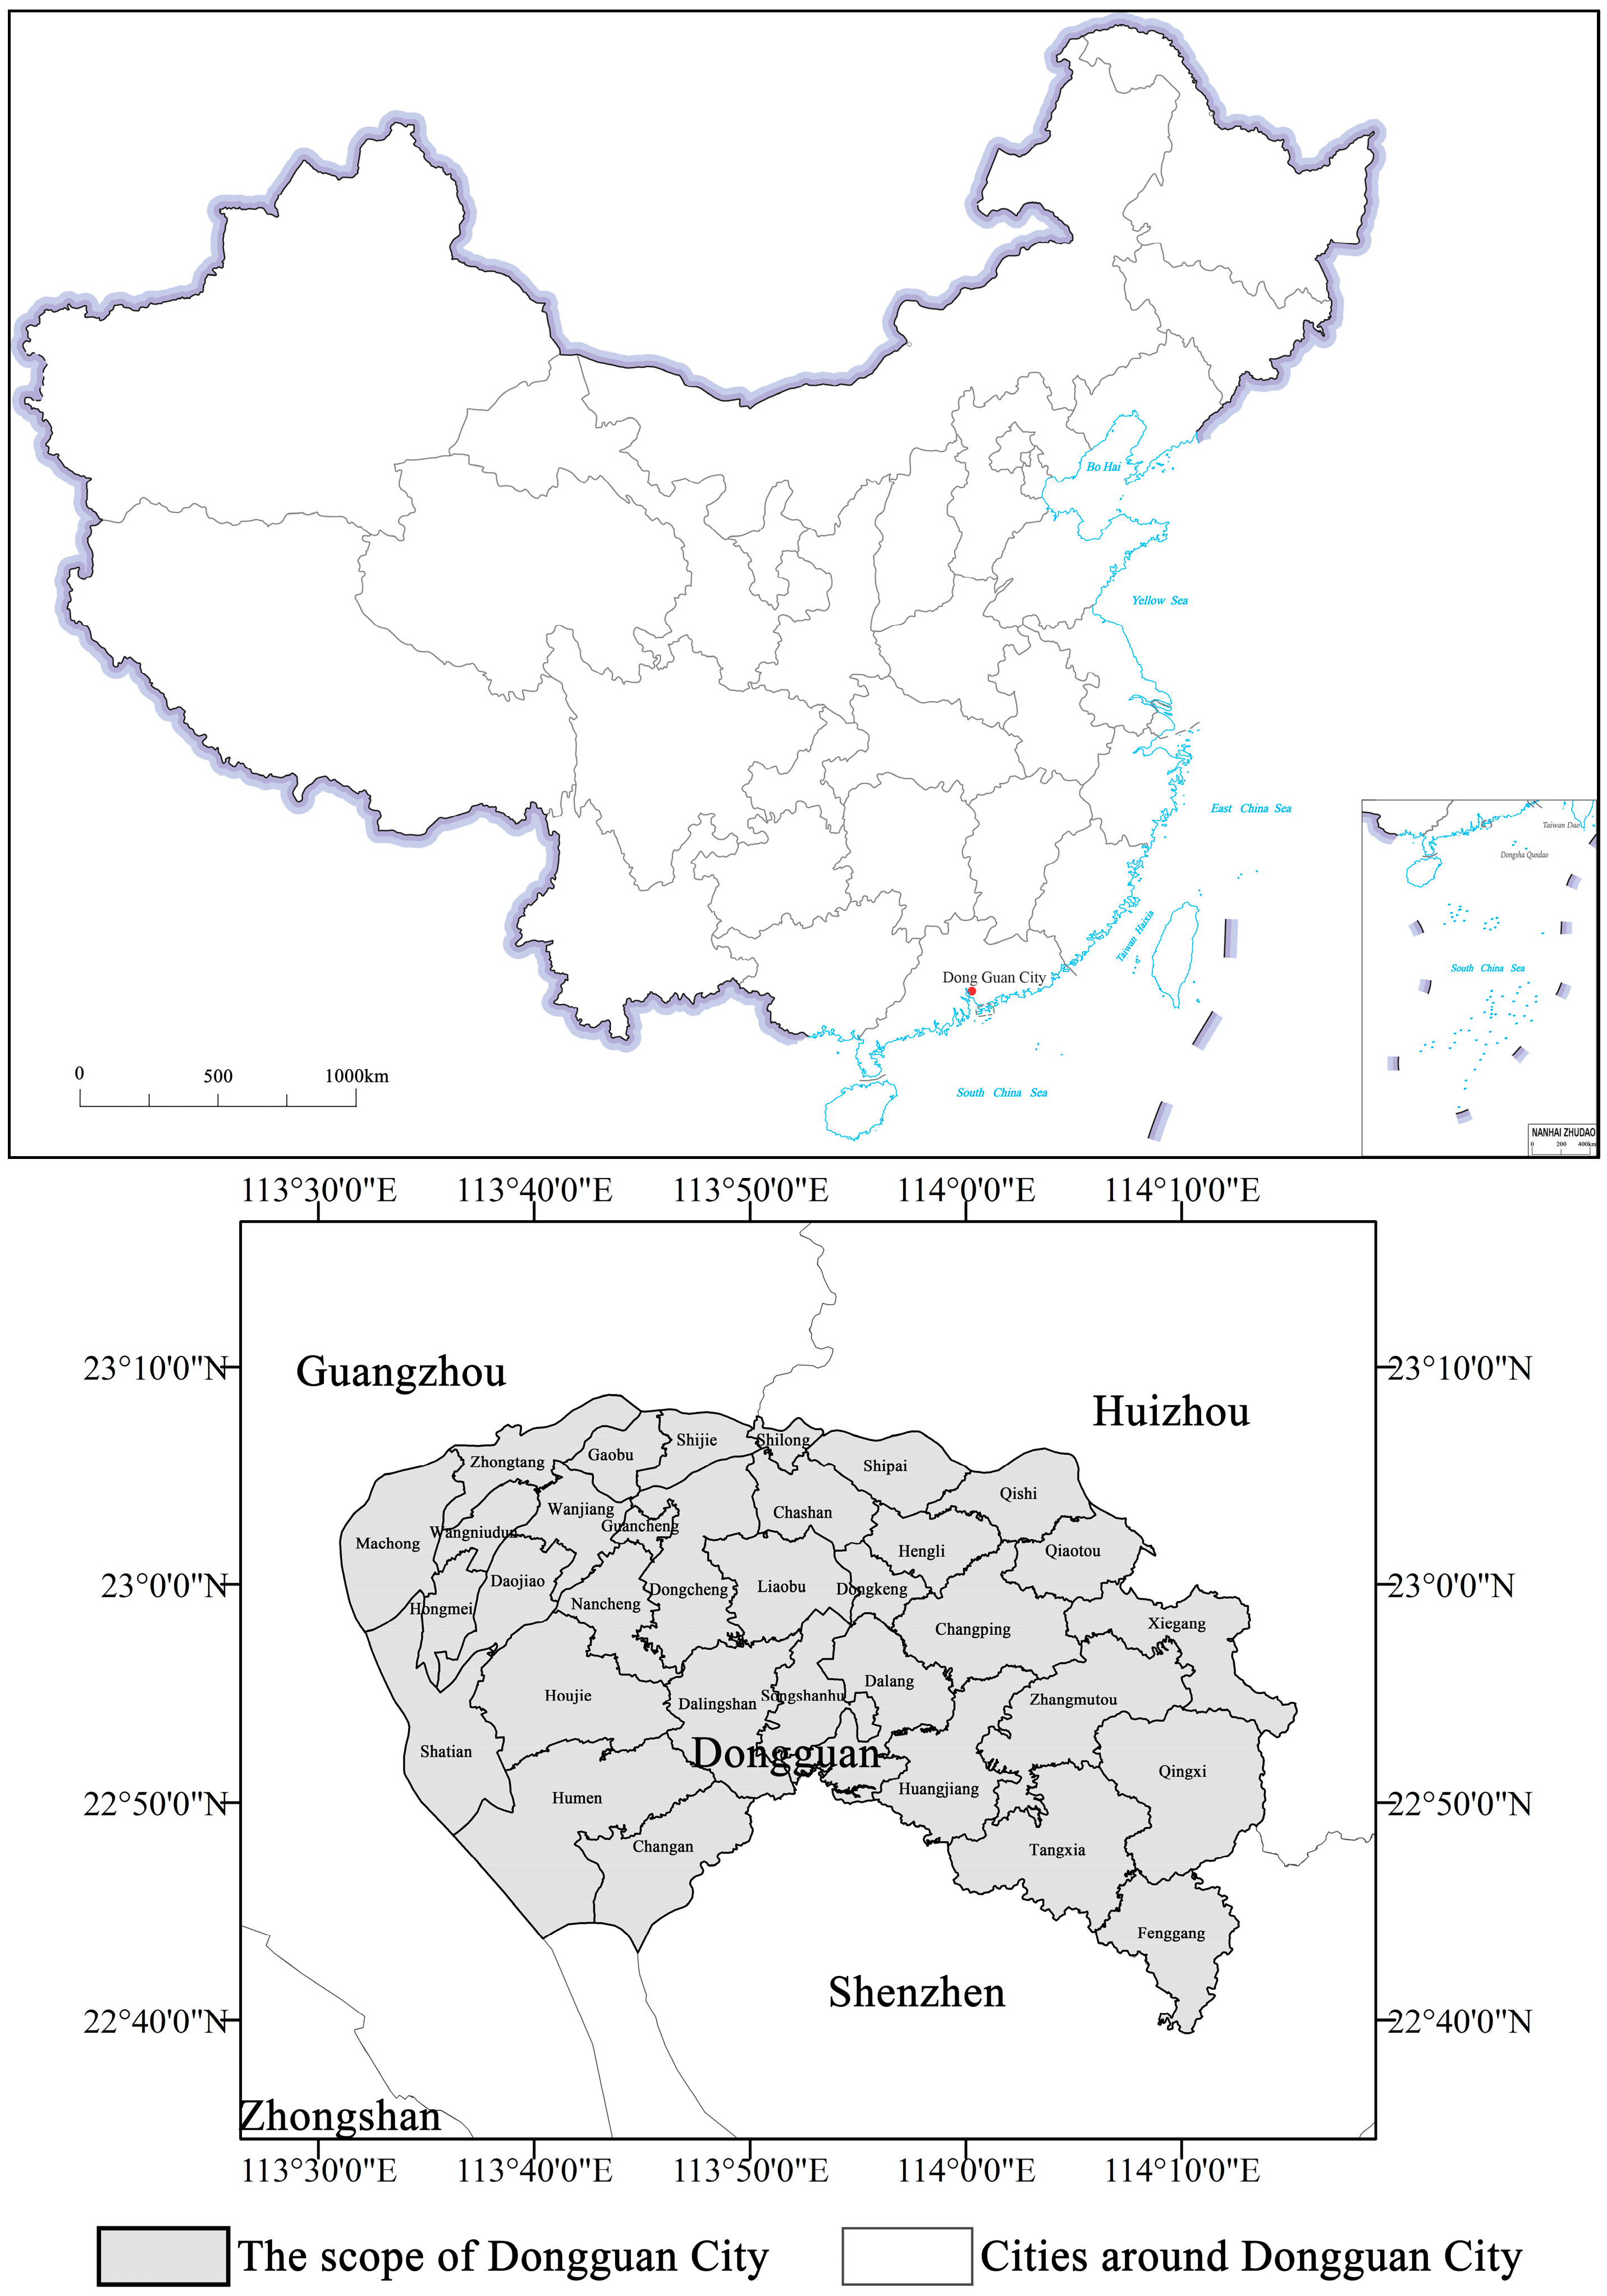
3.1. Study Area

Dongguan City is located in the southeastern part of Guangdong Province (22°39′–23°09′ N, 113°31′–114°15′ E), within the eastern part of the Pearl River Delta (Figure 1). It borders Guangzhou and Shenzhen and is adjacent to the estuary of the East River and Guangzhou Waterway. Covering an area of 2465 km2, Dongguan administers 32 towns and sub-districts. It has an advantageous geographical position, transportation networks, and diverse natural resources (mountains, plains, and river systems). The development of Dongguan City, transitioning from an agricultural county to a world factory and then to the capital of innovation, showcases a unique model of economic transformation. Since 1978, Dongguan has leveraged international industrial relocation and a “three-plus-one” trading-mix model to achieve rapid industrialization and become a global manufacturing center. Dongguan has pursued high-quality development and innovation-driven strategies in a period of globalization and technological shifts. In recent years, Dongguan has been committed to building a metropolis in the Bay Area, focusing on urban quality enhancement, industrial upgrading, and technological innovation, continuously breaking through bottlenecks in urban development.
As a typical representative of China’s reform and opening up, Dongguan has a high proportion of migrant workers, leading to fluctuation in the urban population and economic growth, which show a significant linkage effect. According to the panel data for previous years, the population declined in the three key years of 2008, 2015, and 2020; therefore, Dongguan’s development is divided into the following three stages, in order to explore its transformation process and economic background in more depth (Figure 2).

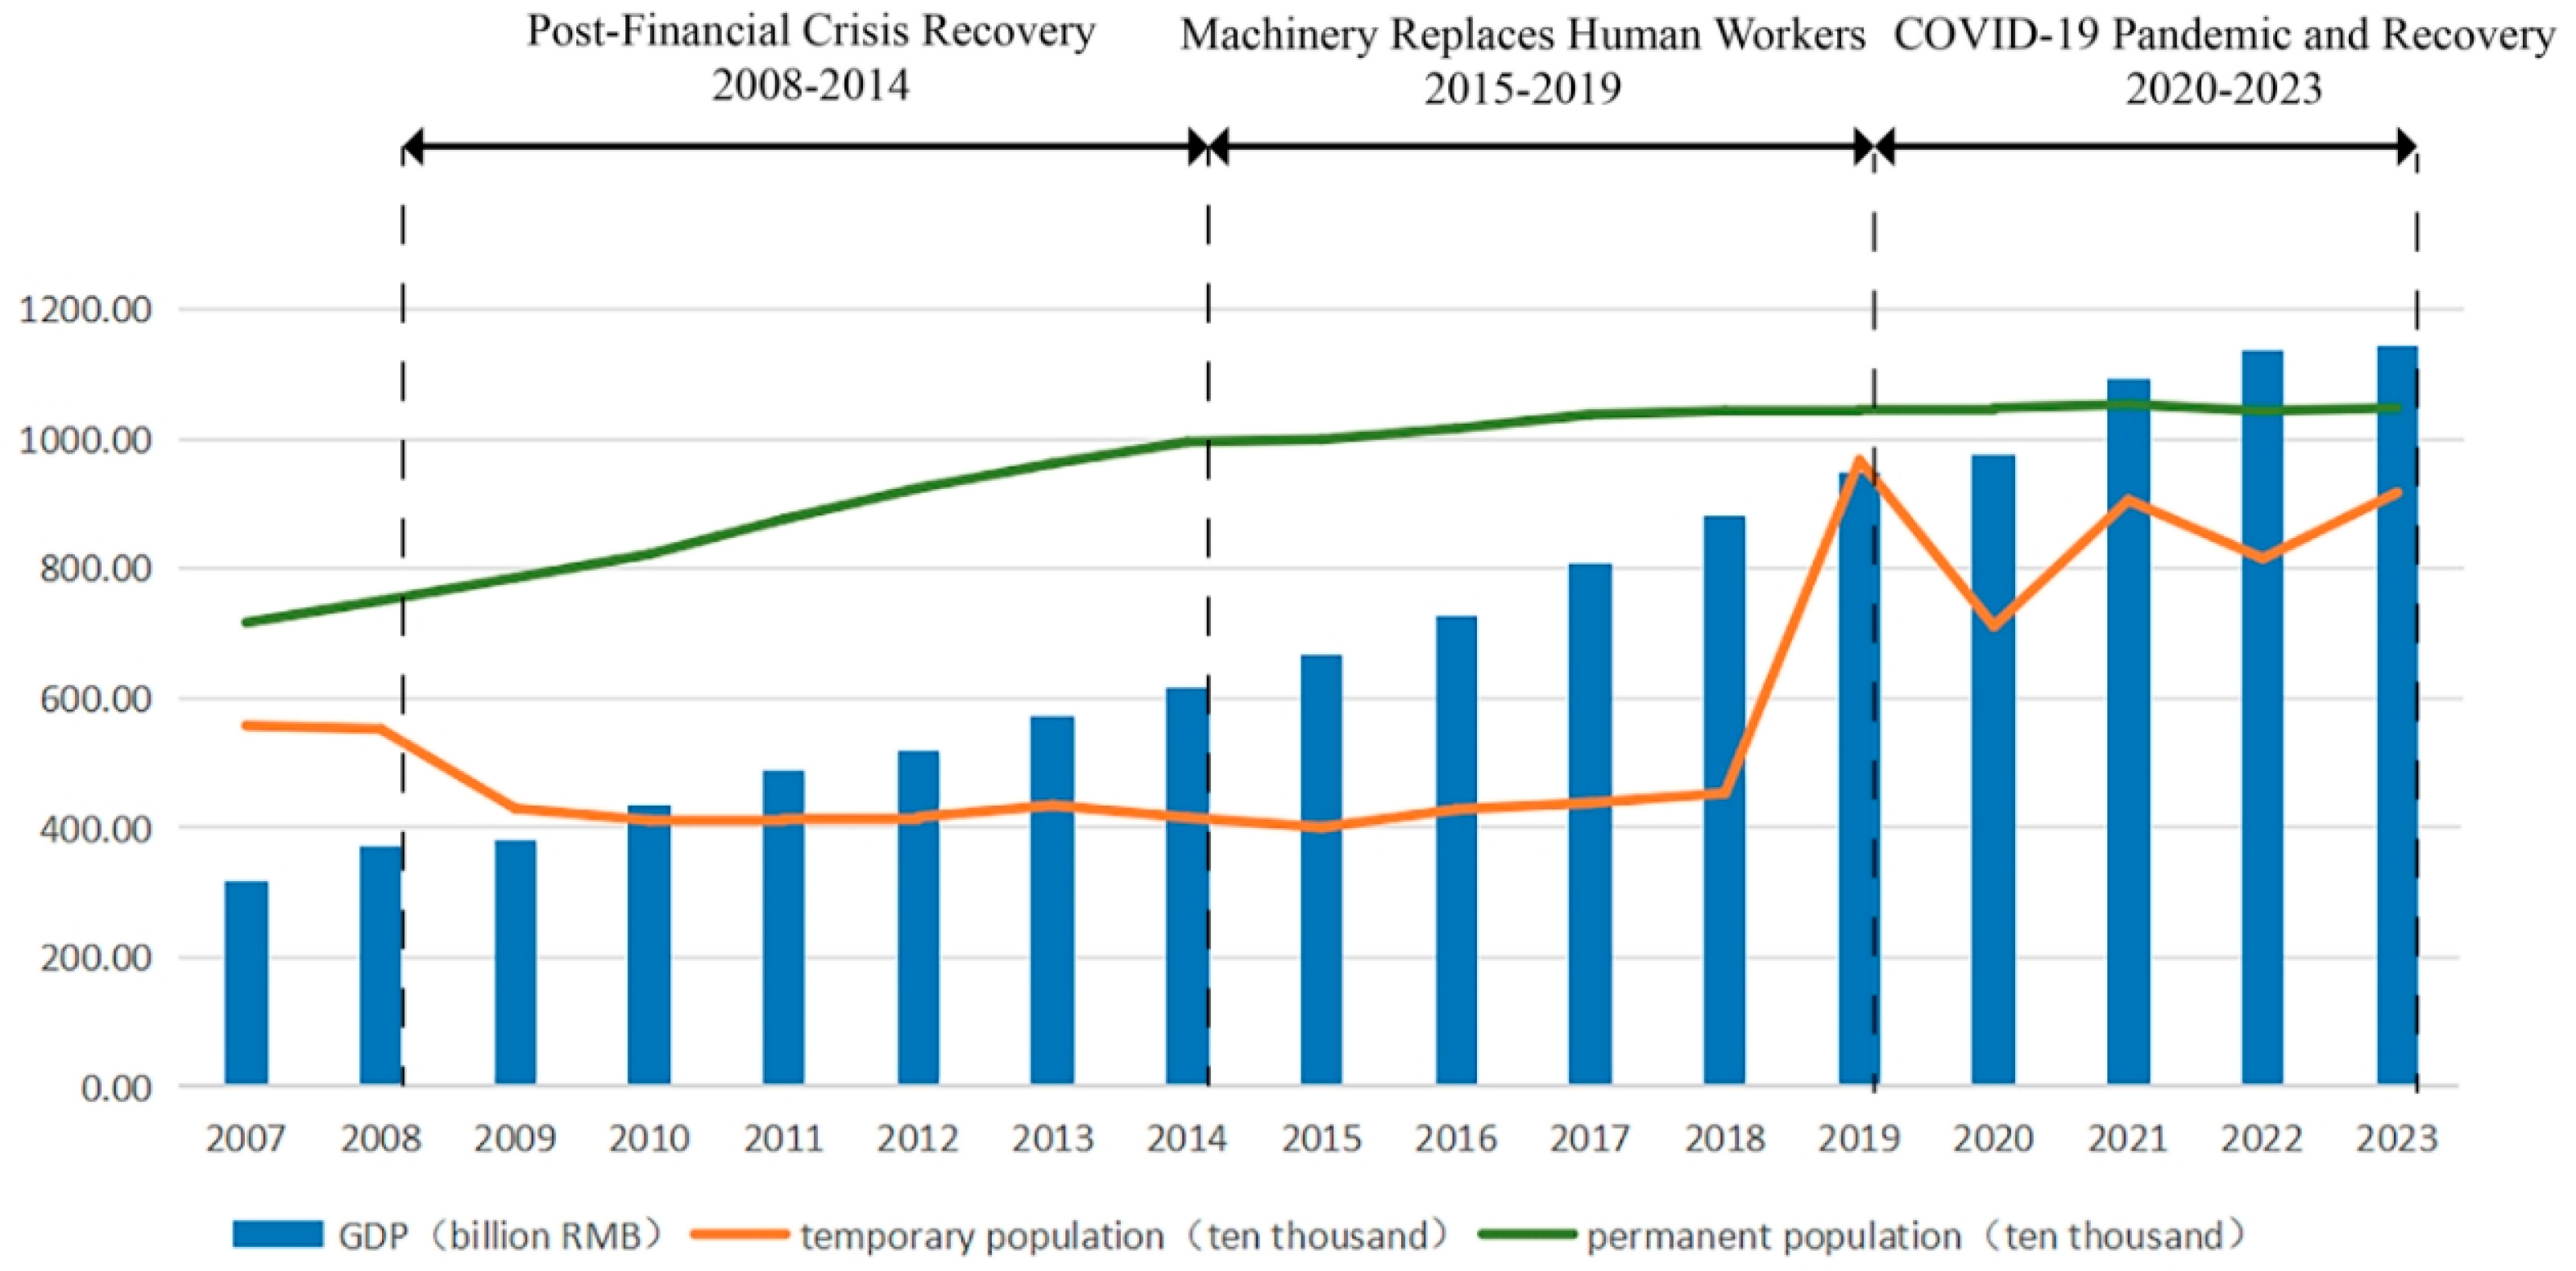
3.1.1. 2008–2014: Post-Financial Crisis Recovery

The panel data show that Dongguan’s export-oriented manufacturing industry was strongly affected by the 2008 global financial crisis, which led to a rapid decline in the number of temporary residents from outside Dongguan. The economic growth rate also shifted from high growth before the crisis to a downturn, reflecting the dual impact of the global economic downturn on the regional economy and population structure. The economic data and population fluctuations during this period show the characteristic changes in labor-intensive industries and the concentration of external populations under the background of the financial crisis.

3.1.2. 2015–2019: Machinery Replaces Human Workers

After 2015, the Dongguan government began to vigorously implement the “machines-replacing-humans” policy, using automation and intelligent manufacturing to promote industrial upgrading. The panel data show that during this period, although Dongguan’s permanent population showed a slow growth trend overall, the growth rate of the temporary population slowed down significantly, accompanied by a small decline, showing the inherent trend of population structure adjustment under the background of industrial transformation. At the same time, the economic growth rate gradually increased, reflecting the economic recovery effect brought about by technological innovation and industrial upgrading.

3.1.3. 2020–2023: COVID-19 Pandemic and Recovery

Since 2019, the COVID-19 pandemic has become a universal issue, and Dongguan is no exception to this. The panel data show that, in 2020, Dongguan’s permanent population experienced negative growth for the first time, while the economic growth rate and the rate of change in the temporary population showed large fluctuations. This phase fully reflects the characteristics of the city’s economic and population structure recovery through adjustments against the backdrop of a public health crisis.

3.2. Data Source

The data used in this research include measurements and identification data for urban growth, as well as explanatory factor data. The data explain growth and shrinkage factors including population, regional GDP, and the number of industrial enterprises. All of these are directly sourced from the Dongguan Statistical Yearbook published by the Dongguan Municipal Bureau of Statistics from 2008 to 2023. The POI data used in this study come from the Amap API, and the land use data come from the research results of Professors Yang Jie and Huang Xin of Wuhan University [55].
On the selection of data for measuring and identifying urban growth and shrinkage, it is worth noting that when the term “shrinking city” was first proposed by the German scholar Hausermann in 1988, it was defined as a city where the population continues to decline and is accompanied by an economic structure crisis [16]. This term was used to describe the phenomenon of population loss and economic decline in the Ruhr region of Germany due to deindustrialization [19,27]. It can be seen that the main indicators for identifying and measuring urban growth and shrinkage are population- and economic-related data.
The population dimension data utilized the WorldPop data generated by the University of Southampton in October 2013, which covered the period from 2008 to 2019. For the data on the period from 2020 to 2023, LandScan data were used to fill in the missing years of the WorldPop data. The LandScan data were developed by the Oak Ridge National Laboratory in the United States and were modeled using multiple sources of data, including censuses, land use, and transportation networks. They reflect the average population distribution during the day and has a high spatial resolution.
Furthermore, many scholars have utilized nighttime light data to reveal urban economic activities [56,57], which show a positive linear correlation with human activities and social economic conditions [58,59,60]. When conducting research on shrinking cities, the NTL can narrow the research scope to the physical space of the city and describe the internal structure of the city at a micro-level [61].
Based on this, the economic dimension data of this study utilized the corrected Chinese nighttime light data formulated by Wu Yizhen and other scholars (1992–2023) [62]. By integrating the DMSP-OLS and SNPP-VIIRS datasets, with their high temporal resolution and dynamic update features, the spatial distribution and change trends of economic activities in Dongguan City can be effectively reflected. Through analyzing the light intensity, this study reveals the spatial and temporal changes in economic development and industrial activity intensity in Dongguan City.

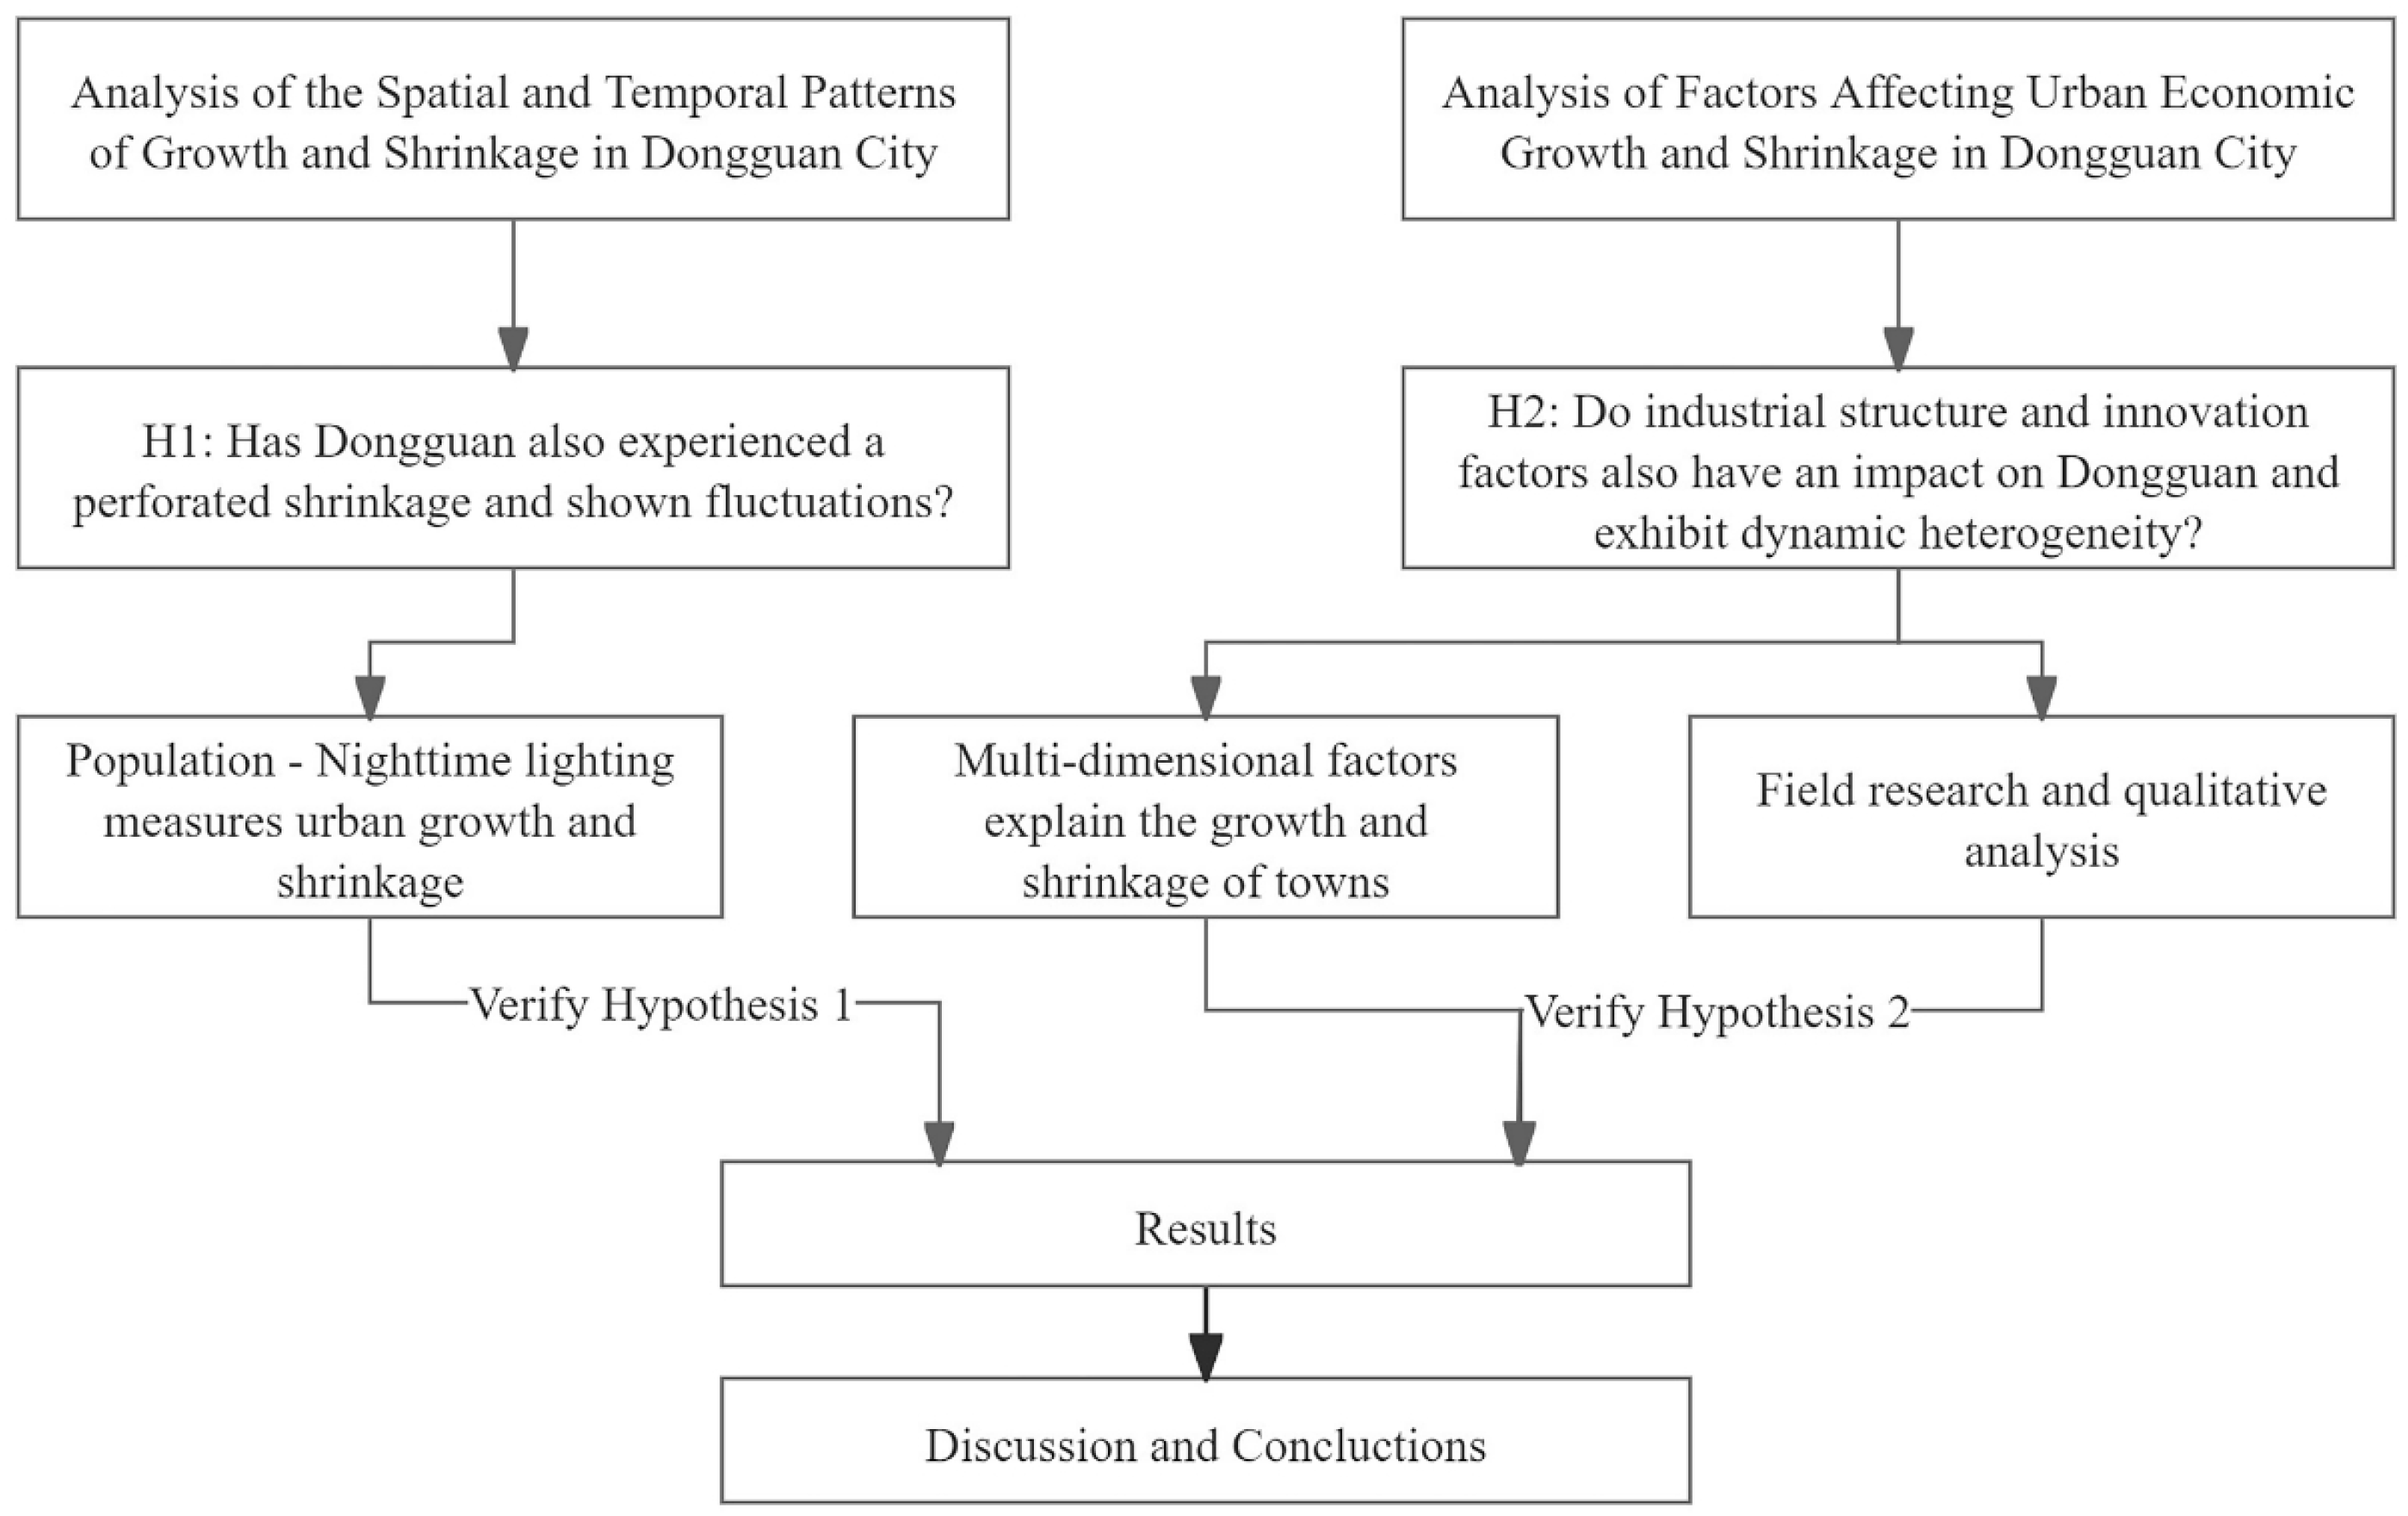
3.3. Analysis of the Spatial and Temporal Patterns of Growth and Shrinkage in Dongguan City

Regarding how to measure and identify urban shrinkage, scholars usually take population loss within a certain period as the main defining indicator. As the connotations of urban shrinkage continue to expand, Florian Bartholomae et al. have argued that population indicators cannot fully reflect the economic development situation of a city. Only when both the urban population and the economy experience a decline can it be defined as urban shrinkage [23]. Thus, the population often serves as the primary condition for defining urban growth and shrinkage; however, the level of urban economic development has realistic significance in studying urban growth and shrinkage.
Based on this, this study combines the two dimensions of population and economy to divide urban population and economic growth and shrinkage into four situations: population growth and economic growth, population growth and economic shrinkage, population shrinkage and economic growth, and population shrinkage and economic shrinkage. These four situations correspond to four types of growth and shrinkage: comprehensive growth type, imbalanced growth type, smart shrinkage type, and comprehensive shrinkage type (Figure 3).
Type 1: comprehensive growth towns exhibit simultaneous growth in their population and economy, indicating that the region is in a favorable development state.
Type 2: Imbalanced growth towns are characterized by population growth but lagging economic growth. This is commonly seen in some regions with an emphasis on export-oriented industries.
Type 3: smart shrinkage towns, despite experiencing population decline, manage to maintain relatively healthy economic growth through industrial upgrading or economic restructuring.
Type 4: comprehensive shrinkage towns show a decline in both population and economy, reflecting the decline of traditional industries or the negative impact of external economic factors.

3.4. Analysis of Factors Affecting Urban Economic Growth and Shrinkage in Dongguan City

This section constructs an analytical indicator system including four dimensions—population, industry, public services, and land use—to explore the factors influencing urban economic growth and shrinkage (Table 1). Specifically, the population dimension includes indicators such as the city’s permanent resident population and the number of employees in corporate R&D departments. The industry dimension incorporates variables like the kernel density of industrial and commercial enterprises, the number of industrial enterprises, and the degree of industrial structure advancement (the ratio of the output value of the tertiary industry to that of the secondary sector). The public services dimension includes the disposable fiscal expenditure at the town level and the kernel density of four types of POIs: healthcare, education, transportation, and scenic spots. The land use dimension selects the built-up, residential, and industrial land areas. Due to the constraints of statistics and data availability, the missing data of some years were supplemented by adopting linear interpolation (Figure 3).

3.5. Field Research and Qualitative Analysis

In order to deeply explore the specific manifestations of growth and shrinkage characteristics and explanatory factors of manufacturing cities at different phases, this study, based on quantitative analysis, also used supplementary qualitative research methods. This study selected representative manufacturing towns in Dongguan City as typical cases. Through a combination of semi-structured interviews and on-site visits, it obtained first-hand data from multiple entities.
The interviewees included representatives from local government, enterprises, and front-line employees. The content focused on the three phases of manufacturing city development from 2008 to 2023, with particular emphasis on aspects such as industrial policy adjustments, enterprise transformation and upgrading, labor flow, employment conditions, and the stability of the industrial chain.
This study, based on the interview outline and research records, systematically sorted out various viewpoints, combined with on-site observation data, extracted the manifestations and response measures that affect urban growth and shrinkage, and attempted to analyze the existing deficiencies. This qualitative research, presented as a supplement to the quantitative results, helps to explain the internal logic and micro-manifestations of the shrinkage and recovery of manufacturing cities more comprehensively, and it provides a reliable empirical basis for discussing policy suggestions.
As a representative case of economic transformation and dynamic spatial evolution in Dongguan City, Houjie Town holds significant research value. On the one hand, Houjie Town exemplifies the transition of labor-intensive traditional manufacturing industries in Dongguan toward high-quality development, having navigated three critical phases: the financial crisis, the implementation of the machines-replacing-humans strategy, and the COVID-19 pandemic. This trajectory reflects the route of transformation of manufacturing hubs in the Pearl River Delta from extensive expansion to innovation-driven growth. On the other hand, Houjie Town, which is characterized by high population and industrial agglomeration, demonstrates coexisting features of urban development and shrinkage. Its experiences and shortages offer universal lessons, and provide a valuable reference point for similar towns in Dongguan and the broader Pearl River Delta (Figure 3).

3.6. Research Methods

To comprehensively explore the impact of multidimensional factors such as population, industry, public services, and land use on the economic development of Dongguan, this study employs a multiple linear regression model (MLR) for quantitative analysis. Specifically, this study uses Dongguan’s GDP as the dependent variable (Y), representing the level of urban economic development. The independent variables selected the specific indicators of the four dimensions mentioned above: population, industry, public services, and land use (specific indicators are listed in Table 1). The expression of the multiple linear regression model constructed in this study is
Y = β0 + β1X1 + β2X2 + … + βn Xn + ε.
The meanings of the terms in the formula are as follows:
  • Y: the level of urban economic development, represented by GDP;
  • Xi: independent variables, representing the specific indicators selected from each dimension;
  • β0: the intercept term, indicating the theoretical value of the dependent variable when all independent variables are zero;
  • βi: the regression coefficients to be estimated, representing the extent of the impact of a one-unit increase in the independent variable Xi on the dependent variable Y;
  • ε: the random error term, assumed to follow a normal distribution with a mean of 0, constant variance, and independence.
The specific research steps are as follows:
1.
Data standardization:
To avoid differences in the scale of the data, all raw data are standardized using the Z-score method. The formula for standardization is
Zij = (Xij − μj)/σj.
Among them, Zij is the standardized value of the j-th indicator for the i-th sample, Xij is the original value, and μj and σj are the mean and standard deviation of the j-th indicator, respectively.
2.
Model Fitting and Evaluation:
SPSS statistical 26.0 software is used to perform multiple linear regression analysis, and the ordinary least squares (OLS) method is employed to estimate the regression coefficients (βi). Additionally, the coefficient of determination (R2), adjusted coefficient of determination (Adjusted R2), F-statistic, and significance tests are used to evaluate the model’s fitting performance and explanatory power.
3.
Multicollinearity Test:
The variance inflation factor (VIF) is calculated to determine whether multicollinearity exists among the independent variables. When the VIF value is less than 10, this indicates no severe multicollinearity among the independent variables, and the analysis can proceed. If severe multicollinearity exists, relevant variables need to be removed, or principal component analysis (PCA) can be applied to reduce the dimensionality of the data.
4.
Residual Analysis and Model Validity Testing.
The regression residuals are tested for normality (Shapiro–Wilk test) and heteroscedasticity (White test or Breusch–Pagan test) to verify the robustness and validity of the model estimation results.

4. Results

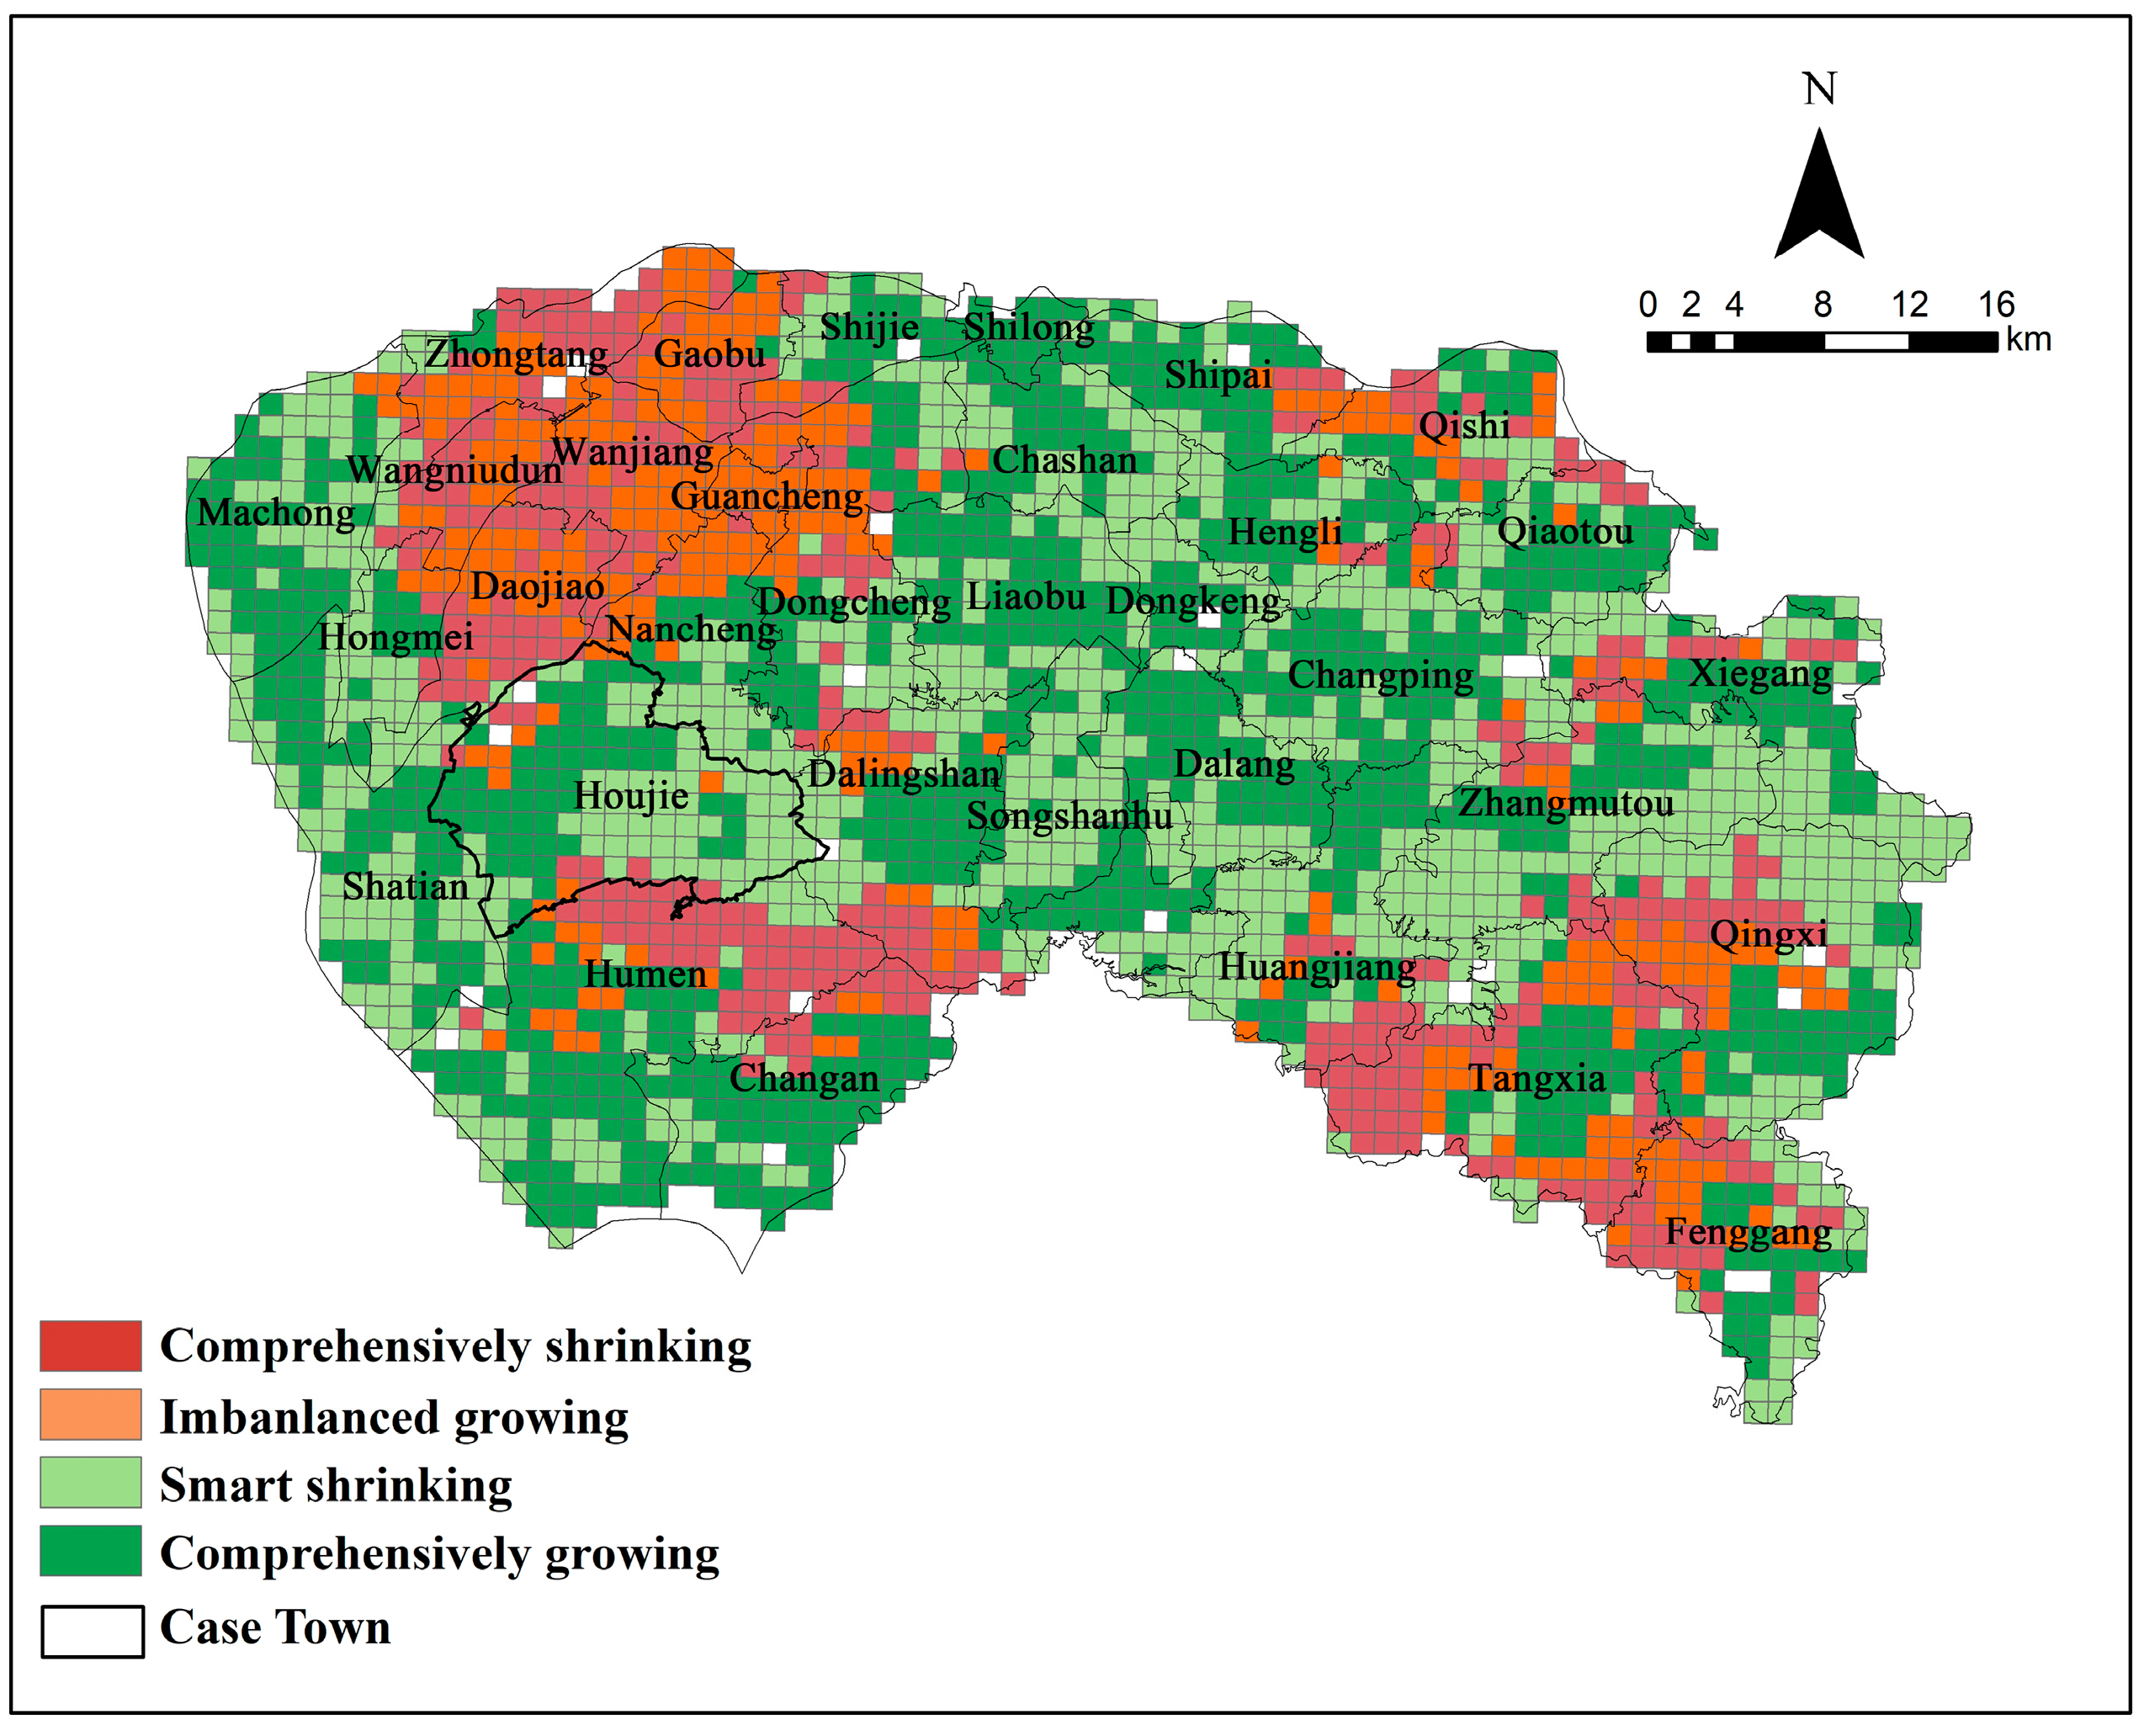
4.1. Spatial Patterns of Urban Growth and Shrinkage in Dongguan Across Different Periods

4.1.1. 2008–2014: Post-Financial Crisis Recovery

During 2008–2014, the perforated spatial differentiation characteristics in Dongguan City are very distinct. Areas represented by central urban areas such as Guancheng Sub-District and Wanjiang Sub-District, southwestern coastal areas such as Humen Town and Chang’an Town, and southeastern Shenzhen areas such as Tangxia Town, Fenggang Town, and Qingxi Town showed a relatively obvious overall contraction phenomenon. On the other hand, central and northern towns such as Shijie Town, Shilong Town, Liaobu Town, and some peripheral areas in the central urban area showed an overall growth trend. In addition, the eastern part of Houjie Town, the surrounding areas of Songshan Lake, and a few peripheral towns and streets showed smart contraction; that is, the population decreased, but the economy remained stable or grew slightly (Figure 4).

4.1.2. 2015–2019: Machines Replace Humans

During 2015–2019, the overall contraction trend in Dongguan City was significantly alleviated. This was especially reflected in the recovery of the central urban area and the southwestern and southeastern regions. This was mainly due to the optimization of the industrial structure brought about by the implementation of the “machines-replacing-people” policy and the development of high-tech industries, which promoted the coordinated growth of population and economy. At the same time, the situations of traditional industrial towns such as Chang’an Town and Houjie Town have improved, but due to the lagging transformation, there are some unbalanced growth areas. Outlying towns such as Shatin Town continue to maintain unbalanced growth or overall contraction. Huangjiang Town and some eastern towns and sub-districts show more characteristics of smart contraction (Figure 5).

4.1.3. 2020–2023: COVID-19 Pandemic and Recovery

Dongguan City once again showed obvious spatial differentiation and perforated characteristics during the period from 2020 to 2023. Compared with 2015 to 2019, the number of unbalanced growth areas in Dongguan City increased significantly during the period from 2020 to 2023, but the number of comprehensive growth areas decreased significantly, and the number of smart contraction areas decreased slightly. Many towns and sub-districts, including the Guancheng Sub-District, the Dongcheng Sub-District, Humen Town, Chang’an Town, Houjie Town, Liaobu Town, Dongkeng Town, and Changping Town, showed obvious comprehensive contraction or unbalanced growth. The main reason for this change in spatial pattern is the impact of the COVID-19 pandemic on the global industrial chain, which has severely affected many areas in Dongguan City that rely on export manufacturing, and in which both the population and economy have declined. Smart contraction during this period was mostly seen in Qingxi Town and Zhangmutou Town in the east, while comprehensive growth was mainly concentrated in Dalingshan Town, Tangxia Town, and small parts of other towns and sub-districts (Figure 6).
To sum up, based on the analysis of the temporal and spatial characteristics of growth and shrinkage in Dongguan City over the three phases, the results of this section verify the core viewpoint of H1, which is that Dongguan City will exhibit a perforated type of spatial shrinkage under external shocks and will also experience fluctuations at different phases. Empirical analysis shows that, as a typical manufacturing city, Dongguan witnessed significant shrinkage in its central urban area and manufacturing cluster area during the financial crisis period from 2008 to 2014, which confirmed the basic assumption that external shocks lead to perforated shrinkage. Furthermore, the spatial heterogeneity recovery that occurred from 2015 to 2019 verified the nonlinear characteristic that industrial transformation would reshape the shrinkage pattern, and the spatial differentiation pattern exhibited during the pandemic-related shock from 2020 to 2023 further strengthened the regulatory role of industrial innovation capabilities on the spatial differentiation of shrinkage. Overall, the urban development of Dongguan City has undergone a process of evolution from perforated shrinkage to structural recovery and then to another period of severe shrinkage. This clearly reflects the significant impact of external environmental changes and industrial transformation on the urban spatial pattern. Based on these findings, the following sub-section will focus on exploring the factors behind this growth and shrinkage pattern.

4.2. Factors Influencing Growth and Shrinkage in Dongguan

4.2.1. 2008–2014: Post-Financial-Crisis Recovery

During the recovery phase after the financial crisis from 2008 to 2014, the number of industrial enterprises and the area of industrial land in Dongguan had varying degrees of inhibitory effects on GDP growth. After the outbreak of the financial crisis, Dongguan’s economic structure, which originally relied on export-oriented and labor-intensive industries, suffered a huge impact. Orders from a large number of foreign trade enterprises sharply decreased or disappeared, causing the production scale of these enterprises to shrink rapidly or even close. At the same time, although there were a large number of enterprises in the early stage of the financial crisis, the sharp decline in international orders caused a serious decline in the production efficiency of enterprises, and many enterprises faced bankruptcy or production cuts and suspensions. In this case, the high number of enterprises did not bring about a positive economic effect but instead formed a negative economic phenomenon of “many enterprises but low efficiency”, which was statistically manifested as a negative relationship between the number of enterprises and GDP (Table 2).
During this period, the growth in Dongguan’s GDP was significantly positively affected by the advanced degree of industrial structure (β = 0.450, p < 0.01), town and street fiscal expenditure, the core density of industrial and commercial registered enterprises, the core density of medical facilities, and the core density of transportation facilities. The advanced degree of industrial structure has a significant positive effect, indicating that economic growth has a strong dependence on industrial transformation and upgrading. In the recovery stage after the financial crisis, the government introduced industrial support policies, such as encouraging enterprises to conduct research and innovation and promoting industrial technology upgrading, to guide the transformation of manufacturing to technology-intensive industries, thereby improving industrial added value and corporate competitiveness. The improvement in the advanced degree of industrial structure has promoted the growth in industrial added value and regional economic recovery, which is consistent with Dongguan’s industrial upgrading from labor-intensive to technology- and capital-intensive industries. The positive effect of town and sub-district disposable expenditure also reflects the positive guiding role of government fiscal investment in economic recovery and industrial transformation. On the one hand, by increasing infrastructure construction, enterprise subsidies, and public service investment, the regional business environment and enterprise survival ability have improved; on the other hand, these investments have increased the attractiveness of the city to the population and enterprises, thereby promoting the improvement of economic activity. In addition, the layout of urban public service facilities has a significant supporting role in the regional economy. The layout of medical and transportation facilities has not only improved the quality of life of residents but also enhanced the city’s attractiveness to high-quality talent. The increase in the density of industrial and commercial registered enterprises indicates that the business activity in the region has increased, the industrial agglomeration effect has been enhanced, and the economic recovery and growth have been effectively overseen.

4.2.2. 2015–2019: Machines Replace Humans

During the period from 2015 to 2019, the impact coefficient of the advanced level of industrial structure was the highest (β = 0.696), which mainly reflects the synergistic effect of the in-depth promotion of Dongguan’s industrial transformation and upgrading mechanism and the optimization of industrial spatial layout during this period. The positive impact of the number of enterprises with R&D departments and the number of people in the R&D departments of enterprises highlights the contribution of innovation-driven development to economic development. During this period, Dongguan fully implemented the “machines-replacing-people” strategy, and a large number of manufacturing enterprises achieved improved production efficiency and product-added value through automation and intelligent transformation, significantly promoting upgrading to high-end industrial structure. Improvements in the advanced industrial level mean that more funds and resources will be invested in technology-intensive industries, thereby achieving structural growth of the economy. During this period, the government clearly proposed to promote the transformation and upgrading of the manufacturing industry with an innovation-driven strategy, encouraging enterprises to set up R&D departments and increase R&D investment. The increase in enterprise R&D investment not only improved the market competitiveness of products but also promoted the innovation ability and production efficiency of enterprises, directly driving regional economic development (Table 3).
During this period, the built-up area of Dongguan City showed a negative relationship with GDP. The main reason for this was that the expansion of urban land failed to achieve efficient coordination with industrial economic development, resulting in inefficient land use and the hollowing out of industry. With the gradual withdrawal of low-end enterprises and the increase in the density of high-end manufacturing, some built-up areas have become idle or underutilized due to changes in spatial demand after industrial transformation, resulting in a mismatch between land expansion and economic growth. The positive effect of transportation facility layout on the economy also reflects the role of public service layout in promoting industrial upgrading and transformation.

4.2.3. 2020–2023: COVID-19 Pandemic and Recovery

During 2020–2023, due to the effects of the COVID-19 pandemic, Dongguan’s economic development faced severe challenges. Empirical results show that the advanced level of industrial structure showed a significant negative trend during this period (β = −0.765). This was mainly because 2020–2023 was the period of the global spread of the COVID-19 pandemic. Dongguan’s original industrial layout, which was transformed into high-end manufacturing and service industries, was severely impacted by the decline in international demand, supply chain disruptions, and increased international trade barriers. According to interviews with companies, high-end industries are closely linked to the international market and are highly dependent on overseas markets. The pandemic has had a significant impact on foreign trade, and high-end manufacturing and export-oriented industries are the hardest-hit by this impact. Therefore, the advanced industrial structure showed short-term fragility during the pandemic impact phase and became a negatively correlated factor (Table 4).
During this period, the number of people working in the R&D department of enterprises (β = 0.563) and the number of industrial enterprises (β = 0.071) played a key role in economic recovery, reflecting the importance of industrial stability and innovation-driven development. The positive impact of the core density of transportation facilities further shows that improvement in infrastructure is an important factor supporting economic recovery. During the epidemic stage, when enterprises have more R&D personnel, they can better improve their competitiveness through technological innovation, product development, and digital transformation, and they can actively reduce the production uncertainty risks brought by the impact of the epidemic. Therefore, the size of the R&D department of enterprises is positively correlated with the resilience of the regional economy. The positive correlation for the number of industrial enterprises reflects the resilience of Dongguan’s urban manufacturing industry. Although the epidemic has brought certain economic fluctuations, Dongguan has formed a stable manufacturing industry and supply chain system over the years. The ecological relationship of close cooperation between enterprises in the industrial chain has improved the regional economy’s resistance to shocks. The stable number of industrial enterprises is an important force to ensure the steady recovery of the economy. The increase in per capita disposable income directly reflects the consumption capacity of urban residents. During the epidemic control period, traffic control was implemented in many places in China and foreign countries. The construction of logistics networks and regional interconnection during this period improved the resilience of the supply chain and logistics efficiency, and it alleviated the impact of the epidemic on production and operation. Therefore, a complete layout of transportation infrastructure has become an important guarantee for economic recovery.

4.2.4. Horizontal Comparison of Factors Across Three Phases

By comparing the influencing factors of the three periods of 2008–2014, 2015–2019, and 2020–2023 (Table 5), we made the following findings: First, although the urban growth and shrinkage in different periods showed different specific manifestations and driving mechanisms, they all reflected that Dongguan’s urban industrial transformation and technological innovation have always been the core driving force of economic growth. Whether it was the recovery stage after the financial crisis in 2008–2014 or the machines-replacing-humans stage in 2015–2019, the advanced degree of industrial structure and corporate R&D investment have always shown a positive pulling effect, showing the continuous dependence of Dongguan’s industrial transformation and upgrading process on technological innovation and an advanced industrial structure. Although the advanced degree of industrial structure became negative in 2020–2023, corporate R&D investment was still significantly positively correlated, reflecting that in the process of industrial transformation, technological innovation has become the core supporting force for urban economic development and resilience maintenance.
Secondly, the effects of other influencing factors in the three stages also show obvious differences. The deep-seated reason for the above differences lies in the interaction between Dongguan’s urban industrial transformation and changes in the external environment. On the one hand, Dongguan is in different development backgrounds at different stages. During the financial crisis, the cliff-like decline in external demand led to a rapid contraction of industrial scale and population outflow, forming a structural contradiction in the early stage of economic recovery; during the “machines-replacing-humans” period, the city took the initiative to drive structural transformation through industrial upgrading and technological innovation, causing mismatches in spatial utilization and adjustment pains in the population employment structure in the short term; the epidemic stage exposed the industrial vulnerability brought about by the high dependence of the high-end industrial structure on the global market, which in turn caused pressure on economic structural adjustment. On the other hand, the government’s policy guidance and industrial layout for problems at different stages also have different focuses. From crisis response and industrial support to factors driving innovation, the dynamic changes in policy measures have further exacerbated the differences in performance in different periods. These have jointly shaped the significant phased differences in the growth and contraction mechanisms of Dongguan City and their dynamic transformation characteristics.
Finally, through horizontal comparison, it is found that the growth and contraction mechanism of Dongguan’s towns in different periods shows obvious dynamic adaptation characteristics: from passive contraction and recovery during the financial crisis, to active industrial structure transformation and upgrading during the “machines-replacing-humans” period, and then to the short-term setback to the industrial structure during the COVID-19 epidemic; however, the overall innovation resilience has increased. Behind this dynamic change lies the government’s continuous promotion of industrial structure transformation and upgrading through policy guidance and resource allocation optimization, gradually building an urban resilience system with technological innovation as the core driving force. It also reflects the complex mechanism of urban transformation and development under the interaction of external shocks and policy responses.
Obviously, through the analysis of the factors driving urban growth and shrinkage in Dongguan across three phases, this section verifies the dynamic heterogeneity hypothesis (H2) regarding the correlation between industrial upgrading, innovation investment, and urban growth, and it reveals the environment-dependent characteristic of this relationship. Empirical results show that during the post-financial crisis recovery period (2008–2014), industrial structure sophistication (β = 0.450) was positively correlated with economic growth, while the expansion of low-end industries was negatively correlated, indicating that the benefits of transformation depend on phasing out outdated capacities. In the proactive transformation period (2015–2019), the correlation between industrial upgrading (β = 0.696) and innovation input was strong, suggesting that a policy-driven industrial transformation strategy can significantly boost overall economic development. However, mismatches between land expansion and industrial demand also exposed spatial contradictions during this transition. In the pandemic shock period (2020–2023), the high external dependency of advanced industries led to a negative correlation for industrial sophistication (β = −0.765), demonstrating that industrial upgrading does not always correlate positively with economic growth. In this context, local innovation capacity (β = 0.563) and the resilience of the industrial chain became critical stabilizing factors. This nonlinear feature of the “upgrading–growth” relationship indicates that the benefits of industrial upgrading are subject to an environmental threshold—when external shocks exceed the buffering capacity of the regional innovation system, the traditional patterns and directions of influence may shift.

4.3. Dynamic Coupling Mechanisms of Urban Growth and Shrinkage in Houjie Town

Houjie Town has undergone three distinct phases: the global financial crisis (2008–2014), industrial restructuring (2015–2018), and the short-term impact of the COVID-19 pandemic (2019–2023). Throughout these phases, the town established a dynamic mechanism centered on policy support, spatial adaptation, and enterprise transformation, evolving from passive relief to active innovation and ultimately to resilient adaptation.

4.3.1. Policy Support: From Fiscal Relief to Innovation Incentives and Order-Driven Strategies

During the 2008 financial crisis, plummeting international orders prompted Houjie to implement the “Double-Up Plan,” stabilizing enterprises through fiscal subsidies, cross-border RMB trade settlements, and integrated logistics and bonded warehouses. During the phase of machines replacing humans, Houjie insisted on innovative techniques and introduced the Innovation-Driven Transformation Development Fund, incentivizing companies like DeRUCCI to establish smart factories aligned with Industry 4.0 standards, which significantly enhanced the innovation drive of enterprises and increased the technological intensity and competitiveness of industries. During the COVID-19 pandemic, measures were introduced like deferred payments without halting operations, the “no suspension of water, electricity, or social security” order to alleviate the pressure on enterprises, and actively supporting businesses to participate in domestic and international trade fairs. Furthermore, “Six Stabilities and Six Safeguards” policies were adopted to stabilize market orders through exhibition-driven economies. These policies evolved from relief to innovation and order-driven resilience, forming a dynamic governmental response framework.

4.3.2. Spatial Adaptation: From Extensive Expansion to Intensive Renewal and Job–Housing Balance

Houjie’s spatial planning shifted significantly across phases. During the financial crisis, industrial land expansion took a predominant role in the town. During this period, the spatial distribution of industries leveraged the existing industrial foundation to promote high-scale and intensive development. Characteristic industries were developed in each region to strengthen the clustering effect of regional industries. During the machines-replacing-humans period, the town prioritized high-tech industries, corporate headquarters, and R&D–education integration, integrating industrial development with scientific research and vocational education in an organic manner and creating a model zone for innovation. In the post-pandemic period, by introducing TOD (transit-oriented development) zones, blending affordable housing, ecological spaces, and mixed-use areas, the planning of Houjie Town further incorporates affordable housing and ecological spaces to achieve job–housing balance. This transition demonstrated Houjie’s transition from economic-centric to multifunctional spatial strategies, significantly enhancing urban resilience.

4.3.3. Enterprise Transformation: From Emergency Response to Smart Upgrading and Flexible Adaptation

Enterprises initially relied on government relief during the financial crisis, shifting to domestic markets and branding to reduce export dependency. Subsequently, some enterprises have enhanced their market competitiveness and adapted to new market demands through technological innovation and improved product quality. Simultaneously, they have adjusted their market strategies to explore domestic markets, reducing their reliance on exports. Entering the phase of replacing human labor with machines, companies have successively invested in transforming and upgrading intelligent production. Represented by the DeRUCCI Group, they have established smart factories based on Germany’s Industry 4.0 standards. By relying on automation and thoughtful production, they have reduced dependence on labor and achieved significant improvements in production efficiency and product competitiveness through technological innovation. During the COVID-19 pandemic, enterprises further transformed and adapted by shifting to order-driven production, strengthening local supply chains, and enhancing their adaptability to the domestic sales market. For example, the footwear industry leveraged live-stream e-commerce, while Nanxing Equipment optimized production based on real-time orders. This has led to the establishment of a hierarchical progression mechanism within enterprises for emergency response, technological upgrading, and market-driven initiatives, which effectively strengthened corporate resilience against external shocks.
In summary, Houjie Town transitioned from fragmented responses to a dynamic resilience mechanism through policy support, spatial adaptation, and enterprise transformation. Therefore, a resilience transition has been achieved, moving from passive relief to active innovation and then to resilient adaptation. This evolution reflects deep interactions among local governments, markets, and enterprises.

5. Discussion

5.1. Realistic Reasons for Phased Differences in Urban Growth and Shrinkage in Dongguan City

The spatial and temporal characteristics and factors of urban growth and shrinkage in Dongguan differ significantly across the three phases, and the underlying realistic reasons lie primarily in the dynamic interactions among industrial development, external environments, and government policies. On the one hand, Dongguan’s development background was different at various phases. During the financial crisis, the sharp decline in external demand led to a rapid shrinkage in industrial scale and a large outflow of the labor force, resulting in significant urban shrinkage in the early recovery period. In the machines-replacing-humans period, the city proactively promoted industrial upgrading and technological innovation to drive industrial structural transformation. This, however, caused short-term mismatches in spatial utilization and structural adjustments in employment, yet the overall development trend remained positive. During the pandemic phase, the vulnerability of an advanced industrial structure highly dependent on global markets was exposed, creating new pressures for economic restructuring. On the other hand, government policy guidance and industrial planning varied in focus across phases, ranging from crisis response and industrial support to innovation-driven development. This dynamic adjustment of policy measures further contributed to the distinct performance in different periods. These factors together shaped the pronounced phased differences and the evolving transformation characteristics of Dongguan’s urban growth and shrinkage mechanisms. Overall, the combined impacts of industrial transformation in manufacturing, shifts in external environments, and adaptive policy adjustments provide valuable insights for future policy formulation.

5.2. Shortcomings in Houjie Town’s Response Mechanisms

Although Houjie Town has developed dynamic resilience response measures, data analysis and field investigations reveal that there are remaining shortcomings in its mechanisms that need to be addressed and improved. Through on-site visits and interviews with citizens, it was found that the current training model in Houjie Town is relatively monotonous, mainly relying on the mentor-teaching-student system within enterprises. There is a lack of systematic and large-scale vocational training due to high costs and operational expenses. First, many high-skilled talented individuals expect their salaries and employment conditions to be in line with the actual situation of the positions, but this is not the case, resulting in a severe shortage of high-skilled workers needed for industrial upgrading, which has become an important factor restricting the transformation of the town.
Second, there is a contradiction between the innovation strategy and insufficient R&D investment. Although the Houjie Town government has clearly articulated a plan to encourage industrial innovation and transformation, recent fiscal constraints and market volatility have led to insufficient government exceptional fund support. As a result, enterprises have slowed down their investment in research and development, often settling for meeting only current market demands. This situation may weaken the industry’s independent innovation capabilities and market competitiveness, thus further constraining regional industrial transformation and upgrading.
Third, there are gaps between constructing public service facilities and residents’ life demands. Although Houjie Town emphasizes construction for ecological corridors and quality public services, the progress made in the construction of public service facilities has been slow, resulting in a significant gap between the growing residential population and the increasing demand for public services. On education, interviews have revealed that public school placements are still insufficient to meet the needs of all employees’ children. Some citizens believe that the number of educational places provided by enterprises is less than what they expect and what they have experienced in their daily lives. Therefore, the supply of public educational places still needs to be further improved.

5.3. Recommendations for Optimizing Response Mechanisms for Urban Growth and Shrinkage

5.3.1. Optimize Labor Structure and Strengthen Worker Support

To address the contradiction between industrial transformation, upgrading, and the shortage of skilled workers, Houjie Town should establish a government–enterprise collaborative talent cultivation mechanism. Implementing targeted vocational training can precisely meet the demands of high-end manufacturing and intelligent industries. First, the town should leverage vocational institutions in Dongguan and leading enterprises to jointly invest in building specialized training bases, adopting an integration mode bet-ween industry and education for talent cultivation. Second, efforts should be intensified to attract skilled workers by introducing flexible talent recruitment policies, increasing subsidies for talent acquisition, and improving the security system for highly experienced personnel. Third, the town should enhance the appeal to highly qualified workers through supporting housing, education, and healthcare measures, thereby resolving the mismatch between talent supply and demand [79].

5.3.2. Increase R&D Investment and Create New Incentive Mechanisms

To address the issue of insufficient enterprise R&D investment, it is recommended that Houjie Town further refine its government funding incentive model. The town could explore establishing a town-level science and technology financial platform to leverage social capital for participation in technological innovation, thereby accelerating enterprises’ enthusiasm for independent R&D and encouraging them to go beyond merely meeting market demands in their innovative efforts [80]. Additionally, the town should promote strategic partnerships between leading local enterprises and research institutions to facilitate technology transfer and form an industry cluster for research outcomes. This will ensure that the achievements of research institutions are directly integrated into production lines, gradually enhancing enterprises’ acceptance and utilization of these outcomes.

5.3.3. Accelerate Construction of Public Services and Enhance Comprehensive Service Capacity

In response to the mismatch between residents’ living needs and the construction of public service facilities, Houjie Town needs to accelerate the provision of high-quality public services. On one hand, it should prioritize implementing public service projects guided by the needs of grid-based communities, such as improving community healthcare and schools [81]. On the other hand, leveraging existing plans, the town should expedite the development of TOD stations, optimize the layout of transportation facilities, and create demonstration areas centered around rail stations that balance jobs and housing. This will enhance residents’ sense of gain and happiness, achieving coordinated development of urban employment, housing, and service facilities.

6. Conclusions

This paper examines the spatial and temporal characteristics and mechanisms of urban growth and shrinkage in Dongguan City from 2008 to 2023 through quantitative empirical analysis using multi-dimensional data and micro-level qualitative analysis. The study findings are as follows: (1) Dongguan City has experienced a temporal pattern of passive shrinkage following the impact of the financial crisis, structural recovery driven by the machines-replacing-humans policy, and another shrinkage due to the impact of the COVID-19 pandemic, demonstrating distinct stage characteristics and regional differences. (2) Whether during the recovery period after the financial crisis or during the machines-replacing-humans phase and the pandemic period, industrial structure upgrading and technological innovation have always been the core driving forces for supporting the economic recovery and enhancing the resilience of cities. However, the specific effects and directions of these factors may vary due to differences in external environments and policy orientations. (3) At the micro-qualitative analysis level, the case of Houjie Town further verified the dynamic adaptive path formed by the local government through policy support, spatial adaptation, and enterprise transformation. (3) At the micro-qualitative analysis level, the case of Houjie Town further verified the dynamic adaptive path formed by the local government through policy support, spatial adaptation, and enterprise transformation. For other manufacturing cities that are currently undergoing industrial transformation, the experience of Dongguan indicates that continuously promoting technological innovation, upgrading the level of the industrial structure to a higher level, and improving the dynamic development path of local growth and shrinkage are the key to enhancing the city’s ability to cope with complex shocks and achieving sustainable development.
Although this study has preliminarily explored the spatial and temporal characteristics and factors of growth and shrinkage in Dongguan City, there are still certain limitations to this research; the intrinsic interactions between various factors and the growth and shrinkage of towns still requires further in-depth analysis through higher-order models to better identify the interactions and nonlinear effects between variables. Furthermore, this study selected a typical town for qualitative and quantitative analysis. In the future, multi-point comparative studies should be conducted among towns with different development phases, different functional positioning, and different industrial foundations to enrich the understanding of the diversified growth and shrinkage mechanisms of manufacturing cities. Based on these, subsequent research can be expanded in two aspects: the indicator system and analysis methods can be further improved and combined with multi-level regression or spatial effect models, to more comprehensively reveal the influence mechanism of driving factors on urban growth and shrinkage. It is also necessary to deepen the comparative research and follow-up investigations among typical towns; explore diverse paths for the industrial upgrading, population mobility, and spatial adaptation of manufacturing cities under different circumstances; and provide more scientific empirical support for promoting the high-quality development and resilience enhancement of such cities.

Author Contributions

Conceptualization, T.C. and W.L.; methodology, Z.W.; software, Z.W.; validation, T.C. and W.L.; formal analysis, T.C. and Z.W.; investigation, T.C.; resources, T.C.; data curation, Z.W. and W.L.; writing—original draft preparation, T.C. and Z.W.; writing—review and editing, T.C., Z.W. and W.L.; visualization, Z.W.; supervision, W.L.; project administration, W.L.; funding acquisition, T.C. All authors have read and agreed to the published version of the manuscript.

Funding

This research was funded by the National Science Foundation of China, grant number 42471216, and the APC was funded by Sun Yat-sen University.

Data Availability Statement

The original contributions presented in the study are included in the article; further inquiries can be directed to the corresponding author.

Acknowledgments

The authors appreciate the editors’ and anonymous reviewers’ comments and suggestions.

Conflicts of Interest

The authors declare no conflicts of interest. The funders had no role in the design of the study, in the collection, analysis, or interpretation of data, in the writing of the manuscript, or in the decision to publish the results.

Abbreviations

The following abbreviations are used in this manuscript:
MLRMultiple linear regression model
OLSOrdinary least squares
VIFVariance inflation factor
PCAPrincipal component analysis

References

  1. Kärrholm, M.; Nylund, K.; de la Fuente, P.P. Spatial resilience and urban planning: Addressing the interdependence of urban retail areas. Cities 2014, 36, 121–130. [Google Scholar] [CrossRef]
  2. Du, Z.; Zhang, H.; Huang, G.; Jin, L. Local state responses to crisis-induced shrinkage in the world’s factory Dongguan, China: Regional resilience perspective. J. Urban Plan. Dev. 2021, 147, 5021021. [Google Scholar] [CrossRef]
  3. Martinez-Fernandez, C.; Weyman, T.; Fol, S.; Audirac, I.; Cunningham-Sabot, E.; Wiechmann, T.; Yahagi, H. Shrinking cities in Australia, Japan, Europe and the USA: From a global process to local policy responses. Prog. Plan. 2016, 105, 1–48. [Google Scholar] [CrossRef]
  4. Xu, Z.; Chang, J.; Wang, Z.; Li, Z.; Liu, X.; Chen, Y.; Wei, Z.; Sun, J. Regional Urban Shrinkage Can Enhance Ecosystem Services—Evidence from China’s Rust Belt. Remote Sens. 2024, 16, 3040. [Google Scholar] [CrossRef]
  5. Chen, T.; Hui, E.C.M.; Tu, Y.; Lang, W. Growth or Shrinkage: Discovering Development Patterns and Planning Strategies for Cross-Border Areas in China. J. Urban Plan. Dev. 2021, 147, 05021046. [Google Scholar] [CrossRef]
  6. Long, Y.; Wu, K. Shrinking cities in a rapidly urbanizing China. Environ. Plan. A Econ. Space 2016, 48, 220–222. [Google Scholar] [CrossRef]
  7. He, S.Y.; Lee, J.; Zhou, T.; Wu, D. Shrinking cities and resource-based economy: The economic restructuring in China’s mining cities. Cities 2017, 60, 75–83. [Google Scholar] [CrossRef]
  8. Li, H.; Mykhnenko, V. Urban shrinkage with Chinese characteristics. Geogr. J. 2018, 184, 398–412. [Google Scholar] [CrossRef]
  9. Batunova, E.; Perucca, G. Population shrinkage and economic growth in Russian regions 1998–2012. Reg. Sci. Policy Pract. 2020, 12, 595–610. [Google Scholar] [CrossRef]
  10. Eraydin, A.; Özatağan, G. Pathways to a resilient future: A review of policy agendas and governance practices in shrinking cities. Cities 2021, 115, 103226. [Google Scholar] [CrossRef]
  11. Jin, Y.; Zhou, G.; Sun, H.; Fu, H.; Wu, H.; Liu, Y. Regrowth or smart decline? A policy response to shrinking cities based on a resilience perspective. Sustain. Cities Soc. 2024, 108, 105431. [Google Scholar] [CrossRef]
  12. Karp, D.N.; Bagchi-Sen, S.; Rogerson, P. Not all shrinking places are similar: The variegated nature of population decline in the United States. Appl. Geogr. 2022, 138, 102581. [Google Scholar] [CrossRef]
  13. Derudder, B.; Cao, Z.; Liu, X.; Shen, W.; Dai, L.; Zhang, W.; Caset, F.; Witlox, F.; Taylor, P.J. Changing Connectivities of Chinese Cities in the World City Network, 2010–2016. Chin. Geogr. Sci. 2018, 28, 183–201. [Google Scholar] [CrossRef]
  14. Raźniak, P.; Dorocki, S.; Winiarczyk-Raźniak, A. Permanence of economic potential of cities based on sector development. Chin. Geogr. Sci. 2017, 27, 123–136. [Google Scholar] [CrossRef]
  15. Du, Z.; Jin, L.; Ye, Y.; Zhang, H. Characteristics and influences of urban shrinkage in the exo-urbanization area of the Pearl River Delta, China. Cities 2020, 103, 102767. [Google Scholar] [CrossRef]
  16. Häußermann, H.; Siebel, W. Die schrumpfende Stadt und die Stadtsoziologie. Soziologische Stadtforschung 1988, 29, 78–94. [Google Scholar]
  17. Hollander, J.B.; Pallagst, K.; Schwarz, T.; Popper, F.J. Planning shrinking cities. Prog. Plan. 2009, 72, 223–232. [Google Scholar]
  18. Martinez Fernandez, C.; Audirac, I.; Fol, S.; Cunningham Sabot, E. Shrinking cities: Urban challenges of globalization. Int. J. Urban Reg. Res. 2012, 36, 213–225. [Google Scholar] [CrossRef] [PubMed]
  19. Wiechmann, T.; Bontje, M. Responding to Tough Times: Policy and Planning Strategies in Shrinking Cities; Taylor & Francis: London, UK, 2015; Volume 23, pp. 1–11. [Google Scholar]
  20. Kim, Y.E.; Lee, J.S.; Kim, S. Proposing the classification matrix for growing and shrinking cities: A case study of 228 districts in South Korea. Habitat. Int. 2022, 127, 102644. [Google Scholar] [CrossRef]
  21. Chen, X.; Lang, W.; Yuan, Y.; Yan, G.; Hou, X. Conceptualizing the nexus between spatiotemporal shrinkage patterns of natural cities and driving mechanisms: Insights into urban shrinkage in Northeast China. Cities 2024, 152, 105179. [Google Scholar] [CrossRef]
  22. Wiechmann, T.; Pallagst, K.M. Urban shrinkage in Germany and the USA: A Comparison of Transformation Patterns and Local Strategies. Int. J. Urban Reg. Res. 2012, 36, 261–280. [Google Scholar] [CrossRef] [PubMed]
  23. Haase, A.; Bernt, M.; Großmann, K.; Mykhnenko, V.; Rink, D. Varieties of shrinkage in European cities. Eur. Urban Reg. Stud. 2016, 23, 86–102. [Google Scholar] [CrossRef]
  24. Mallach, A.; Haase, A.; Hattori, K. The shrinking city in comparative perspective: Contrasting dynamics and responses to urban shrinkage. Cities 2017, 69, 102–108. [Google Scholar] [CrossRef]
  25. Newman, G.; Hollander, J.B.; Lee, J.; Gu, D.; Kim, B.; Lee, R.J.; Horney, J.A.; Bearfield, D.; Li, Y. Smarter shrinkage: A neighborhood-scaled rightsizing strategy based on land use dynamics. J. Geovis. Spat. Anal. 2018, 2, 11. [Google Scholar] [CrossRef]
  26. Wolff, M.; Wiechmann, T. Urban growth and decline: Europe’s shrinking cities in a comparative perspective 1990–2010. Eur. Urban Reg. Stud. 2018, 25, 122–139. [Google Scholar] [CrossRef]
  27. Hattori, K.; Kaido, K.; Matsuyuki, M. The development of urban shrinkage discourse and policy response in Japan. Cities 2017, 69, 124–132. [Google Scholar] [CrossRef]
  28. Turok, I.; Mykhnenko, V. Resurgent European cities? Urban Res. Pract. 2008, 1, 54–77. [Google Scholar] [CrossRef]
  29. Miljanović, D.; Vuksanović-Macura, Z.; Doljak, D. Rethinking the spatial transformation of postsocialist cities: Shrinking, sprawling or densifying. Cities 2023, 140, 104443. [Google Scholar] [CrossRef]
  30. Chen, T.; Li, X. Cross-Boundary Cooperation and Changes in the Roles of Governments at Different Levels in China: A Case Study of the Guangzhou-Foshan Metropolitan Area. China City Plan. Rev. 2023, 187, 73–83. [Google Scholar] [CrossRef]
  31. Deng, T.; Wang, D.; Yang, Y.; Yang, H. Shrinking cities in growing China: Did high speed rail further aggravate urban shrinkage? Cities 2019, 86, 210–219. [Google Scholar] [CrossRef]
  32. Wang, T.; Wu, K.; Yao, C.; Liu, X. Complex Pathways to Population Shrinkage: Case Study of Hegang City, China. Chin. Geogr. Sci. 2022, 32, 418–437. [Google Scholar] [CrossRef]
  33. Li, X.; Hui, E.C.; Lang, W.; Zheng, S.; Qin, X. Transition from factor-driven to innovation-driven urbanization in China: A study of manufacturing industry automation in Dongguan City. China Econ. Rev. 2020, 59, 101382. [Google Scholar] [CrossRef]
  34. Salvati, L.; Zambon, I. The (metropolitan) city revisited: Long-term population trends and urbanization patterns in Europe, 1950–2000. Popul. Rev. 2019, 58, 145–171. [Google Scholar] [CrossRef]
  35. Salvati, L. Exploring long-term urban cycles with multivariate time-series analysis. Environ. Plan. B Urban Anal. City Sci. 2022, 49, 1212–1227. [Google Scholar] [CrossRef]
  36. Hartt, M. The diversity of North American shrinking cities. Urban Stud. 2018, 55, 2946–2959. [Google Scholar] [CrossRef]
  37. Hassink, R. Regional resilience: A promising concept to explain differences in regional economic adaptability? Camb. J. Reg. Econ. Soc. 2010, 3, 45–58. [Google Scholar] [CrossRef]
  38. Simmie, J.; Martin, R. The economic resilience of regions: Towards an evolutionary approach. Camb. J. Reg. Econ. Soc. 2010, 3, 27–43. [Google Scholar] [CrossRef]
  39. Wang, J.; Yang, Z.; Qian, X. Driving factors of urban shrinkage: Examining the role of local industrial diversity. Cities 2020, 99, 102646. [Google Scholar] [CrossRef]
  40. Yang, W. Pro-growth urban policy implementation vs urban shrinkage: How do actors shift policy implementation in shrinking cities in China? Cities 2023, 134, 104157. [Google Scholar] [CrossRef]
  41. Cao, N.; Wen, Y.; Wang, J.; Gao, X.; Sun, P. Identifying shrinking cities from a physical city perspective and influencing factors: A case study of the Chengdu-Chongqing economic circle in China. Appl. Geogr. 2024, 168, 103314. [Google Scholar] [CrossRef]
  42. Li, W.; Long, Y. Smart technologies for fighting against pandemics: Observations from China during COVID-19. Trans. Urban Data Sci. Technol. 2022, 1, 105–120. [Google Scholar] [CrossRef]
  43. Hartt, M.; Bagchi-Sen, S.; Hollander, J.B. The post-pandemic future of shrinking cities. Town Plan. Rev. 2021, 92, 403–409. [Google Scholar] [CrossRef]
  44. Zhang, J.; Yao, M.; Cenci, J. Rethinking Urban Decline in Post-COVID19: Bibliometric Analysis and Countermeasures. Buildings 2023, 13, 2009. [Google Scholar] [CrossRef]
  45. OECD. A Systemic Resilience Approach to Dealing with COVID-19 and Future Shocks. OECD Policy Responses to Coronavirus (COVID-19); OECD Publishing: Paris, France, 2020. [Google Scholar]
  46. Hu, X.; Li, L.; Dong, K. What matters for regional economic resilience amid COVID-19? Evidence from cities in Northeast China. Cities 2022, 120, 103440. [Google Scholar] [CrossRef] [PubMed]
  47. Lin, Q.; Zhao, S.; Gao, D.; Lou, Y.; Yang, S.; Musa, S.S.; Wang, M.H.; Cai, Y.; Wang, W.; Yang, L. A conceptual model for the coronavirus disease 2019 (COVID-19) outbreak in Wuhan, China with individual reaction and governmental action. Int. J. Infect. Dis. 2020, 93, 211–216. [Google Scholar] [CrossRef]
  48. Wand, Y.; Diabakange Batatana, M.L.; Bikoumou Gambat, M.H. Public perceptions of government policies to COVID-19: A comparative study in six African countries. Heliyon 2024, 10, e24888. [Google Scholar] [CrossRef] [PubMed]
  49. Wei, Z.; Xie, R.; Tang, Q.; Chan, E.H.W.; Chen, Y.; Xiao, L.; Chen, T. Planning Strategies for Promoting Spatial Accessibility of Healthcare Facilities in Shrinking Cities: A Case Study of Lufeng in China. J. Urban Plan. Dev. 2024, 150, 5024002. [Google Scholar] [CrossRef]
  50. Wang, H.; Xu, K. How city shrinkage affect public service provision for disadvantaged groups? Evidence from China. World Dev. 2025, 186, 106823. [Google Scholar] [CrossRef]
  51. Bontje, M. Facing the challenge of shrinking cities in East Germany: The case of Leipzig. GeoJournal 2004, 61, 13–21. [Google Scholar] [CrossRef]
  52. Großmann, K.; Bontje, M.; Haase, A.; Mykhnenko, V. Shrinking cities: Notes for the further research agenda. Cities 2013, 35, 221–225. [Google Scholar] [CrossRef]
  53. Sun, J.; Zhou, T. Urban shrinkage and eco-efficiency: The mediating effects of industry, innovation and land-use. Environ. Impact Asses. 2023, 98, 106921. [Google Scholar] [CrossRef]
  54. Xie, M.; Feng, Z.; Song, Y.; Guan, H.; Wang, S. How Does Urban Shrinkage Affect Land Use Efficiency? A Case Study of Shrinking Cities in Northeast China. Chin. Geogr. Sci. 2024, 34, 34–51. [Google Scholar] [CrossRef]
  55. Yang, J.; Huang, X. The 30 m Annual Land Cover Datasets and Its Dynamics in China from 1985 to 2023. Zenodo, 2024. Available online: https://zenodo.org/records/12779975 (accessed on 15 March 2025).
  56. Li, R.; Dong, L.; Zhang, J.; Wang, X.; Wang, W.; Di, Z.; Stanley, H.E. Simple spatial scaling rules behind complex cities. Nat. Commun. 2017, 8, 1841. [Google Scholar] [CrossRef] [PubMed]
  57. Yeh, C.; Perez, A.; Driscoll, A.; Azzari, G.; Tang, Z.; Lobell, D.; Ermon, S.; Burke, M. Using publicly available satellite imagery and deep learning to understand economic well-being in Africa. Nat. Commun. 2020, 11, 2583. [Google Scholar] [CrossRef] [PubMed]
  58. Li, X.; Xu, H.; Chen, X.; Li, C. Potential of NPP-VIIRS nighttime light imagery for modeling the regional economy of China. Remote Sens. 2013, 5, 3057–3081. [Google Scholar] [CrossRef]
  59. Shi, K.; Huang, C.; Yu, B.; Yin, B.; Huang, Y.; Wu, J. Evaluation of NPP-VIIRS night-time light composite data for extracting built-up urban areas. Remote Sens. Lett. 2014, 5, 358–366. [Google Scholar] [CrossRef]
  60. Ma, T.; Zhou, C.; Pei, T.; Haynie, S.; Fan, J. Responses of Suomi-NPP VIIRS-derived nighttime lights to socioeconomic activity in China’s cities. Remote Sens. Lett. 2014, 5, 165–174. [Google Scholar] [CrossRef]
  61. Wang, Q.; Xin, Z.; Niu, F. Analysis of the Spatio-Temporal Patterns of Shrinking Cities in China: Evidence from Nighttime Light. Land 2022, 11, 871. [Google Scholar] [CrossRef]
  62. Wu, Y.; Shi, K.; Chen, Z.; Liu, S.; Chang, Z. An Improved Time-Series DMSP-OLS-like Data (1992–2023) in China by Integrating DMSP-OLS and SNPP-VIIRS; Harvard Dataverse, V5: 2021. Available online: https://dataverse.harvard.edu/dataset.xhtml?persistentId=doi:10.7910/DVN/GIYGJU (accessed on 15 March 2025).
  63. Chen, L.; Wang, X.; Hao, Y.; Yin, J.; Chen, D. Population agglomeration, borrowed size and urban economic growth in China. Cities 2024, 155, 105491. [Google Scholar] [CrossRef]
  64. Zhao, X. The influence of knowledge-intensive service industry agglomeration in the Yangtze River Delta urban agglomeration on regional economy. Heliyon 2024, 10, e25095. [Google Scholar] [CrossRef] [PubMed]
  65. Zheng, Y.; Lin, C.; Yan, J.; Guo, Y. How to enhance the innovation capacity of technology-based enterprises: A fuzzy set qualitative comparative analysis. Int. Rev. Econ. Financ. 2025, 97, 103817. [Google Scholar] [CrossRef]
  66. Zhao, Y.; Li, J.; Liu, K.; Shang, C. Impact of urban-rural development and its industrial elements on regional economic growth: An analysis based on provincial panel data in China. Heliyon 2024, 10, e36221. [Google Scholar] [CrossRef] [PubMed]
  67. Guo, K.; Huang, C.; Zhang, Z.; Diaz Paiz, A.Y.; Chen, W. The impact of new energy industry on environmental and economic benefits: Evidence from China. Energy 2024, 304, 132111. [Google Scholar] [CrossRef]
  68. Chen, Q.; Guan, X.; Huan, T. The spatial agglomeration productivity premium of hotel and catering enterprises. Cities 2021, 112, 103113. [Google Scholar] [CrossRef]
  69. Wei, W.; Zhang, W.; Wen, J.; Wang, J. TFP growth in Chinese cities: The role of factor-intensity and industrial agglomeration. Econ. Model. 2020, 91, 534–549. [Google Scholar] [CrossRef]
  70. Huang, D.; Xu, G.; Li, C.; Yang, S. Effects of high-tech industrial agglomeration and innovation on regional economic development in China: Evidence from spatial-temporal analysis and Spatial Durbin Model. Econ. Anal. Policy 2025, 86, 692–712. [Google Scholar] [CrossRef]
  71. Fisher, B.; Wit, L.A.D.; Ricketts, T.H. Integrating Economics into Research on Natural Capital and Human Health. Rev. Environ. Econ. Policy 2021, 15, 95–114. [Google Scholar] [CrossRef]
  72. Odhengo, P.; Lutta, A.I.; Osano, P.; Opiyo, R. Urban green spaces in rapidly urbanizing cities: A socio-economic valuation of Nairobi City, Kenya. Cities 2024, 155, 105430. [Google Scholar] [CrossRef]
  73. Yan, X.; He, S. Healthcare in cumulatively caused migration: Hong Kong residents’ perceived Mainland healthcare quality and migration intentions in the Greater Bay Area, China. Habitat. Int. 2023, 136, 102828. [Google Scholar] [CrossRef]
  74. Liu, J.; Li, J. Educational equity, inclusive finance, and sustainable economic growth. Financ. Res. Lett. 2025, 77, 106966. [Google Scholar] [CrossRef]
  75. Wang, M.; Lei, G.; Gao, Y. Study on the change of urban spatial structure in Three Northeast Provinces of China based on the coupling relationship between POI and nighttime light data. Adv. Space Res. 2024, 74, 4543–4560. [Google Scholar] [CrossRef]
  76. Kong, W.; Shen, W.; Yu, C.; Niu, L.; Zhou, H.; Zhang, Z.; Guo, S. The neglected cost: Ecosystem services loss due to urban expansion in China from a triple-coupling perspective. Environ. Impact Asses. 2025, 112, 107827. [Google Scholar] [CrossRef]
  77. Estoque, R.C.; Ooba, M.; Togawa, T.; Hijioka, Y.; Murayama, Y. Monitoring global land-use efficiency in the context of the UN 2030 Agenda for Sustainable Development. Habitat. Int. 2021, 115, 102403. [Google Scholar] [CrossRef]
  78. Kong, W.; Huang, J.; Niu, L.; Chen, S.; Zhou, J.; Zhang, Z.; Guo, S. Innovative framework for identification and spatiotemporal dynamics analysis of industrial land at parcel scale with multidimensional attributes. Cities 2025, 162, 105958. [Google Scholar] [CrossRef]
  79. Nelle, A.B. Tackling human capital loss in shrinking cities: Urban development and secondary school improvement in Eastern Germany. Eur. Plan. Stud. 2016, 24, 865–883. [Google Scholar] [CrossRef]
  80. Bartholomae, F.; Woon Nam, C.; Schoenberg, A. Urban shrinkage and resurgence in Germany. Urban Stud. 2017, 54, 2701–2718. [Google Scholar] [CrossRef]
  81. Kim, S. Design strategies to respond to the challenges of shrinking city. J. Urban Des. 2019, 24, 49–64. [Google Scholar] [CrossRef]
Figure 1. The location of Dongguan City in China and a map of Dongguan City. Note: this map of China is based on the standard map No. GS (2019)1686 from the Ministry of Natural Resources’ standard map service website, and the boundaries of the base map have not been modified.
Land 14 01507 g001
Figure 2. Changes in population and GDP in Dongguan City.
Land 14 01507 g002
Figure 3. Research flow.
Land 14 01507 g003
Figure 4. Spatial pattern of urban growth and shrinkage in Dongguan from 2008 to 2014.
Land 14 01507 g004
Figure 5. Spatial pattern of urban growth and shrinkage in Dongguan from 2015 to 2019.
Land 14 01507 g005
Figure 6. Spatial pattern of urban growth and shrinkage in Dongguan from 2020 to 2023.
Land 14 01507 g006
Table 1. Factors affecting urban growth and contraction in Dongguan City.
DimensionIndicator NameIndicator DescriptionReferences
Population dimensionPermanent resident populationStudies have shown that population agglomeration has a positive impact on economic development.[63,64]
Number of employees in R&D departmentsInnovation within enterprises plays an important role in promoting industrial transformation and social development.[37,41,65]
Industry dimensionDegree of industrial advancementAmong the industrial factors, secondary and tertiary industries are the main driving forces of economic growth, mainly benefiting from the accelerated industrialization process and the rise of the manufacturing industry.[66,67]
Number of industrial enterprisesAgglomeration has important spatial spillover effects on urban economic development, but excessive industrial agglomeration may lead to crowding effects, thereby inhibiting regional economic development.[68,69]
Kernel density of registered industrial and commercial enterprises
Number of R&D enterprisesScience- and technology-based enterprises play a core driving role in technological innovation and are the main catalyst for regional technological innovation and economic development.[65,70]
Public service dimensionTownship fiscal expenditureStudies have shown that government investment in medical and healthcare is an important factor in promoting the high-quality development of the country’s economy.[64,71]
Kernel density of healthcare facility POIsUrban green spaces bring many benefits to residents, healthcare is a key urban amenity that attracts population migration, and educational equity has a significant driving effect on sustainable regional economic growth.[72,73,74,75]
Kernel density of science, education, and culture POIs
Kernel density of sport POIs
Kernel density of scenic spot POIs
Land use dimensionBuilt-up areaIn recent years, scholars have focused on the relationship between urban sprawl and socioeconomic development and found that the global land consumption rate is significantly positively correlated with the population growth rate.[76,77]
Industrial land areaIndustrial land is an important spatial foundation for economic and social activities, supporting the development of the global manufacturing industry. It is also an important source of carbon emissions and various environmental problems.[76,78]
Table 2. Results of multiple linear regression analysis of GDP of Dongguan from 2008 to 2014 1.
Unstandardized
Coefficients
Standardized
Coefficients
tpCollinearity Diagnostics
BStandard ErrorBetaVIFTolerance
Constant8873.585334.386-26.5370.000 **--
Kernel density of registered industrial and commercial enterprises13.3692.2760.1065.8730.000 **1.2160.822
Number of industrial enterprises−1459.027220.043−0.118−6.6310.000 **1.1670.857
Industrial structure sophistication7716.937417.9850.45018.4620.000 **2.2020.454
Township expenditure2.1140.2440.1858.6730.000 **1.6980.589
Kernel density of transportation POIs133.90527.6930.1314.8350.000 **2.7380.365
Kernel density of sport POIs13.36481.7810.0050.1630.8703.3020.303
Kernel density of healthcare facility POIs239.74647.4010.1295.0580.000 **2.4120.415
Kernel density of scenic spot POIs340.464340.3220.0181.0000.3171.1630.860
Built-up area−132.947283.906−0.008−0.4680.6401.0440.958
Industrial land area−1068.702157.983−0.115−6.7650.000 **1.0710.933
R20.349
Adjusted R20.346
FF (10,2417) = 129.469, p = 0.000
D-W statistic0.380
1 Note: dependent variable = GDP. ** p < 0.01.
Table 3. Results of multiple linear regression analysis of Dongguan GDP from 2015 to 2019 1.
Unstandardized
Coefficients
Standardized
Coefficients
tpCollinearity Diagnostics
BStandard ErrorBetaVIFTolerance
Constant3173.665383.559-8.2740.000 **--
Kernel density of registered industrial and commercial enterprises4.4330.9310.0524.7610.000 **1.4810.675
Number of industrial enterprises2133.85577.3470.32427.5880.000 **1.6900.592
Industrial structure sophistication26,643.034535.7740.69649.7280.000 **2.4020.416
Number of R&D enterprises1248.486187.1970.1066.6690.000 **3.0730.325
Number of employees in R&D departments46.1755.3720.1288.5960.000 **2.7290.366
Township expenditure0.7350.0970.1147.5940.000 **2.7620.362
Kernel density of healthcare facility POIs−13.02422.508−0.009−0.5790.5632.8670.349
Kernel density of sport POIs−7.61117.238−0.005−0.4410.6591.4960.669
Kernel density of transportation POIs73.40611.3490.0976.4680.000 **2.7670.361
Kernel density of scenic spot POIs−104.06580.223−0.013−1.2970.1951.1410.876
Built-up area−736.075284.705−0.024−2.5850.010 **1.0170.984
Industrial land area−114.35983.668−0.016−1.3670.1721.6510.606
R20.804
Adjusted R20.803
FF (12,2409) = 821.583, p = 0.000
D-W statistic0.413
1 Note: dependent variable = GDP. ** p < 0.01.
Table 4. Results of multiple linear regression analysis of Dongguan’s GDP from 2020 to 2023 1.
Unstandardized
Coefficients
Standardized
Coefficients
tpCollinearity Diagnostics
BStandard ErrorBetaVIFTolerance
Constant2924.404220.403-13.2680.000 **--
Kernel density of registered industrial and commercial enterprises0.4950.1690.0302.9260.003 **1.3510.740
Number of industrial enterprises632.58790.6840.0716.9760.000 **1.3370.748
Number of R&D enterprises−2485.745163.906−0.165−15.1660.000 **1.5250.656
Number of employees in R&D departments117.5562.2040.56353.3260.000 **1.4320.698
Industrial structure sophistication−21,573.141289.330−0.765−74.5620.000 **1.3520.740
Kernel density of sports POIs18.66823.0200.0090.8110.4171.6220.617
Kernel density of healthcare facility POIs13.84520.3640.0070.6800.4971.5320.653
Kernel density of transportation POIs70.75510.8120.0666.5440.000 **1.3120.762
Kernel density of scenic spots POIs−38.95334.683−0.010−1.1230.2621.0330.969
Built-up area−439.375302.776−0.013−1.4510.1471.0230.977
Industrial land area−1468.048203.345−0.075−7.2190.000 **1.3880.721
R20.812
Adjusted R20.811
FF (11,2416) = 948.947, p = 0.000
D-W statistic0.432
1 Note: dependent variable = GDP. ** p < 0.01.
Table 5. Summary of factors affecting urban growth and contraction in Dongguan City from 2008 to 2014, 2015 to 2019, and 2020 to 2023 1.
Influencing Factors2008–20142015–20192020–2023
Kernel density of registered industrial and commercial enterprises+++
Number of industrial enterprises-++
Industrial structure sophistication++-
Number of employees in R&D departments/++
Number of R&D enterprises/+-
Township disposable expenditure++/
Kernel density of scenic spot POIs///
Kernel density of transportation POIs+++
Kernel density of healthcare facility POIs+//
Kernel density of sport POIs///
Built-up area/-/
Industrial land area+/-
1 Note: “+” indicates that the positive effect of the element is significant, “-” indicates that the negative effect of the element is significant, and “/” indicates that the effect of the element is not significant.
Disclaimer/Publisher’s Note: The statements, opinions and data contained in all publications are solely those of the individual author(s) and contributor(s) and not of MDPI and/or the editor(s). MDPI and/or the editor(s) disclaim responsibility for any injury to people or property resulting from any ideas, methods, instructions or products referred to in the content.

