
The Impacts of Heatwaves on Population Distribution in the Subtropical City: A Case Study of Nanchang, China


Abstract
1. Introduction
2. Materials and Methods
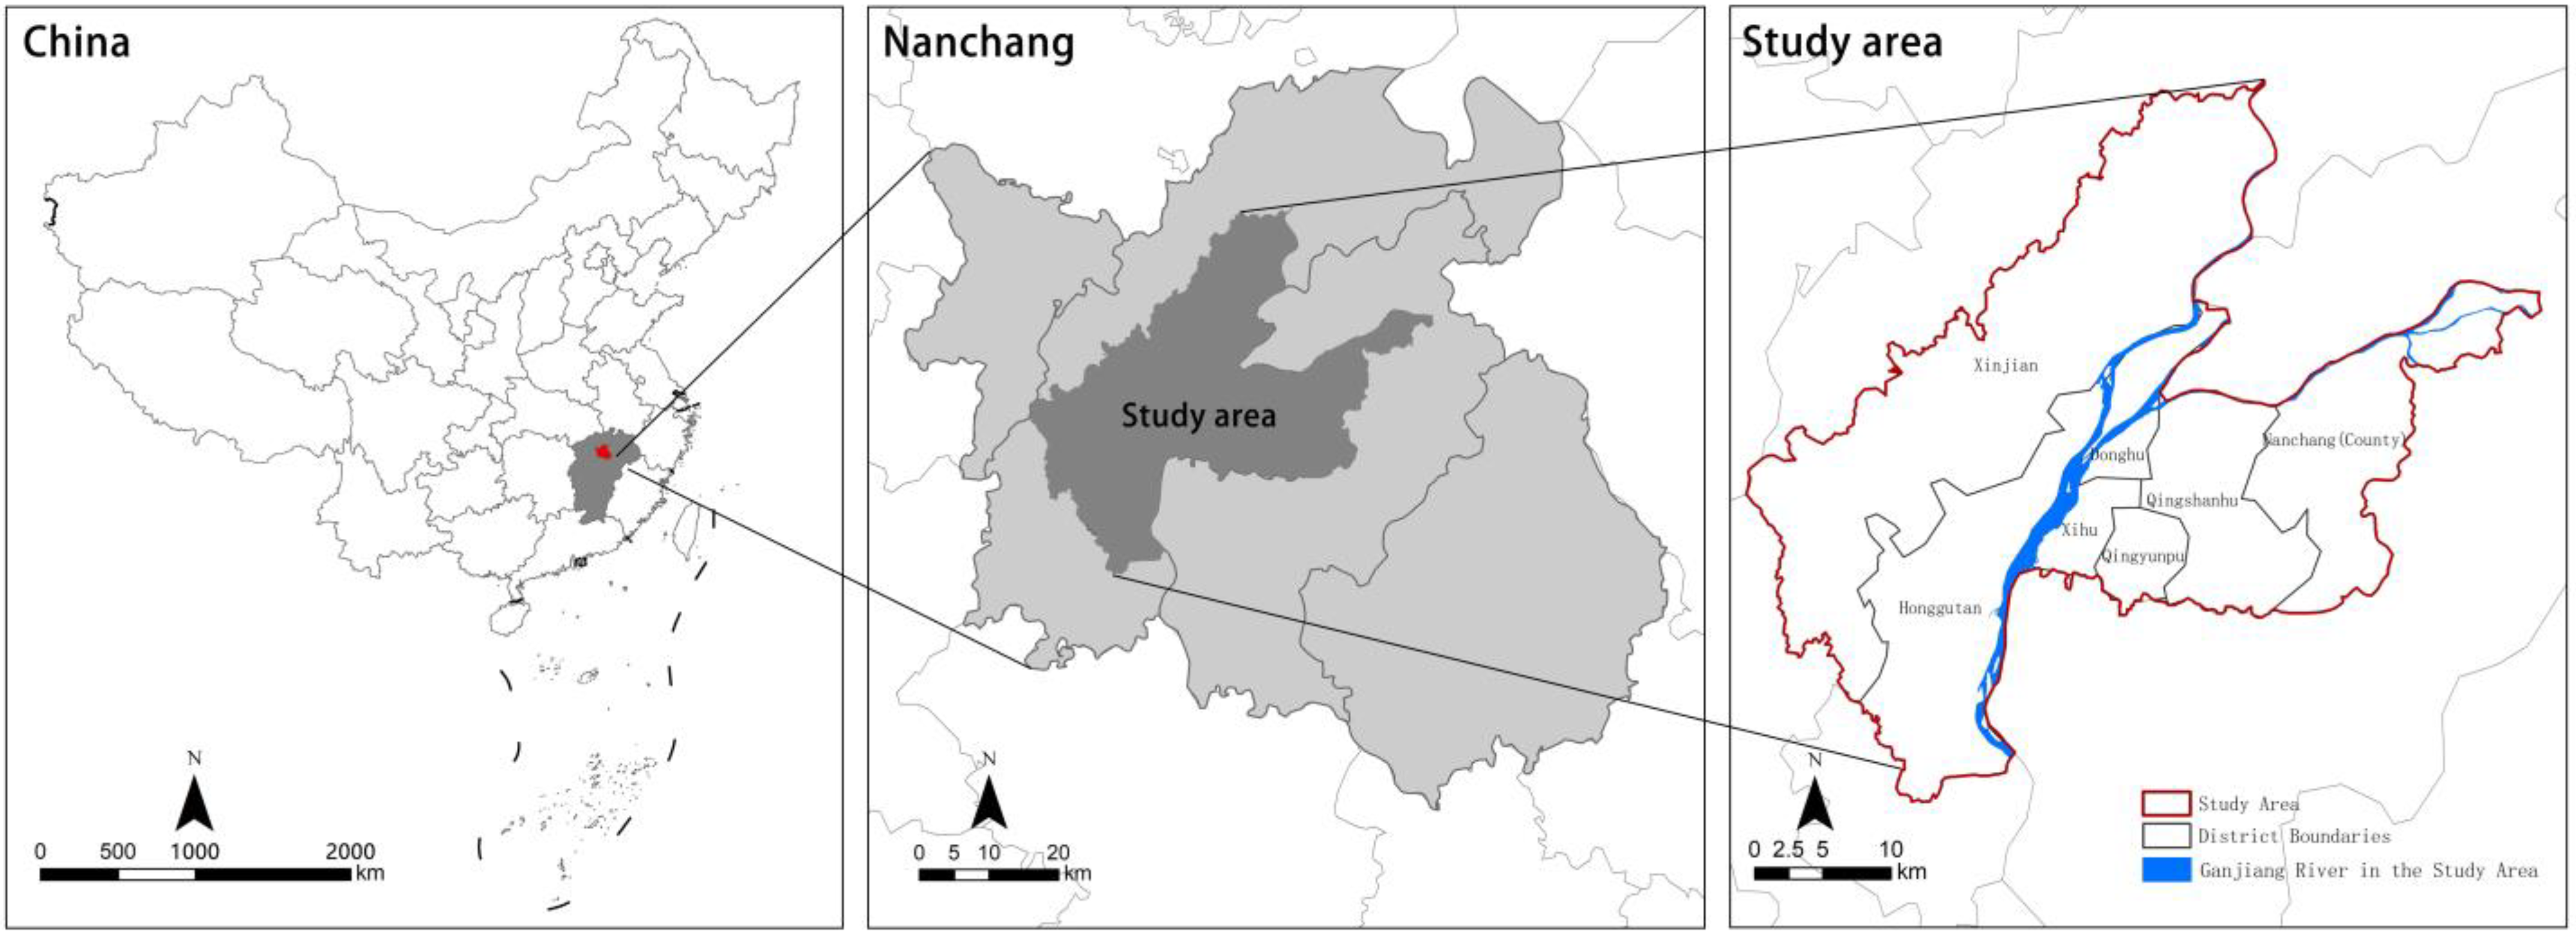
2.1. Study Area
2.2. Data
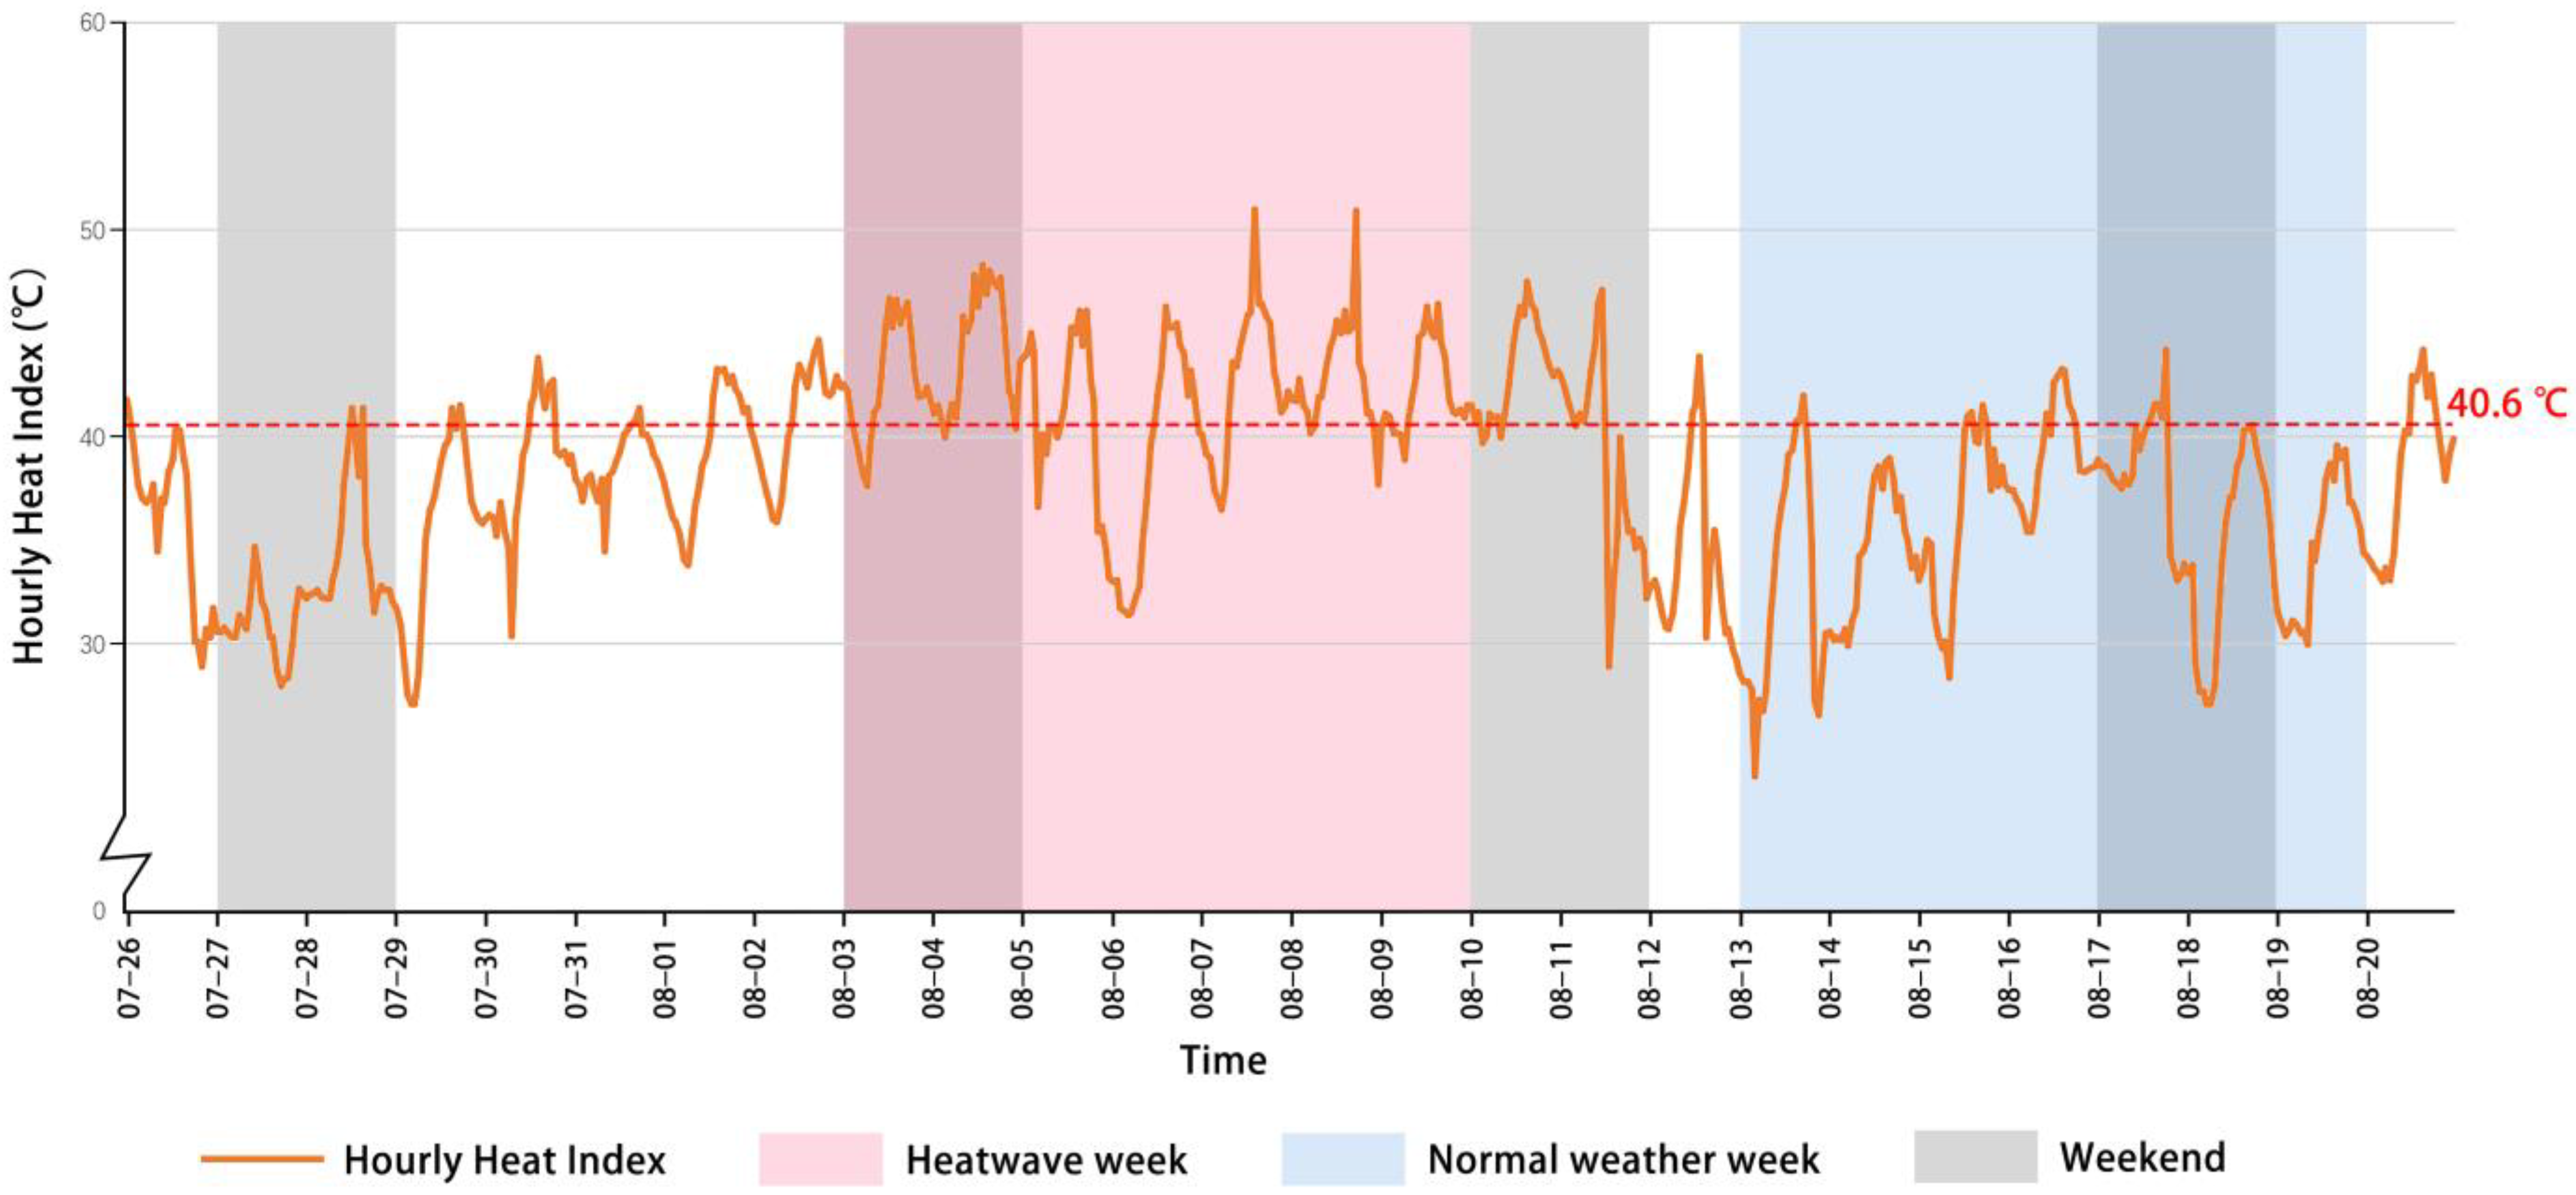
2.2.1. Weather Records
2.2.2. Population Heat Map Data
2.2.3. Data About the Built Environment
2.3. Methods
2.3.1. Identifying Heatwave Events
- = −8.784695, = 1.61139411, = 2.338549, = −0.14611605, = −1.2308094 × 10⁻²,
- = −1.6424828 × 10⁻², = 2.211732 × 10⁻³, = 7.2546 × 10⁻⁴, = −3.582 × 10⁻⁶.
2.3.2. Measuring Population Changes During Heatwaves (PCDH) at the Grid Scale
2.3.3. Selecting Built Environment Factors
2.3.4. Model for Investigating the Relationships Between PCDH and Built Environment Factors
- (1)
- Model selection
- (2)
- SHapley Additive exPlanation (SHAP) method
3. Results
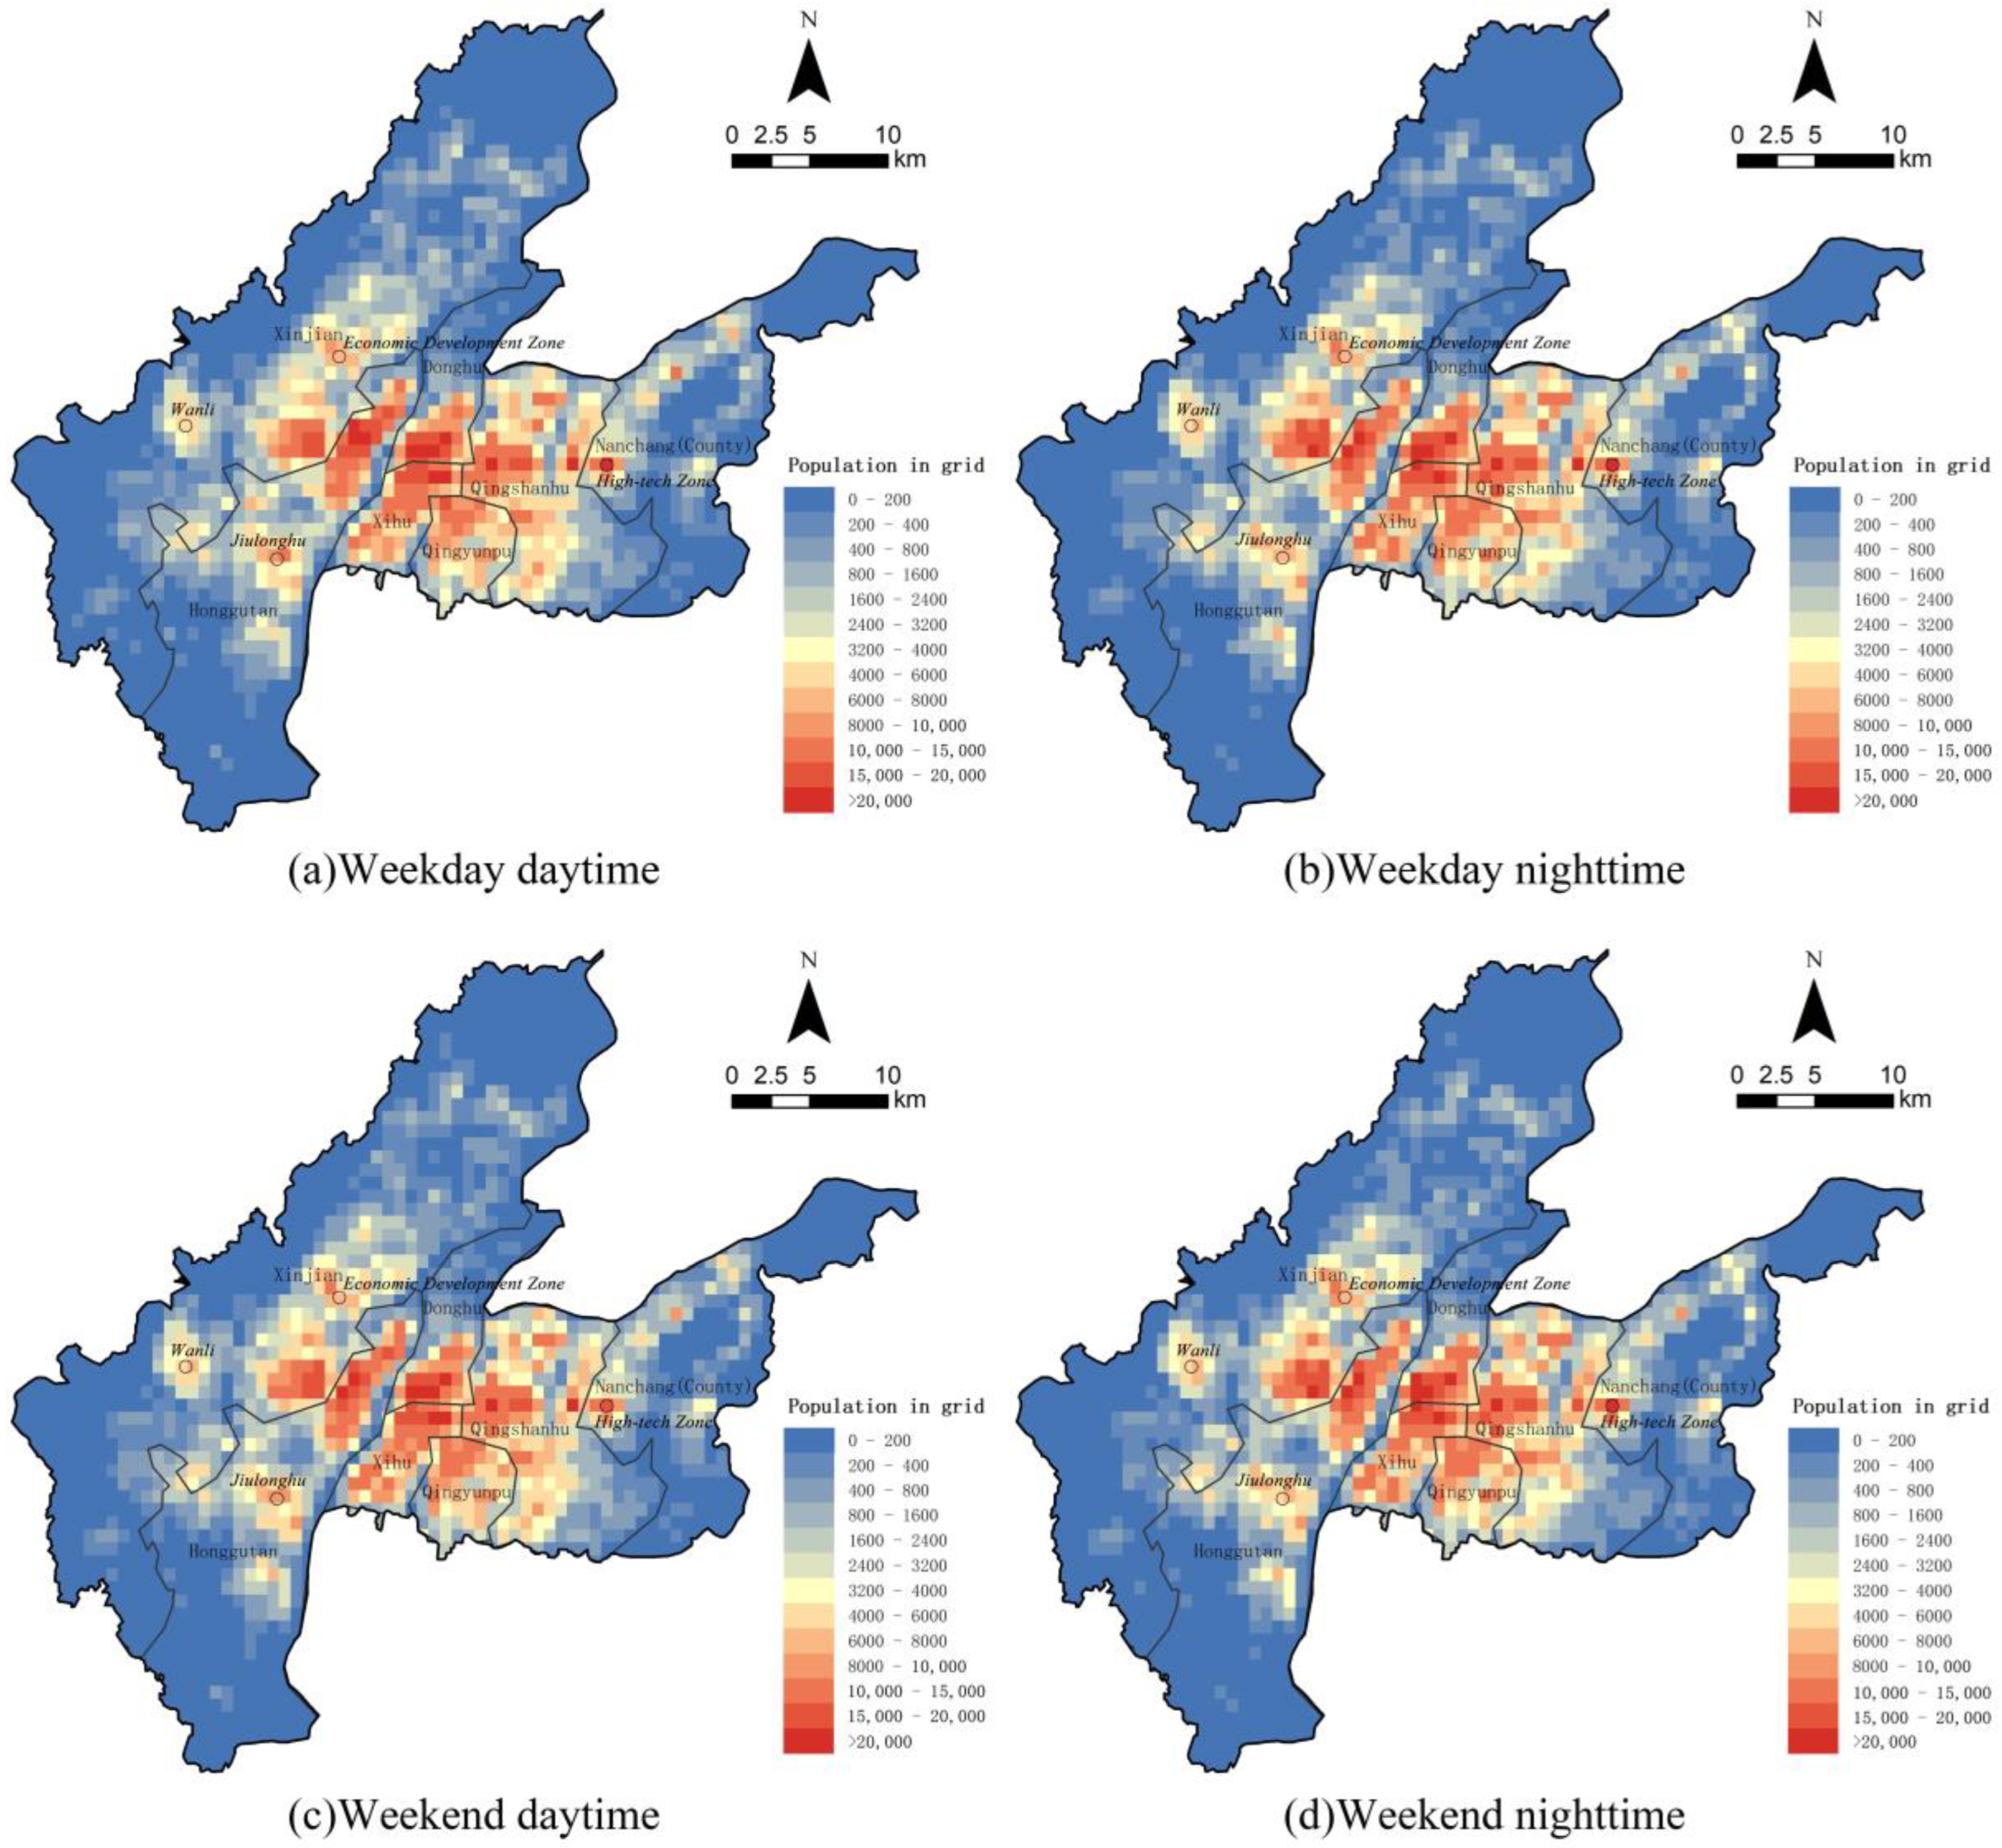
3.1. Population Distribution
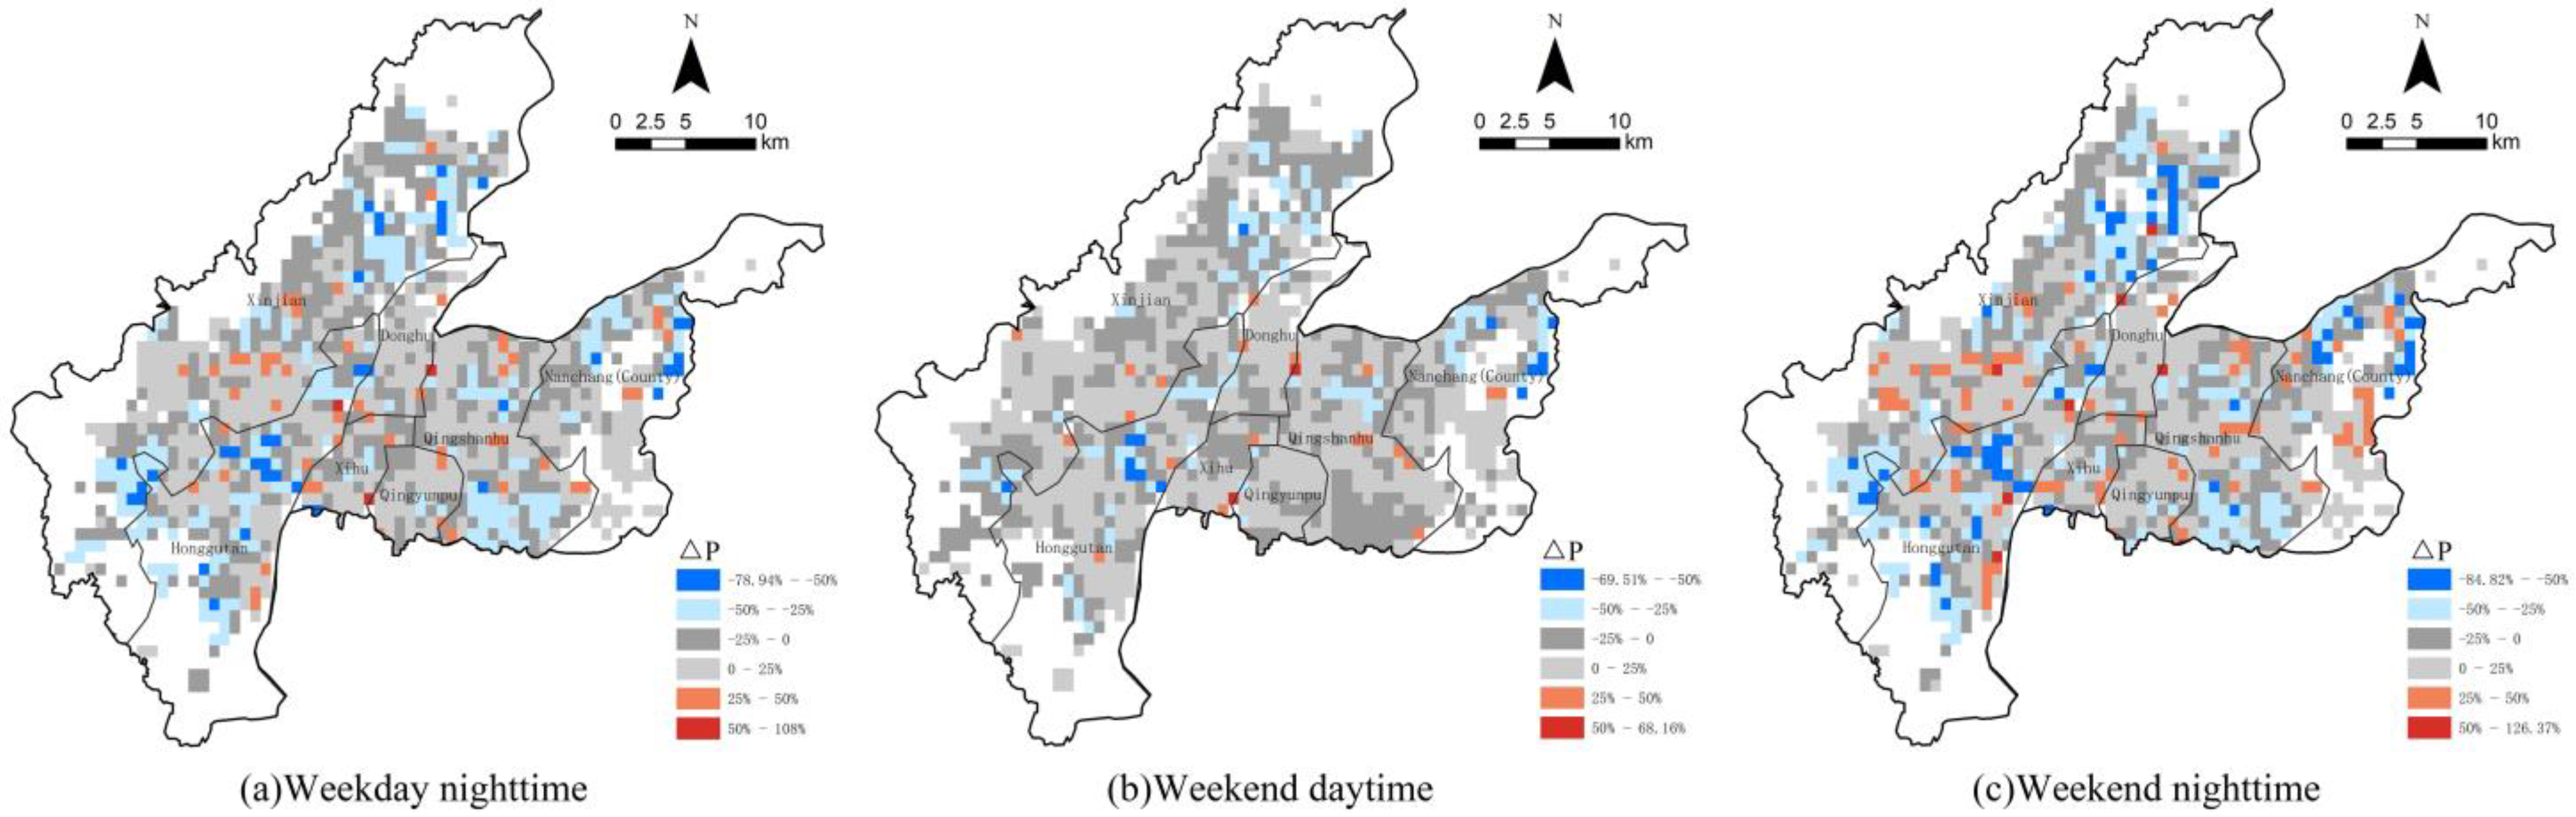
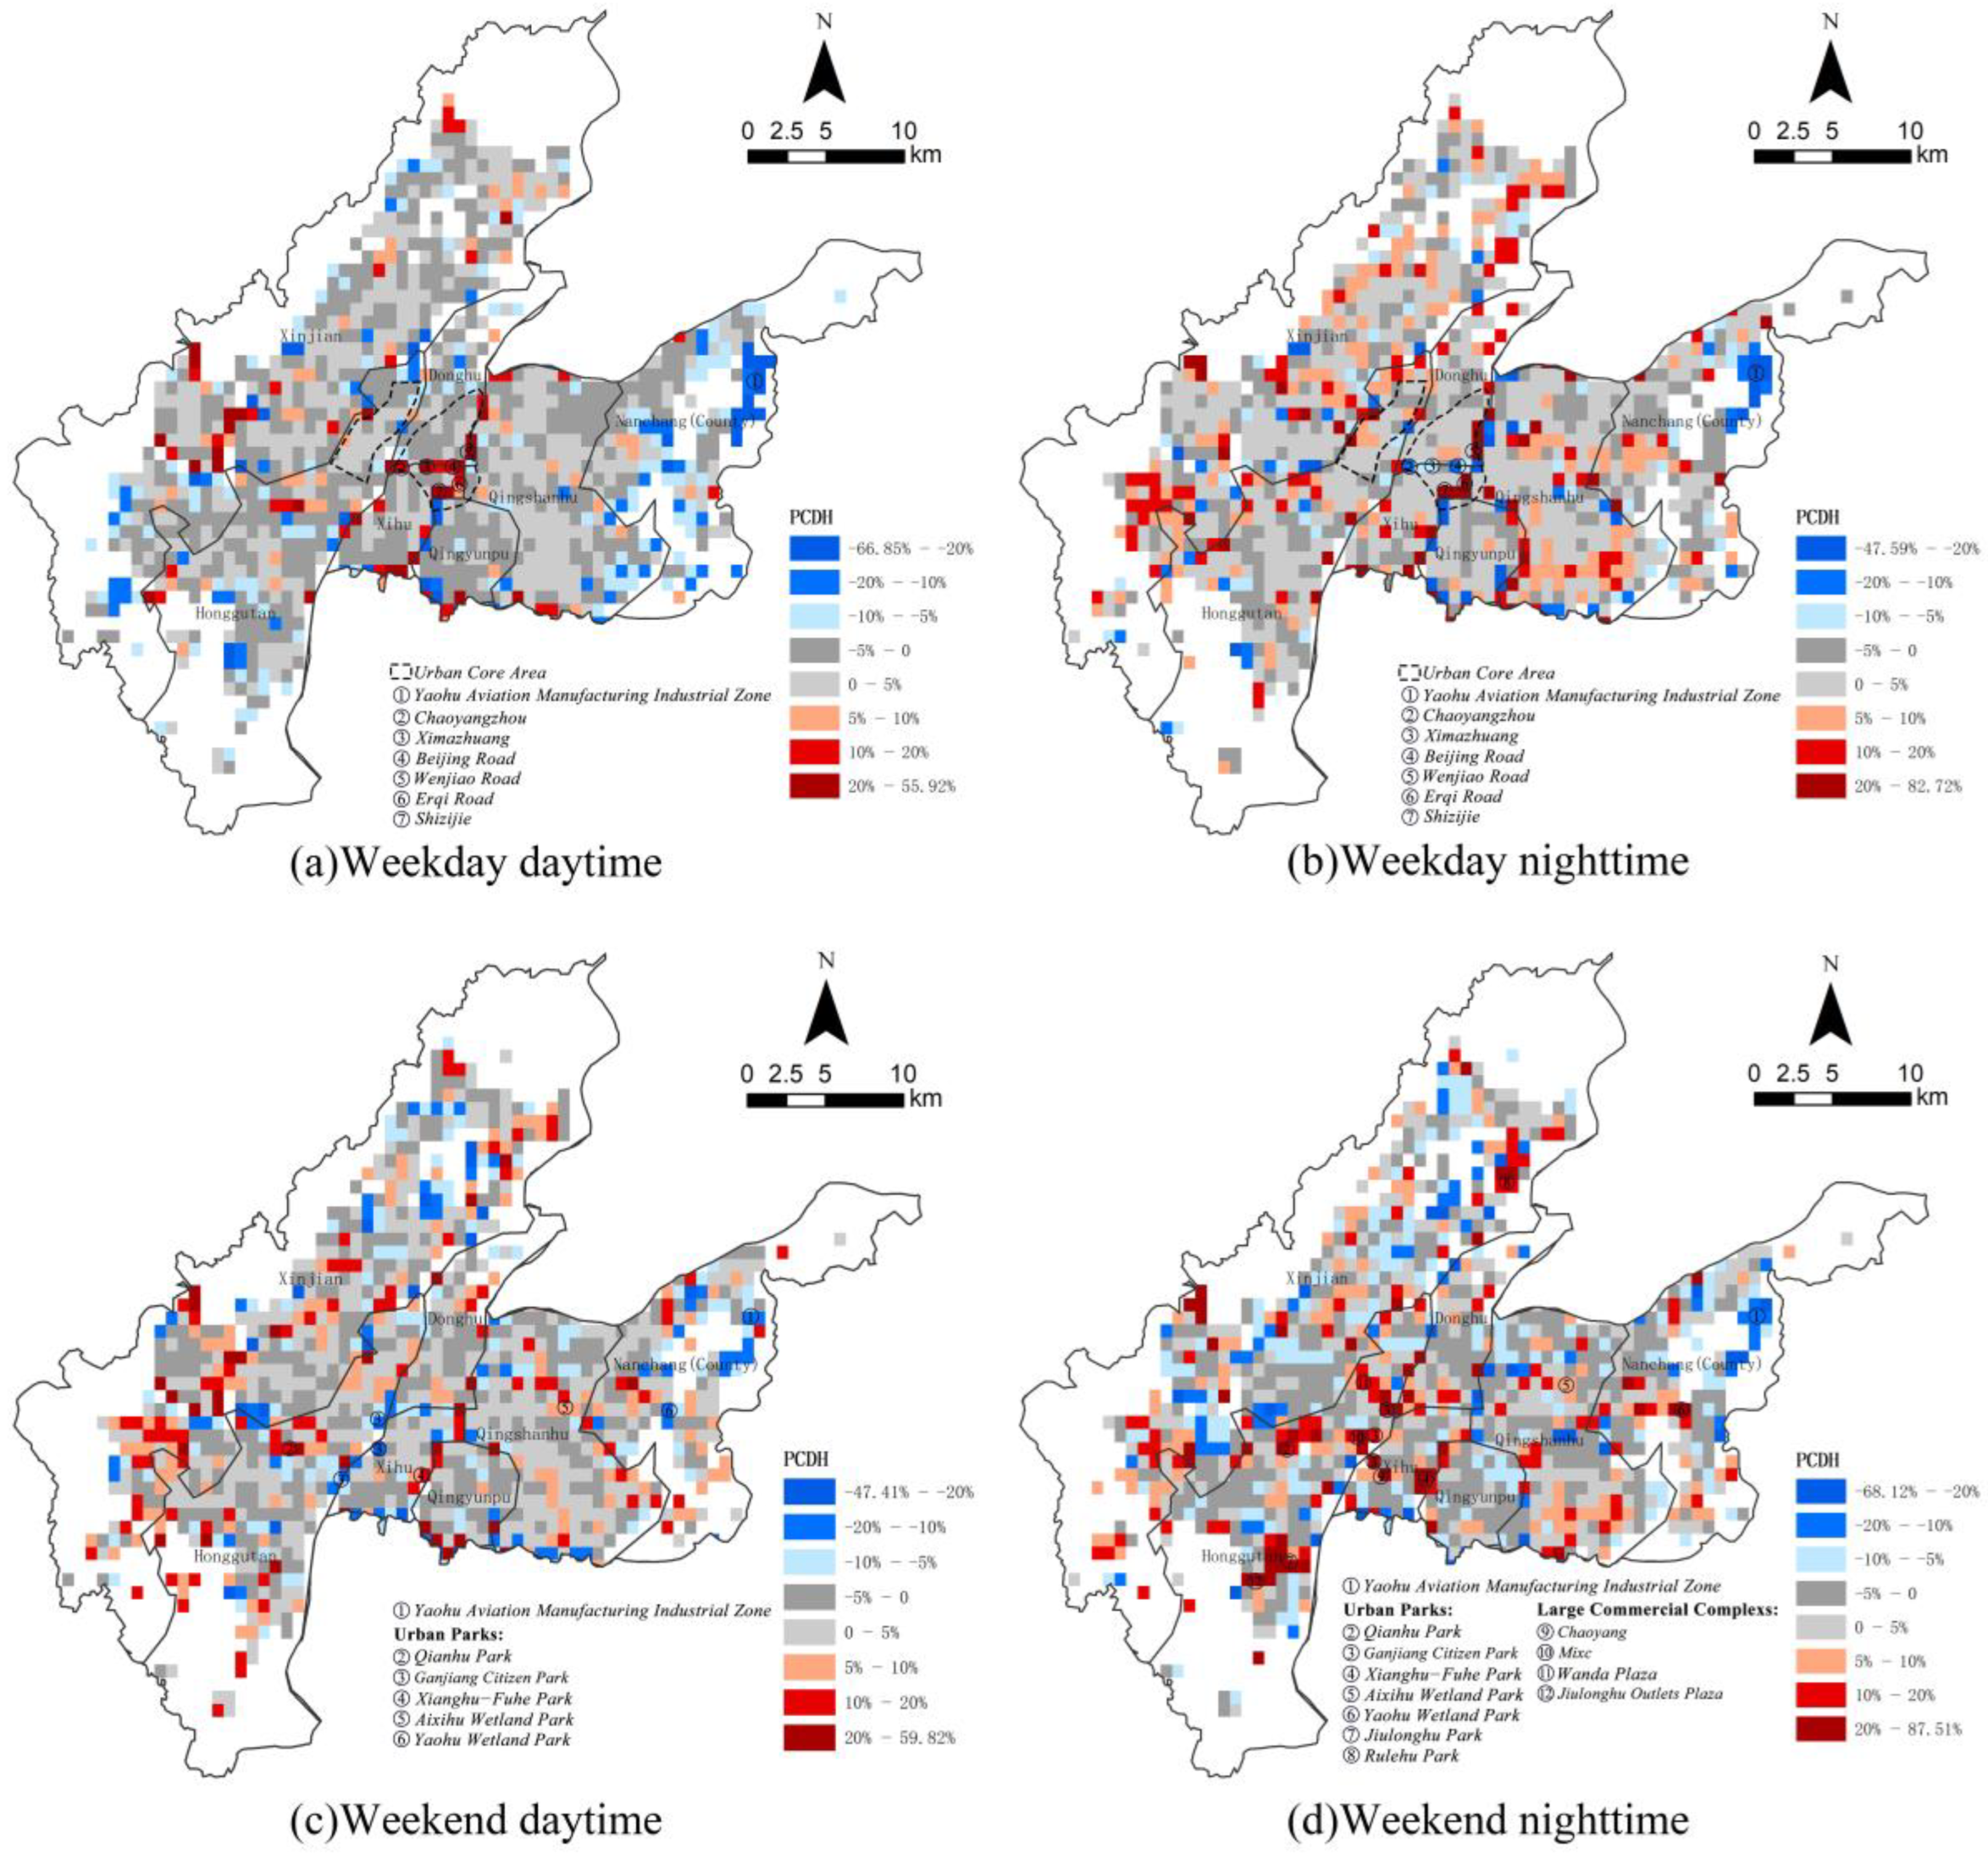
3.2. Spatiotemporal Heterogeneity of PCDH
3.3. Nonlinear Relationships Analysis Between PCDH and Built Environment Factors Based on the XGBoost Model and SHAP Method
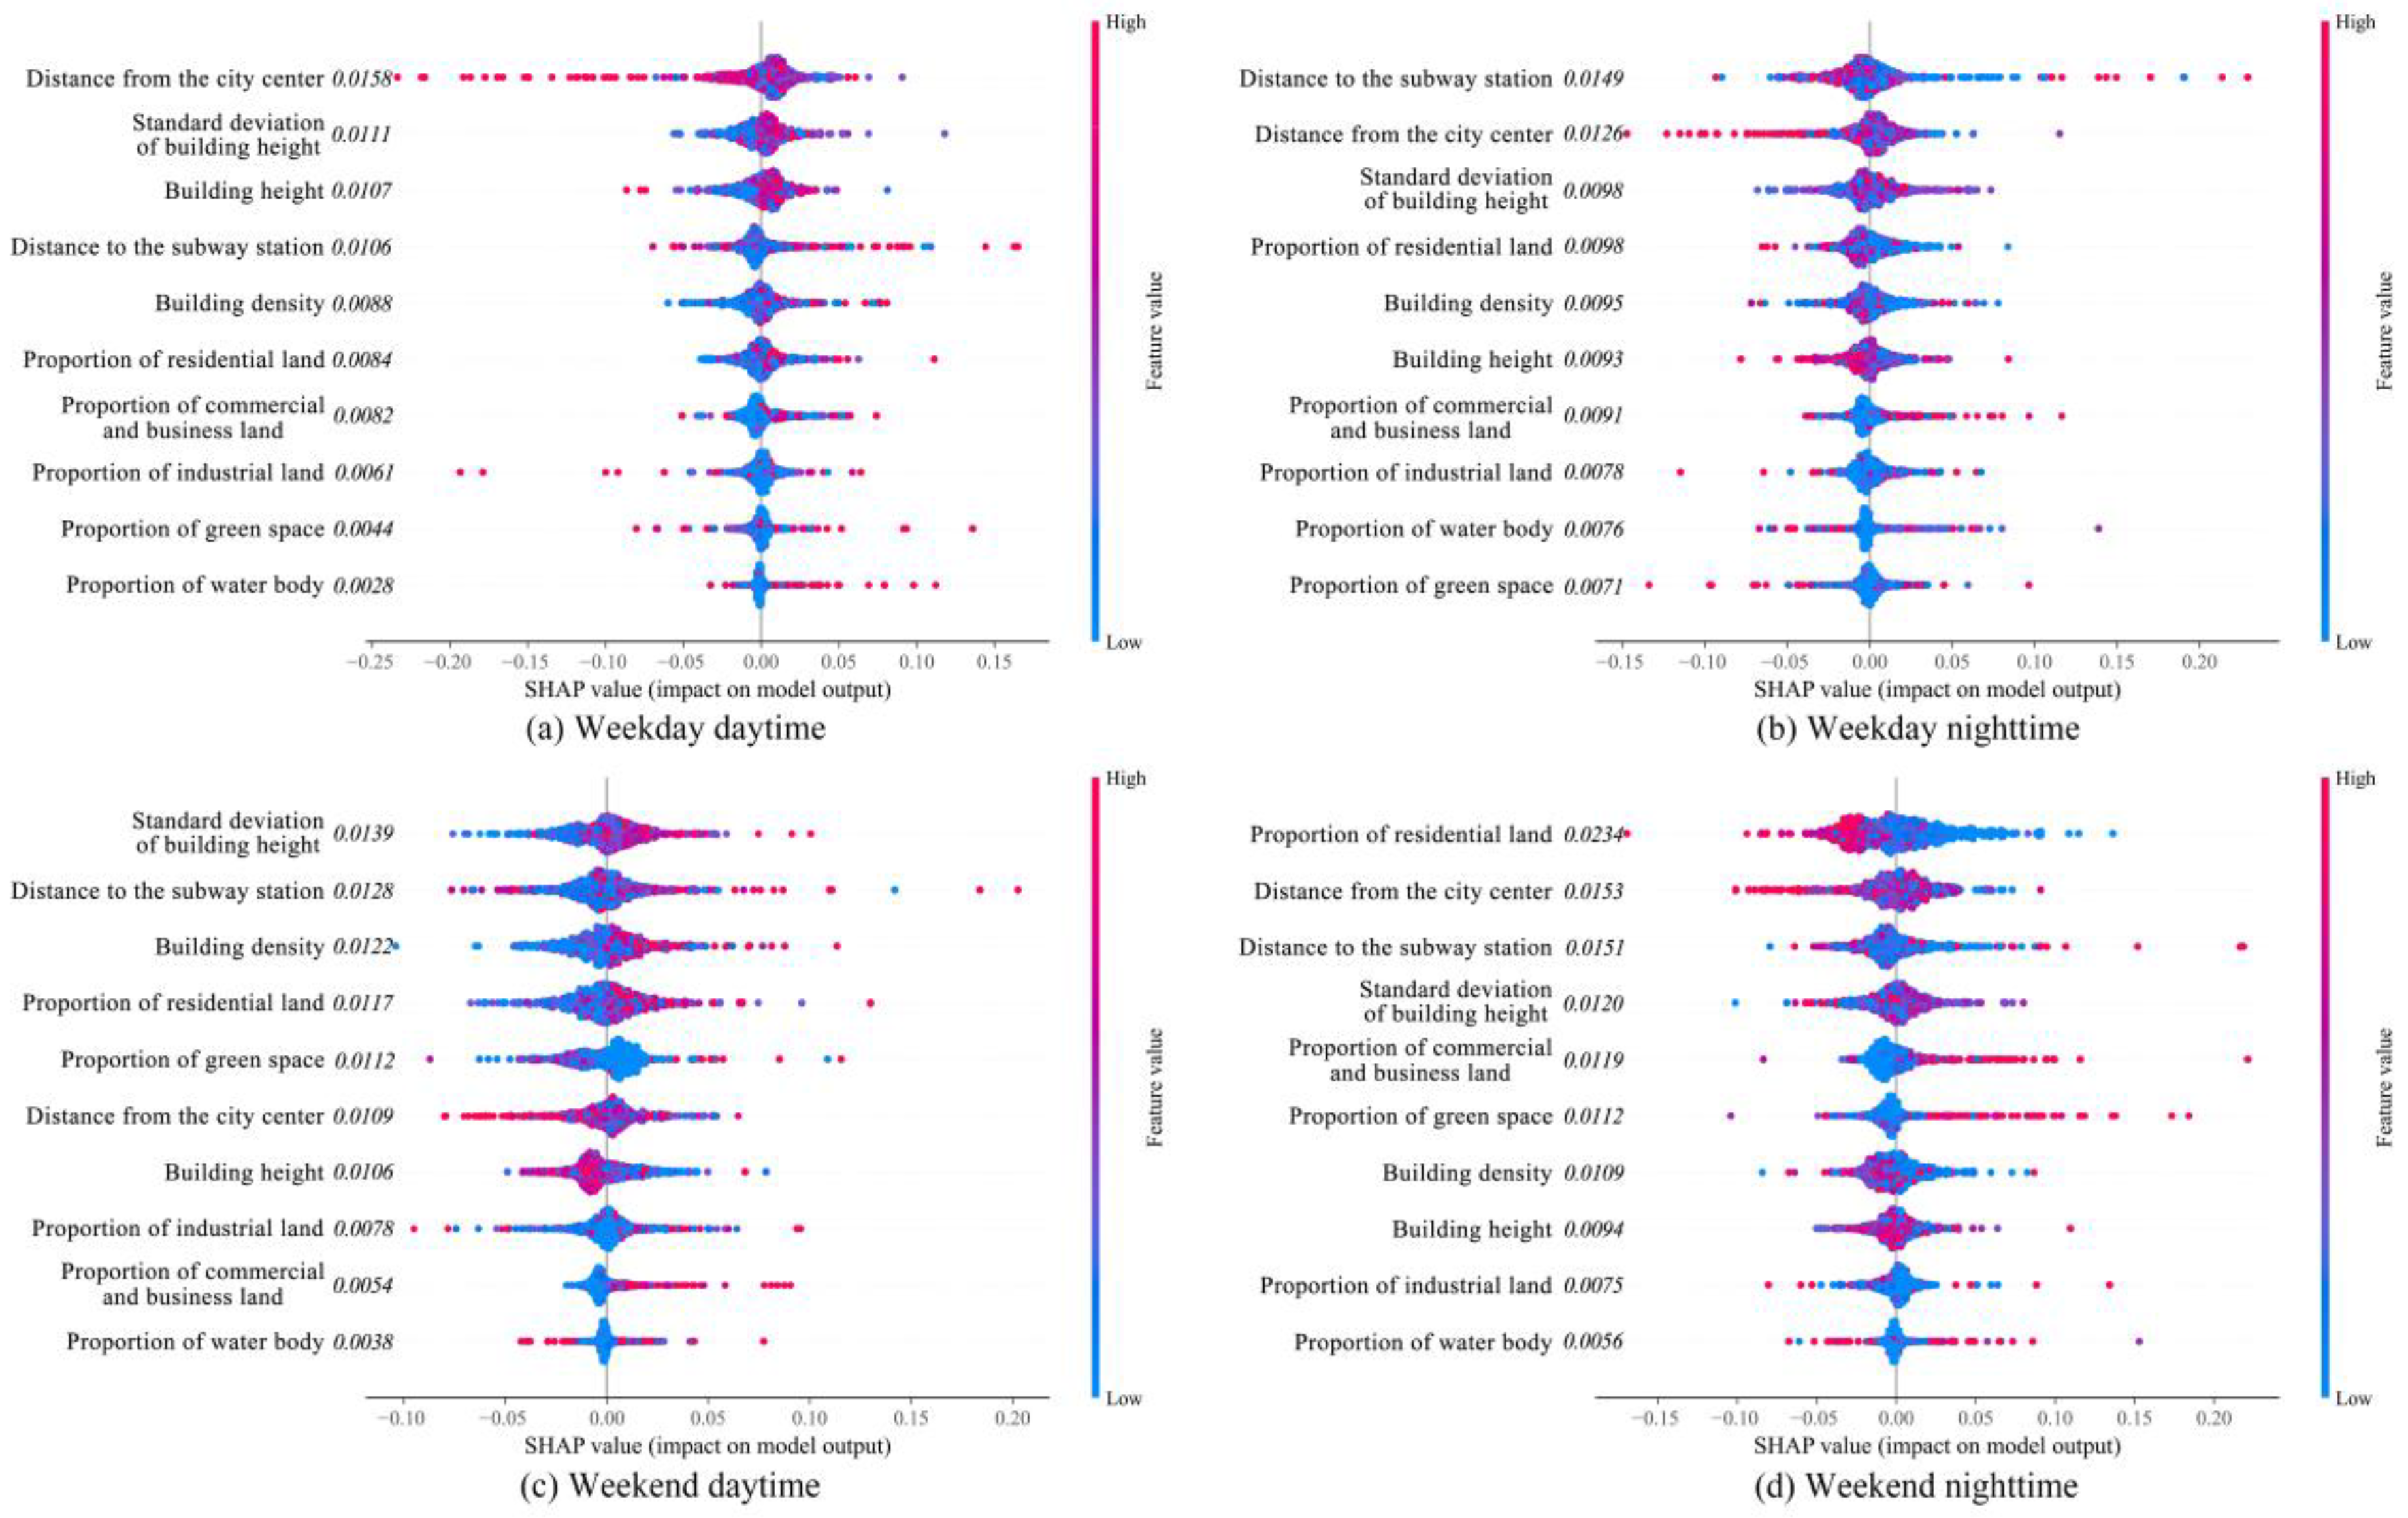
3.3.1. Summary Plots of SHAP Values
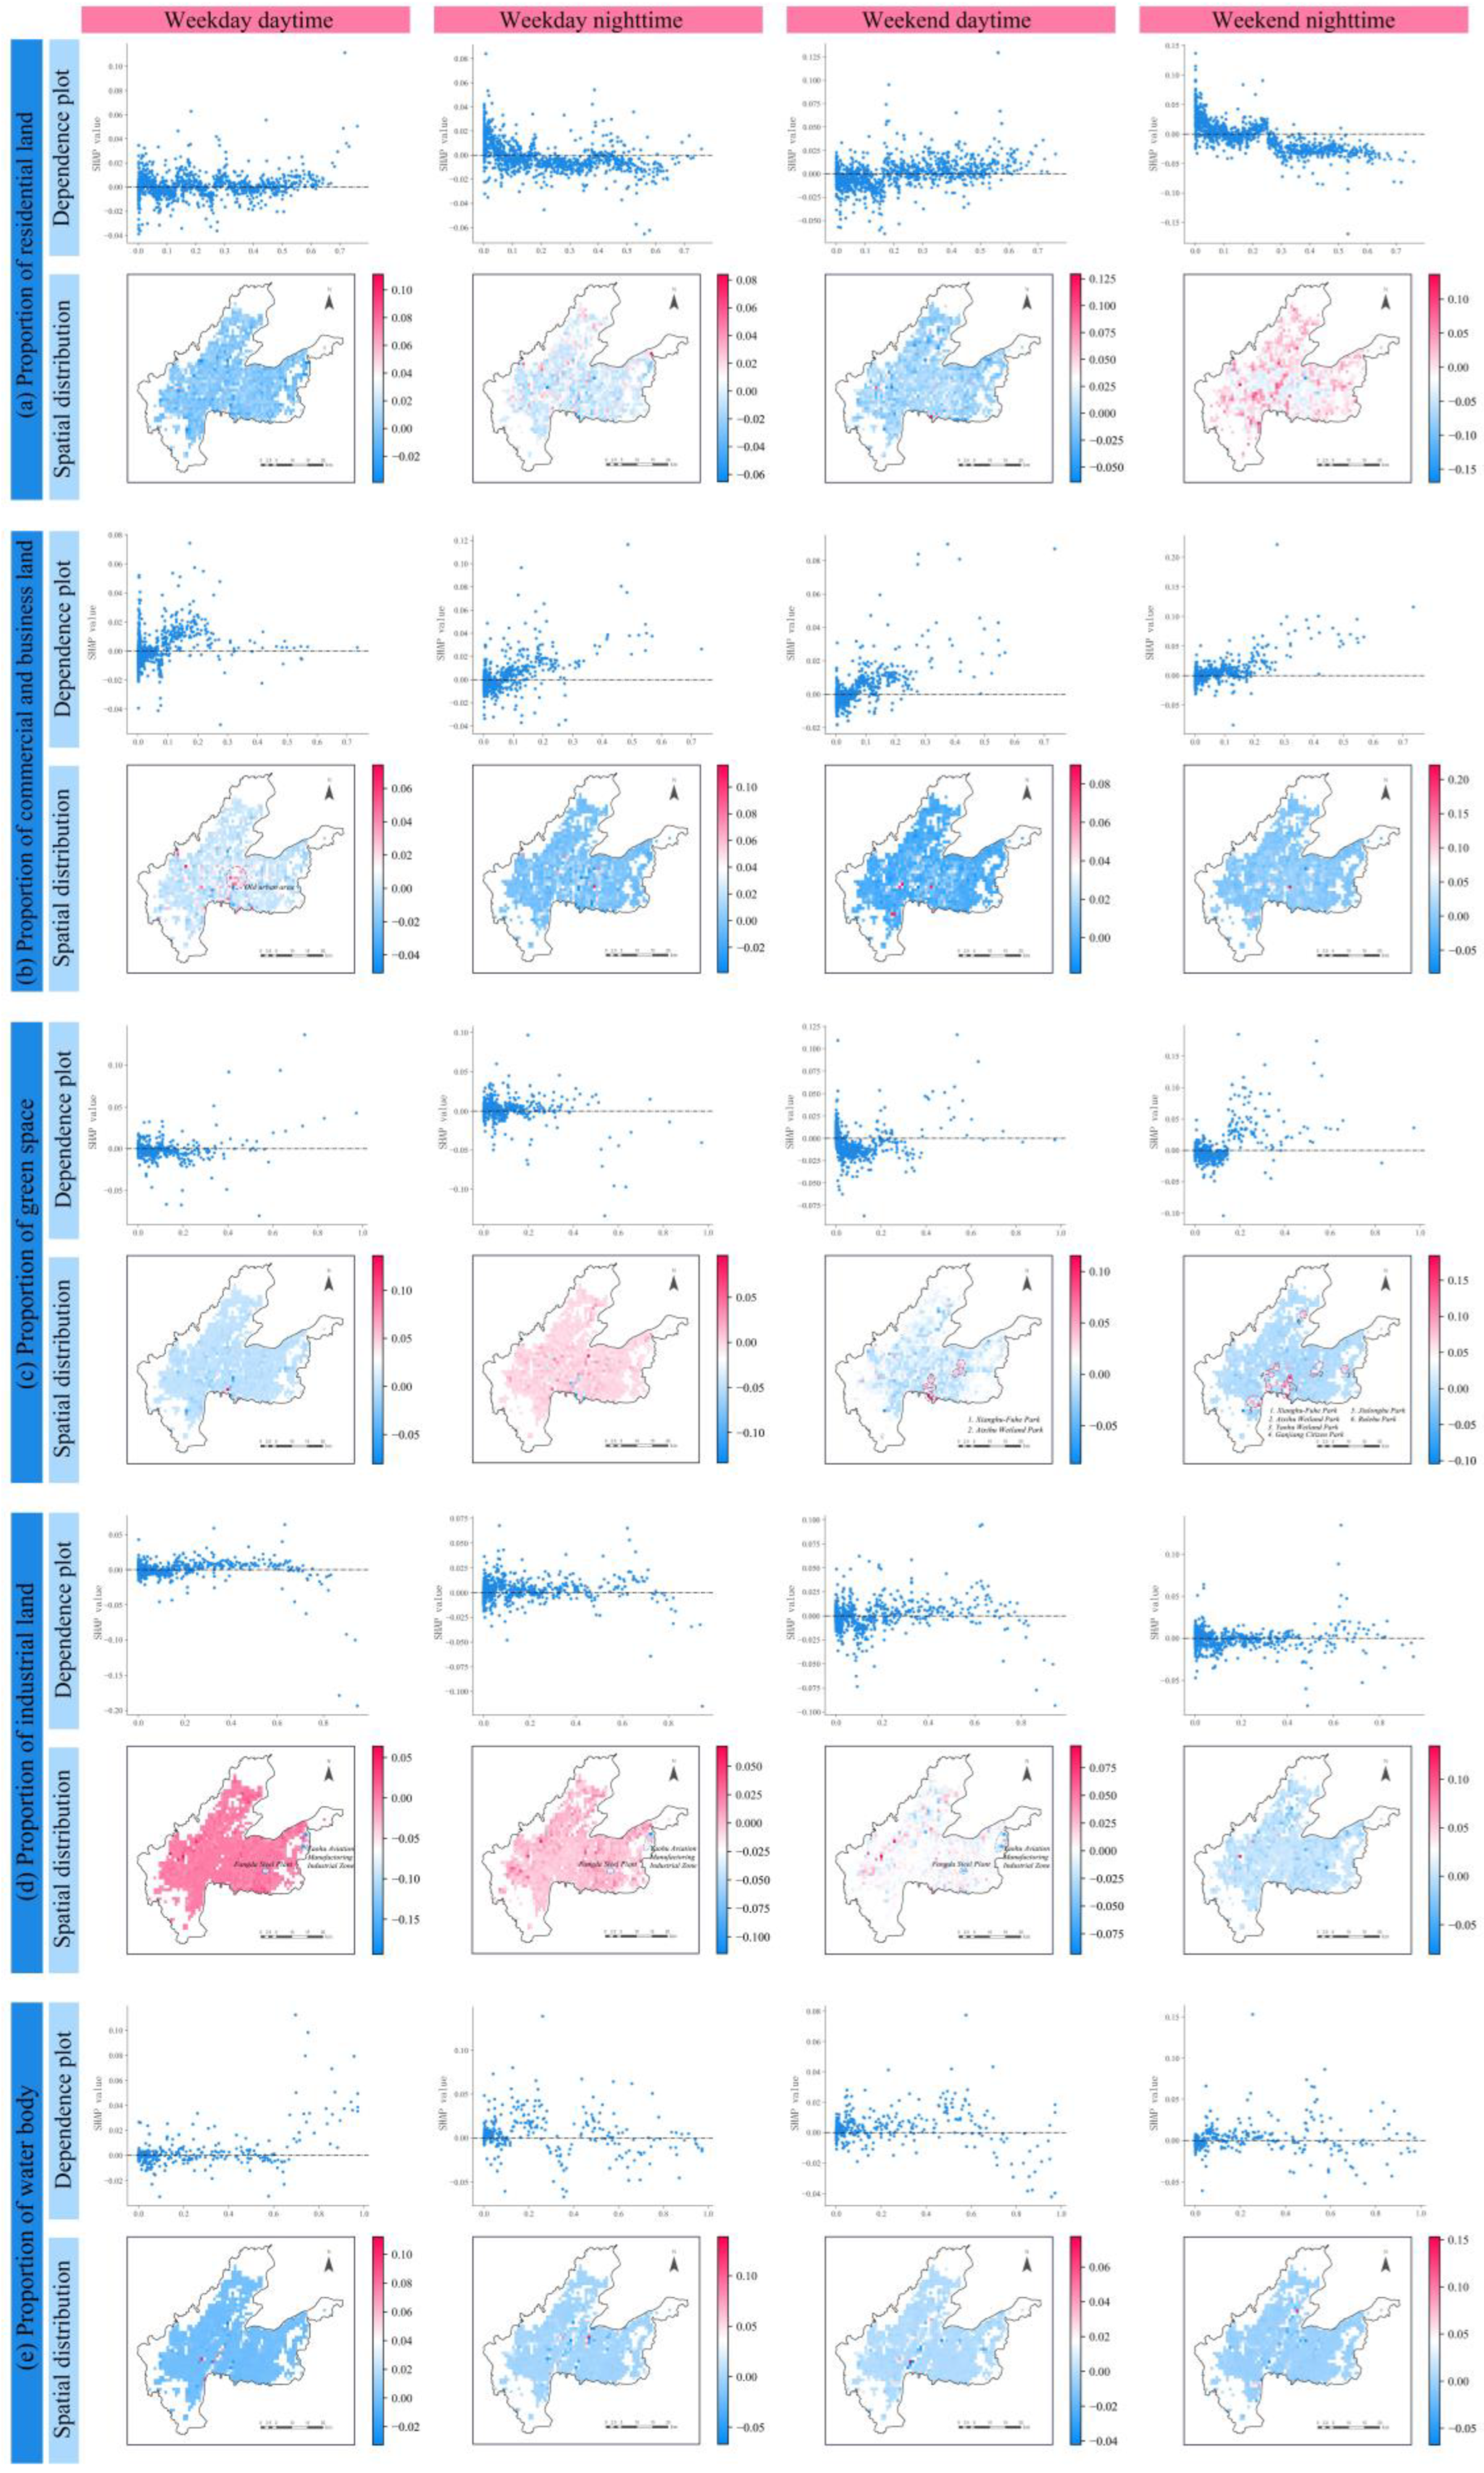
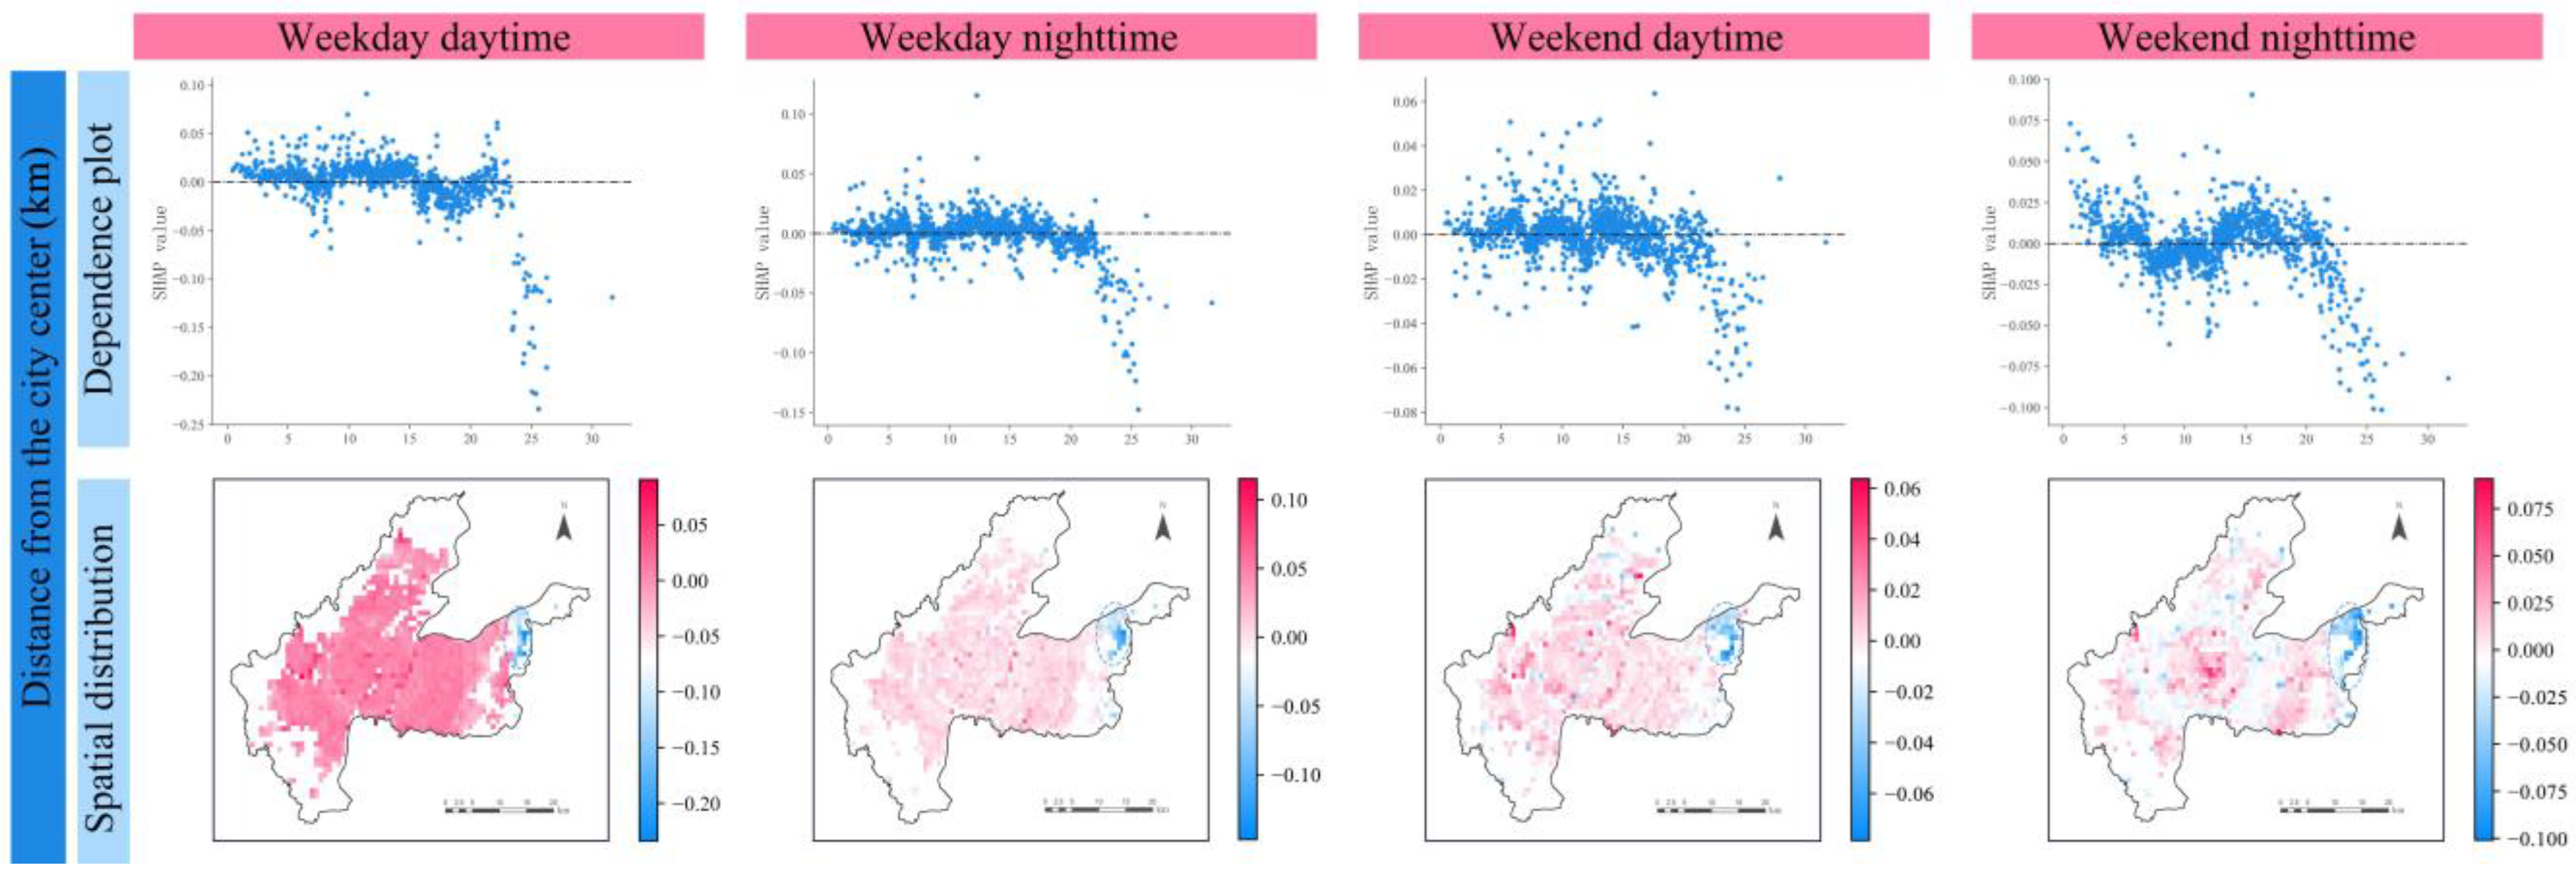
3.3.2. Dependency Plots and Spatial Distribution of SHAP Values
- (1)
- Land use
- (2)
- Location
- (3)
- Transportation
- (4)
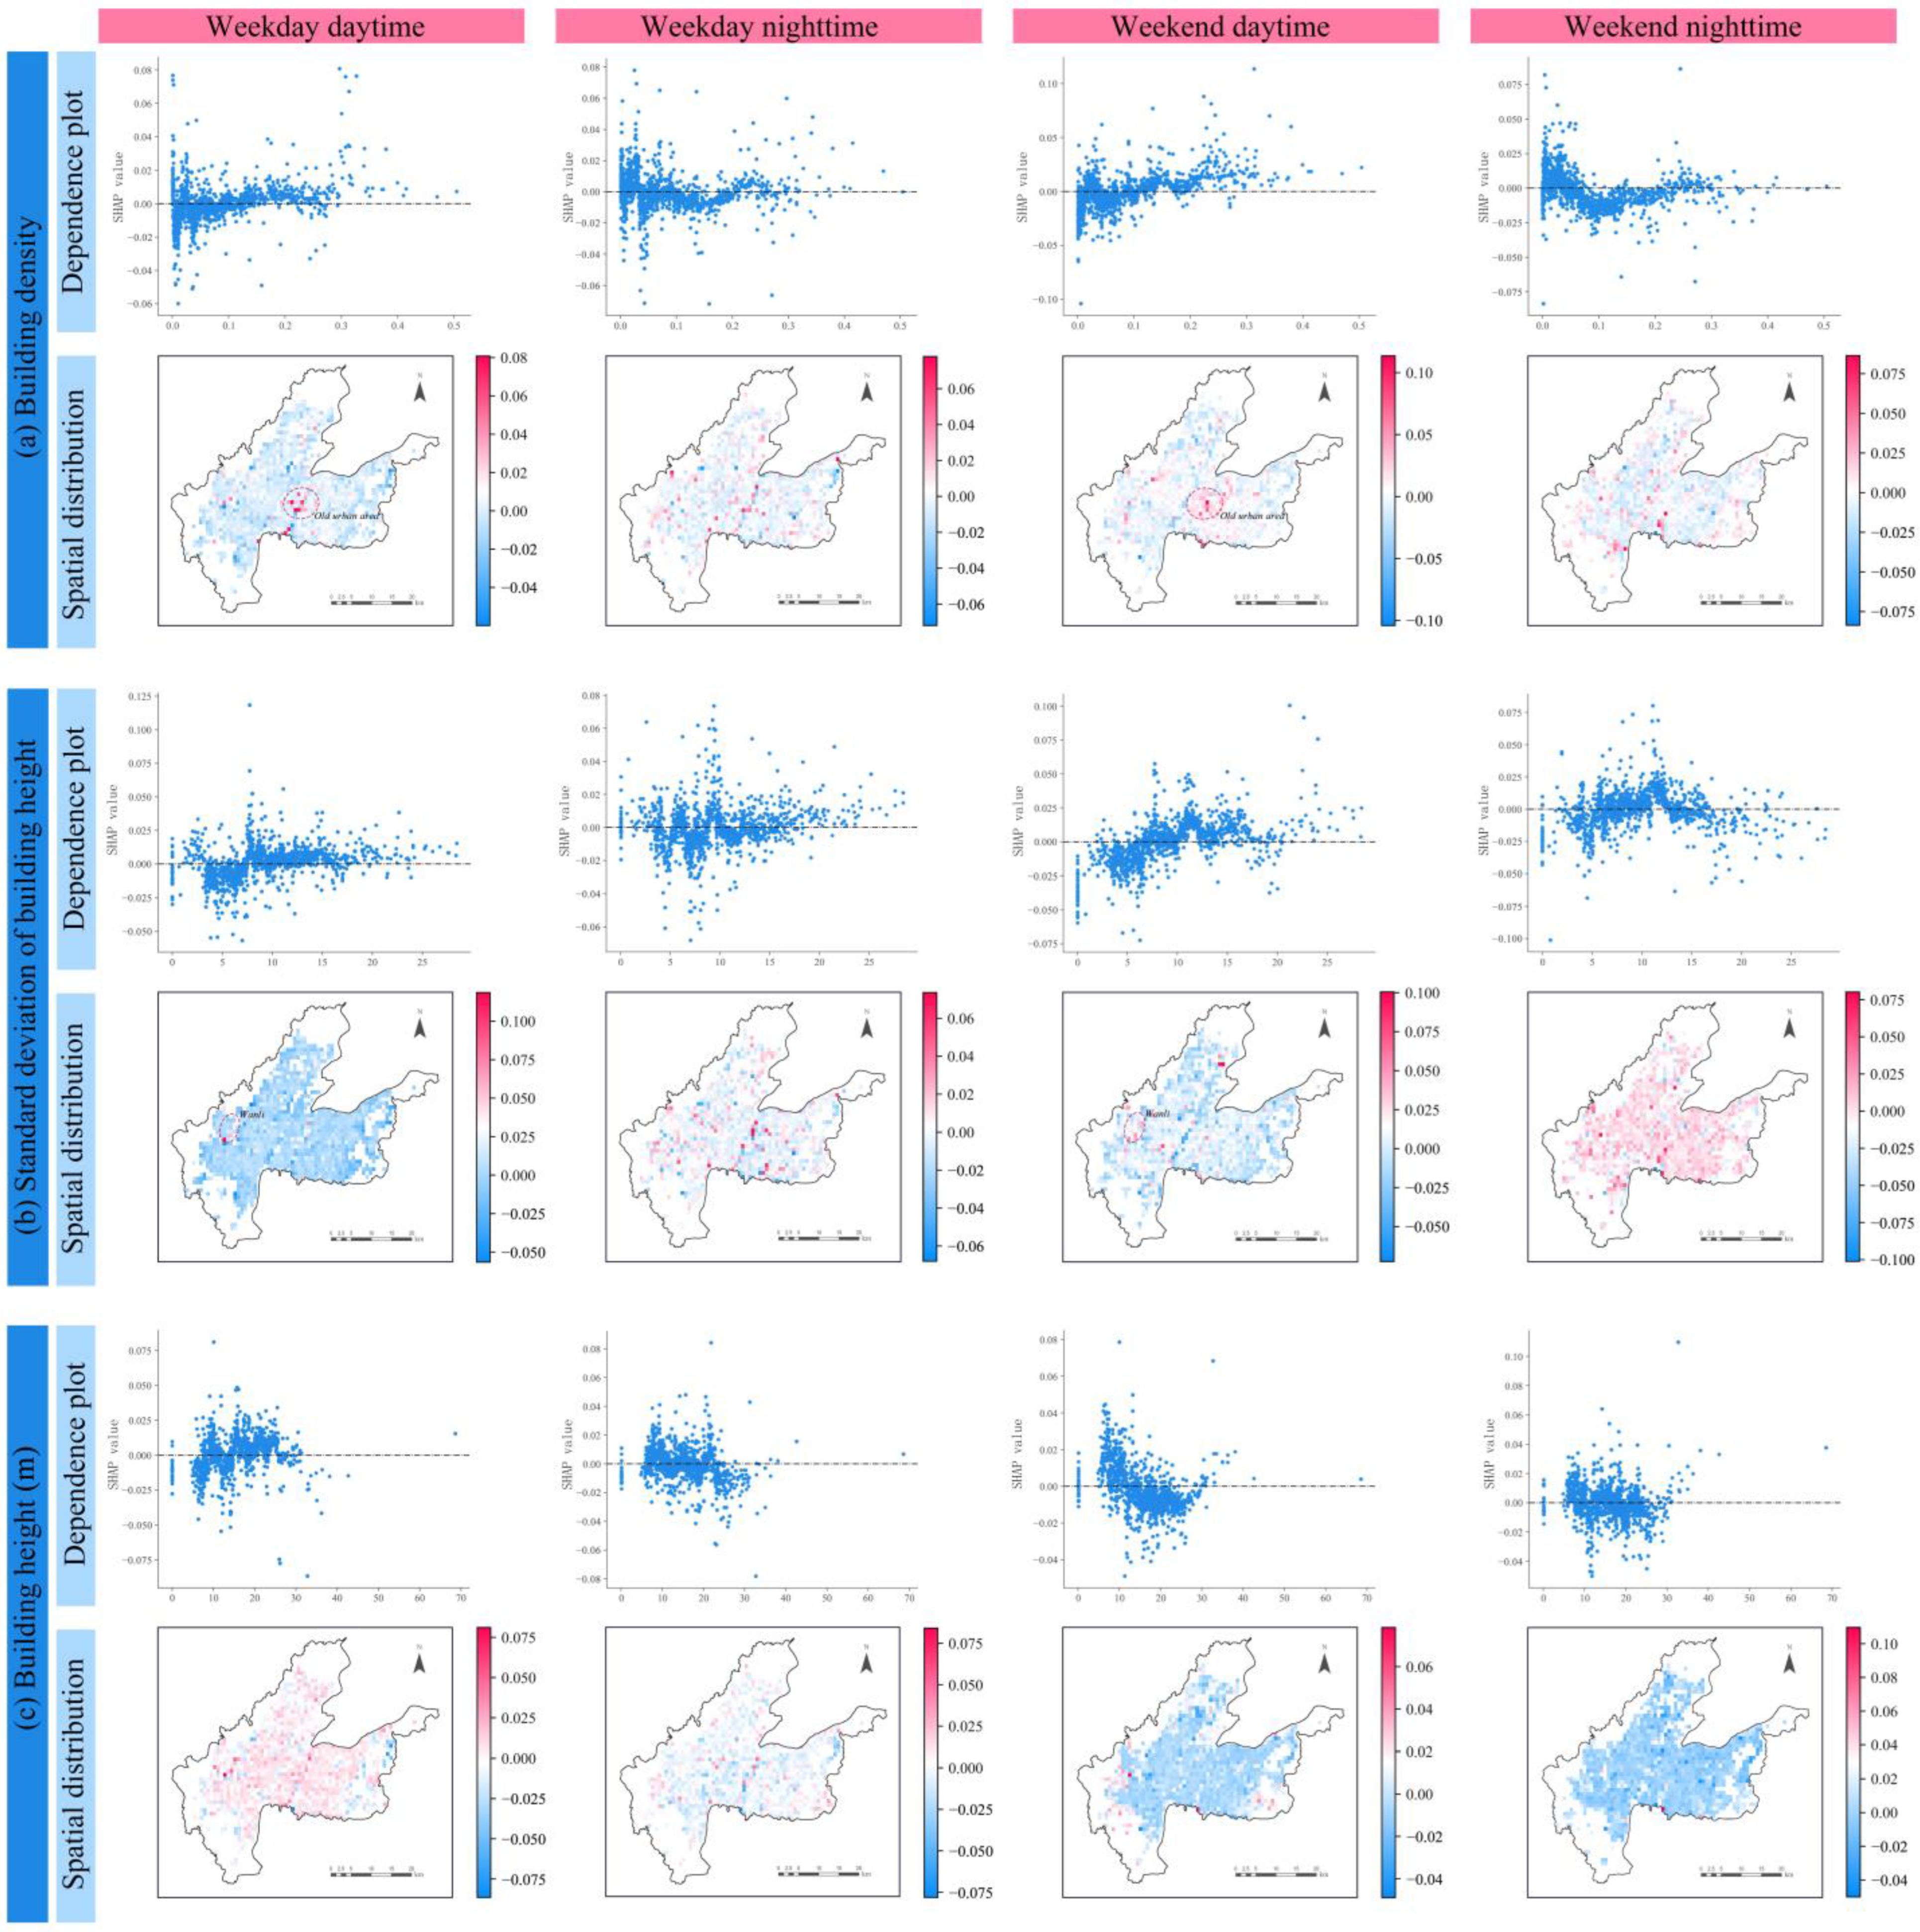
- Building form
4. Discussion
4.1. The Impacts of Heatwaves on Population Distribution and Their Relationships with Built Environment Factors
4.2. Implications for Urban Planning and Management
5. Conclusions
Author Contributions
Funding
Data Availability Statement
Conflicts of Interest
Abbreviations
| PCDH | Population changes during heatwaves |
References
- Papalexiou, S.M.; AghaKouchak, A.; Trenberth, K.E.; Foufoula-Georgiou, E. Global, Regional, and Megacity Trends in the Highest Temperature of the Year: Diagnostics and Evidence for Accelerating Trends. Earths Future 2018, 6, 71–79. [Google Scholar] [CrossRef] [PubMed]
- Vautard, R.; Barnes, C.; Philip, S.; Kew, S.; Pinto, I.; Otto, F.E.L. Heat extremes linearly shift with global warming, with frequency doubling per decade since 1979. Environ. Res. Lett. 2024, 19, 094033. [Google Scholar] [CrossRef]
- Perkins, S.E.; Alexander, L.V.; Nairn, J.R. Increasing frequency, intensity and duration of observed global heatwaves and warm spells. Geophys. Res. Lett. 2012, 39, L20714. [Google Scholar] [CrossRef]
- IPCC. Climate Change 2021: The Physical Science Basis. Cambridge. 2021. Available online: https://www.ipcc.ch/report/sixth-assessment-report-working-group-i/ (accessed on 9 January 2025).
- Manoli, G.; Fatichi, S.; Schlapfer, M.; Yu, K.; Crowther, T.W.; Meili, N.; Burlando, P.; Katul, G.G.; Bou-Zeid, E. Magnitude of urban heat islands largely explained by climate and population. Nature 2019, 573, 55–60. [Google Scholar] [CrossRef]
- Gu, X.; Chen, P.; Fan, C. Socio-demographic inequalities in the impacts of extreme temperatures on population mobility. J. Transp. Geogr. 2024, 114, 103755. [Google Scholar] [CrossRef]
- Tian, H.; Cai, H.; Hu, L.; Qiang, Y.; Zhou, B.; Yang, M.; Lin, B. Unveiling community adaptations to extreme heat events using mobile phone location data. J. Environ. Manag. 2024, 366, 121665. [Google Scholar] [CrossRef]
- Kabisch, N.; Kraemer, R.; Masztalerz, O.; Hemmerling, J.; Puffel, C.; Haase, D. Impact of summer heat on urban park visitation, perceived health and ecosystem service appreciation. Urban For. Urban Green. 2021, 60, 127058. [Google Scholar] [CrossRef]
- Green, H.; Bailey, J.; Schwarz, L.; Vanos, J.; Ebi, K.; Benmarhnia, T. Impact of heat on mortality and morbidity in low and middle income countries: A review of the epidemiological evidence and considerations for future research. Environ. Res. 2019, 171, 80–91. [Google Scholar] [CrossRef] [PubMed]
- Lyu, Z.; Yu, L.; Liu, C.; Ma, T. When temperatures matter: Extreme heat and labor share. Energy Econ. 2024, 138, 107811. [Google Scholar] [CrossRef]
- Lundgren, K.; Kuklane, K.; Gao, C.; Holmer, I. Effects of Heat Stress on Working Populations when Facing Climate Change. Ind. Health 2013, 51, 3–15. [Google Scholar] [CrossRef]
- Basagana, X.; Pablo Escalera-Antezana, J.; Dadvand, P.; Llatje, O.; Barrera-Gomez, J.; Cunillera, J.; Medina-Ramon, M.; Perez, K. High Ambient Temperatures and Risk of Motor Vehicle Crashes in Catalonia, Spain (2000–2011): A Time-Series Analysis. Environ. Health Perspect. 2015, 123, 1309–1316. [Google Scholar] [CrossRef] [PubMed]
- Gossling, S.; Neger, C.; Steiger, R.; Bell, R. Weather, climate change, and transport: A review. Nat. Hazards 2023, 118, 1341–1360. [Google Scholar] [CrossRef]
- Song, J.; Huang, B.; Kim, J.S.; Wen, J.; Li, R. Fine-scale mapping of an evidence-based heat health risk index for high-density cities: Hong Kong as a case study. Sci. Total Environ. 2020, 718, 137226. [Google Scholar] [CrossRef]
- Macintyre, H.L.; Heaviside, C.; Taylor, J.; Picetti, R.; Symonds, P.; Cai, X.M.; Vardoulakis, S. Assessing urban population vulnerability and environmental risks across an urban area during heatwaves—Implications for health protection. Sci. Total Environ. 2018, 610, 678–690. [Google Scholar] [CrossRef]
- Hu, K.; Yang, X.; Zhong, J.; Fei, F.; Qi, J. Spatially Explicit Mapping of Heat Health Risk Utilizing Environmental and Socioeconomic Data. Environ. Sci. Technol. 2017, 51, 1498–1507. [Google Scholar] [CrossRef] [PubMed]
- Borsky, S.; Fesselmeyer, E.; Vogelsang, L. Urban heat and within-city residential sorting. J. Environ. Econ. Manag. 2024, 127, 103014. [Google Scholar] [CrossRef]
- Wu, J.; Liao, H. Weather, travel mode choice, and impacts on subway ridership in Beijing. Transp. Res. Part A Policy Pract. 2020, 135, 264–279. [Google Scholar] [CrossRef]
- Jiang, S.; Cai, C. The impacts of weather conditions on metro ridership: An empirical study from three mega cities in China. Travel Behav. Soc. 2023, 31, 166–177. [Google Scholar] [CrossRef]
- Kim, S.-W.; Park, J.; Kim, T.; Chae, Y. Identification of heatwave hotspots in Seoul using high-resolution population mobility data. Urban Clim. 2021, 36, 100771. [Google Scholar] [CrossRef]
- Yang, J.; Hu, L.; Wang, C. Population dynamics modify urban residents’ exposure to extreme temperatures across the United States. Sci. Adv. 2019, 5, eaay3452. [Google Scholar] [CrossRef]
- Liu, W.; Zhang, L.; Hu, X.; Meng, Q.; Qian, J.; Gao, J.; Li, T. Nonlinear effects of urban multidimensional characteristics on daytime and nighttime land surface temperature in highly urbanized regions: A case study in Beijing, China. Int. J. Appl. Earth Obs. Geoinf. 2024, 132, 104067. [Google Scholar] [CrossRef]
- Zhao, Z.-Q.; He, B.-J.; Li, L.-G.; Wang, H.-B.; Darko, A. Profile and concentric zonal analysis of relationships between land use/land cover and land surface temperature: Case study of Shenyang, China. Energy Build. 2017, 155, 282–295. [Google Scholar] [CrossRef]
- Lin, Z.; Xu, H.; Yao, X.; Yang, C.; Yang, L. Exploring the relationship between thermal environmental factors and land surface temperature of a “furnace city” based on local climate zones. Build. Environ. 2023, 243, 110732. [Google Scholar] [CrossRef]
- Zhao, J.; Guo, F.; Zhang, H.; Dong, J. Mechanisms of non-stationary influence of urban form on the diurnal thermal environment based on machine learning and MGWR analysis. Sustain. Cities Soc. 2024, 101, 105194. [Google Scholar] [CrossRef]
- Lan, Y.; Zhan, Q. How do urban buildings impact summer air temperature? The effects of building configurations in space and time. Build. Environ. 2017, 125, 88–98. [Google Scholar] [CrossRef]
- Unsal, O.; Lotfata, A.; Avci, S. Exploring the Relationships between Land Surface Temperature and Its Influencing Determinants Using Local Spatial Modeling. Sustainability 2023, 15, 1594. [Google Scholar] [CrossRef]
- Chen, Y.; Yu, B.; Shu, B.; Yang, L.; Wang, R. Exploring the spatiotemporal patterns and correlates of urban vitality: Temporal and spatial heterogeneity. Sustain. Cities Soc. 2023, 91, 104440. [Google Scholar] [CrossRef]
- Li, J.; Li, J.; Yuan, Y.; Li, G. Spatiotemporal distribution characteristics and mechanism analysis of urban population density: A case of Xi’an, Shaanxi, China. Cities 2019, 86, 62–70. [Google Scholar] [CrossRef]
- Yang, X.; Zhao, Z.; Shi, C.; Luo, L.; Tu, W. The Dynamic Heterogeneous Relationship between Urban Population Distribution and Built Environment in Xi’an, China: A Case Study. Remote Sens. 2023, 15, 2257. [Google Scholar] [CrossRef]
- Long, Y.; Lu, Z.; Hu, S.; Luo, S.; Liu, X.; Shao, J.; Zheng, Y.; Liu, X. Study on Influencing Factors and Planning Strategies of Population Spatial Distribution in Urban Fringe Areas from the Perspective of Built Environment-The Case of Wuhan, China. Land 2023, 12, 1739. [Google Scholar] [CrossRef]
- Zhang, W.; Ji, C.; Yu, H.; Zhao, Y.; Chai, Y. Interpersonal and Intrapersonal Variabilities in Daily Activity-Travel Patterns: A Networked Spatiotemporal Analysis. ISPRS Int. J. Geo-Inf. 2021, 10, 148. [Google Scholar] [CrossRef]
- Liu, S.; Long, Y.; Zhang, L.; Liu, H. Quantifying and Characterizing Urban Leisure Activities by Merging Multiple Sensing Big Data: A Case Study of Nanjing, China. Land 2021, 10, 1214. [Google Scholar] [CrossRef]
- Du, H.; Zhan, W.; Liu, Z.; Wang, C.; Wang, S.; Li, L.; Li, J.; Bechtel, B.; Sismanidis, P. Weekly rhythms of urban heat islands: A multicity perspective. Sustain. Cities Soc. 2024, 106, 105385. [Google Scholar] [CrossRef]
- Yang, J.; Cao, J.; Zhou, Y. Elaborating non-linear associations and synergies of subway access and land uses with urban vitality in Shenzhen. Transp. Res. Part A Policy Pract. 2021, 144, 74–88. [Google Scholar] [CrossRef]
- Zou, D.; Li, Q.; Zhou, Y.; Liang, S.; Zhou, S. Understanding factors associated with individuals’ non-mandatory activities using machine learning and SHAP interpretation: A case study of Guangzhou, China. Travel Behav. Soc. 2025, 38, 100894. [Google Scholar] [CrossRef]
- Tao, T.; Wu, X.; Cao, J.; Fan, Y.; Das, K.; Ramaswami, A. Exploring the Nonlinear Relationship between the Built Environment and Active Travel in the Twin Cities. J. Plan. Educ. Res. 2023, 43, 637–652. [Google Scholar] [CrossRef]
- Lin, J.; Zhuang, Y.; Zhao, Y.; Li, H.; He, X.; Lu, S. Measuring the Non-Linear Relationship between Three-Dimensional Built Environment and Urban Vitality Based on a Random Forest Model. Int. J. Environ. Res. Public Health 2023, 20, 734. [Google Scholar] [CrossRef] [PubMed]
- Duan, Z.; Zhao, H.; Li, Z. Non-linear effects of built environment and socio-demographics on activity space. J. Transp. Geogr. 2023, 111, 103671. [Google Scholar] [CrossRef]
- Nwakaire, C.M.; Onn, C.C.; Yap, S.P.; Yuen, C.W.; Onodagu, P.D. Urban Heat Island Studies with emphasis on urban pavements: A review. Sustain. Cities Soc. 2020, 63, 102476. [Google Scholar] [CrossRef]
- Zhang, X.; Estoque, R.C.; Murayama, Y. An urban heat island study in Nanchang City, China based on land surface temperature and social-ecological variables. Sustain. Cities Soc. 2017, 32, 557–568. [Google Scholar] [CrossRef]
- Xiong, Q.; Chen, W.; He, L.; Luo, S.; Li, H. Study on the influencing factors and the spatiotemporal heterogeneity of Urban Heat Island effect in Nanchang City of China. J. Asian Archit. Build. Eng. 2023, 22, 1444–1457. [Google Scholar] [CrossRef]
- Che, Y.; Li, X.; Liu, X.; Wang, Y.; Liao, W.; Zheng, X.; Zhang, X.; Xu, X.; Shi, Q.; Zhu, J.; et al. 3D-GloBFP: The first global three-dimensional building footprint dataset. Earth Syst. Sci. Data 2024, 16, 5357–5374. [Google Scholar] [CrossRef]
- Perkins, S.E. A review on the scientific understanding of heatwaves-Their measurement, driving mechanisms, and changes at the global scale. Atmos. Res. 2015, 164, 242–267. [Google Scholar] [CrossRef]
- Fischer, E.M.; Schaer, C. Consistent geographical patterns of changes in high-impact European heatwaves. Nat. Geosci. 2010, 3, 398–403. [Google Scholar] [CrossRef]
- Anderson, G.B.; Bell, M.L.; Peng, R.D. Methods to Calculate the Heat Index as an Exposure Metric in Environmental Health Research. Environ. Health Perspect. 2013, 121, 1111–1119. [Google Scholar] [CrossRef]
- Heat Index Equation. 2022. Available online: http://www.wpc.ncep.noaa.gov/html/heatindex_equation.shtml (accessed on 10 October 2024).
- Zhou, M.; Wang, D.; Li, Q.; Yue, Y.; Tu, W.; Cao, R. Impacts of weather on public transport ridership: Results from mining data from different sources. Transp. Res. Part C Emerg. Technol. 2017, 75, 17–29. [Google Scholar] [CrossRef]
- Chun, B.; Guhathakurta, S. Daytime and nighttime urban heat islands statistical models for Atlanta. Environ. Plan. B Urban Anal. City Sci. 2017, 44, 308–327. [Google Scholar] [CrossRef]
- Xu, D.; Wang, Y.; Zhou, D.; Wang, Y.; Zhang, Q.; Yang, Y. Influences of urban spatial factors on surface urban heat island effect and its spatial heterogeneity: A case study of Xi’an. Build. Environ. 2024, 248, 111072. [Google Scholar] [CrossRef]
- Li, Z.; Hu, D. Exploring the relationship between the 2D/3D architectural morphology and urban land surface temperature based on a boosted regression tree: A case study of Beijing, China. Sustain. Cities Soc. 2022, 78, 103392. [Google Scholar] [CrossRef]
- Lundberg, S.M.; Lee, S.-I. A Unified Approach to Interpreting Model Predictions. In Proceedings of the 31st Annual Conference on Neural Information Processing Systems (NIPS), Long Beach, CA, USA, 4–9 December 2017. [Google Scholar]
- Heatstroke Prevention and Cooling Management Methods. 2012. Available online: http://www.nhc.gov.cn/zhjcj/s5852/201207/9871e8d92f1f4964975ad56bdeac94af.shtml (accessed on 22 January 2025).
- van Hoof, J.; Schellen, L.; Soebarto, V.; Wong, J.K.W.; Kazak, J.K. Ten questions concerning thermal comfort and ageing. Build. Environ. 2017, 120, 123–133. [Google Scholar] [CrossRef]
- Cheung, P.K.; Jim, C.Y. Comparing the cooling effects of a tree and a concrete shelter using PET and UTCI. Build. Environ. 2018, 130, 49–61. [Google Scholar] [CrossRef]
- Lu, J.; Li, Q.; Zeng, L.; Chen, J.; Liu, G.; Li, Y.; Li, W.; Huang, K. A micro-climatic study on cooling effect of an urban park in a hot and humid climate. Sustain. Cities Soc. 2017, 32, 513–522. [Google Scholar] [CrossRef]
- Top, S.; Milosevic, D.; Caluwaerts, S.; Hamdi, R.; Savic, S. Intra-urban differences of outdoor thermal comfort in Ghent on seasonal level and during record-breaking 2019 heat wave. Build. Environ. 2020, 185, 107103. [Google Scholar] [CrossRef]
- Zhang, Z.; Dong, J.; He, Q.; Ye, B. The Temporal Variation of the Microclimate and Human Thermal Comfort in Urban Wetland Parks: A Case Study of Xixi National Wetland Park, China. Forests 2021, 12, 1322. [Google Scholar] [CrossRef]
- Neidell, M.; Graff Zivin, J.; Sheahan, M.; Willwerth, J.; Fant, C.; Sarofim, M.; Martinich, J. Temperature and work: Time allocated to work under varying climate and labor market conditions. PLoS ONE 2021, 16, e0254224. [Google Scholar] [CrossRef]
- Yuan, S.; Zhang, J.; Xu, Z.; Tang, G.; Wang, C.; Chen, J. Response of Urban Heat Island Effect to Morphology Characteristics of Buildings and Its Diurnal Variation. Geogr. Geo-Inf. Sci. 2022, 38, 40–46. [Google Scholar]
- Hägerstrand, T. What about people in regional science. In Transport Sociology: Social Aspects of Transport Planning; de Boer, E., Ed.; Elsevier: Amsterdam, The Netherlands, 1970; pp. 143–158. [Google Scholar]
- Chan, A.P.C.; Yi, W. Heat stress and its impacts on occupational health and performance. Indoor Built Environ. 2016, 25, 3–5. [Google Scholar] [CrossRef]
- Krishnamurthy, M.; Ramalingam, P.; Perumal, K.; Kamalakannan, L.P.; Chinnadurai, J.; Shanmugam, R.; Srinivasan, K.; Venugopal, V. Occupational Heat Stress Impacts on Health and Productivity in a Steel Industry in Southern India. Saf. Health Work 2017, 8, 99–104. [Google Scholar] [CrossRef]
- Gibb, K.; Beckman, S.; Vergara, X.P.; Heinzerling, A.; Harrison, R. Extreme Heat and Occupational Health Risks. Annu. Rev. Public Health 2024, 45, 315–335. [Google Scholar] [CrossRef]
- Lai, W.; Qiu, Y.; Tang, Q.; Xi, C.; Zhang, P. The Effects of Temperature on Labor Productivity. Annu. Rev. Resour. Econ. 2023, 15, 213–232. [Google Scholar] [CrossRef]
- Fatima, S.H.; Rothmore, P.; Giles, L.C.; Varghese, B.M.; Bi, P. Extreme heat and occupational injuries in different climate zones: A systematic review and meta-analysis of epidemiological evidence. Environ. Int. 2021, 148, 106384. [Google Scholar] [CrossRef] [PubMed]
- Johansson, E.; Emmanuel, R. The influence of urban design on outdoor thermal comfort in the hot, humid city of Colombo, Sri Lanka. Int. J. Biometeorol. 2006, 51, 119–133. [Google Scholar] [CrossRef] [PubMed]
- Davies, M.G. Building Heat Transfer; John Wiley & Sons: Hoboken, NJ, USA, 2004. [Google Scholar]
- Martinez-de-Albeniz, V.; Belkaid, A. Here comes the sun: Fashion goods retailing under weather fluctuations. Eur. J. Oper. Res. 2021, 294, 820–830. [Google Scholar] [CrossRef]
- Derakhshan, S.; Bautista, T.N.; Bouwman, M.; Huang, L.; Lee, L.; Tarczynski, J.; Wahagheghe, I.; Zeng, X.; Longcore, T. Smartphone locations reveal patterns of cooling center use as a heat mitigation strategy. Appl. Geogr. 2023, 150, 102821. [Google Scholar] [CrossRef]
- Yang, Y.; Cao, C.; Bogoev, I.; Deetman, C.; Dietz, G.; Hang, J.; Howard, L.; Huang, X.; Kendall, N.; Lai, J.; et al. Regulation of humid heat by urban green space across a climate wetness gradient. Nat. Cities 2024, 1, 871–879. [Google Scholar] [CrossRef]


| Dimensions | Indicators | Description | References |
|---|---|---|---|
| Land use | Proportion of residential land | Proportion of residential land in the grid section | Zhao et al., 2017 [23] Li et al., 2019 [29] Yang et al., 2023 [30] Chun et al., 2017 [49] |
| Proportion of commercial and business land | Proportion of commercial and business land in the grid section | ||
| Proportion of green space | Proportion of green space in the grid section | ||
| Proportion of industrial land | Proportion of industrial land in the grid section | ||
| Proportion of water body | Proportion of water body in the grid section | ||
| Location | Distance from the city center | Distance from the center of the grid section to the city center | Gu et al., 2024 [6] Yang et al., 2023 [30] |
| Transportation | Distance to the subway station | Distance from the center of the grid section to the nearest subway station | Wu et al., 2020 [18] Jiang et al., 2023 [19] Yang et al., 2023 [30] Long et al., 2023 [31] |
| Building form | Building density | The ratio of total building coverage area to the area of the grid section | Zhao et al., 2024 [25] Lan et al., 2017 [26] Yang et al., 2023 [30] Long et al., 2023 [31] |
| Standard deviation of building height | Variation degree of the building height within the grid section | Lin et al., 2023 [24] Li et al., 2022 [51] | |
| Building height | Average building height within the grid section | Liu et al., 2024 [22] Lin et al., 2023 [24] Xu et al., 2024 [50] Li et al., 2022 [51] |
| Models | RMSE | MAE | R2 | |
|---|---|---|---|---|
| Weekday daytime | OLS | 0.091 | 0.065 | 0.290 |
| RF | 0.074 | 0.045 | 0.474 | |
| XGBoost | 0.055 | 0.035 | 0.729 | |
| Weekday nighttime | OLS | 0.092 | 0.062 | 0.321 |
| RF | 0.096 | 0.062 | 0.589 | |
| XGBoost | 0.048 | 0.032 | 0.845 | |
| Weekend daytime | OLS | 0.082 | 0.060 | 0.248 |
| RF | 0.085 | 0.062 | 0.448 | |
| XGBoost | 0.053 | 0.036 | 0.679 | |
| Weekend nighttime | OLS | 0.091 | 0.063 | 0.305 |
| RF | 0.086 | 0.055 | 0.522 | |
| XGBoost | 0.060 | 0.038 | 0.785 |
| Weekday Daytime | Weekday Nighttime | Weekend Daytime | Weekend Nighttime | |
|---|---|---|---|---|
| |PCDH| ≥ 10% | 158 | 201 | 202 | 235 |
| 10% > |PCDH| ≥ 5% | 188 | 215 | 258 | 304 |
| |PCDH| < 5% | 880 | 773 | 751 | 633 |
| The total number of grid cells | 1226 | 1189 | 1211 | 1172 |
Disclaimer/Publisher’s Note: The statements, opinions and data contained in all publications are solely those of the individual author(s) and contributor(s) and not of MDPI and/or the editor(s). MDPI and/or the editor(s) disclaim responsibility for any injury to people or property resulting from any ideas, methods, instructions or products referred to in the content. |
© 2025 by the authors. Licensee MDPI, Basel, Switzerland. This article is an open access article distributed under the terms and conditions of the Creative Commons Attribution (CC BY) license (https://creativecommons.org/licenses/by/4.0/).
Share and Cite
Chen, Z.; Wei, Z. The Impacts of Heatwaves on Population Distribution in the Subtropical City: A Case Study of Nanchang, China. Land 2025, 14, 1209. https://doi.org/10.3390/land14061209
Chen Z, Wei Z. The Impacts of Heatwaves on Population Distribution in the Subtropical City: A Case Study of Nanchang, China. Land. 2025; 14(6):1209. https://doi.org/10.3390/land14061209
Chicago/Turabian StyleChen, Zixun, and Zongcai Wei. 2025. "The Impacts of Heatwaves on Population Distribution in the Subtropical City: A Case Study of Nanchang, China" Land 14, no. 6: 1209. https://doi.org/10.3390/land14061209
APA StyleChen, Z., & Wei, Z. (2025). The Impacts of Heatwaves on Population Distribution in the Subtropical City: A Case Study of Nanchang, China. Land, 14(6), 1209. https://doi.org/10.3390/land14061209