Article

Are We Satisfied with the Achievements of New Eco-City Construction in China? A Case Study of the Sino-Singapore Tianjin Eco-City

1
Zhou Enlai School of Government, Nankai University, Tianjin 300350, China
2
Laboratory of Digital City Governance, Nankai University, Tianjin 300350, China
3
School of Humanities and Social Science, Harbin Institute of Technology, Shenzhen 518055, China
4
School of Architecture and Planning, Massachusetts Institute of Technology, Cambridge, MA 02139, USA
5
Management Committee of the Sino-Singapore Tianjin Eco-City, Tianjin 300480, China
*
Author to whom correspondence should be addressed.
Land 2025, 14(6), 1225; https://doi.org/10.3390/land14061225
Submission received: 14 April 2025 / Revised: 26 May 2025 / Accepted: 27 May 2025 / Published: 6 June 2025
(This article belongs to the Special Issue Ecology of the Landscape Capital and Urban Capital)

Abstract

With the goal of sustainable urbanization, eco-cities have garnered significant global attention in recent decades. Unlike eco-city renovation or renewal, the construction of a new eco-city represents a comprehensive urbanization process that integrates environmental sustainability with livability. To evaluate the outcomes of new eco-city construction in China, this study employs a dual approach combining objective achievements and residents’ subjective satisfaction to systematically examine the Sino-Singapore Tianjin Eco-City. The analysis encompasses five dimensions: environmental amenity, life safety, residential functionality, traffic capability, and economic well-being, with the relative weights of specific indicators determined through the entropy method, expert scoring, and analytic hierarchy process. The findings reveal that based on objective indicators, the eco-city’s overall performance nearly doubled during its first phase of development, with life safety showing the most notable improvements. However, subjective assessments revealed that overall resident satisfaction remained below 70%, with residential functionality receiving the highest rating. The annual progress of the eco-city did not consistently align with residents’ needs, and no clear correlation was found between the eco-city’s current state and public sentiment. For sustainable development, the eco-city must address its shortcomings and better cater to residents’ demands across various dimensions through targeted and effective strategies.

1. Introduction

Recent decades have witnessed rapid urbanization alongside worsening environmental conditions in numerous countries [1]. With half of the world’s population now residing in urban areas, city development often prioritizes short-term economic gains and relies on intrusive consumption and production practices, significantly undermining environmental sustainability [2]. High emissions, extensive land use, and uncontrolled urban sprawl are key drivers of unsustainable urbanization. To address these challenges, various solutions, such as the green economy, smart growth, and compact development, have been proposed [3,4,5]. Among these approaches, the concept of the eco-city, an integration of multiple strategies for sustainable urbanization, has garnered particular attention [6,7].
Regarded as a “technological fix”, eco-city initiatives have been implemented worldwide, focusing primarily on environmental regeneration, economic transformation, and sustainable urban development [8]. Examples include the development of green buildings and clean energy industries in Freiburg, Germany, and the ecological redevelopment of industrial areas in Hammarby, Sweden [9,10]. Some eco-cities have emphasized social sustainability and public welfare, such as community rebuilding programs in Aswan, Egypt [11]. Others have prioritized ecological construction methods, such as the U-City plan in Songdo, South Korea, which integrates smart city technologies with eco-city principles [12]. Based on different ideas, most eco-cities worldwide have expanded from existing urban areas or retrofitted existing infrastructure, while only a small fraction have been constructed on undeveloped land [13]. Notable among these is Masdar City in Abu Dhabi, a solar-powered eco-city built in the desert [14].
China’s eco-city projects, though late to start, have developed rapidly [15]. Over the past 30 years, China has established more than 100 eco-cities, incorporating advanced planning concepts, a strong emphasis on human–nature relationships, and a focus on improving livability [16,17,18,19]. The turning point for eco-city construction in China came in 2002 during the Fifth International Conference on Eco-Cities in Shenzhen, which marked the transition from theoretical discussion to practical implementation. Building on this momentum, several landmark projects have emerged, each showcasing unique approaches to eco-city development. The Dongtan Eco-City and the Chongming Eco-Island in Shanghai, for instance, feature forward-looking planning for self-sufficient development with green technologies [20]. The Caofeidian International Eco-City highlighted the use of technology in urban construction, embodying several characteristics of techno-cities [21]. Suzhou focused on eco-industrial park development with strict environmental regulations and an increased emphasis on the tertiary sector in economic growth [22]. Rizhao pursued a circular economy eco-city model, enhancing resource efficiency and reducing environmental burdens [23]. Notably, the Sino-Singapore Tianjin Eco-City, the first state-level cooperative project of its kind, has been a pioneer in environmental protection, resource conservation, and improving living conditions. However, these eco-city projects have also faced critical discussions regarding multiple aspects, such as insufficient social resilience, unfulfilled spatial rights for urban poor populations, lack of concrete pathways for public participation and democratic decision-making mechanisms, raising concerns about the actual effectiveness of eco-city construction [24,25,26].
To evaluate the effectiveness of eco-city construction, various index systems have been proposed [27,28]. Unlike traditional urban indices, which emphasize economic growth, eco-city indices focus on the sustainable development of entire urban systems [29,30,31]. These assessments typically consider ecological, social, and economic dimensions [32]. Many eco-cities have developed their own Key Performance Indicators (KPIs) to measure progress and environmental changes [33,34]. While these indices effectively capture objective achievements, they often fail to reflect residents’ satisfaction.
In the meantime, for a better understanding of the public perceptions of eco-city construction, studies have also examined subjective assessments of ongoing projects. Surveys in European cities have shown that residents’ perceptions correlate with eco-efficiency, reflecting the integration of ecological and socio-economic practices [35]. In China, field surveys have explored community-level perceptions of eco-urbanization and investigated residents’ needs and satisfaction through questionnaires [36,37]. Recent years have seen increasing attention to the social impacts of eco-cities, yet no universal standard for people-oriented eco-city construction has been established [38].
To fill these gaps, this study attempts to amplify the otherwise muted voices of residents by incorporating public feedback into the eco-city evaluation framework. By systematically juxtaposing subjective satisfaction with objective performance metrics, it assesses both the actual efficacy of newly constructed eco-city projects and the limitations of technocratic indicators. In addition, this study identifies key challenges and offers policy recommendations to advance the sustainable development of eco-cities. In doing so, it refines critical discussions on eco-city models under authoritarian contexts and contributes context-sensitive insights to the broader international debates on sustainable urbanism.
The remainder of this paper is organized as follows. Section 2 outlines the research materials and methods, evaluating the efficacy of new eco-city development through a dual analytical framework: objective achievement and subjective satisfaction. Section 3 visually synthesizes the empirical findings, presenting comparative results for both objective and subjective indicators. Section 4 critically examines the (dis)parities between these indicators, highlighting systemic challenges in current eco-city planning and offering policy-relevant recommendations to enhance urban sustainability. Finally, Section 5 concludes by consolidating key insights and their implications for future research and practice.

2. Materials and Methods
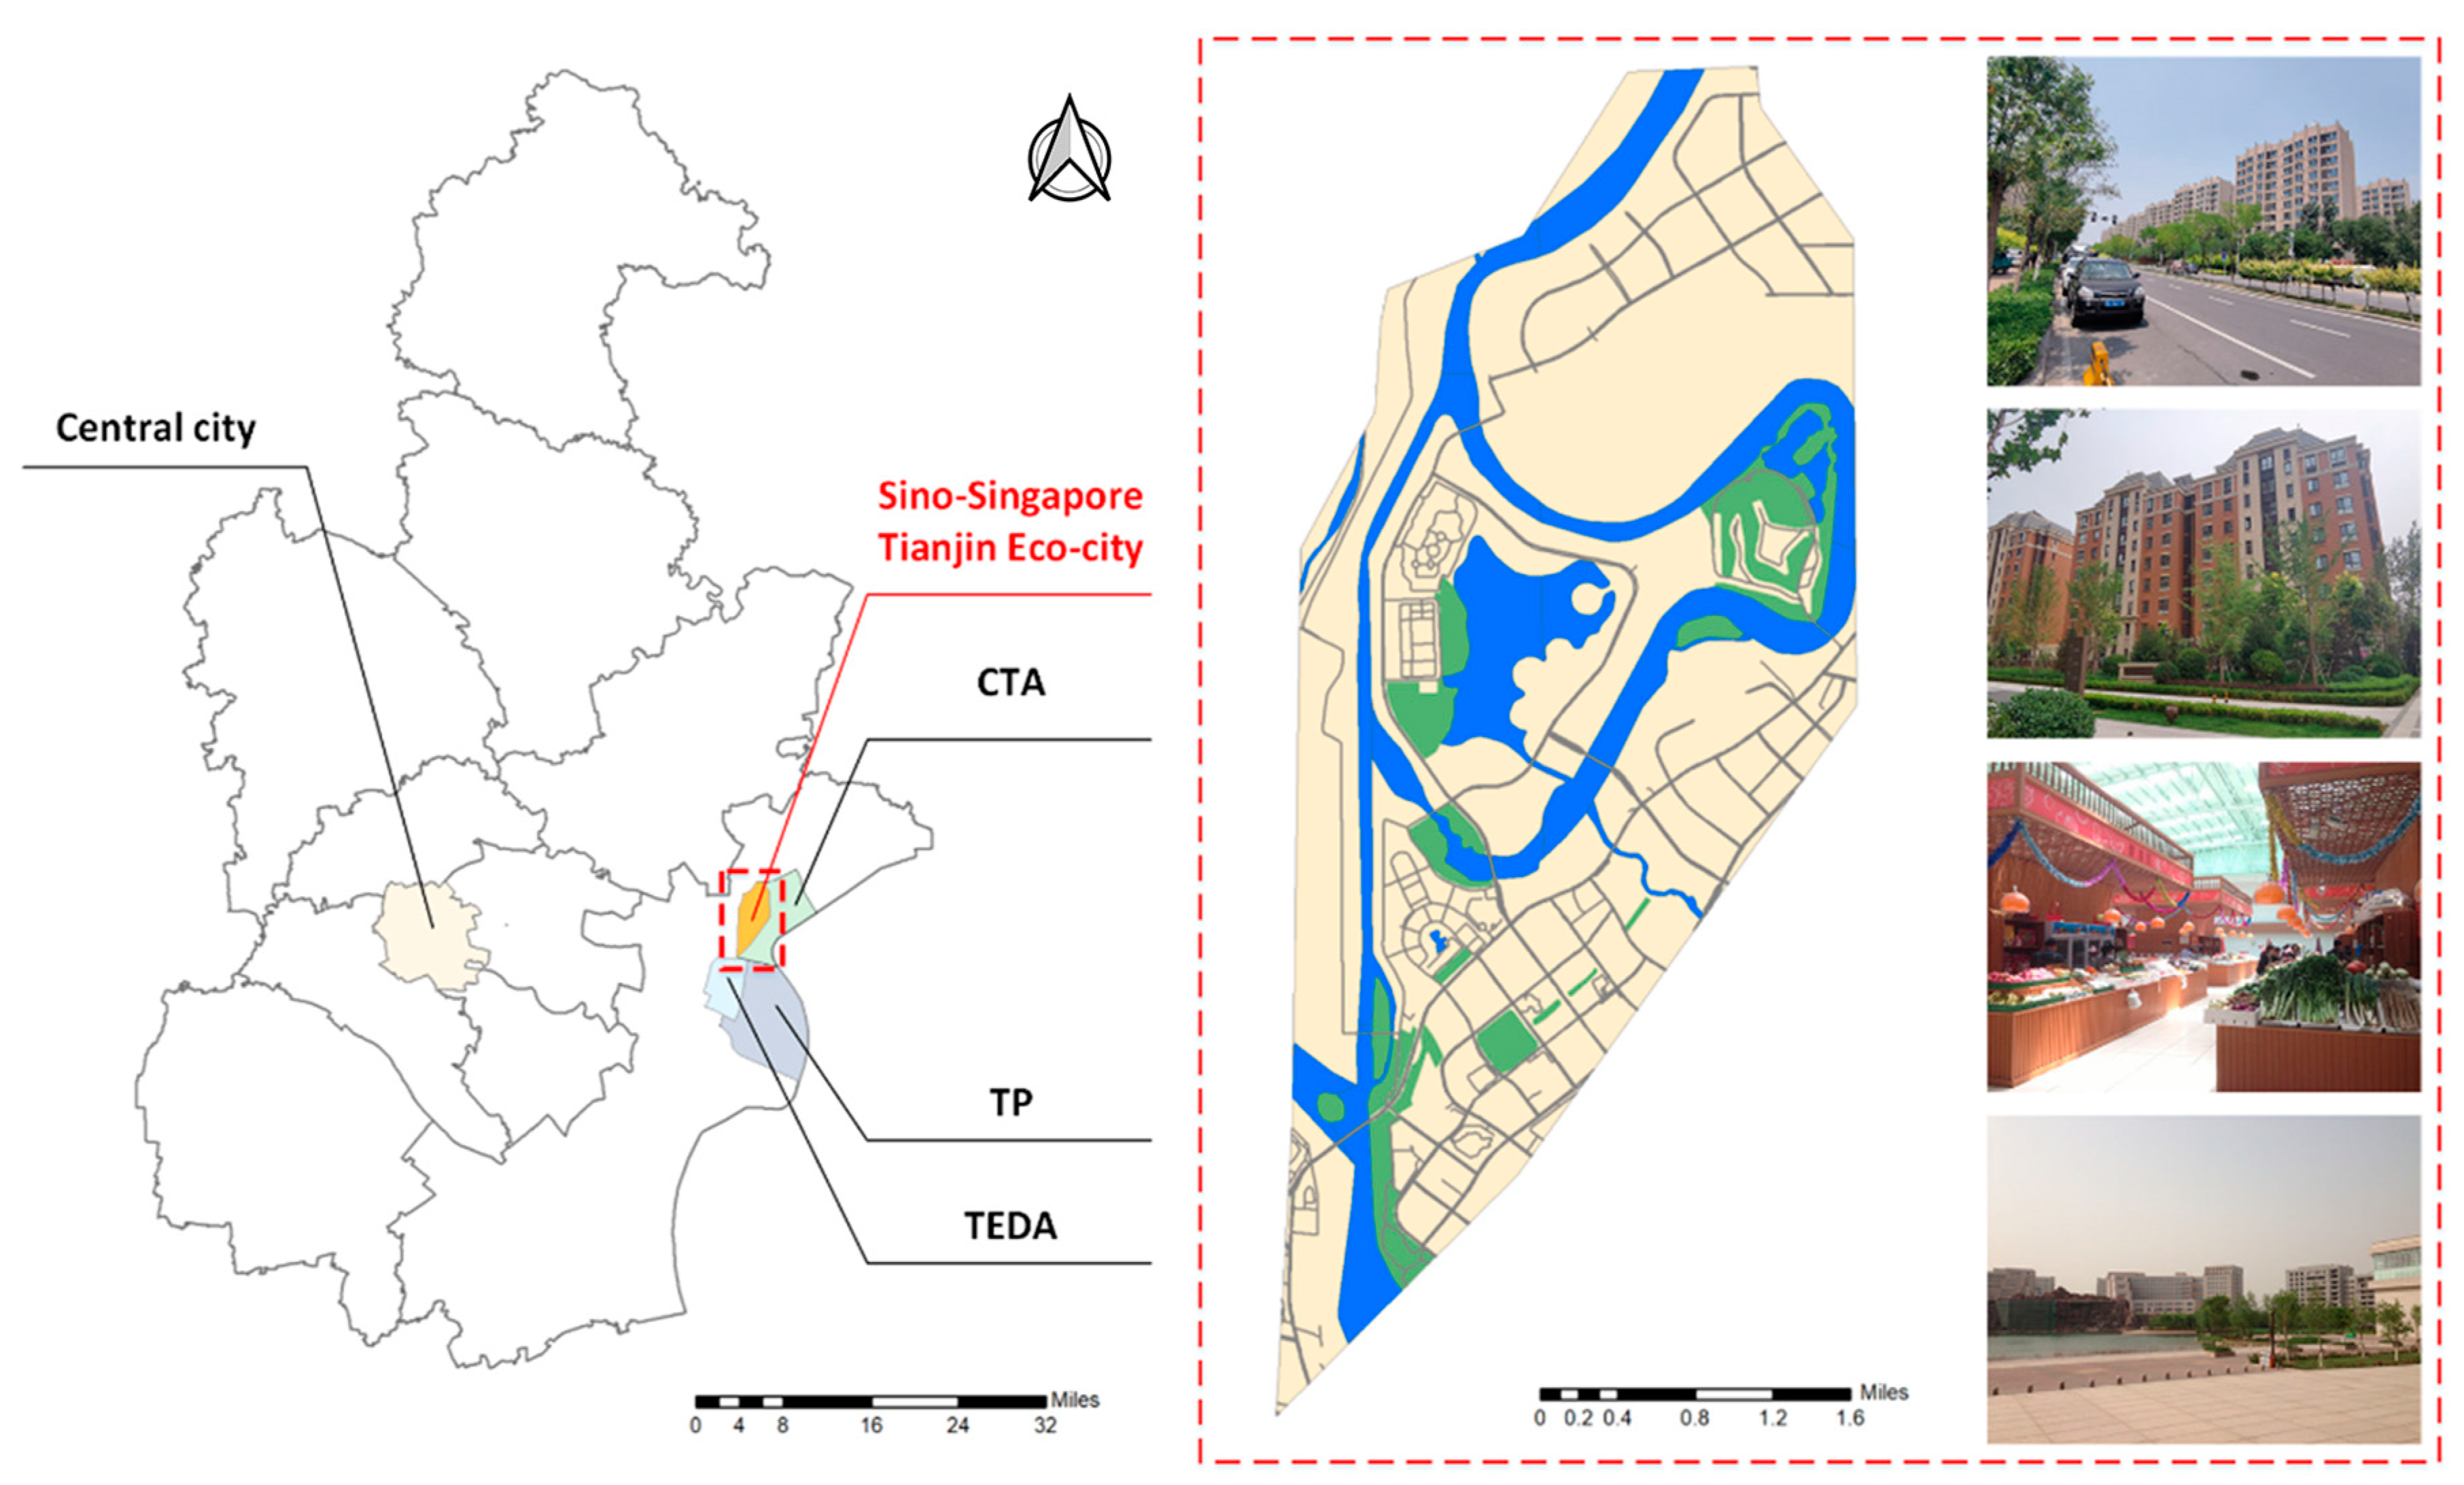
2.1. Materials

The Sino-Singapore Tianjin Eco-City is located in the Binhai New Area of Tianjin, 45 km away from the central city, and adjacent to the Coastal Tourist Area (CTA), the Tianjin Port (TP), and the Tianjin Economic–Technological Development Area (TEDA) (see Figure 1). With the goal of building an ecological and livable city on deserted land, the planning scheme was triggered in 2007. It has been planned to cover an area of 30 square kilometers and accommodate a population of 350,000, and the advantageous transportation with high-speed, aviation, railway, and sea routes laid a good foundation for the economic and social development of the city.
With an emphasis on sustainable development and ecological environment protection, the Sino-Singapore Tianjin Eco-City is committed to green economy in industry development, and special priority is given to the enterprises with high-tech content and high added values. By 2018, the number of market entities had surpassed 8300, around 50% of which were Internet, technological, cultural, and creative companies. Meanwhile, the number of financial enterprises had reached 1198, along with the registered capital of CNY 159.3 billion.
For the enhancement of living conditions and ecosystem stability, the Sino-Singapore Tianjin Eco-City upholds the basic idea of human and natural harmony in the whole process of urban development. On the one hand, it adopts Singapore’s “neighborhood unit” concept and establishes a three-level residential system, within which public facilities are allocated at different scales of space to satisfy the diversified needs of residents in daily life. On the other hand, it enforces strict controls on energy use and emissions and promotes a number of ecological restoration projects during these years. By 2018, 13 kindergartens, 6 primary schools, 2 middle schools, 1 large general hospital, and several commercial centers and parks had been constructed and put into use. The proportion of green buildings in the eco-city has reached 100%, along with the ratio of green travel reaching 90%. It has successfully built a complex ecosystem of lake, river, wetland, and green space, and the total green area of the city has reached 7 million square meters. Furthermore, the garbage classification has been carried out, fulfilling the harmless treatment of household waste there.
However, setting aside the positive works above, the development of the new eco-city also faces many challenges nowadays. Among all of them, the slow population growth is one of the most prominent, where its current population of 100,000 is still far less than the anticipated number of 350,000. In this context, the subjective satisfaction of residents has been gaining more and more attention in recent years. Therefore, this study seeks to amplify residents’ voices by adopting a mutual-validation approach that cross-examines subjective satisfaction data and objective achievement data to assess the actual performance of eco-city construction. On the one hand, we conducted a 20-day random sampling survey, distributing and collecting over 1000 questionnaires to gather residents’ subjective evaluations. On the other hand, objective achievement data were obtained from statistical yearbooks and government portals. All the raw data—both subjective and objective—underwent standardized preprocessing prior to analysis.

2.2. Methods

To investigate the actual efficacy of new eco-city construction, we developed an analytical framework to visualize the methodological sequencing (see Figure 2).
Multidimensional analysis serves as a robust methodological approach for evaluating the performance of eco-city construction. Guided by the principles of sustainability and livability, this study evaluates the outcomes of new eco-city construction through both objective achievements and residents’ subjective satisfaction across five key dimensions: environmental amenity, life safety, residential functionality, traffic capability, and economic well-being. Environmental amenity, a fundamental component of eco-cities, embodies the harmonious integration between the urban environment and the society [39]. While life safety and residential functionality demonstrate the livability of a city in people’s daily life, traffic capability and economic well-being largely determine the living conditions of residents with respect to economic and social life [40,41,42,43]. The specific indicators and surveyed elements corresponding to each dimension will be elaborated on in subsequent sections.

2.2.1. Objective Achievement Assessment

Drawing upon existing evaluation frameworks documented in statistical yearbooks and the scholarly literature [44,45,46], this study selects specific indicators from the aforementioned five dimensions (see Table 1) to objectively assess the outcomes of eco-city construction. This research comprehensively incorporates both positive and negative indicators, standardizing the data to ensure comparability across metrics. Furthermore, the entropy method is employed to determine the relative weights of each indicator.
Specifically, environmental amenity indicators focus on measuring environmental improvement and protection outcomes, primarily encompassing three aspects: air quality, waste disposal rate, and livability. Life safety is operationalized through various metrics related to socio-economic activities, including emergency facilities and accident-related losses. Residential functionality indicators capture multifaceted living conditions, incorporating education, healthcare, cultural amenities, and social interaction opportunities. Traffic capability indicators primarily reflect the development and operational status of public transit systems, including both transportation networks and specific modes of transport. Economic well-being, meanwhile, is measured through indicators such as income levels, expenditure patterns, and coverage rates of various social welfare programs.
Due to the different data types and units, the selected indicators are not comparable in their original forms. Thus, it is required that the indicators be normalized before data treatments. Distinguishing between the indicators with positive meanings (e.g., X11, X12) and indicators with negative meanings (e.g., X22, X23), a dichotomous approach for data normalization is adopted here.
Assuming that there are n indicators for evaluation, the states of the eco-city in m years can be expressed as a matrix C = c i j m × n     i = 1 , 2 , , m ; j = 1 , 2 , , n , and the normalized dataset Q = q i j m × n is able to be calculated with the following formula:
Positive Indicator:
q i j = c i j s j ( i = 1 , 2 , , m ; j = 1 , 2 , , n )
Negative Indicator:
q i j = s j c i j ( i = 1 , 2 , , m ; j = 1 , 2 , , n )
where cij and qij are the original value and the normalized value of the jth indicator in the ith year, respectively, and sj is the standard value of the jth indicator.
After data normalization, the entropy method is then employed to determine the relative weights of the indicators. Different from subjective weighting methods, the entropy method is purely based on the data themselves and has a sound theoretical basis for the evaluation of objective changes [47]. The higher the degree of the value change is, the bigger the weight of the corresponding indicator would be, reflecting a greater contribution to the ultimate result; otherwise, it is smaller. Mathematically, the weight of each indicator can be calculated with the following formula:
p i j = I n d i j i = 1 m I n d i j
e j = - k i = 1 m p i j ln ( p i j )
w j = 1 - e j j = 1 n ( 1 e j )
where Indij stands for the index value of the jth indicator in the ith year, pij is the proportion of the jth indicator’s index value on the basis of the accumulative value of all the related indicators in the ith year, ej is the entropy of the jth indicator, and wj is the jth indicator’s relative weight. k is the Boltzmann constant, which satisfies k = 1/ln(m). As for the index value Indij, when it corresponds to a second-level indicator, Indij = qij.
According to the grouping and layered relationships of indicators, the index values were calculated hierarchically for the assessment of the eco-city’s achievements at different levels. First, with the index values and the weights of the second-level indicators in different groups, the index values of the first-level indicators were calculated. Second, based on the indexes of all the first-level indicators and their relative weights calculated with the entropy method, a comprehensive index was obtained as the overall assessment of the eco-city. The numerical calculation process of the indexes is as follows:
I n d i u = j = 1 N u m ( u ) ( w j ( u ) × I n d i j ( u ) )
I n d i = u = 1 D ( w u × I n d i u )
where Indiu and Indi stand for the index value of the uth first-level indicator and the comprehensive index value of the eco-city in the ith year, respectively, Num (u) represents the number of subordinate second-level indicators of the uth first-level indicator, Indij (u) is the ith year’s index value of the jth subordinate indicator of the uth first-level indicator, wj (u) is the weight of the jth indicator among all the subordinate indicators of the uth first-level indicator, and wu is the relative weight of the uth indicator among all the D number of first-level indicators of the eco-city. In our study, D = 5.

2.2.2. Subjective Satisfaction Investigation

To evaluate residents’ subjective satisfaction with the new eco-city construction, this study conducted a comprehensive random sampling survey (20-day duration) covering five representative residential communities in the Sino-Singapore Tianjin Eco-City, collecting 1000 valid responses from 1152 distributed questionnaires (86.81% response rate). Aside from the personal attributes of respondents, the topics and elements of the survey were designed in accordance with the indicators for objective assessment (see Table 2). Each topic involved several elements, and each element could be rated in five grades, which were “very satisfied”, ”satisfied”, “neutral”, “dissatisfied”, and “very dissatisfied”. For specialized urban performance indicators beyond general public knowledge, the study employed adapted measurement approaches—assessing “life safety” through safety situation indicators and evaluating “traffic capability” via both purposeful travel and non-commuting daily travel. This methodological design ensures the subjective investigation maintains conceptual consistency with the objective assessment framework while effectively capturing residents’ lived experiences of eco-city construction.
As a reflection of subjective demand intensities, the weights of factors (topics or elements) in different levels were determined by means of expert scoring and the analytic hierarchy process (AHP) method. Through pairwise comparison of related factors, the corresponding judgement matrix of experts A = {aij}N×N was established. When the judgement matrix passed the consistency test, the weights of the elements W = {wi}N could be calculated with the following formula:
a i ¯ = j = 1 N a i j N
w i = a i ¯ i = 1 N a i ¯
where N is the number of related factors for discussion, aij represents the relative importance of the ith factor compared with the jth factor, a i ¯ stands for the average importance of the ith factor, and wi is the weight of the ith factor.
According to the grouping and layered relationships of different factors, several judgement matrices were determined by experts independently at different levels, and a hierarchical set of weights was able to be calculated. With the surveyed results and the hierarchical weights obtained, the satisfaction of residents was summarized in different dimensions and also as a whole. For the integrity of the results, the fuzzy comprehensive evaluation (FCE) method was adopted in the process of satisfaction summarization, which can be expressed as the following functions:
B u = W ( u ) × B 1 ( u ) B 2 ( u ) B N u m ( u ) ( u ) = ( w 1 ( u ) , w 2 ( u ) , , w N u m ( u ) ( u ) ) × b 11 ( u ) b 11 ( u ) b 1 G ( u ) b 21 ( u ) b 21 ( u ) b 2 G ( u ) b N u m ( u ) 1 ( u ) b N u m ( u ) 2 ( u ) b N u m ( u ) G ( u )
B = W × B 1 B 2 B D = ( w 1 , w 2 , , w D ) b 11 b 12 b D G b 21 b 22 b 2 G b D 1 b D 2 b D G
where B = {bi, b2,..., bG} and Bu = {bu1, bu2,..., buG} stand for the fuzzy sets of the overall satisfaction value and the satisfaction of residents in the dimension of the uth topic, respectively. G is the number of grades for subjective scoring, Num (u) represents the number of surveyed elements of the uth topic, Bi (u) = {bi1 (u), bi2 (u),..., biG (u)} is the fuzzy set of the assessment of the ith subordinate element of the uth topic, W (u) = {w1 (u), w2 (u), ..., wNum (u) (u)} is the weight vector of the subordinate elements of the uth topic, and W = {w1, w2, ..., wD} is the weight vector of all the D number of topics for investigation. In our study, G = 5, D = 5.
Furthermore, with the grade-score mapping vector M = {m1, m2,..., mG}, each fuzzy set Bi = {bi1, bi2,..., biG} can be converted to a specific score, intuitively reflecting the subjective satisfaction degree of residents. The calculation process is as follows:
v i = M × B i T = ( m 1 , m 2 , , m G ) b i 1 b i 2 b i G
where vi stands for the score of residents’ satisfaction in some i dimension, corresponding to a certain topic of the subjective survey or the overall state of the eco-city. In our study, the grade-score mapping vector M was set as {100, 75, 50, 25, 0}, representing differentiated degrees of satisfaction with equal intervals. Based on the specified vector M, vi will fall in the range of [0, 100]. A score of 0 means being totally dissatisfied, a score of 100 means being totally satisfied, and a score of 50 indicates a neutral attitude.

3. Results

3.1. Objective Achievements of Eco-City Construction

The original data for objective achievement assessment were collected from the Tianjin Statistics Yearbook, the Statistics Yearbook of Tianjin Binhai New Area, and government websites. Taking the statistics in 2010 as the standard values of indicators, the original data were normalized by means of the method presented in Section 2.2.1, and the results during the first phase of the city construction, from 2010 to 2017, are shown in Table 3.
Based on the normalized dataset, the entropies and weights of indicators at different levels were calculated (see Table 4). According to the entropy weights obtained, the improvement of life safety (X2) and residential functionality (X3) actually played a prominent role in the eco-city construction during 2010–2017. By contrast, the effects of environmental amenity (X1) improvement were relatively weak, especially in the aspects of household waste disposal rate (X14), green coverage rate in built-up areas (X15), and population density of built-up areas (X17).
With the normalized data and the weights of the indicators, the objective achievements of the Sino-Singapore Tianjin Eco-City in different dimensions were able to be quantitatively assessed, and an integrated assessment was obtained in the end. Judging from the results, the new eco-city has obviously made significant improvements in the recent decade. With a steady growth, the integrated assessment had almost doubled during 2010–2017 (see Table 5).
However, in different dimensions, the developments actually progressed at different paces (see Figure 3). Under continuous development, the eco-city obtained the most notable achievements in life safety. While the traffic capability was improved at a relatively uniform pace during these years, the developments in residential functionality mainly happened in the later stage. Except for the universal growth in the period of 2010–2011, the developments in economic well-being alternated with those in environmental amenity, but the achievements in environmental amenity generally lagged behind due to the slowing down and stagnation of developments in 2013, 2014, and 2017.

3.2. Subjective Satisfaction of Residents

To ensure the representativeness of the subjective investigation, the questionnaire survey was conducted by means of random sampling in different residential communities of the Sino-Singapore Tianjin Eco-City. From 10 April 2019 to 30 April 2019, 1152 copies of the questionnaire were sent out, and 1096 responses were received. Removing incomplete ones from the received questionnaires, 1000 valid samples were ultimately obtained.
Overall, the surveyed population showed specific demographic characteristics (see Figure 4). Among the 1000 valid respondents, males and females were roughly balanced, young ages made up the majority, and well-educated people were the mainstream. While most of the respondents were from a family of three or four people, the ones from a family of one or two people also accounted for more than one-third of the surveyed population. Almost half of the residents were able to make a salary of CNY 4000–6000, and only 3% of the population earned less than CNY 2000.
According to the respondents’ answers, most of the residents were generally satisfied with the eco-city’s current state (see Figure 5). Except for the endowment insurance level (EIL), all the other elements’ satisfaction ratios (satisfied and very satisfied) were over 50%. Especially for the ecological environment quality (EEQ), community green space (CGS), community safety situation (CSS), and convenience of medical treatment (CMT), the satisfaction ratios were even over 80%. The convenience of medical treatment (CMT) won the most positive votes. However, there were also elements with high dissatisfaction ratios. Over 10% of people were very dissatisfied with the traffic in daily life (TDL), traveling to study and work (TSW), and endowment insurance level (EIL).
Following the AHP method, 15 scholars in urban planning and 10 experts involved in the eco-city construction were invited to decide the relative importance of each factor in the subjective survey. The factors in different levels were compared through the Saaty 1–9 scaling approach, and judgement matrices of the surveyed topics and elements were constructed. With the formula presented in Section 2.2.2, the hierarchical weights were then calculated (see Table 6).
Based on the surveyed results and the hierarchical weights obtained, the satisfaction levels of residents with different topics and the overall state of the eco-city were calculated with the FCE method (see Figure 6). Judging from the overall satisfaction, a ratio of over 60% were satisfied and very satisfied with the current state of the eco-city. While environmental amenity and residential functionality received relatively high marks, traffic capability and economic well-being were not very satisfactory.
Converting the fuzzy results to specific scores, the subjective satisfaction of residents was intuitively measured (see Figure 7). The overall score was 70.08, indicating that there was still a lot of room for progress in the future. While the score of residential functionality was near 80, significantly above the overall score, the scores of traffic capability and economic well-being were just over 60, obviously below the overall score. Furthermore, the scores of life safety and environmental amenity were similar to the overall score.

4. Discussion and Implications

4.1. Correspondence Between the Achievements and People’s Satisfaction

With reference to the objective indicators, the Sino-Singapore Tianjin Eco-City attained enormous achievements during 2010–2017. However, judging from the results of the subjective survey, the satisfaction of residents was not as good as the achievements obtained. There was a poor correspondence between the two in many aspects.

4.1.1. Annual Developments and Demands

In terms of the construction process, the eco-city’s annual developments did not well conform with people’s demands, which was represented by the subjective weights in different dimensions (see Figure 8). Numerically, the correlation coefficient between the changes in the objective indicators and the subjective weights never exceeded 0.50 during 2010–2017.
In 2015–2016, the objective developments and the subjective weights fitted best, where the corresponding correlation coefficient was 0.45. However, just one year prior, in 2014–2015, the two fitted worst, and the correlation coefficient was −0.43. Although the development focus varied over time, the ultimate achievements in different dimensions were relatively balanced by 2017. Among all the dimensions, life safety occupied the highest subjective weight, but it achieved the biggest improvement only in 2010–2011. Comparatively, economic well-being received the lowest weight, but its objective achievement increased significantly in 2010–2011 and 2012–2013. Not restricted by the biased demands, the eco-city generally developed with a shift in focus from environmental amenity to life safety and economic well-being, and then to residential functionality and traffic capability.

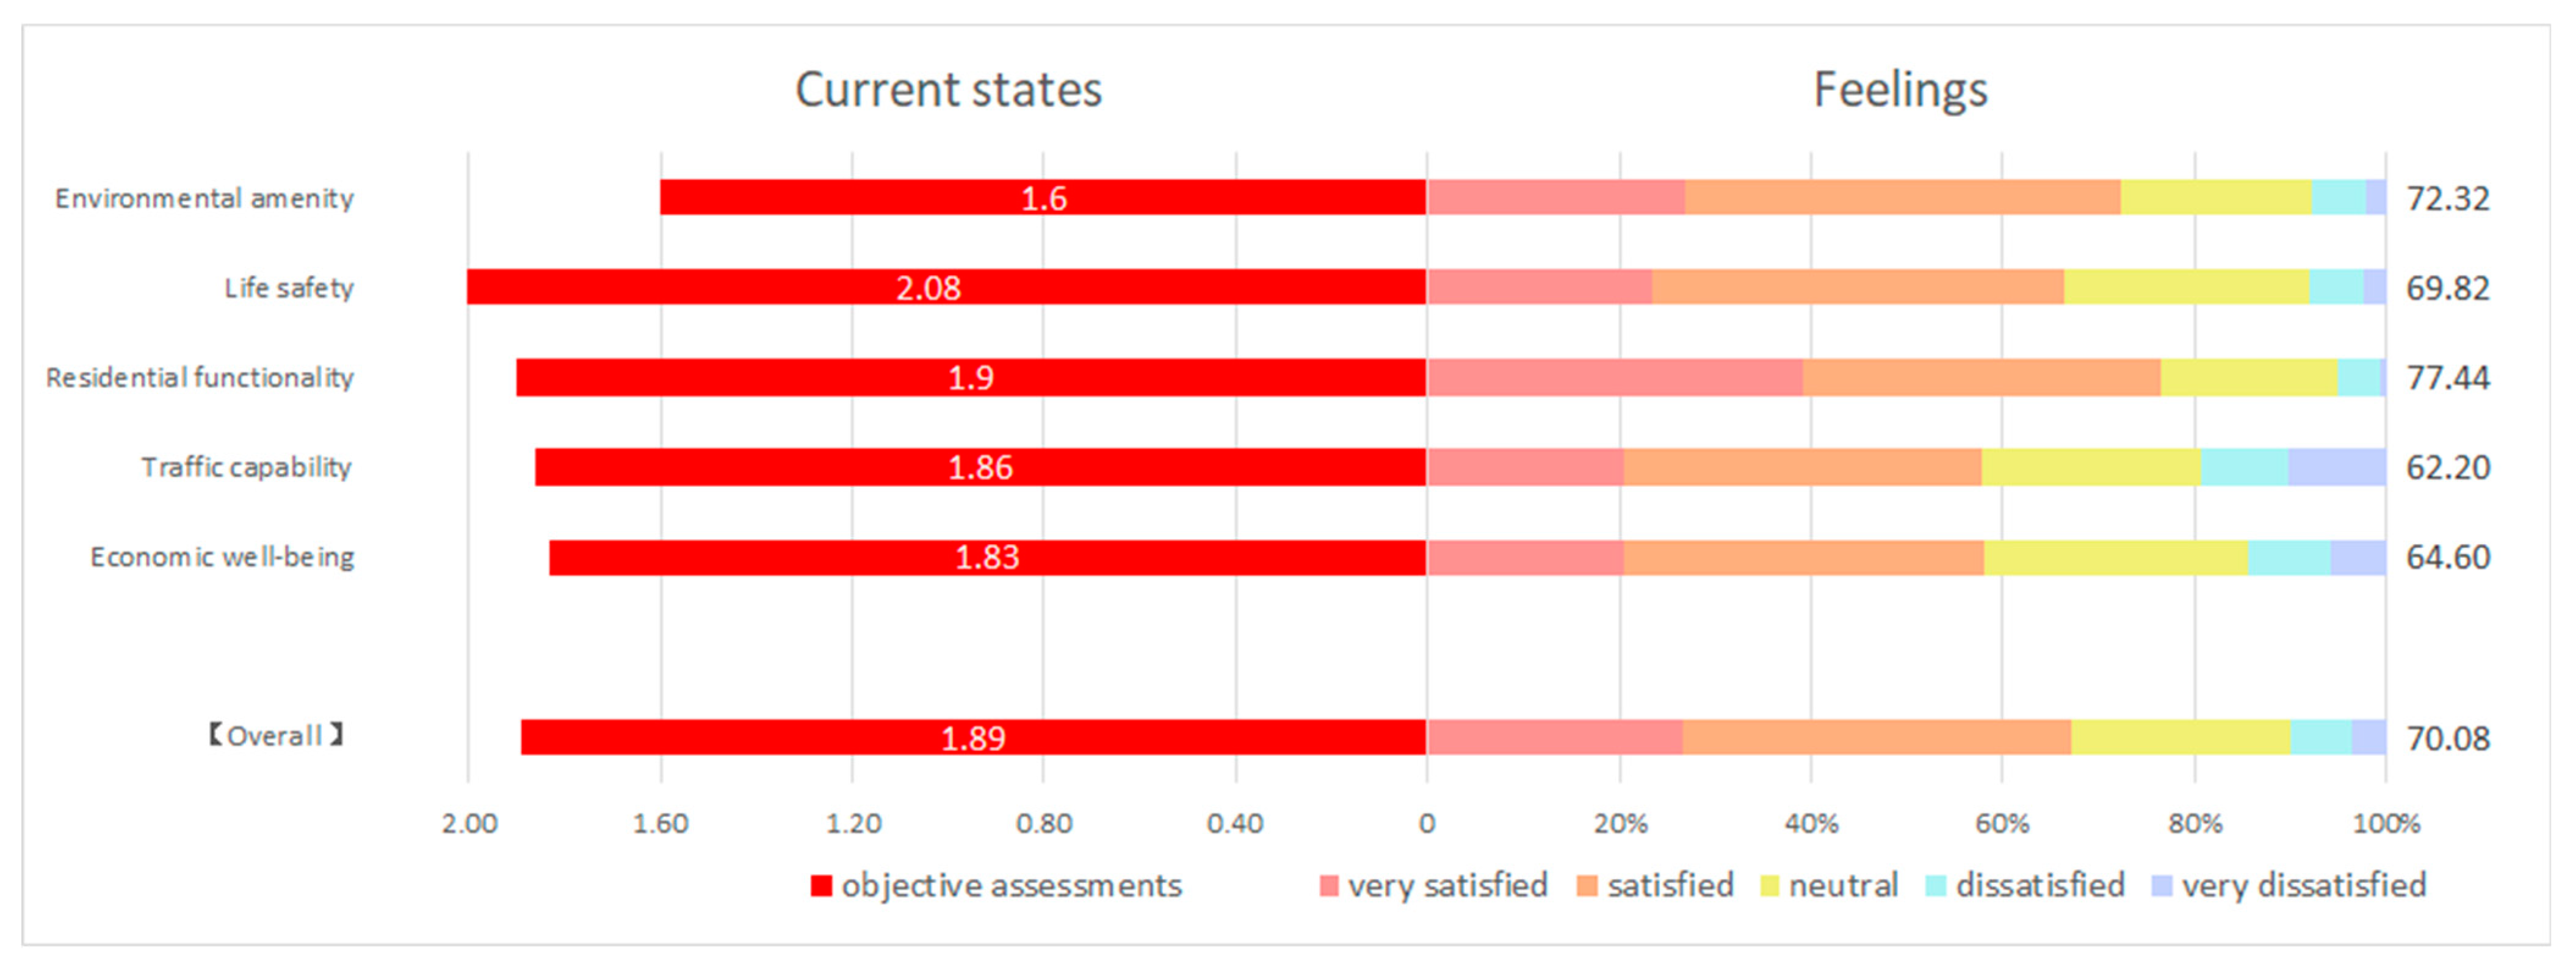
4.1.2. Current States and Feelings

In terms of the construction results, there was also no uniform relationship between the current states of the eco-city and people’s feelings (see Figure 9), where the correlation coefficient between the objective assessments and the subjective scores was just −0.05. More notable achievements in certain dimensions did not necessarily mean a correspondingly higher satisfaction of residents.
The eco-city had the worst objective assessment in the dimension of environmental amenity, but the subjective score was high. Conversely, the eco-city had the most outstanding achievements in the dimension of life safety, but people’s subjective satisfaction was only at a medium level. Referring to the quantitative relationship between the overall objective assessment and the corresponding subjective score, the achievement of the eco-city in life functionality had a strong positive effect on the satisfaction of residents. However, as for traffic capacity and economic well-being, the positive effects of the objective achievements on people’s satisfaction were limited.
This case demonstrates a pronounced disjunction between subjective perceptions and objective developments. Residents exhibited relatively higher satisfaction perceptions toward environmental amenity but lower perceptions toward life safety. Existing research suggests such perception–development mismatch is a common challenge in eco-city construction: subjective satisfaction with sanitation and greenery tends to be inflated, whereas development initiatives potentially harming environmental conditions may trigger significant discontent [35,36]. This implies that life safety, belonging to basic demand hierarchies, elicits limited sensitivity to objective improvements; in contrast, environmental amenity, representing higher-level needs, triggers more acute perceptual responses to changes.

4.2. Problems and Sustainable Development of the Eco-City

In fact, the deviations between the objective achievements and subjective satisfaction indicated a variety of unsolved problems in the eco-city’s construction. Facing these problems, the sustainable development of the eco-city should make up for the deficiencies and meet the needs of residents, improving development quality.
First, from the aspect of environmental amenity, the objective achievements were not very good, and it seemed to have entered a bottleneck in the later stage. As a restricting factor of social and economic development, the improvements in environment indicators always struggled to reach a high level. Most notably, the indicator values of days with good air quality (X11), urban sewage treatment rate (X12), and green coverage rate in built-up areas (X15) had all experienced ups and downs during these years and remained at a low level in the end. The Sino-Singapore Tianjin Eco-City had implemented a comprehensive environmental indicator system within its KPI framework [25]. Notably, substantial progress in industrial waste disposal and utilization (X13) coupled with significant park and green space development (X16) contributed to residents’ relative satisfaction with the current conditions. However, from the perspective of sustainable development, it is necessary to introduce as many low-emission, high-tech, high-value-added projects and enterprises as possible in the future, optimizing the ways of economic development and controlling pollution from the source. Meanwhile, to further improve the ecological environment in urban areas, it is necessary to build diversified environmental protection mechanisms and carry out more projects on the efficiency enhancement of smoke and sewage treatments.
Second, from the aspect of life safety, the objective achievements were most prominent, but given China’s longstanding reputation as one of the world’s safest countries, residents’ subjective perceptions remained relatively muted. To effectively enhance people’s sense of life safety, the eco-city needs to focus on the traffic safety situation (TSS) and accident safety situation (ASS) in the future. On the one hand, scientific urban safe operation plans ought to be formulated among multiple sectors, to reduce the occurrence of traffic and production accidents in daily life; on the other hand, different types of public safety facilities need to be set up in densely populated areas to improve the disaster prevention and response capabilities in emergencies. Furthermore, it is also necessary to build an advanced early warning, prevention, and control system with intelligent technologies to improve the safety management level of the eco-city overall.
Third, regarding the aspect of residential functionality, the rapid development of education (X32), medical care (X33), and culture (X34) facilities caused the eco-city to be highly regarded by the public. Based on the concept of the “neighborhood unit” in the eco-city construction, all the public facilities were located within walkable distances from dwellings, greatly improving the convenience of activities of residents in daily life (CCE, CMT, CRE, and CSC). However, after nearly two decades of development, the social infrastructure configuration in this new eco-city remains less mature than that of Tianjin’s central urban area. It has yet to fully incorporate human-scale design principles, resulting in an ecological enclave lacking social sustainability—a phenomenon well-documented in prior studies highlighting deficiencies in social interaction, employment opportunities, and consumption facilities [26,38]. To fully satisfy people’s needs in residential functionality, the Sino-Singapore Tianjin Eco-City needs to further improve the diversity and quality of public service provision in the future. Only by continuously improving the quality of life of residents can the eco-city attract more people to settle in and achieve the anticipated population eventually.
Finally, regarding the aspects of traffic capacity and economic well-being, people’s subjective satisfaction levels were both not very high. Although objective assessments of the former showed significant improvement in recent years, many residents remained dissatisfied with current conditions regarding traveling in daily life (TDL), traveling to the city center (TCC), and traveling to study and work (TSW). Notably, despite the consistent promotion of green mobility options, bicycles and walking failed to gain popularity due to lifestyle constraints and middle-class preferences, leaving private vehicles as the persistently dominant transportation mode [26]. As for economic well-being, the objective evaluations were merely average, and the core problem was the limited improvements in people’s salary (X51) and disposable income (X52). Even as a state-led flagship project, the eco-city appears inevitably constrained by market logic [43]. So, for sustainable development, the eco-city construction should focus more on the improvement in the socio-economic environment in the future. On the one hand, attention needs to be given to the improvement in urban transportation systems, optimizing the existing public transportation routes and enhancing the transportation capability across regions; on the other hand, the economic lives of residents should be of concern, promoting scientific and technological innovation in economic development and providing more high-end job opportunities for people.

5. Conclusions

New eco-city construction represents a comprehensive urbanization process aimed at balancing environmental sustainability with urban livability. As a flagship initiative of China’s eco-city development, the Sino-Singapore Tianjin Eco-City has made remarkable progress over the past two decades, particularly in environmental protection, resource efficiency, and urban functionality. In performance evaluations, national and local governments typically favor standardized indicators that offer clarity and comparability. However, the inherent complexity and contextuality of real-world urban processes often render such metrics inadequate in fully capturing urban realities. Beyond top-down macro-level assessments, it is imperative to incorporate residents’ lived experiences to validate the efficacy and authenticity of these objective measurements. This study seeks to amplify the otherwise muted voices of ordinary residents within academic discourse, aiming to prevent the eco-city from devolving into a disembodied utopian imagination.
The findings reveal a pronounced divergence between objective performance evaluations and residents’ subjective satisfaction. Despite near-doubling of the eco-city’s performance during its first development phase according to official indicators, the overall resident satisfaction rate has remained below 70%, with 10% of respondents expressing dissatisfaction or strong dissatisfaction. This gap necessitates a more nuanced investigation into the determinants of public perception and their alignment—or lack thereof—with planning objectives. Inadequate environmental amenities, deficiencies in life safety provisions, suboptimal residential functionality, constrained traffic capacity, and underlying economic difficulties have all undermined the city’s ability to fulfill its residents’ diverse and evolving needs.
For decades, Chinese urban governance has been critiqued as a form of state-led elite urbanism. Under this paradigm, major urban decisions are negotiated behind closed doors by technocrats and sectoral elites. In the case of the Sino-Singapore Tianjin Eco-City, the technocratic indicators employed as instruments of spatial regulation are far from infallible, while residents’ subjective feedback—lacking substantive avenues for civic participation—is often reduced to survey data at best. Notably, although policy documents frequently invoke terms such as “democratic decision-making” and “public participation”, they largely fail to offer concrete and actionable mechanisms for implementation. In most cases, public participation remains a symbolic and ceremonial gesture. For the majority of residents, the so-called “right to the city” becomes a rhetorical assertion rather than a lived reality, as they are rarely granted genuine opportunities to shape urban development according to their own aspirations.
To bridge the disconnect between developmental achievements and lived satisfaction, targeted strategies must be adopted to realize the sustainable transformation of eco-cities. First, environmental public services should be significantly enhanced to foster greener, healthier, and more aesthetically appealing urban environments that promote well-being and social cohesion. Second, safety and resilience must be prioritized through improved disaster preparedness, robust public safety infrastructure, and overall urban resilience. Third, residential functions need to be optimized to ensure that housing and community services are attuned to daily needs and expectations. Fourth, transport infrastructure should be upgraded to enhance accessibility, reduce congestion, and support sustainable mobility systems. Fifth, economic vitality must be reinforced through industrial diversification, expanded employment opportunities, and inclusive economic policies that distribute benefits more equitably across social groups. All of these improvements require an integrated planning and governance framework that incorporates resident feedback, adapts to dynamic urban demands, remedies the current lack of actionable mechanisms for democratic participation, and aligns technological innovation with human-centered development goals.
Future research should focus on refining eco-city evaluation frameworks to incorporate broader and more nuanced metrics of resident well-being and satisfaction while also expanding the spatial and demographic scope of sampling. Moreover, longitudinal studies tracking the evolving relationship between resident satisfaction and urban development will provide critical insights into the dynamic mechanisms that underlie sustainable urban transformation. Only through such efforts can the vision of eco-cities as harmonious and inclusive urban spaces be genuinely realized.

Author Contributions

Conceptualization, X.S.; Methodology, X.S.; Writing—review and editing, X.S.; Project administration, T.S.; funding acquisition, T.S.; Writing—original draft, J.H.; Charting—original draft, J.H.; Charting—review and editing, Z.Y.; Data collection, X.L. All authors have read and agreed to the published version of the manuscript.

Funding

This research was jointly supported by the Chey Institute’s ISEF program, the National Natural Science Foundation of China (Grant No. 72074127, 72442029), and the ESRC Global Challenges Research Fund (Grant No. ES/P011020/1).

Data Availability Statement

The original contributions presented in the study are included in the article, further inquiries can be directed to the corresponding author.

Conflicts of Interest

The authors declare that they have no potential conflicts of interest with respect to the research, authorship, or publication of this article.

References

  1. Uttara, S.; Bhuvandas, N.; Aggarwal, V. Impacts of urbanization on environment. Int. J. Res. Eng. Appl. Sci. 2012, 2, 1637–1645. [Google Scholar]
  2. Cui, X. How can cities support sustainability: A bibliometric analysis of urban metabolism. Ecol. Indic. 2018, 93, 704–717. [Google Scholar] [CrossRef]
  3. Bailey, I.; Caprotti, F. The green economy: Functional domains and theoretical directions of enquiry. Environ. Plan. A 2014, 46, 1797–1813. [Google Scholar] [CrossRef]
  4. Ibrahim, M.; El-Zaart, A.; Adams, C. Smart sustainable cities roadmap: Readiness for transformation towards urban sustainability. Sustain. Cities Soc. 2018, 37, 530–540. [Google Scholar] [CrossRef]
  5. Bibri, S.E.; Krogstie, J.; Kärrholm, M. Compact city planning and development: Emerging practices and strategies for achieving the goals of sustainability. Dev. Built Environ. 2020, 4, 100021. [Google Scholar] [CrossRef]
  6. Roseland, M. Dimensions of the eco-city. Cities 1997, 14, 197–202. [Google Scholar] [CrossRef]
  7. Joss, S.; Cowley, R.; Tomozeiu, D. Towards the ‘ubiquitous eco-city’: An analysis of the internationalisation of eco-city policy and practice. Urban Res. Pract. 2013, 6, 54–74. [Google Scholar] [CrossRef]
  8. Caprotti, F. Eco-urbanism and the Eco-city, or, Denying the Right to the City? Antipode 2014, 46, 1285–1303. [Google Scholar] [CrossRef]
  9. Rohracher, H.; Späth, P. The interplay of urban energy policy and socio-technical transitions: The eco-cities of Graz and Freiburg in retrospect. Urban Stud. 2014, 51, 1415–1431. [Google Scholar] [CrossRef]
  10. Mahzouni, A. The ‘policy mix’for sustainable urban transition: The city district of Hammarby Sjöstad in Stockholm. Environ. Policy Gov. 2015, 25, 288–302. [Google Scholar] [CrossRef]
  11. Elnokaly, A.; Elseragy, A. Eco-cities: Strategies of rebuilding communities for resilient and sustainable development in Egypt with particular emphasis on Aswan. In Proceedings of the International Conference on Changing Cities III: Spatial, Design, Landscape & Socio-Economic Dimensions, Mykonos, Greece, 26–30 June 2017. [Google Scholar]
  12. Yoo, J.S.; Shin, D.B. Utilizing urban facility sensor information in U-City: Multi-dimensional scaling approach. Spat. Inf. Res. 2016, 24, 53–64. [Google Scholar] [CrossRef]
  13. Joss, S. Eco-cities: A global survey 2009. WIT Trans. Ecol. Environ. 2010, 129, 239–250. [Google Scholar]
  14. Grey, F.A. Masdar City as a Prototype for Eco-Cities. Dig. Middle East Stud. 2018, 27, 261–277. [Google Scholar] [CrossRef]
  15. Jiang, Y.; Liu, C.; Zhou, C.; Chen, M. Overview of theoretical research and practical considerations on eco-cities of China. Geogr. Res. 2015, 34, 2222–2237. [Google Scholar]
  16. Xie, L.; Cheshmehzangi, A.; Tan-Mullins, M.; Flynn, A.; Heath, T. Urban entrepreneurialism and sustainable development: A comparative analysis of Chinese eco-developments. J. Urban Technol. 2020, 27, 3–26. [Google Scholar] [CrossRef]
  17. Liu, H.; Wennersten, R.; Luo, P.; Jiang, L.; Dong, W. Conceptual Sustainability Framework for Eco-City Development in the City Core of Xuzhou. J. Urban Plan. Dev. 2016, 142, 05016003. [Google Scholar] [CrossRef]
  18. Zhuang, Y. Confucian ecological vision and the Chinese eco-city. Cities 2015, 45, 142–147. [Google Scholar] [CrossRef]
  19. Gong, F.; Chen, X. Study on the Evaluation of Ecological Livable City in Anhui Based on Intuitionistic Fuzzy Theory. In IOP Conference Series: Earth and Environmental Science; IOP Publishing: Bristol, UK, 2020; Volume 555, p. 012089. [Google Scholar]
  20. Chang, I.C.C.; Sheppard, E. China’s eco-cities as variegated1 urban sustainability: Dongtan eco-city and Chongming eco-island. J. Urban Technol. 2013, 20, 57–75. [Google Scholar] [CrossRef]
  21. Joss, S.; Molella, A.P. The eco-city as urban technology: Perspectives on Caofeidian international eco-city (China). J. Urban Technol. 2013, 20, 115–137. [Google Scholar] [CrossRef]
  22. Yu, C.; Dijkema, G.P.; De Jong, M.; Shi, H. From an eco-industrial park towards an eco-city: A case study in Suzhou, China. J. Clean. Prod. 2015, 102, 264–274. [Google Scholar] [CrossRef]
  23. Li, J.; Sun, W.; Song, H.; Li, R.; Hao, J. Toward the construction of a circular economy eco-city: An emergy-based sustainability evaluation of Rizhao city in China. Sustain. Cities Soc. 2021, 71, 102956. [Google Scholar] [CrossRef]
  24. Caprotti, F. Critical research on eco-cities? A walk through the Sino-Singapore Tianjin Eco-City, China. Cities 2014, 36, 10–17. [Google Scholar] [CrossRef]
  25. Caprotti, F.; Springer, C.; Harmer, N. ‘Eco’For Whom? Envisioning Eco-urbanism in the Sino-Singapore Tianjin Eco-city, China. Int. J. Urban Reg. Res. 2015, 39, 495–517. [Google Scholar] [CrossRef]
  26. Flynn, A.; Yu, L.; Feindt, P.; Chen, C. Eco-cities, governance and sustainable lifestyles: The case of the Sino-Singapore Tianjin Eco-City. Habitat Int. 2016, 53, 78–86. [Google Scholar] [CrossRef]
  27. Zhou, N.; He, G.; Williams, C.; Fridley, D. ELITE cities: A low-carbon eco-city evaluation tool for China. Ecol. Indic. 2015, 48, 448–456. [Google Scholar] [CrossRef]
  28. Liu, L. A sustainability index with attention to environmental justice for eco-city classification and assessment. Ecol. Indic. 2018, 85, 904–914. [Google Scholar] [CrossRef]
  29. Murakami, S.; Kawakubo, S.; Asami, Y.; Ikaga, T.; Yamaguchi, N.; Kaburagi, S. Development of a comprehensive city assessment tool: CASBEE-City. Build. Res. Inf. 2011, 39, 195–210. [Google Scholar] [CrossRef]
  30. Wong, C. A framework for ‘City Prosperity Index’: Linking indicators, analysis and policy. Habitat Int. 2015, 45, 3–9. [Google Scholar] [CrossRef]
  31. Yao, J.; Yan, H.; Shao, J. Study on Evaluation of Eco-city Construction Based on Sustainable Development. In IOP Conference Series: Earth and Environmental Science; IOP Publishing: Bristol, UK, 2020; Volume 571, p. 012096. [Google Scholar]
  32. Dong, H.; Fujita, T.; Geng, Y.; Dong, L.; Ohnishi, S.; Sun, L.; Fujii, M. A review on eco-city evaluation methods and highlights for integration. Ecol. Indic. 2016, 60, 1184–1191. [Google Scholar] [CrossRef]
  33. Liu, J.; Low, S.P.; Wang, L.F. Critical success factors for eco-city development in China. Int. J. Constr. Manag. 2018, 18, 497–506. [Google Scholar] [CrossRef]
  34. Sharifi, A. From Garden City to Eco-urbanism: The quest for sustainable neighborhood development. Sustain. Cities Soc. 2016, 20, 1–16. [Google Scholar] [CrossRef]
  35. Gudipudi, R.; Lüdeke, M.K.; Rybski, D.; Kropp, J.P. Benchmarking urban eco-efficiency and urbanites’ perception. Cities 2018, 74, 109–118. [Google Scholar] [CrossRef]
  36. Zeng, C.; Deng, X.; Yang, J.; Cheng, Y.; Zhao, T.; Wang, P. The exploration of residents’ perception of eco-urbanization at community and driving factors in China. Cities 2022, 122, 103513. [Google Scholar] [CrossRef]
  37. Li, J.; Wang, Q.; Xuan, Y.; Zhou, H. User demands analysis of Eco-city based on the Kano model—An application to China case study. PLoS ONE 2021, 16, e0248187. [Google Scholar] [CrossRef]
  38. Caprotti, F.; Gong, Z. Social sustainability and residents’ experiences in a new chinese eco-city. Habitat Int. 2017, 61, 45–54. [Google Scholar] [CrossRef]
  39. Mersal, A. Eco city Challenge and opportunities in transferring a city in to green city. Procedia Environ. Sci. 2017, 37, 22–33. [Google Scholar] [CrossRef]
  40. Surjan, A.K.; Shaw, R. ‘Eco-city’to ‘disaster-resilient eco-community’: A concerted approach in the coastal city of Puri, India. Sustain. Sci. 2008, 3, 249–265. [Google Scholar] [CrossRef]
  41. Mouratidis, K.; Yiannakou, A. What makes cities livable? Determinants of neighborhood satisfaction and neighborhood happiness in different contexts. Land Use Policy 2022, 112, 105855. [Google Scholar] [CrossRef]
  42. Kenworthy, J.R. The eco-city: Ten key transport and planning dimensions for sustainable city development. Environ. Urban 2006, 18, 67–85. [Google Scholar] [CrossRef]
  43. Cugurullo, F. Urban eco-modernisation and the policy context of new eco-city projects: Where Masdar City fails and why. Urban Stud. 2016, 53, 2417–2433. [Google Scholar] [CrossRef]
  44. Reis, I.F.; Ferreira, F.A.; Meidutė-Kavaliauskienė, I.; Govindan, K.; Fang, W.; Falcão, P.F. An evaluation thermometer for assessing city sustainability and livability. Sustain. Cities Soc. 2019, 47, 101449. [Google Scholar] [CrossRef]
  45. Giles-Corti, B.; Lowe, M.; Arundel, J. Achieving the SDGs: Evaluating indicators to be used to benchmark and monitor progress towards creating healthy and sustainable cities. Health Policy 2020, 124, 581–590. [Google Scholar] [CrossRef] [PubMed]
  46. Chen, Y.; Zhang, D. Evaluation and driving factors of city sustainability in Northeast China: An analysis based on interaction among multiple indicators. Sustain. Cities Soc. 2021, 67, 102721. [Google Scholar] [CrossRef]
  47. Al-Aomar, R. A combined ahp-entropy method for deriving subjective and objective criteria weights. Int. J. Ind. Eng. Theory Appl. Pract. 2010, 17, 12–24. [Google Scholar]
Figure 1. Location and spatial extent of the Sino-Singapore Tianjin Eco-City.
Land 14 01225 g001
Figure 2. Methodological workflow of analytical framework.
Land 14 01225 g002
Figure 3. Progress of the eco-city construction in different dimensions.
Land 14 01225 g003
Figure 4. Demographic characteristics of the surveyed population.
Land 14 01225 g004
Figure 5. Surveyed results of the residents’ satisfaction with different elements.
Land 14 01225 g005
Figure 6. Satisfaction levels of residents with different topics and the overall state of the eco-city.
Land 14 01225 g006
Figure 7. The scores measuring the subjective satisfaction of residents.
Land 14 01225 g007
Figure 8. Annual developments of the eco-city versus people’s demands.
Land 14 01225 g008
Figure 9. Current state of the eco-city and people’s feelings.
Land 14 01225 g009
Table 1. Indicators for the objective assessment of the eco-city’s achievements.
First-Level IndicatorsSecond-Level IndicatorsUnit
Environmental
amenity
(X1)
Days with good air quality (X11)days
Urban sewage treatment rate (X12)%
Industrial solid waste disposal and utilization rate (X13)%
Household waste disposal rate (X14)%
Green coverage rate in built-up areas (X15)%
Green park area per capita (X16)m2/person
Population density of built-up areas (X17)persons/km2
Life
safety
(X2)
Emergency shelter area per capita (X21)m2/person
Criminal cases registered (X22)cases/10,000 persons
Deaths in traffic accidents (X23)deaths/10,000 vehicles
Deaths in fire accidents (X24)deaths/10,000 persons
Deaths in production accidents (X25)deaths/CNY 100 million
Residential
functionality
(X3)
Number of kindergartens (X31)kindergartens/10,000 persons
Number of fundamental education schools (X32)schools/10,000 persons
Number of hospital beds (X33)beds/10,000 persons
Number of cultural centers (X34)centers/10,000 persons
Business volume of post and telecommunications (X35)CNY/person
Internet fiber optic cable to the household rate (X36)%
Traffic
capability
(X4)
Density of public transport network (X41)km/km2
Road network area per capita (X42)km2/person
Rail transit mileage (X43)km/10,000 persons
Number of buses (X44)buses/10,000 persons
Number of taxis (X45)taxis/10,000 persons
Economic
well-being
(X5)
Average salary of people (X51)CNY/year
Average disposable income (X52)CNY/year
Social assistance expenditure ratio (X53)%
Unemployment insurance coverage (X54)%
Endowment insurance coverage (X55)%
Medical insurance coverage (X56)%
Table 2. Topics and elements of the subjective survey.
Surveyed TopicSurveyed Elements
Environmental amenityAtmosphere environment quality (AEQ)
Water environment quality (WEQ)
Ecological environment quality (EEQ)
Emission pollution control (EPC)
Noise pollution control (NPC)
Community green space (CGS)
Green activity space (GAS)
Life safetyUrban safety situation (USS)
Community safety situation (CSS)
Traffic safety situation (TSS)
Accident safety situation (ASS)
Residential functionalityConvenience of children’s education (CCE)
Convenience of medical treatment (CMT)
Convenience of recreation and entertainment (CRE)
Convenience of social communication (CSC)
Traffic capabilityTraveling in daily life (TDL)
Traveling to city center (TCC)
Traveling to study and work (TSW)
Economic well-beingFamily income status (FIS)
Material life level (MLL)
Endowment insurance level (EIL)
Medical insurance level (MIL)
Table 3. Normalized data for objective achievement assessment.
Indicators20102011201220132014201520162017
X111.001.021.091.261.501.351.261.17
X121.001.011.031.011.001.411.331.17
X131.001.191.491.191.081.281.721.78
X141.001.071.071.111.131.221.281.32
X151.001.061.001.061.051.061.071.08
X161.001.291.421.531.621.681.851.96
X171.001.091.191.291.281.271.281.30
X211.001.471.591.721.832.202.312.35
X221.001.121.321.211.551.631.822.00
X231.001.361.251.821.711.651.852.00
X241.001.331.551.661.781.621.551.92
X251.001.191.321.451.521.631.851.98
X311.001.001.001.001.321.411.521.63
X321.001.001.001.001.001.001.502.00
X331.001.241.321.421.481.591.682.00
X341.001.211.361.411.581.631.711.92
X351.001.010.991.011.021.031.041.08
X361.001.011.001.011.021.031.041.08
X411.001.111.181.331.421.501.551.63
X421.001.191.591.491.291.421.661.96
X431.001.011.111.311.441.611.801.98
X441.001.001.001.001.021.031.051.17
X451.001.081.151.231.361.541.321.76
X511.001.011.021.021.031.061.071.08
X521.001.071.111.131.221.221.261.32
X531.001.211.321.241.361.421.521.68
X541.001.231.021.411.321.521.321.50
X551.001.171.261.411.631.801.851.92
X561.001.351.271.681.741.882.022.04
Table 4. Entropies and weights of indicators for objective achievement assessment.
First-Level
Indicator
First-Level
Indicator
Entropy
First-Level
Indicator Weight
Second-Level
Indicator
Second-Level
Indicator
Entropy
Second-Level
Indicator Weight
X10.99500.115X110.9958 0.135
X120.9956 0.142
X130.9903 0.312
X140.9980 0.064
X150.9998 0.006
X160.9913 0.282
X170.9982 0.059
X20.98940.244X210.9853 0.268
X220.9877 0.223
X230.9896 0.189
X240.9926 0.134
X250.9898 0.186
X30.98960.239X310.9903 0.211
X320.9817 0.401
X330.9911 0.195
X340.9915 0.186
X350.9998 0.004
X360.9999 0.003
X40.99120.203X210.9940 0.162
X220.9911 0.238
X230.9858 0.381
X240.9994 0.017
X250.9925 0.202
X50.99140.199X510.9998 0.005
X520.9982 0.050
X530.9950 0.141
X540.9949 0.144
X550.9887 0.320
X560.9880 0.340
Table 5. Objective achievement assessments during 2010-2017.
X1X2 X3X4X5Integrated
Assessment
20101.001.001.001.001.001.00
20111.161.301.091.081.241.18
20121.301.411.131.241.231.26
20131.271.571.161.331.461.37
20141.291.681.271.381.561.45
20151.411.791.321.521.701.56
20161.581.931.581.621.751.71
20171.602.081.901.861.831.89
Table 6. The weights of different topics and elements.
Surveyed TopicsWeightSurveyed ElementsWeight
Environmental amenity0.18AEQ0.11
WEQ0.10
EEQ0.19
EPC0.10
NPC0.11
CGS0.22
GAS0.17
Life safety0.32USS0.22
CSS0.30
TSS0.28
ASS0.20
Residential functionality0.22CCE0.38
CMT0.26
CRE0.19
CSC0.17
Traffic capability0.17TDL0.35
TCC0.20
TSW0.45
Economic well-being0.11FIS0.26
MLL0.27
EIL0.24
MIL0.23
Disclaimer/Publisher’s Note: The statements, opinions and data contained in all publications are solely those of the individual author(s) and contributor(s) and not of MDPI and/or the editor(s). MDPI and/or the editor(s) disclaim responsibility for any injury to people or property resulting from any ideas, methods, instructions or products referred to in the content.

