Abstract
Early detection of plant water status is crucial for efficient crop management. In this research, proximal sensing tools (i.e., hyperspectral imaging HSI and thermal IR camera) were used to monitor changes in spectral and thermal profiles of a citrus orchard in Sicily (Italy), managed under five irrigation systems. The irrigation systems differ in the amount of water distribution and allow four different strategies of deficit irrigation to be obtained. The physiological traits, stem water potential, net photosynthetic rate, stomatal conductance and the amount of leaf chlorophyll were measured over the crop’s growing season for each treatment. The proximal sensing data consisted of thermal and hyperspectral imagery acquired in June–September during the irrigation seasons 2023–2024 and 2024–2025. Significant variation in physiological traits was observed in relation to the different irrigation strategies, highlighting the highest plant water stress in July, in particular for the partial root-zone drying irrigation system. The water-use efficiency (WUE) values in subsurface drip irrigation were similar to the moderate deficit irrigation treatment and more efficient (up to 50%) as compared to control. Proximal sensing measures confirmed a different plant water status in relation to the five different irrigations strategies. Moreover, four spectral indices (Normalized Difference Vegetation Index NDVI; Water Index WI; Photochemical Reflectance Index PRI; Transformed Chlorophyll Absorption Ratio Index TCARI), calculated from HSI spectra, highlighted strong correlations with physiological traits, especially with stem water potential and the amount of leaf chlorophyll (coefficient of correlation ranged between −0.4 and −0.5). This study demonstrated the effectiveness of using proximal sensing tools in precision agriculture and ecosystem monitoring, helping to ensure optimal plant health and water use efficiency.
1. Introduction
Climate change and drought have significant impacts on woody plants [1]. Rising temperatures, altered precipitation patterns, and prolonged periods of drought can stress trees and compromise their ability to absorb water. Furthermore, this condition has a negative impact on photosynthesis, growth, and tree health, with increased vulnerability to pests and diseases, and sometimes, tree mortality [2]. Understanding how these factors affect tree and plant responses is pivotal for agronomic management and agricultural practices. The management of water resources is a key factor for plant health, especially in tree species which are often more susceptible to environmental stressors such as water scarcity [3]. As a matter of fact, water stress can negatively influence the growth, health, and productivity of woody plants, affecting their morphological, physiological and biochemical processes. Changes in leaf physiology (i.e., stomatal closure, increase in leaf temperature, chlorophyll degradation, etc.), in tree growth (i.e., reduced growth, root system changes, etc.), in WUE, in reproductive effects, in hydraulic conductance, in hormonal response (i.e., abscisic acid production, etc.), in tree shape and structure can be observed as the plant strives to cope with a limited water supply.
Water deficit can also have an impact on fruit quality, affecting size, appearance, taste and nutritional profile [4]. Moderate water stress may result in sweeter fruit, but it can also lead to a decrease in juice yield, acidity, and overall fruit quality. Severe water deficit can result in smaller, less flavorful fruits, with lower nutrient content, reduced shelf life, and increased susceptibility to damage and disease. Precise water management is essential to preserve high fruit quality and ensure high yields. By monitoring plant physiological changes, such as stomatal behavior, leaf temperature, and changes in growth patterns, it is possible to understand how trees respond to water stress and adapt their management strategies for different environmental conditions [5].
Deficit irrigation (DI) strategies have been demonstrated to be effective methods for optimizing water use in agriculture by applying less water than the crop’s full water requirements [6]. These methods are especially valuable in regions with limited water resources, such as the areas located around the Mediterranean basin. These strategies can improve water use efficiency, reduce irrigation costs, and maintain crop productivity under water scarcity conditions. Among these, subsurface drip irrigation (SSDI), partial root-zone drying (PRD), subterranean partial root-zone drying (Sub-PRD), and micro-spray irrigation (SPR) are considered useful for achieving satisfactory and high qualitative production without the overuse of water resources [7,8]. SSDI implies placing drip emitters below the soil surface, typically at a depth where the root zone of the crops lies. This technique ensures that water is applied uniformly and directly to the root zone, reducing evaporation losses and improving water use efficiency [9].
PRD is a water-saving irrigation strategy where only part of the root zone is irrigated, while the other part is exposed to drying soil. The irrigated and dry zones are alternated periodically. The strategy is based on the plant’s ability to respond to water stress in one part of the root system, stimulating the plant to improve water use efficiency. PRD induces the abscisic acid (ABA)-based root-to-shoot chemical signaling regulating stomatal conductance and leaf expansion growth hereby increasing WUE [10,11]. Sub-PRD is an advanced version of PRD [12]. The key difference between PRD and Sub-PRD consists of an application of the water deeper in the soil profile, typically using sub-surface drip irrigation systems. In this way, water is supplied to the deeper parts of the soil profile, and the plant’s roots must grow deeper to access the water. SPR is a system that uses small spray heads to deliver water in fine droplets over the plant’s root zone, delivering water closer to the plant, and resulting in a more uniform coverage with minimal water loss due to evaporation or wind drift [13].
The timing of irrigation events and the plant water needs can be determined using data related to soil moisture or assessing plant water status, generally measured using the Scholander pressure chamber [14]. However, these traditional methods of monitoring water status are destructive, labor-intensive, and time-consuming, while timely detection is essential for effective water management. In recent years, the use of proximal sensing techniques, in particular spectroscopic techniques, to assess plant water status has become widespread, being non-destructive, efficient, and real-time methods. These techniques are particularly useful for applications related to agriculture, and they are based on sensors that are placed near the plants, usually at a distance of a few meters or less [15]. They can provide valuable insights into the physiological responses of trees under water stress [16].
One of the recent ways to monitor water stress in trees is to use proximal sensing techniques, such as thermography and hyperspectral imaging [5,17,18,19,20]. Thermography, which uses infrared (IR) cameras, is a method based on the capture of the infrared radiation emitted by a plant using infrared detectors without a light source [17]. It allows for the detection of temperature variations on the surface of plants, which are often indicative of their physiological condition [4]. When trees are affected by water stress, they may show changes in transpiration rates, leading to noticeable differences in leaf or canopy temperature. Thermal infrared sensors measure the temperature of the plant’s surface, as water-stressed plants often show higher leaf temperatures due to reduced transpiration [18]. This increase in leaf temperature can be correlated with water stress levels.
At the same time, Visible (Vis) and Near-Infrared (NIR) hyperspectral imaging technologies capture a wide spectrum of light (400–1000 nm), providing detailed information about plant health by analyzing the various biochemical and structural properties of trees [5]. Vis/NIR hyperspectral imaging (Vis/NIR HSI) allows for the detection of changes in leaf and canopy reflectance, which are indicative of physiological responses to water stress, such as alterations in stomatal conductance, leaf water content, and chlorophyll concentration. Moreover, by exploiting the wavelengths associated with hyperspectral images, it is possible to define some indices (such as Normalized Difference Vegetation Index, etc.), derived from the measurement of light reflected by the plant’s surface, to assess various physiological parameters related to plant function, such as chlorophyll content, photosynthetic activity, water stress, and nutrient status [19,20].
In this study, proximal sensing tools were used to monitor the effects of regulated deficit irrigation (DI) on crop water status in a citrus orchard [Citrus sinensis (L) Osbeck] under a Mediterranean climate. In this semi-arid area, water scarcity is one of the most important factors that significantly limits productivity in citrus [21]. Therefore, to guarantee the regularity of crops and to reduce the variability of interannual yields, the scarce rainfall must be integrated with irrigation. However, the environmental and economic sustainability of agricultural crop systems have to be ensured by effective irrigation strategies, which minimize water consumption. Our study aims to evaluate (i) the effects of DI on plant physiology and fruit quality; (ii) the reliability of proximal sensing techniques for crop status monitoring during the irrigation season.
2. Materials and Methods
2.1. Site Characteristics and Irrigation Treatments
The study was conducted during the irrigations season June–October 2023–2024 and 2024–2025 in a citrus orchard, cv. ‘Tarocco Rosso VCR’ [Citrus sinensis (L.) Osbeck] grafted on Carrizo citrange rootstock [Poncirus trifoliata (L.) Raf. × C. sinensis (L.) Osbeck]. Field data were collected in the experimental farm of the Research Center for Olive, Fruit and Citrus Crops (CREA OFA) in Eastern Sicily (Italy) (37°20′23″ N, 14°53′53″ E). The layout of the experimental site was reported in Figure 1. The citrus trees were planted in 2011 with a spacing of 6 × 4 m.
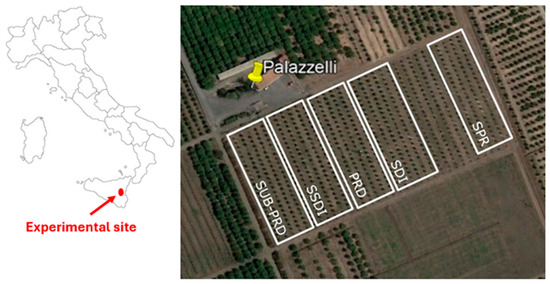
Figure 1.
Layout of the experimental site with the indication of experimental site.
The study area has a Mediterranean climate, characterized by mild winters, warm autumns and springs, and generally hot and dry summers. During 2023, average annual air temperature was 18 °C (TMax: 45.8 °C; TMin: −3 °C), rainfall (R) 539 mm, and a reference annual total evapotranspiration (ET0) of 1262 mm, whereas during 2024 the average annual air temperature was 18 °C (TMax: 41.7 °C, TMin: −3 °C), R 348 mm and ET0 1268 mm. Climatic data [minimum, maximum, and daily mean temperature, net radiation, relative humidity, hourly, and daily evapotranspiration, precipitation, etc.] were acquired by an automatic weather station (Davis Instruments Vantage Pro, Hayward, CA, USA) located at the study site. The reference daily evapotranspiration ET0 was determined using the Penman–Monteith equation, and the crop evapotranspiration (ETc) was calculated by multiplying the daily ET0 by the seasonal crop coefficient for the orange grove (Kc) [22,23,24]. The applied Kc was 0.7, taking into account the size of the citrus canopy during the two experimental seasons. Five irrigation treatments were applied during each of the whole seasons: a dual drip line (SDI), to replace 100% of ETc; a Sprinkler (SPR) system to replace 90–100% of ETc; a deficit irrigation sub-surface drip irrigation (SSDI) system to replace 80% of Etc; a Partial Root-Zone Drying irrigation (PRD) system to replace 50% of Etc; a subterranean Partial Root zone Drying irrigation (Sub-PRD) system to replace 40% of Etc. SDI was considered the control treatment.
Based on the water requirement for each of the replicates, the amount of applied irrigation at 3-day or weekly intervals was adjusted to ensure the accurate delivery of water required for each irrigation level. The water supply was interrupted with the onset of the winter season, due to adequate rainfall which satisfied the crops’ water needs.
For PRD treatment, irrigation was applied alternately to different parts of the root zone, applying water weekly to one half of the root zone and then switching to the other half [10,11].
For each treatment and for each year, three plants of the same planting age were considered for measurements, described in Figure 2.
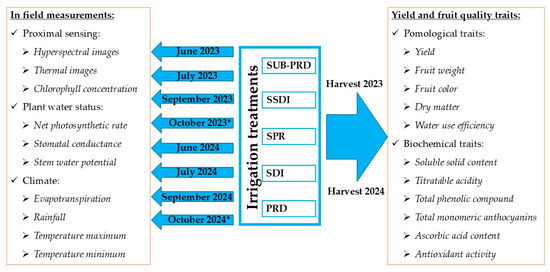
Figure 2.
Experimental design and data collection timeline. * Data available only for plant water status and climate.
The plant water status was monitored by measuring the water potential of the xylem of the stem(s), with a Scholander pressure chamber (m670, PMS Instrument Co., Albany, OR, USA) [25]. The measurements were carried out during the irrigation period on leaves completely exposed to the sun, between 10:00 and 12:00 AM; leaves were wrapped in plastic bags and covered with silver foil at least 1 h before measurements [26]. Three leaves for each tree were randomly selected for measurements.
Net photosynthetic rate (A) and stomatal conductance (gs) were measured every 15 days in fully expanded mature leaves. Gas exchange (A, gs and E) measurements were performed using an LCpro-SD portable IRGA (ADC BioScientific Limited, Great Amwell, Hertfordshire SG12 9TA, UK). Measurements were taken between 8:00 and 11:00 am on three leaves of each plant once the readings had stabilized.
The green color index was measured using a portable chlorophyll meter, Minolta Chlorophyll MetroSPAD-502, which allows for rapid and non-destructive measurement. The recorded data is the average of three measurements per plant [27].
2.2. Data Collection
Hyperspectral images, thermal images and leaf chlorophyll concentration were acquired from June to September for two consecutive years (2023–2024) at 1.00 pm (local time; UTC + 0 h). The instrumental surveys were carried out over time on days with homogeneous climatic conditions (wind, temperature, radiation, etc.), with validation provided by the meteorological station. The measurements were determined by pointing the cameras on sunny leaves at a distance from the canopy of 5.2 m, changing the angle based on the time of measurement. A portable Specim IQ hyperspectral camera (Specim, Spectral Imaging Ltd., Oulu, Finland), operating in the Visible and Near-Infrared (Vis/NIR) regions between 400 nm and 1000 nm, with 224 wavelength points, was used to capture high resolution HSI images. The spatial resolution was 512 × 512 pixels, and the spectral resolution was 7 nm spanning across 204 spectral bands within the wavelength range. The camera was fixed on the tripod with a white diffuse reflectance target to carry out a white reference image to operate in simultaneous modality (Figure 3).
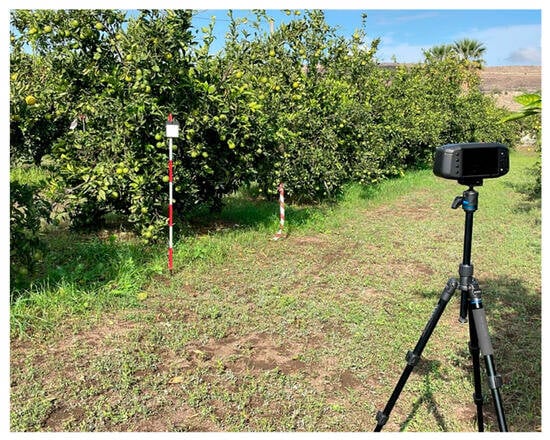
Figure 3.
Hyperspectral images acquisition.
The integration time of the hyperspectral camera was set to 3.0 ms. The RGB and hyperspectral images were acquired through IQ studio software (version 2021, Specim, Spectral Imaging Ltd., Oulu, Finland).
The effect of the treatments on the leaf chlorophyll concentration was assessed using a chlorophyll meter SPAD-502Plus (Minolta, Milan, Italy).
Thermal images were obtained from a portable thermal camera, spectral range 7.5–14 um, infrared image rate 30 Hz, thermal resolution up to 40 mK, field of view 30.4 × 23.1° (VARIOCAM-HD, InfraTec., Dresden, Germany). Data were recorded with acquisition software IRBIS® 3 (version 2021, InfraTec., Dresden, Germany). Average temperature was evaluated in specific measurement areas in the form of circles which were selected in the canopy IR image.
2.3. Yield and Fruit Quality Traits
Yield was determined at commercial harvest on the selected 15 trees (3 plants per treatment). Data on yield were used to determine the irrigation water-use efficiency (IWUE; kg ha−1 mm−1), calculated as yield divided by the applied irrigation water plus rainfall. Unpeeled orange fruits (10 fruits for each replication per treatment per year) were randomly chosen, cleaned with MilliQ water, drained, and gently blotted with a paper towel. Ground skin color and pulp color, on both external opposite fruit sides, were evaluated using the CIELab color space coordinates (L* = luminosity; a* = redness/greenness; b* = yellowness/blueness), obtained with a tristimulus colorimeter (Chroma Meter CR-400, Minolta, Milan, Italy), equipped with a D65 illuminant. The results were expressed as a means of the two opposite fruit sides of the three-color spatial coordinates: L (from black 0 to white 100), a* [from green (−) to red (+)], b* [from blue (−) to yellow (+)]. The external color index (CI) was determined as CI = a* × 103 × (L* × b*)−1. Fruit samples were weighted using technical balance (ARA520, Ohaus, Parsippany, NJ, USA) and expressed as a sum of 10 fruits. Soluble solids content (TSS), expressed in g 100 g−1 of FW, was determined with a digital refractometer (Refractometer 30PX, Mettler Toledo, Greifensee, Switzerland). Titratable acidity (TA), expressed in g L−1, was evaluated using an automatic titration system (785 DPM Titrino, Metrohm Ltd., Herisau, Switzerland). Dry matter (DM) was assessed by drying the fresh samples at 105 ± 1 °C until a constant weight was reached using an oven, and the results were expressed as g per 100 g−1 of fresh weight (FW). Fruit phytochemicals (total phenolic compounds, total monomeric anthocyanins, ascorbic acids) and antioxidant activity were evaluated in agreement with Ceccarelli et al. [28]. Briefly, for the determination of total phenolic content (TPC) and antioxidant activity (AA), 5 g of de-frozen samples were extracted with 25 mL of an acidified methanol/water solution (70/30 v/v) containing 5 mM HCl. Specifically, the Folin–Ciocalteu method was applied for TPC determination, with results expressed as mg of gallic acid equivalents (GAE) per 100 g of fresh weight (FW). The antioxidant activity of the extracts was evaluated using the DPPH assay, and the data were expressed on a fresh weight (FW) basis as μg of Trolox equivalent (TE) per mg of FW. Total anthocyanin content was determined using 20 mL of a methanol solution with 0.2% hydrochloric acid. The pH-differential method was used to quantify the total anthocyanin content, with results expressed as mg of cyanidin 3-O-glucoside equivalents (C3GE) per L of FW. Ascorbic Acid (AAC) was measured by voltametric titration using a 785 DPM Titrino, (Metrohm Ltd., Herisau, Switzerland) with a Metrohm 6.0309.100 (Switzerland) double platinum electrode, as reported by the Methrom application bulletin 98/5e.
2.4. Data Analysis
HSI images of three plants, for each irrigation system, for three times (June, July, and September), and for two consecutive crop years (2023–2024) were acquired twice.
The reflectance of each image was corrected using a calibrated white and dark reference [29], according to the following equation:
where I = the corrected reflectance, Iraw = the original reflectance, IB = the black reference, and IW = the white reference. In this way, the influence of the sensitivity of the sensors or the illumination was reduced [30].
Image segmentation was carried out with the principal component analysis (PCA) algorithm on mean centered spectra, considering the first two principal components (PCs) to remove the background and extract the pixels of each plant sample from the entire hyperspectral image. To remove interfering information, such as baseline drift, electronic noise, mechanical vibrations, and scattered light caused by instruments and detection conditions, a pre-processing of HSI images was applied using the Evince software (version 2022, Prediktera AB, Umeå, Sweden) [30,31], Multiplicative scatter correction (MSC), standard average variance (SNC), and a smoothing with the application of the first order Savitzky–Golay derivative (2nd-degree polynomial and 7-point window) were applied. Finally, the mean spectrum for each plant was extracted from each HSI image.
2.5. Spectral Indices
Based on the reflectance measurements, some spectral indices were calculated to monitor the plant water status. These indices combine two or more wavelengths (Ri), including normalized difference vegetation index (NDVI), water index (WI), photochemical reflectance index (PRI), and transformed chlorophyll absorption ratio index (TCARI), defined as follows [20,32].
where Ri is the reflectance signal at wavelength i.
2.6. Statistical Analysis
The results from all the tests were expressed as mean ± standard deviations (SD). Analysis of variance (Kruskal–Wallis test) and the post hoc non-parametric Dunn’s range test were performed with the level of significance set at p ≤ 0.05. To verify whether the hyperspectral imaging device was able to differentiate plant water status throughout the hottest months (June–September), a principal component analysis (PCA) was carried out on the means of the spectral data for each irrigation treatment and for each month. To highlight the correlation between physiological status variables and spectral indices, a Pearson correlation analysis was carried out at significance level p ≤ 0.05. Data were processed using the software PAST (version 2.17v) [33].
3. Results
3.1. Climatic Conditions
During the monitored irrigation seasons (Day of the year—DOY 152–321, and 153–292, respectively, in 2023 and 2024), the environmental variables in the experimental field were consistent with the climate of arid regions. In particular, unusual maximum temperatures (45.8 °C in 2023 and 41.7 °C in 2024) and low rainfall (69.4 mm in 2023 and 37.2 mm in 2024) were recorded (Figure 4).
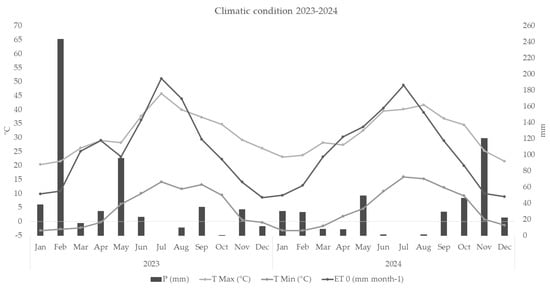
Figure 4.
Reference evapotranspiration (ET0), rainfall (P), temperature maximum and minimum (TMax-TMin) during 2023–2024.
The general characteristics of the water balance in the irrigation treatments are shown in Table 1, with the irrigation amount (IA) provided (mm) in the different treatments.

Table 1.
Irrigation amount (IA) for each treatment during the period 2023–2024.
The volume of water saved using these treatments was up to approximately 25% in SSDI, 40% in PRD and 50% in Sub-PRD compared to the full irrigated control treatment (SDI). On average, during the dry season, SPR received irrigation rates similar to the control with some adjustment in the second year.
3.2. Plant Water Status Measurements
During 2023, the plant water potential for the treatments PRD and SPRD was quite similar during the entire experiment, with average values of −1.5 MPa and −2.0 MPa. This confirmed a stressed plant response caused by extreme climatic conditions. SDI, SSDI and SPR showed stressed values only in July. Plants under water restrictions in 2024 had similar values to the control (Figure 5).
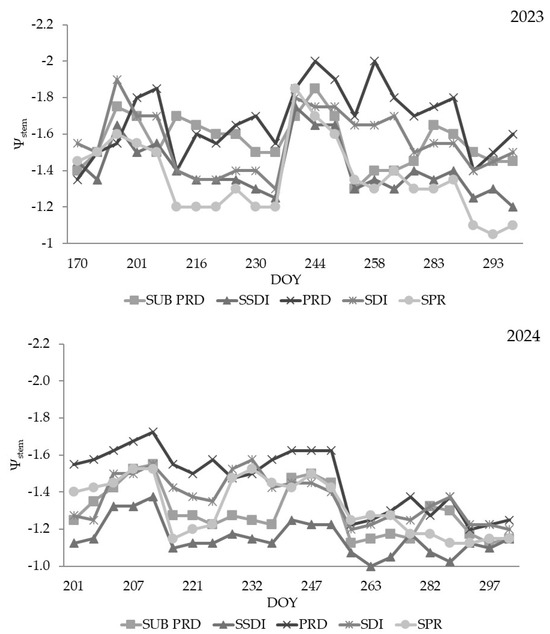
Figure 5.
Stem water potential (Ψstem, MPa) measured for all irrigation treatments. Legend: SDI = dual drip line system (control); SSDI = sub-surface drip irrigation system; SPR = Sprinkler system; PRD = Partial Root-Zone Drying irrigation system; Sub-PRD = subterranean Partial Root-Zone Drying irrigation system.
PRD strategy reached more negative values than the control trees in all periods. In the months in which the effects of the dry climate (July, August) were more prominent, the plants of the water stress treatments recorded a decrease in photosynthesis values, but the response of the water potential showed an optimal boundary layer.
The ΨStem values in the water stress regime were consistent with the irrigation strategy. In fact, the low-frequency deficit irrigation fluctuated markedly with the irrigation dynamics [34].
The gs measurements throughout the monitored period showed low values in all treatments (Table 2). The intensity of water shortage showed a great influence on gs recorded values. These findings align with the understanding that the timing, intensity, and duration of water stress are crucial to determine the plant physiological responses and their impact on plant metabolism [35]. For example, under mild water-stress conditions, plant regulation of water loss and uptake still allows the plant to maintain relative leaf water content with no or only little change in photosynthetic capacity. In general, water deficit causes physiological and biochemical changes which induce a reduction in photosynthesis and thus plant growth [11].
Table 2.
Mean values and standard deviations per year for net photosynthetic rate (A), stomatal conductance (gs), and amount of leaf chlorophyll (SPAD).
3.3. Proximal Sensing Evaluation
3.3.1. HSI Spectra Analysis
Mean responses over the spectral regions 400–1000 nm acquired on June, July and September for two consecutive years are plotted in Figure 6. In general, the spectra were characterized by a small peak at the green band (550 nm), a small drop at the red band (650 nm), and a rising plateau at the Near-Infrared (NIR) band (750–1000 nm). In particular, leaf pigmentation variation could be ascribed in the spectra region from 400 to 700, where mesophyll cell structure in the region is from 700 to 1000 nm. It can also be noted that the small peak at 900–950 nm is related to the water absorption region. The spectral reflectance of citrus canopy related to June and September were quite similar for all treatments (Figure 6), although those of September 2024 showed slight differences. These spectral profiles corresponding to those of healthy trees follow a typical spectral signature of plant leaves indifferently to different irrigation systems. The reflectance curves in the NIR region varied considerably in July for both years in relation to the different irrigation strategies. A slight increase in the reflectance curve in the spectral region lower than 700 nm (451 nm 554 nm and 640 nm 670 nm) was also observed, while crop water deficit stress increased. In particular, the reflectance in the Near-Infrared (NIR) spectral region tended to increase, while the visible (VIS) spectral region remained stable throughout the period considered in relation to the amount of water applied. The maximum reflectance signal was found for SPR, whereas the lowest was found for the SSDI treatment.
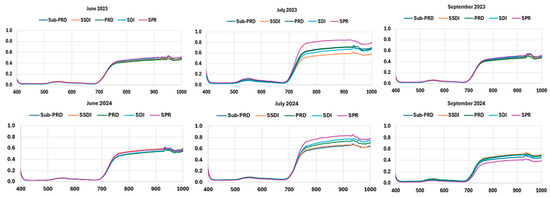
Figure 6.
Mean VisNIR reflectance spectra (400–1000 nm) of plant camopy for the five irrigation systems during June, July and September for two consecutive years at wavelength range of 400–1000 nm. SDI = dual drip line system (control); SSDI = sub-surface drip irrigation system; SPR = Sprinkler system; PRD = Partial Root-Zone Drying irrigation system; Sub-PRD = subterranean Partial Root-Zone Drying irrigation system.
To highlight similarities/dissimilarities among all different water treatments, a principal component analysis (PCA) was carried out on the mean spectral data for each irrigation system and time (Figure 7). The first two principal components accounted cumulatively for 96.1% of the explained variance: PC1 explained 86.9% and PC2 9.2% of the total variance.
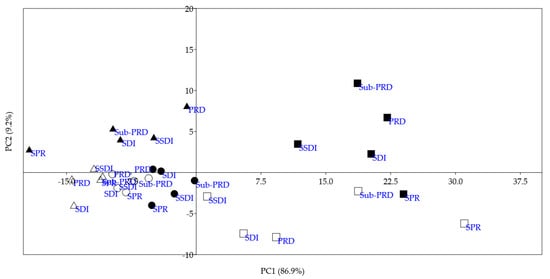
Figure 7.
Score plot from principal component analysis performed on mean spectra of each treatment during the two crop years. SDI = dual drip line system (control); SSDI = sub-surface drip irrigation system; SPR = Sprinkler system; PRD = Partial Root zone Drying irrigation system; Sub-PRD = subterranean Partial Root zone Drying irrigation system. Circles: June; squares: July; triangles: September; empty symbol: 2023; solid symbol: 2024.
The score plot reveals a clear separation of the spectra in relation to the months, crop years and irrigation systems. Specifically, the samples were clustered into two main groups with respect to PC1. The first group, in the first and fourth quadrants, included all samples of July 2023 and 2024. The second group, in the second and third quadrants, included the spectra of June and September. In summary, the first principal component discriminated the spectra in relation to different water stresses, highlighting significant differences in plant health in July. With respect to PC2, the spectra were principally grouped in relation to the crop years and differentiated based on different water treatments. In particular, the highest distances among the treatments were observed in July, showing differences in system efficiency that reflect varying plant health status. These results highlight the effectiveness of the portable Visible and Near-Infrared hyperspectral imaging device in the quick and non-invasive identification of plant physiological status. In addition, PCA loadings were investigated to identify the spectral regions with a high discrimination power (Figure 8).
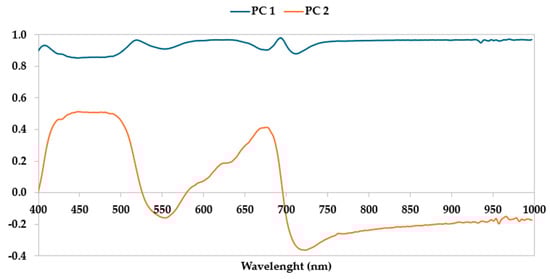
Figure 8.
Loadings plot of the first two principal components from PCA performed on mean spectra.
Regarding PC1, Figure 8 showed that all bands between 400 and 1000 nm had significant impact on the discrimination between healthy plants (images acquired in June and September) and water stressed plants (images acquired in July). The maximum discrimination power was found at around 560 nm, 750 nm, 800 nm, and 1000 nm. In general, these are the characteristic bands of HC = CH (550–590 nm and 680–710 nm), O–H, N–H, and C–H (720–760 nm and 840 nm) functional groups associated with high peaks in the loading plot, which influenced the discrimination of the two clusters. Regarding PC2, high peaks were at around 420–500 nm (HC = CH), 670–700 nm (HC = CH), showing a high discriminative ability, while bands at around 800 nm (O–H and C–H), 970 nm (O–H), and 1000 nm (O–H, N–H, and C–H) had a minor discrimination power.
3.3.2. Reflectance Indices
Four spectral indices (normalized difference vegetation index NDVI; water index WI; photochemical reflectance index PR; transformed chlorophyll absorption ratio index TCARI) were calculated by HSI reflectance spectra (Table 3). The NDVI values ranged between 0.844 ± 0.029 for the PRD system in September 2024 and 0.908 ± 0.005 for the SDI system in September 2023, indicating an optimal plant health status. Regarding WI, the minimum value (0.919 ± 0.024) was recorded for the PRD system in July 2023, whereas the maximum (0.979 ± 0.024) for the Sub-PRD system in September 2023. Mean PRI values were always negative and varied from −0.001 ± 0.010 for SPR system in September 2023 to −0.035 ± 0.011 for the Sub-PRD system in July 2023. Finally, TCARI values showed the highest differences, ranging from 0.061 ± 0.019 to 0.240 ± 0.124.
Table 3.
Reflectance indices of the five irrigation treatments during the period June–September 2023–2024. NDVI = normalized difference vegetation index; WI = water index; PRI = photochemical reflectance index; TCARI = transformed chlorophyll absorption ratio index.
Correlation analysis showed significant and negative correlations between NDVI and all physiological status variables (stem water potential; stomatal conductance; net photosynthetic rate; amount of leaf chlorophyll) (Figure 9). The negativity is due to the fact that physiological measurements are performed with instruments that measure absorbance, while the indices were calculated on reflectance spectra. TCARI negatively correlated with stem water potential and SPAD, whereas no correlations were found for WI and PRI.
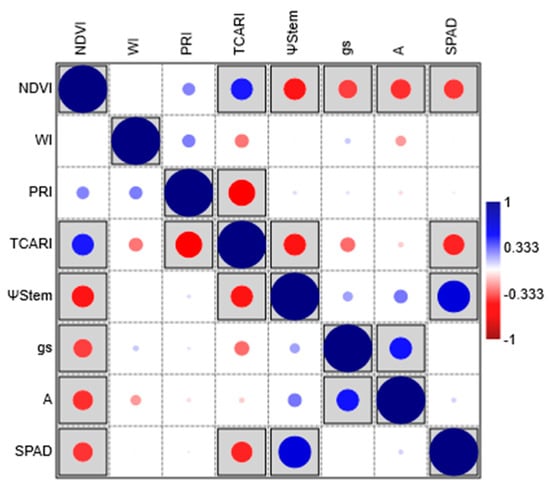
Figure 9.
Pearson correlation among the four physiological status variables (ΨStem = stem water potential; gs = stomatal conductance; A = net photosynthetic rate; SPAD = amount of leaf chlorophyll) and spectral indices (NDVI = normalized difference vegetation index; WI = water index; PRI = photochemical reflectance index; TCARI = transformed chlorophyll absorption ratio index). Significant correlations are boxed.
3.3.3. Thermal Images
Thermal images of the canopy (sunlit) were acquired in June, July and September 2023–2024. As an example, the images for July 2023 are shown in Figure 10, which exhibit significant differences among the five irrigation systems.
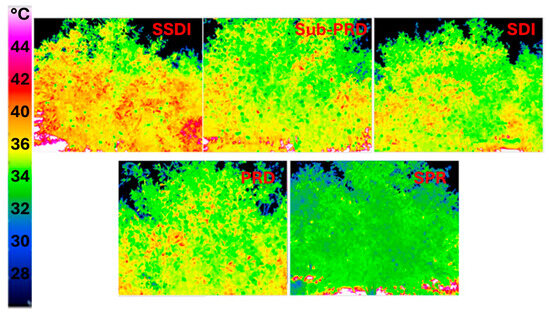
Figure 10.
Thermal images of the canopy for the five irrigation systems in July 2023. SDI = dual drip line system (control); SSDI = sub-surface drip irrigation system; SPR = Sprinkler system; PRD = Partial Root-Zone Drying irrigation system; Sub-PRD = subterranean Partial Root-Zone Drying irrigation system.
This is clearly visible from the different coloration of the foliage, with the warmest areas highlighted in orange-red and the coldest in green. The SPR treatment appears to be the one that highlights a state of reduced water stress, while the SSDI shows the higher level. These results are also confirmed in July 2024, as shown by the mean temperatures extracted from thermal images for all treatments and times, reported in Table 4.
Table 4.
Mean temperatures of canopy obtained from thermal images for the different irrigation systems.
3.4. Fruit Qualitative Traits Variability
The effect of irrigation systems on fruit quality was evaluated using the non-parametric Kruskal–Wallis test and Dunn’s post-hoc test (Table 5). Results showed that in 2023 the highest yield was obtained with the SSDI system (13.3 ± 1.8 kg ha−1), whereas the lowest was obtained with the Sub-PRD system (5.0 ± 1.3 kg ha−1). Similar trends were carried out in 2024, although yield has roughly tripled in 2024.
Table 5.
Results for total productions (Yield), fruit weight, and water use efficiency (WUE).
Fruit weight decreased significantly in 2024 compared to 2023, with the exception of the SDI system production (227 ± 8 g in 2023 and 228 ± 58 g in 2024). In 2023, no significant differences in fruit weight were recorded among all five irrigation systems, while fruits showed the highest weight for SDI (228 ± 58 g) and the lowest for SSDI (182 ± 8 g) in 2024.
Regarding water use efficiency (WUE), defined as the amount of harvested product per unit of water applied (rain and irrigation), results showed that sustained deficit irrigation and low-frequency deficit irrigation promoted increments in water productivity. WUE related to SSDI and PRD were highlighted as the highest values in 2023, whilst the remaining three systems had significantly lower values. Unlike what happened in 2023, the maximum WUE was recorded for Sub-PRD, while the other systems continued the same trend as in 2023.
No significant changes were found in the CIELab values of fruit peel and pulp among the treatment in both crop years, except for b* related to pulp in 2024 (Table 6). In fact, the fruit pulp value (26.59 ± 4.50) related to Sub-PRD showed higher yellowness than those of the other systems. Regarding the comparison of color coordinates, significant differences were recorded between the two years for L* and b* of fruit peel and a* and b* of fruit pulp. The external color index (CI) was the parameter that varied the most compared to the other color coordinates between and over the years among the irrigation treatments. CI of peel was significantly lower in 2023, while the description of the differences highlighted for fruit pulp in 2024 was more complex, due to the high standard deviations.
Table 6.
Color CIELab coordinates for fruit peel and pulp.
Irrigation treatments significantly (p < 0.05) affected quality characteristics during both crop years (Table 7). The SPR system seemed to influence TSS, TA, TSS:TA, and DM in 2023, because these parameters showed the lowest values in comparison with those related to the other irrigation systems. Regarding 2024, significant differences were observed only for the variable DM, which showed the highest value (16.7 ± 0.8 g 100 g−1 FW) for SSDI and the lowest for PRD (14.2 ± 0.4 g 100 g−1 FW).
Table 7.
Mean values and standard deviations for soluble solid content (TSS), titratable acidity (TA), soluble solid content titratable acidity ratio (TSS:TA), dry matter (DM).
The five irrigation strategies exhibited high variability on phytochemicals profiles, as detailed in Table 8. Specifically, total phenolic content showed high variability between the two crop years and among the different irrigation systems with the lowest value found in 2024 for Sub-PRD and PRD (92 ± 9 and 98 ± 3 mg GAE 100 g−1 FW, respectively), and the highest in 2023 for SPR, SSDI and Sub-PRD (190 ± 20, 188 ± 15 and 178 ± 4 mg GAE 100 g−1 FW, respectively). Regarding total anthocyanins content, the highest value was found for Sub-PRD in 2023 (128 ± 7 mg C3GE 100 g−1 FW), while the lowest levels were observed for Sub-PRD and SDI in 2024. In comparison to other biochemical traits, no significant differences were observed for ascorbic acids concentration among the samples.
Table 8.
Mean values and standard deviations for total phenolic compound (TPC), total monomeric anthocyanins (TMA), ascorbic acid content (AAC), antioxidant activity (AA).
Although antioxidant activity (AA) was not directly used to evaluate the plant water stress, it remains a good indicator of potential human health benefits. High antioxidant activity and variability were observed between crop years and irrigation strategies. Sub-PRD, SSDI and SDI in 2023 and SDI in 2024 exhibited the highest AA value, while the lowest was observed in SPR in both crop years (40 ± 4 and 30 ± 10 mg TE 100 g−1 FW).
4. Discussion
Deficit irrigation strategies, such as subsurface drip irrigation, partial root zone drying, subterranean partial root zone drying, and micro-spray irrigation, offer different methods to optimize water use in agriculture, especially in regions with limited water resources. However, it is necessary to carefully plan, monitor, and maintain the system, to ensure that water stress does not negatively affect crop yield and quality. Therefore, powerful tools for non-destructive monitoring of the effect of stress on plant, yield and fruit quality are necessary.
Throughout the years, numerous studies have been carried out to investigate and develop effective methods for the detection of stress in plants. Recently, proximal sensing tools, such as hyperspectral imaging and thermal IR cameras, are being used for the evaluation of plant water stress [5,17,18,19,20].
4.1. Infrared Thermography Evaluation
Infrared thermography involves capturing images in the infrared spectrum, which can reveal how the plant’s surface temperature is influenced by water availability and transpiration. Several physiological changes, such as stomatal closure, reduced transpiration and heat dissipation, and increased leaf temperatures, that occur in water-stressed plants can be detected using IR imaging [36,37]. In our study, the correlation between irrigation strategies and thermal images revealed different phenological responses, as illustrated in Figure 10 and Table 4. Notably, temperature variability observed on thermal images of the same tree can be attributed to differences in leaf orientation and canopy exposure to light, both of which influence leaf heating [38]. On the other hand, the temperature differences observed among the five irrigation strategies may be related to the physiological effects of water stress, which induce stomatal closure. When stomata are closed, leaf temperature becomes more reliant on the leaf’s ability to exchange sensible heat with the surrounding air [39]. Specifically, under the PRD strategy, the canopy’s ability to exchange sensible heat may be limited, causing the leaf temperature to rise significantly when stomata close in sunny conditions. In contrast, the SPR strategy, which applies to a larger volume of water, likely results in less leaf heating due to stomatal closure compared to the PRD strategy.
Despite the obvious benefits of using thermal IR cameras to determine quickly and easily canopy temperature distribution without causing any damage [40], there are some limitations to its use. First, leaf temperature is influenced by various environmental factors, such as environmental temperature, relative humidity, wind, and sunlight, which must be considered when interpreting thermal images to ensure that changes in leaf temperature are attributed to water stress rather than environmental conditions [4]. The structure of the plant canopy (leaves size, shape, structure, thickness, pigmentation composition) can affect how heat is emitted and captured by thermal cameras [41]. Accurate calibration of thermal cameras and data processing of thermal images are necessary to obtain correct information on plant physiological status. Finally, the traditional leaves’ physiological measurements represent a snapshot of the plant’s water status at a specific point in time and within a specific tissue. Their correlation with temperature of thermal images can lead to discrepancies due to differences in the temporal and spatial sampling between all the parameters considered [41].
4.2. Hyperspectral Images Evaluation
Water stress in plants can also be revealed through hyperspectral imaging devices. These instruments allow detecting specific spectral bands in the electromagnetic spectrum, which highlight distinct patterns of reflectance that change when plants are under water stress. These changes are most evident in certain wavelengths, especially in the visible and infrared regions [5,42]. In the green region (around 540–570 nm), the flattening of the curve indicates low light reflection in correspondence to the peak absorption of chlorophyll in plants. This band is useful for evaluating the overall health and physiological condition of plants. Water-stressed plants could show a decrease in chlorophyll, altering the reflectance in this band, and leading to changes in the plant’s green color [43]. The red band (around 650–670 nm) is important because water stress can affect the chlorophyll content of the plant, which influences the absorption in this region. As water stress increases, chlorophyll levels decrease, causing higher reflectance in the red region. The NIR band (750–800 nm) is one of the most widely used for detecting water stress [5]. Healthy plants with sufficient water exhibit a high reflectance in the NIR region due to the cellular structure of the leaves. As water stress begins to affect plants, the internal water content decreases, leading to lower reflectance in this region. This phenomenon can be easily observed in our study. HSI spectra related to SPR (i.e., the system with the highest irrigation volumes, especially in 2023) showed higher reflectance compared to that of the other systems in the NIR region during the hottest month. On the contrary, spectra with lower reflectance signals belonged to images related to less irrigated systems, such as Sub-PRD, PRD, and SSDI.
4.3. Spectral Indices Evaluation
In recent years, the optimization of irrigation strategies, the improvement of water use efficiency, and the early detection of stressful conditions are carried out also using spectral indices, calculated from HSI spectral reflectance data. In fact, wavelengths characterize chlorophyll content, photosynthetic activity, and cellular architecture [44]. The normalized difference vegetation index (NDVI) is one of the most widely used spectral indices to monitor the general health and vigor of plants [45]. In this study, NDVI values ranged from 0.844 to 0.908, indicating an optimal plant health status also under deficit irrigation. The clear correlation between NDVI and stem water potential was observed. When a plant has sufficient water, high NDVI values are recorded, as the leaves are well-hydrated, and the chlorophyll content is optimal. Stem water potential in such plants will generally be less negative, indicating that the plant is well-watered and capable of maintaining turgor pressure. When water stress increases, plants begin to conserve water by reducing transpiration, closing stomata, and limiting photosynthesis. Therefore, NDVI values decrease, as the vegetation becomes less photosynthetically active. At the same time, stem water potential becomes more negative, indicating plant stress. There is a strong correlation between NDVI and stem stomatal conductance, since they are both influenced by the plant’s ability to perform photosynthesis and transpiration, which are closely linked. When a plant is healthy and well-watered, its stomata remain open for adequate transpiration and CO2 uptake, resulting in higher stomatal conductance. Healthy plants also have a high chlorophyll content, which corresponds to high NDVI values, reflecting active photosynthesis and efficient water use. Under water stress conditions, the plant closes its stomata to conserve water. This often leads to a decrease in NDVI due to reduced photosynthetic activity and lower chlorophyll content. As stomatal conductance decreases, the plant’s ability to uptake CO2 for photosynthesis diminishes, leading to lower NDVI values. A healthy plant can efficiently absorb CO2 and produce sugars, leading to a high net photosynthetic rate, whereas water stress can lead to a decrease in stomatal conductance, which reduces CO2 uptake for photosynthesis and limits net photosynthetic rate, resulting in low NDVI values. There is a strong correlation also between NDVI and SPAD, with both being indicators of chlorophyll content and photosynthetic activity in plants. Since chlorophyll is the primary pigment involved in photosynthesis, both NDVI and SPAD values tend to increase together under optimal growing conditions. Under stress conditions, both SPAD values and NDVI tend to decrease simultaneously, indicating reduced plant health and photosynthetic efficiency.
The plant physiological status can be monitored also with the water index (WI), based on the reflectance of the NIR bands, which are sensitive to water absorption in plant tissues. Therefore, WI provides an effective measure of water content in leaves. High WI values typically indicate that the plant has sufficient water content in its tissues. As water becomes less available, plants show a reduction in the amount of water in their tissues, leading to a decrease in WI. In this study, all the WI values detected were greater than 0.9, indicating a limited stress of the plants even in the hottest months.
The photochemical reflectance index (PRI) is a spectral index used to monitor plant photosynthetic efficiency and stress, especially in relation to water availability [46]. PRI specifically measures the reflectance of light at wavelengths that are sensitive to changes in chlorophyll fluorescence, which is related to the efficiency of the plant’s photosynthesis [47,48]. When water stress increases, PRI values tend to decrease due to a reduction in photosynthetic efficiency and energy dissipation.
The transformed chlorophyll absorption ratio index (TCARI) is a spectral index sensitive to changes in chlorophyll absorption in the red region, and its response to water stress can provide valuable insights into plant health under drought or limited water conditions [32]. Therefore, TCARI is correlated with indicators of the physiological state of plants under water stress, because chlorophyll content and photosynthesis are directly affected by water availability. When plants are well-watered and healthy, TCARI values are high, indicating that the plant is using light energy effectively for photosynthesis. High TCARI values mean that plants have open stomata, efficient CO2 uptake, optimal photosystem activity; therefore, chlorophyll absorption is high, and light energy is efficiently converted into chemical energy. In this study, a negative correlation between the TCARI and leaf chlorophyll content, determined by SPAD, was shown, as previously found by Zhang et al. [49] and Colovic et al. [50].
The use of hyperspectral imaging devices and the spectral indices have some limitations to keep in mind. Environmental factors, such as light intensity, temperature, and atmospheric conditions, can influence the acquisition of images. The correlations between spectral indices values and plant physiological status measurements vary depending on environmental conditions, the species of plant, the timing of measurements, canopy density, leaf area, and plant structure. Moreover, discrepancies can be found because spectral signals can be influenced by the amount of vegetation present, whereas physiological measurements are referred to content in few individual leaves. The presence of shading due to dense canopies or leaves with different orientations can influence the amount of light that is reflected, potentially impacting the accuracy of spectral indices as an indicator of water stress. Soil reflectance and other background factors can affect spectral indices; therefore, careful calibration and data processing are necessary.
4.4. Fruit Quality Evaluation
Unfavorable climatic conditions and water stress in citrus trees can significantly affect the quality of the fruit, influencing a range of parameters including the size, color, flavor, texture, and nutritional content [27,51,52]. These changes are primarily due to the plant’s effort to conserve water, which leads to altered physiological processes in both the tree and the fruit. Dong et al. [53] attributed the significant impact on the production of various crops, particularly long-term fruit-bearing plants such as citrus, to the different climatic conditions that occurred during different crop years. Stressful climatic conditions, such as high cumulative temperature, irregular rainfall, and extended light exposure, affect photosynthetic efficiency. These then subsequently affect the growth, development, yield of fruit trees, and qualitative parameters, such as total production, fruit weight, soluble solid content, titratable acidity, dry matter, total phenolic content, total monomeric anthocyanins, ascorbic acids content, and antioxidant activity [54,55,56]. From the comparison of the two years, a similar trend regarding the qualitative parameters to those reported by many authors was observed [54,55,56]. Regarding water management, a significant reduction in fruit yield was found [51]. On the contrary, Aguato et al. [22] reported no significant effect of water deficit on fruit yield. Nagaz et al. [51] also highlighted that irrigation at 100% ETc produced higher yields compared to 75% and 50% ETc, partially in agreement with our results. Regarding WUE, our results showed a similar trend reported by Silveira et al. [57], who observed a WUE increase when deficit irrigation was applied. Different from Kallsen et al. [52], slight differences were found for the fruits’ weight, skin, and pulp color coordinates, except for b* in relation to the different irrigation strategies. In general, the highest values of pomological traits (TSS, TA) were observed when water restriction was applied. Significant variation among different sustained deficit irrigation in total soluble solids (TSS) and titratable acidity (TA) were also reported by Garcia et al. [34]. As previously reported, water availability affects photosynthetic efficiency and subsequently affects the TSS and TA biosynthesis [54,55,56] and directly the TSS:TA ratio that could be considered a good indicator of consumer fruit acceptability. In the same way, dry matter accumulation could be affected by water availability. Finally, as regards phytochemical profiles, significant variation in all parameters investigated was highlighted, except for AAC. As reported by Zandalinas et al. [58], citrus plant mechanisms for acclimatation and adaptation to the different environmental conditions, such as water stress, are based on the activation of specific physiological and molecular responses. These responses, in turn, lead to changes in plant metabolism stress inducted damage. In this context, secondary metabolites, such as phenols, play an important role for plant acclimatation and survival to varying abiotic stress [59]. In citrus species, all metabolite changes suggest the activation of energy metabolism along with metabolic pathways leading to the accumulation of photoprotective and antioxidant secondary metabolites, oriented to mitigate the damaging effects of stress [58]. Plant metabolic profile variation due to the different water availability significantly affected the phytochemical profiles of the fruits, as suggested by our results.
5. Conclusions
Due to global climate change, the sustainable management of natural resources becomes increasingly crucial for plant health, particularly for tree species and fruit production, which are often more vulnerable to environmental stressors such as water scarcity. In our study, traditional measurements on plant physiological status highlighted a good tree response to different irrigation strategies, although PRD was the less effective system. The four irrigation systems were more efficient (up to 50%) in water-use than the control system. Regarding production, the SSDI system ensured the highest production in the two years, whereas slight differences among irrigation systems were for all quality parameters. Moreover, to address the challenge of effective water management, high-throughput, and non-destructive assessment of plant water stress indicators was carried out to optimize irrigation efficiency. Proximal sensing tools (hyperspectral and thermal cameras) were tested for assessing the water status of orange trees in the field. Despite some limitations, our results demonstrated that these tools are powerful for monitoring plant health and detecting water stress in citrus trees. Data collected from HSI and thermal cameras were processed to distinguish between healthy and water-stressed plants in relation to the five different water managements, highlighting the most sustainable and efficient irrigation strategies. Moreover, spectral indices, such as NDVI, WI, PRI, and TCARI, were calculated and were found to be valid in early drought detection, as their results correlated with physiological traits, especially with stem water potential and the amount of leaf chlorophyll. By combining proximal sensing results with the traditional measurements of plant status, it was possible to gain deeper insights into plant physiology and obtain early and useful information to improve crop management practices. The use of hyperspectral and thermal cameras will facilitate flexible and cost-efficient data collection campaigns for precision agriculture and environmental monitoring, helping farmers monitor plant stress, optimize fertilization, and predict crop yields in the near future.
Author Contributions
Conceptualization, G.R., F.S., R.C. (Roberto Ciccoritti) and T.A.; methodology, G.R., F.S., R.C. (Roberto Ciccoritti) and T.A.; software, T.A. and R.C. (Roberto Ciccoritti); validation, G.R., F.S., A.R., R.C. (Roberto Ciccoritti) and T.A.; formal analysis, G.R., F.S., A.R., R.C. (Roberto Ciorba) and R.C. (Roberto Ciccoritti); data curation, G.R., F.S., A.R., R.C. (Roberto Ciccoritti) and T.A.; writing—original draft preparation, G.R., F.S., A.R., R.C. (Roberto Ciccoritti) and T.A.; writing—review and editing, G.R., R.C. (Roberto Ciccoritti) and T.A.; project administration, G.R.; funding acquisition, G.R. All authors have read and agreed to the published version of the manuscript.
Funding
This research was supported by the SAMOTHRACE project (Avviso 3277-“SAMOTHRACE” ECS00000022–CUP B63D21015260004; Missione 4 Istruzione e Ricerca-Componente 2-Investimento 1.5 “PNRR”, NGEU)”.
Data Availability Statement
The original contributions presented in the study are included in the article, further inquiries can be directed to the corresponding authors.
Acknowledgments
Grateful acknowledgements are given to Roberto Santoro for his technical assistance and to the reviewers for their efforts in improving the quality of the paper.
Conflicts of Interest
The authors declare no conflicts of interest.
References
- Matese, A.; Baraldi, R.; Berton, A.; Cesaraccio, C.; Di Gennaro, S.F.; Duce, P.; Facini, O.; Mameli, M.G.; Piga, A.; Zaldei, A. Estimation of Water Stress in Grapevines Using Proximal and Remote Sensing Methods. Remote Sens. 2018, 10, 114. [Google Scholar] [CrossRef]
- Espinoza, C.Z.; Khot, L.R.; Sankaran, S.; Jacoby, P.W. High resolution multispectral and thermal remote sensing-based water stress assessment in subsurface irrigated grapevines. Remote Sens. 2017, 9, 961. [Google Scholar] [CrossRef]
- Jarolmasjed, S.; Sankaran, S.; Kalcsits, L.; Khot, L.R. Proximal hyperspectral sensing of stomatal conductance to monitor the efficacy of exogenous abscisic acid applications in apple trees. Crop Prot. 2018, 109, 42–50. [Google Scholar] [CrossRef]
- Abbatantuono, F.; Lopriore, G.; Tallou, A.; Brillante, L.; Ali, S.A.; Camposeo, S.; Vivaldi, G.A. Recent progress on grapevine water status assessment through remote and proximal sensing: A review. Sci. Hortic. 2024, 338, 113658. [Google Scholar] [CrossRef]
- Sanaeifar, A.; Yang, C.; de la Guardia, M.; Zhang, W.; Li, X.; He, Y. Proximal hyperspectral sensing of abiotic stresses in plants. Sci. Total Environ. 2023, 861, 160652. [Google Scholar] [CrossRef]
- Nikolaou, G.; Neocleous, D.; Christou, A.; Kitta, E.; Katsoulas, N. Implementing sustainable irrigation in water-scarce regions under the impact of climate change. Agronomy 2020, 10, 1120. [Google Scholar] [CrossRef]
- Gómez-Bellot, M.J.; Parra, A.; Nortes, P.; Alarcón, J.J.; Ortuño, M.F. Searching for a deficit irrigation strategy to save water and improve fruit quality without compromising pomegranate production. Sci. Hortic. 2024, 324, 112631. [Google Scholar] [CrossRef]
- Carella, A.; Massenti, R.; Marra, F.P.; Catania, P.; Roma, E.; Lo Bianco, R. Combining proximal and remote sensing to assess ‘Calatina’ olive water status. Front. Plant Sci. 2024, 15, 1448656. [Google Scholar] [CrossRef]
- Romero, P.; García, J.; Botía, P. Cost-benefit analysis of a regulated deficit-irrigated almond orchard under subsurface drip irrigation conditions in Southeastern Spain. Irrig. Sci. 2006, 24, 175–184. [Google Scholar] [CrossRef]
- Dodd, I.C. Soil moisture heterogeneity during deficit irrigation alters root-to-shoot signalling of abscisic acid. Funct. Plant Biol. 2007, 34, 439. [Google Scholar] [CrossRef]
- Wang, Y.; Liu, F.; de Neergaard, A.; Jensen, L.S.; Luxhøi, J.; Jensen, C.R. Alternate partial root-zone irrigation induced dry/wet cycles of soils stimulate N mineralization and improve N nutrition in tomatoes. Plant Soil 2010, 337, 167–177. [Google Scholar] [CrossRef]
- Lamm, F.R.; Camp, C.R. Subsurface drip irrigation. Dev. Agric. Eng. 2007, 13, 473–551. [Google Scholar]
- Parra, M.; Hortelano, D.; García-Sánchez, F.; Intrigliolo, D.S.; Rubio-Asensio, J.S. Effects of Drip Irrigation Design on a Lemon and a Young Persimmon Orchard in Semi-Arid Conditions. Water 2021, 13, 1795. [Google Scholar] [CrossRef]
- Bazzi, C.L.; Schenatto, K.; Upadhyaya, S.D.; Rojo, S.; Kizer, E.; Ko-Madden, C.T. Optimal placement of proximal sensors for precision irrigation in tree crops. Precis. Agric. 2019, 20, 663–674. [Google Scholar] [CrossRef]
- Barbedo, J.G.A. A review on the combination of deep learning techniques with proximal hyperspectral images in agriculture. Comput. Electron. Agric. 2023, 210, 107920. [Google Scholar] [CrossRef]
- Brugger, A.; Schramowski, P.; Paulus, S.; Steiner, U.; Kersting, K.; Mahlein, A.K. Spectral signatures in the UV range can be combined with secondary plant metabolites by deep learning to characterize barley–powdery mildew interaction. Plant Pathol. 2021, 70, 1572–1582. [Google Scholar] [CrossRef]
- Pineda, M.; Baron, M.; Perez-Bueno, M.L. Thermal imaging for plant stress detection and phenotyping. Remote Sens. 2021, 13, 68. [Google Scholar] [CrossRef]
- Gómez-Candón, D.; Mathieu, V.; Martinez, S.; Labbé, S.; Delalande, M.; Regnard, J.L. Unravelling the responses of different apple varieties to water constraints by continuous field thermal monitoring. Sci. Hortic. 2022, 299, 111013. [Google Scholar] [CrossRef]
- Irik, H.A.; Ropelewska, E.; Cetin, N. Using spectral vegetation indices and machine learning models for predicting the yield of sugar beet (Beta vulgaris L.) under different irrigation treatments. Comput. Electron. Agric. 2024, 221, 109019. [Google Scholar] [CrossRef]
- Mertens, S.; Verbraeken, L.; Sprenger, H.; Demuynck, K.; Maleux, K.; Cannoot, B.; De Block, J.; Maere, S.; Nelissen, H.; Bonaventure, G.; et al. Proximal Hyperspectral Imaging Detects Diurnal and Drought-Induced Changes in Maize Physiology. Front. Plant Sci. 2021, 12, 640914. [Google Scholar] [CrossRef]
- Modica, G.; Arcidiacono, F.; Puglisi, I.; Baglieri, A.; La Malfa, S.; Gentile, A.; Arbona, V.; Continella, A. Response to Water Stress of Eight Novel and Widely Spread Citrus Rootstocks. Plants 2025, 14, 773. [Google Scholar] [CrossRef] [PubMed]
- Aguado, A.; Frías, J.; García-Tejero, I.; Romero, F.; Muriel, J.L.; Capote, N. Towards the Improvement of Fruit-Quality Parameters in Citrus under Deficit Irrigation Strategies. ISRN Agron. 2012, 2012, 940896. [Google Scholar] [CrossRef][Green Version]
- Allen, R.G.; Pereira, L.S.; Raes, D.; Smith, M. Crop evapotranspiration: Guide-lines for computing crop requirements. In Irrigation and Drainage; FAO: Rome, Italy, 1998; p. 56. [Google Scholar]
- Allen, R.G.; Pruitt, W.O.; Wright, J.L.; Howell, T.H.; Ventura, F.; Snyder, R.; Itenfisu, D.; Steduto, P.; Berengena, J.; Baselga Yrisarry, J.; et al. A recommendation on standardized surface resistance for hourly calculation of reference EToby the FAO56 Penman-Monteith method. Agric. Water Manag. 2006, 81, 1–22. [Google Scholar] [CrossRef]
- Scholander, P.F.; Bradstreet, E.D.; Hemmingsen, E.A.; Hammel, H.T. Sap pressure in vascular plants: Negative hydrostatic pressure can be measured in plants. Science 1965, 148, 339–346. [Google Scholar] [CrossRef] [PubMed]
- Puglisi, I.; Nicolosi, E.; Vanella, D.; Lo Piero, A.R.; Stagno, F.; Saitta, D.; Roccuzzo, G.; Consoli, S.; Baglieri, A. Physiological and Biochemical Responses of Orange Trees to Different Deficit Irrigation Regimes. Plants 2019, 8, 423. [Google Scholar] [CrossRef]
- Stagno, F.; Intrigliolo, F.; Consoli, S.; Continella, A.; Roccuzzo, G. Response of Orange Trees to Deficit Irrigation Strategies: Effects on Plant Nutrition, Yield, and Fruit Quality. J. Irrig. Drain. Eng. 2015, 141, 04015014. [Google Scholar] [CrossRef]
- Ceccarelli, D.; Antonucci, F.; Costa, C.; Talento, C.; Ciccoritti, R. An artificial class modelling approach to identify the most largely diffused cultivars of sweet cherry (Prunus avium L.) in Italy. Food Chem. 2020, 333, 127515. [Google Scholar] [CrossRef]
- Amoriello, T.; Ciorba, R.; Ruggiero, G.; Amoriello, M.; Ciccoritti, R. A Performance Evaluation of Two Hyperspectral Imaging Systems for the Prediction of Strawberries’ Pomological Traits. Sensors 2024, 24, 174. [Google Scholar] [CrossRef]
- Castillo-Girones, S.; Munera, S.; Martinez-Sober, M.; Blasco, J.; Cubero, S.; Gomez-Sanchis, J. Artificial Neural Network in Agriculture, the core of artificial intelligence: What, When and Why. Comput. Electron. Agric. 2025, 230, 109938. [Google Scholar] [CrossRef]
- Ciccoritti, R.; Ruggiero, G.; Ciorba, R.; Manetti, C.; Amoriello, M.; Amoriello, T. Shelf-life assessment of apricot fruit during cold storage by a portable visible and near-infrared hyperspectral imaging device. Eur. Food Res. Technol. 2025, 251, 545–558. [Google Scholar] [CrossRef]
- Elvanidi, A.; Katsoulas, N.; Ferentinos, K.P.; Bartzanas, T.; Kittas, C. Hyperspectral machine vision as a tool for water stress severity assessment in soilless tomato crop. Biosyst. Eng. 2018, 165, 25–35. [Google Scholar] [CrossRef]
- Hammer, Ø.; Harper, D.A.; Ryan, P.D. PAST: Paleontological statistics software package for education and data analysis. Palaeontol. Electron. 2001, 4, 9. [Google Scholar]
- García-Tejero, I.; Durán-Zuazo, V.H.; Muriel-Fernández, J.L.; Martínez-García, G.; Jiménez-Bocanegra, J.A. Benefits of low-frequency irrigation in citrus orchards. Agron. Sustain. Dev. 2011, 31, 779–791. [Google Scholar] [CrossRef]
- García-Tejero, I.; Romero-Vicente, R.; Jiménez-Bocanegra, J.A.; Martínez-García, G.; Durán-Zuazo, V.H.; Muriel-Fernández, J.L. Response of citrus trees to deficit irrigation during different phenological periods in relation to yield, fruit quality, and water productivity. Agric. Water Manag. 2010, 97, 689–699. [Google Scholar] [CrossRef]
- Ballester, C.; Castel, J.; Testi, L.; Intrigliolo, D.S. Can heat-pulse sap flow measurements be used as continuous water stress indicators of citrus trees? Irrig. Sci. 2013, 31, 1053–1063. [Google Scholar] [CrossRef]
- Carrasco-Benavides, M.; Antunez-Quilobran, J.; Baffico-Hernandez, A.; Avila-Sanchez, C.; Ortega-Farías, S.; Espinoza, S.; Gajardo, J.; Mora, M.; Fuentes, S. Performance assessment of thermal infrared cameras of different resolutions to estimate tree water status from two cherry cultivars: An alternative to midday stem water potential and stomatal conductance. J. Sens. 2020, 20, 3596. [Google Scholar] [CrossRef]
- Bellvert, J.; Marsal, J.; Girona, J.; Zarco-Tejada, P.J. Seasonal evolution of crop water stress index in grapevine varieties determined with high-resolution remote sensing thermal imagery. Irrig. Sci. 2015, 33, 81–93. [Google Scholar] [CrossRef]
- Nobel, P.S. Physiochemical and Environmental Plant Physiology, 4th ed.; Academic Press: Amsterdam, The Netherlands, 2009; 582p. [Google Scholar]
- Wen, T.; Li, J.H.; Wang, Q.; Gao, Y.Y.; Hao, G.F.; Song, B.A. Thermal imaging: The digital eye facilitates high-throughput phenotyping traits of plant growth and stress responses. Sci. Total Environ. 2023, 899, 165626. [Google Scholar] [CrossRef]
- Velazquez-Chavez, L.J.; Daccache, A.; Mohamed, A.Z.; Centritto, M. Plant-based and remote sensing for water status monitoring of orchard crops: Systematic review and meta-analysis. Agric. Water Manag. 2024, 303, 109051. [Google Scholar] [CrossRef]
- Zahir, S.A.D.M.; Omar, A.F.; Jamlos, M.F.; Azmi, M.A.M.; Muncan, J. A review of visible and near-infrared (Vis-NIR) spectroscopy application in plant stress detection. Sens. Actuators A Phys. 2022, 338, 113468. [Google Scholar] [CrossRef]
- Zahir, S.A.D.M.; Jamlos, M.F.; Omar, A.F.; Nordin, M.A.H.; Raypah, M.E.A.; Mamat, R.; Jamlos, M.A.; Muncan, J. Quantifying the impact of varied NPK fertilizer levels on oil palm plants during the nursery stage: A Vis-NIR spectral reflectance analysis. Smart Agric. Technol. 2025, 11, 100864. [Google Scholar] [CrossRef]
- Zhu, K.; Sun, Z.; Zhao, F.; Yang, T.; Tian, Z.; Lai, J.; Zhu, W.; Long, B. Relating hyperspectral vegetation indices with soil salinity at different depths for the diagnosis of winter wheat salt stress. Remote Sens. 2021, 13, 250. [Google Scholar] [CrossRef]
- Watt, M.; Leonardo, E.M.C.; Estarija, H.J.C.; Massam, P.; de Silva, D.; O’Neill, R.; Lane, R.; McDougal, R.; Buddenbaum, H.; Zarco-Tejada, P.J. Long-term effects of water stress on hyperspectral remote sensing indicators in young radiata pine. For. Ecol. Manag. 2021, 502, 119707. [Google Scholar] [CrossRef]
- Cogato, A.; Jewan, S.Y.Y.; Wu, L.; Marinello, F.; Meggio, F.; Sivilotti, P.; Sozzi, M.; Pagay, V. Water Stress Impacts on Grapevines (Vitis vinifera L.) in Hot Environments: Physiological and Spectral Responses. Agronomy 2022, 12, 1819. [Google Scholar] [CrossRef]
- Gitelson, A.A.; Gamon, J.A.; Solovchenko, A. Multiple drivers of seasonal change in PRI: Implications for photosynthesis 1. Leaf level. Remote Sens. Environ. 2017, 191, 110–116. [Google Scholar] [CrossRef]
- Cao, Z.; Yao, X.; Liu, H.; Liu, B.; Cheng, T.; Tian, Y.; Cao, W.; Zhu, Y. Comparison of the abilities of vegetation indices and photosynthetic parameters to detect heat stress in wheat. Agric. For. Meteorol. 2019, 265, 121–136. [Google Scholar] [CrossRef]
- Zhang, C.; Dai, X.; Qin, Q.; Li, J.; Zhang, T.; Sun, Y. Spectral characteristics of copper-stressed vegetation leaves and further understanding of the copper stress vegetation index. Int. J. Remote Sens. 2019, 40, 4473–4488. [Google Scholar] [CrossRef]
- Colovic, M.; Yu, K.; Todorovic, M.; Cantore, V.; Hamze, M.; Albrizio, R.; Stellacci, A.M. Hyperspectral Vegetation Indices to Assess Water and Nitrogen Status of Sweet Maize Crop. Agronomy 2022, 12, 2181. [Google Scholar] [CrossRef]
- Nagaz, K.; El Mokh, F.; Ben Hassen, N.; Masmoudi, M.M.; Ben Mechlia, N.; Baba Sy, M.O.; Belkheiri, O.; Ghiglieri, G. Impact of Deficit Irrigation on Yield and Fruit Quality of Orange Trees (Citrus sinensis, L. Osbeck, CV. Meski Maltaise) in Southern Tunisia. Irrig. Drain. 2017, 69, 186–193. [Google Scholar] [CrossRef]
- Kallsen, C.E.; Sanden, B.; Arpaia, M.L. Early navel orange fruit yield, quality, and maturity in response to late-season water stress. HortScience 2011, 46, 1163–1169. [Google Scholar] [CrossRef]
- Dong, Z.; Chen, M.; Srivastava, A.K.; Mahmood, U.H.; Ishfaq, M.; Shi, X.; Zhang, F. Climate changes altered the citrus fruit quality: A 9-year case study in China. Sci. Total Environ. 2024, 923, 171406. [Google Scholar] [CrossRef] [PubMed]
- Dhungana, S.R.; Braun, D.M. Sugar transporters in grasses: Function and modulation in source and storage tissues. J. Plant Physiol. 2021, 266, 153541. [Google Scholar] [CrossRef]
- Dong, Z.H.; Srivastava, A.K.; Tan, Q.L.; Riaz, M.; Lv, X.L.; Liu, X.D.; Hu, C.X. Effect of different spring and summer fertilization proportions on fruit yield, quality, and nutrient use efficiency of Newhall orange (Citrus sinensis Osbeck) orchard in Ganzhou province. J. Plant Nutr. 2023, 46, 2144–2154. [Google Scholar] [CrossRef]
- Gao, G.; Yan, L.; Tong, K.; Yu, H.; Lu, M.; Wang, L.; Niu, Y. The potential and prospects of modified biochar for comprehensive management of salt-affected soils and plants: A critical review. Sci. Total Environ. 2024, 912, 169618. [Google Scholar] [CrossRef]
- Silveira, L.K.; Pavão, G.C.; dos Santos Dias, C.T.; Quaggio, J.A.; de Matos Pires, R.C. Deficit irrigation effect on fruit yield, quality and water use efficiency: A long-term study on Pêra-IAC sweet orange. Agric. Water Manag. 2020, 231, 106019. [Google Scholar] [CrossRef]
- Zandalinas, S.I.; Sales, C.; Beltrán, J.; Gómez-Cadenas, A.; Arbona, V. Activation of secondary metabolism in citrus plants is associated to sensitivity to combined drought and high temperatures. Front. Plant Sci. 2017, 7, 1954. [Google Scholar] [CrossRef]
- Fraser, C.M.; Chapple, C. The phenylpropanoid pathway in Arabidopsis. Arab. Book 2011, 9, e0152. [Google Scholar] [CrossRef]
Disclaimer/Publisher’s Note: The statements, opinions and data contained in all publications are solely those of the individual author(s) and contributor(s) and not of MDPI and/or the editor(s). MDPI and/or the editor(s) disclaim responsibility for any injury to people or property resulting from any ideas, methods, instructions or products referred to in the content. |
© 2025 by the authors. Licensee MDPI, Basel, Switzerland. This article is an open access article distributed under the terms and conditions of the Creative Commons Attribution (CC BY) license (https://creativecommons.org/licenses/by/4.0/).