
Life Cycle Carbon Footprint of Indonesian Refined Palm Oil and Its Embodied Emissions in Global Trade


Abstract
1. Introduction
2. Material and Methods
2.1. Life Cycle Carbon Footprint Assessment
2.1.1. Functional Unit and System Boundary
2.1.2. Life Cycle Inventory Analysis
2.2. Embodied Carbon Emissions Quantification
2.3. Data Sources and Assumptions
- (1)
- Standardized Production Processes: It is assumed that the technological level and operational practices of RPO production in Indonesia are representative of the industry, reflecting the average production conditions in major producing regions. This assumption ensures the generalizability of the findings to Indonesia’s RPO sector.
- (2)
- By-product Allocation: It is assumed that the market demand and price of palm kernel remain stable, and thus, a mass-based allocation method is applied for distributing the carbon footprint between RPO and its by-products. Potential impacts of market price fluctuations and downstream applications on allocation results are not considered in this study in order to simplify the calculation and maintain consistency in the allocation approach.
- (3)
- 100% maritime shipping: It is assumed that all RPO exports are transported exclusively by maritime shipping, without considering the use of other transport modes such as land or air. Although alternative modes may be used in certain cases, their likelihood is low, and the volume involved is limited. Therefore, this assumption is considered to have a minimal impact on the overall results.
3. Results and Analysis
3.1. Carbon Footprint of Indonesian Refined Palm Oil Production
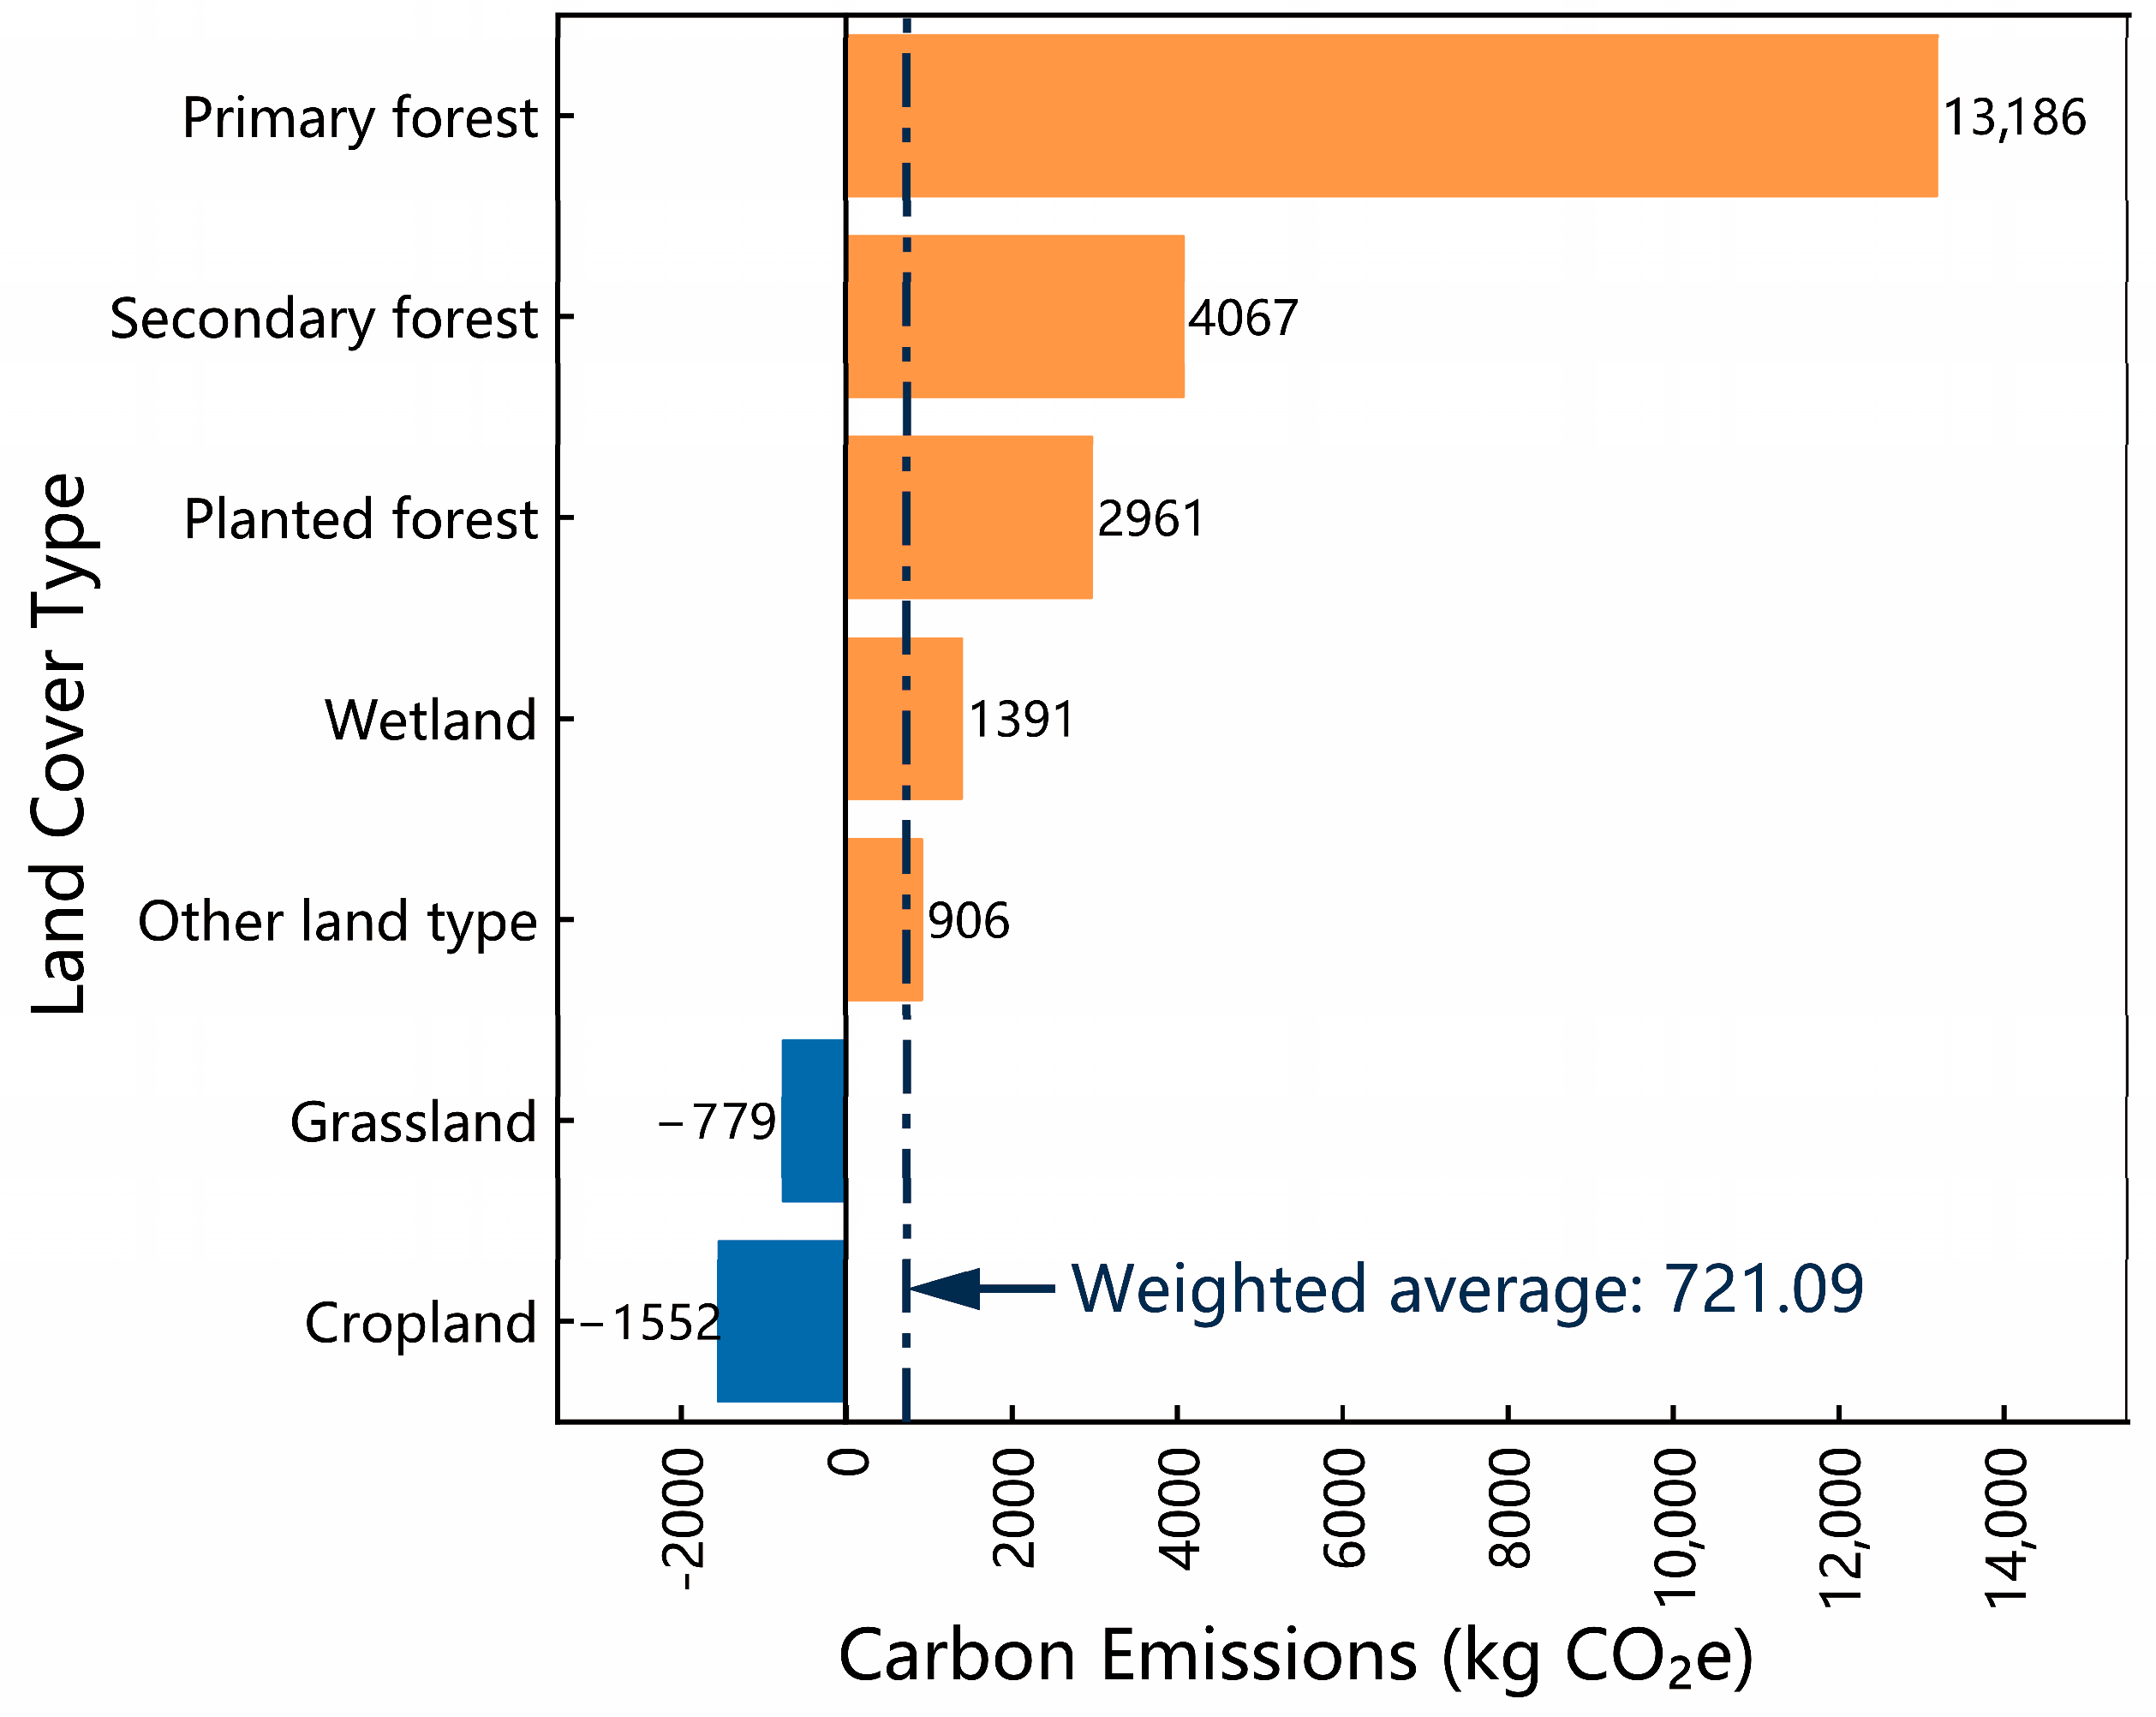
3.1.1. Impact of LUC on the Carbon Footprint
3.1.2. Lifecycle Carbon Footprint Analysis
3.1.3. Spatiotemporal Dynamics of RPO Carbon Footprint
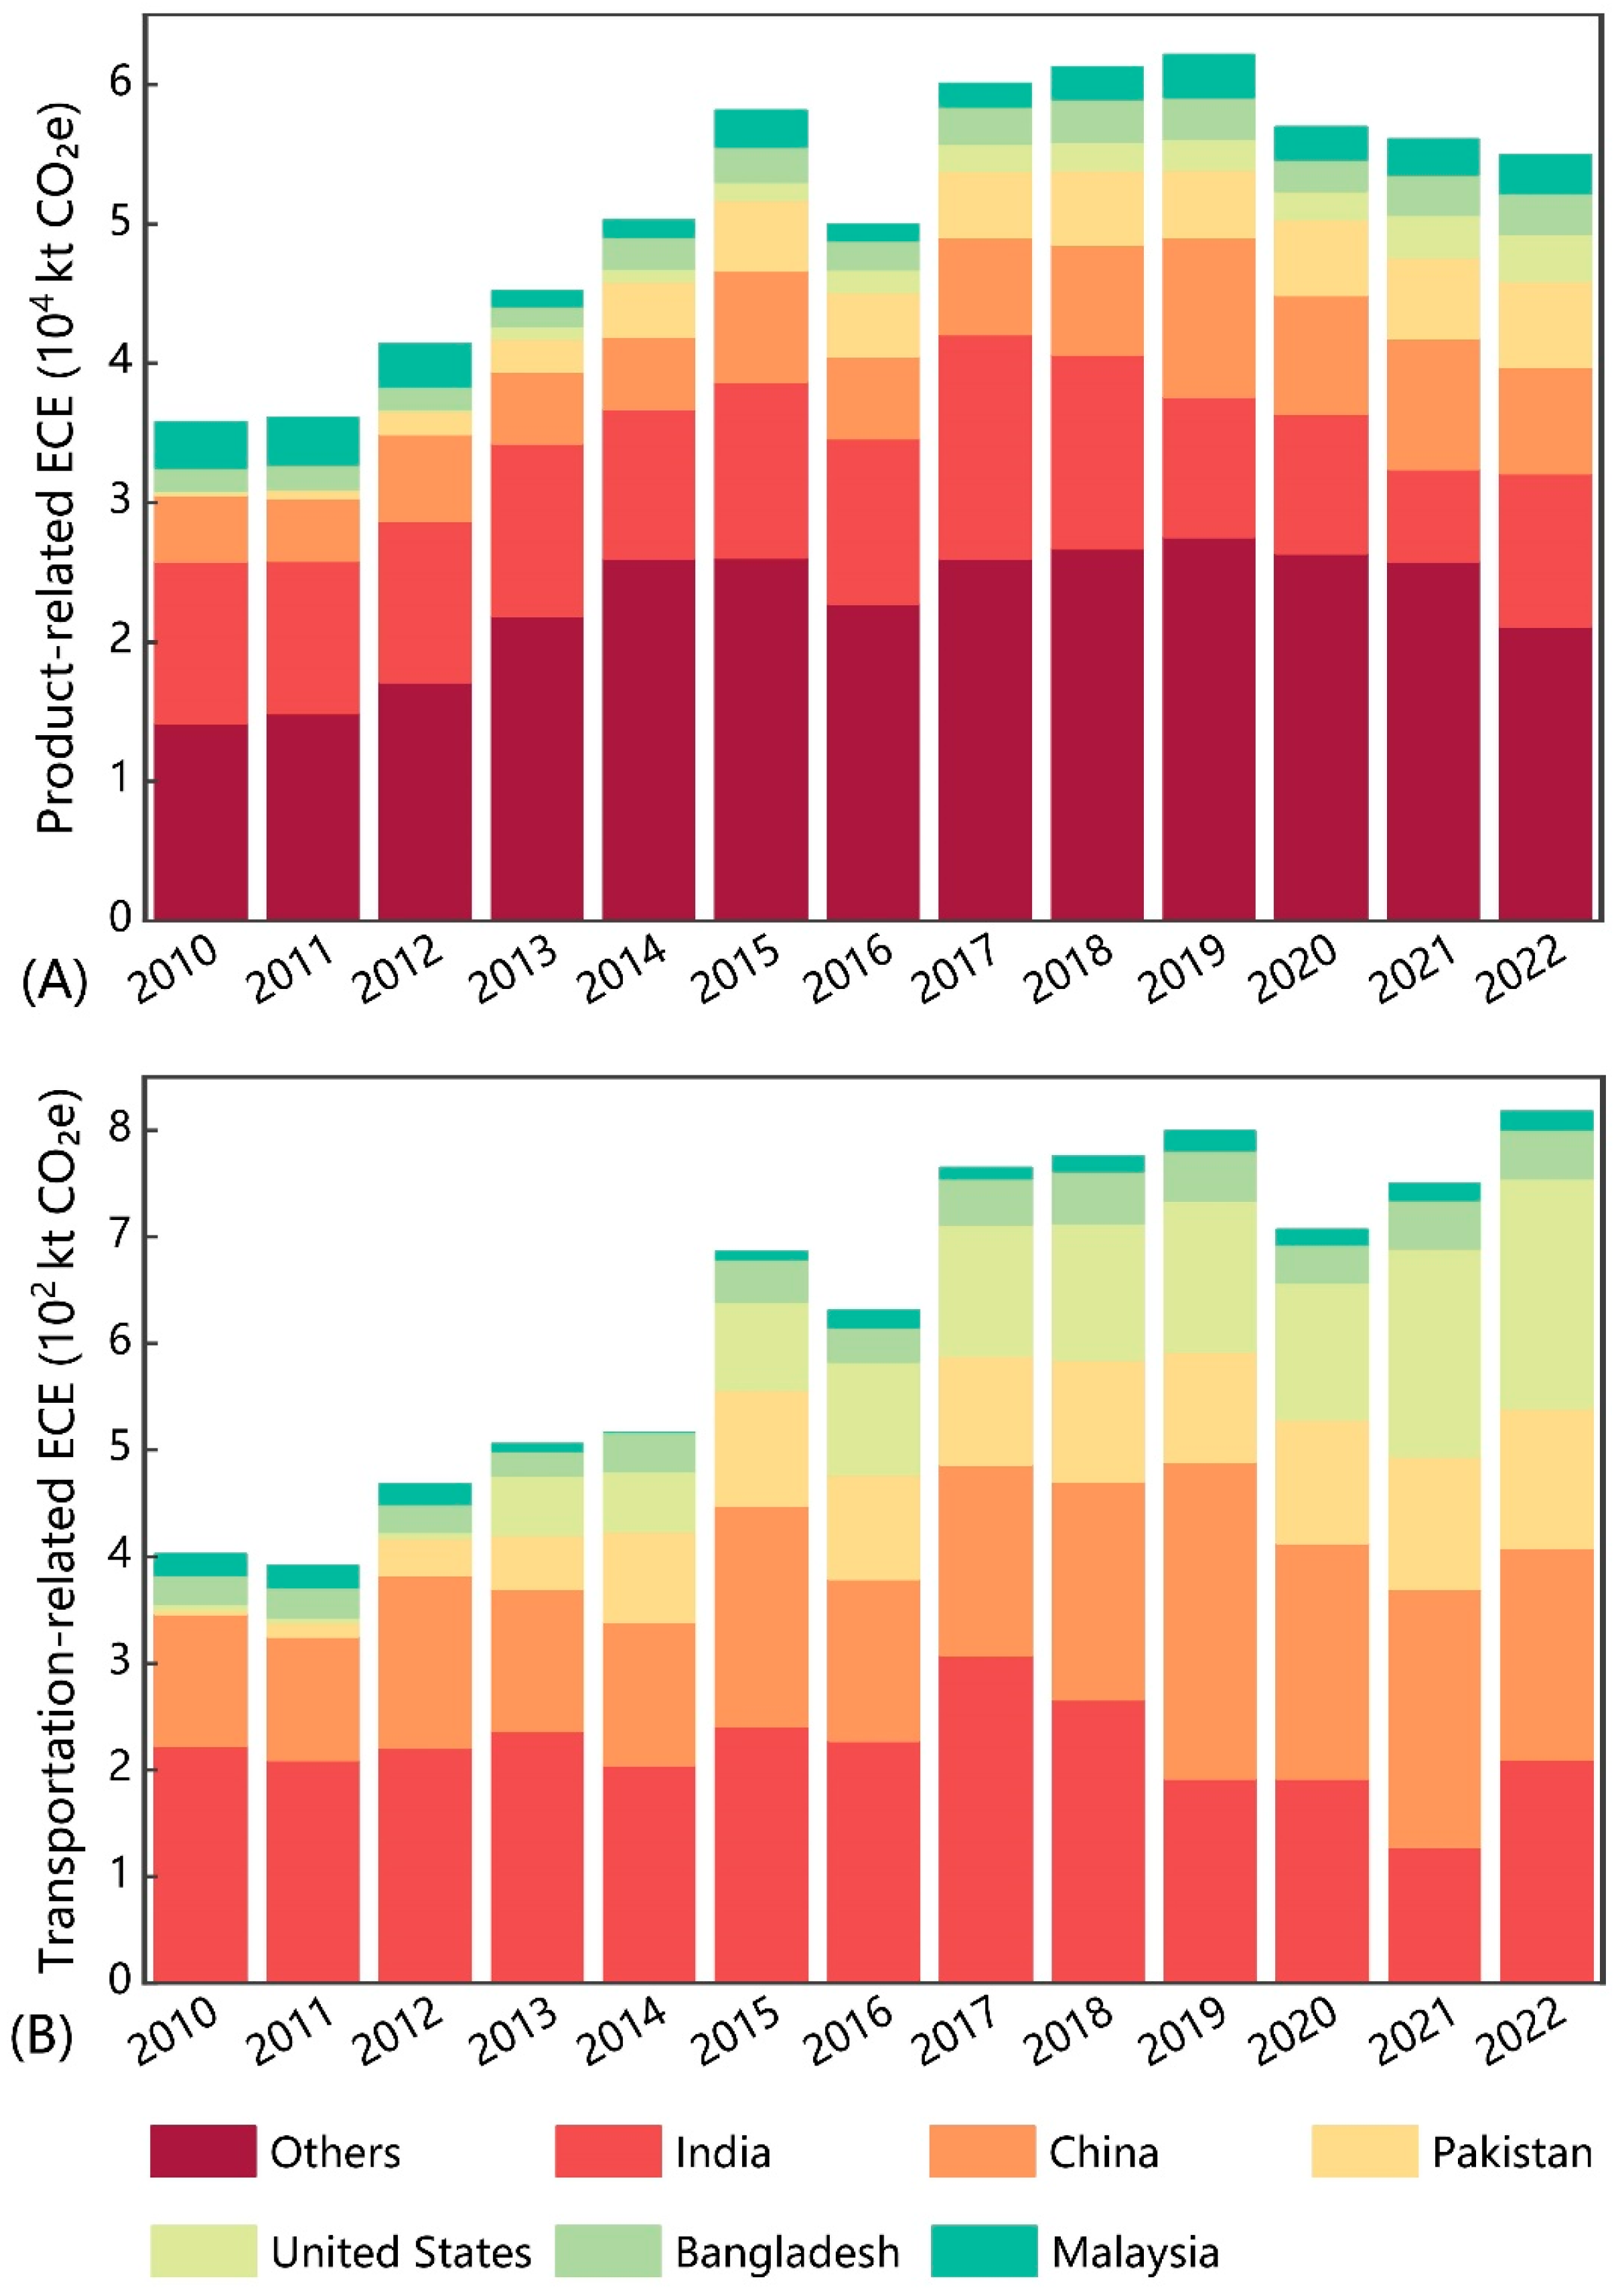
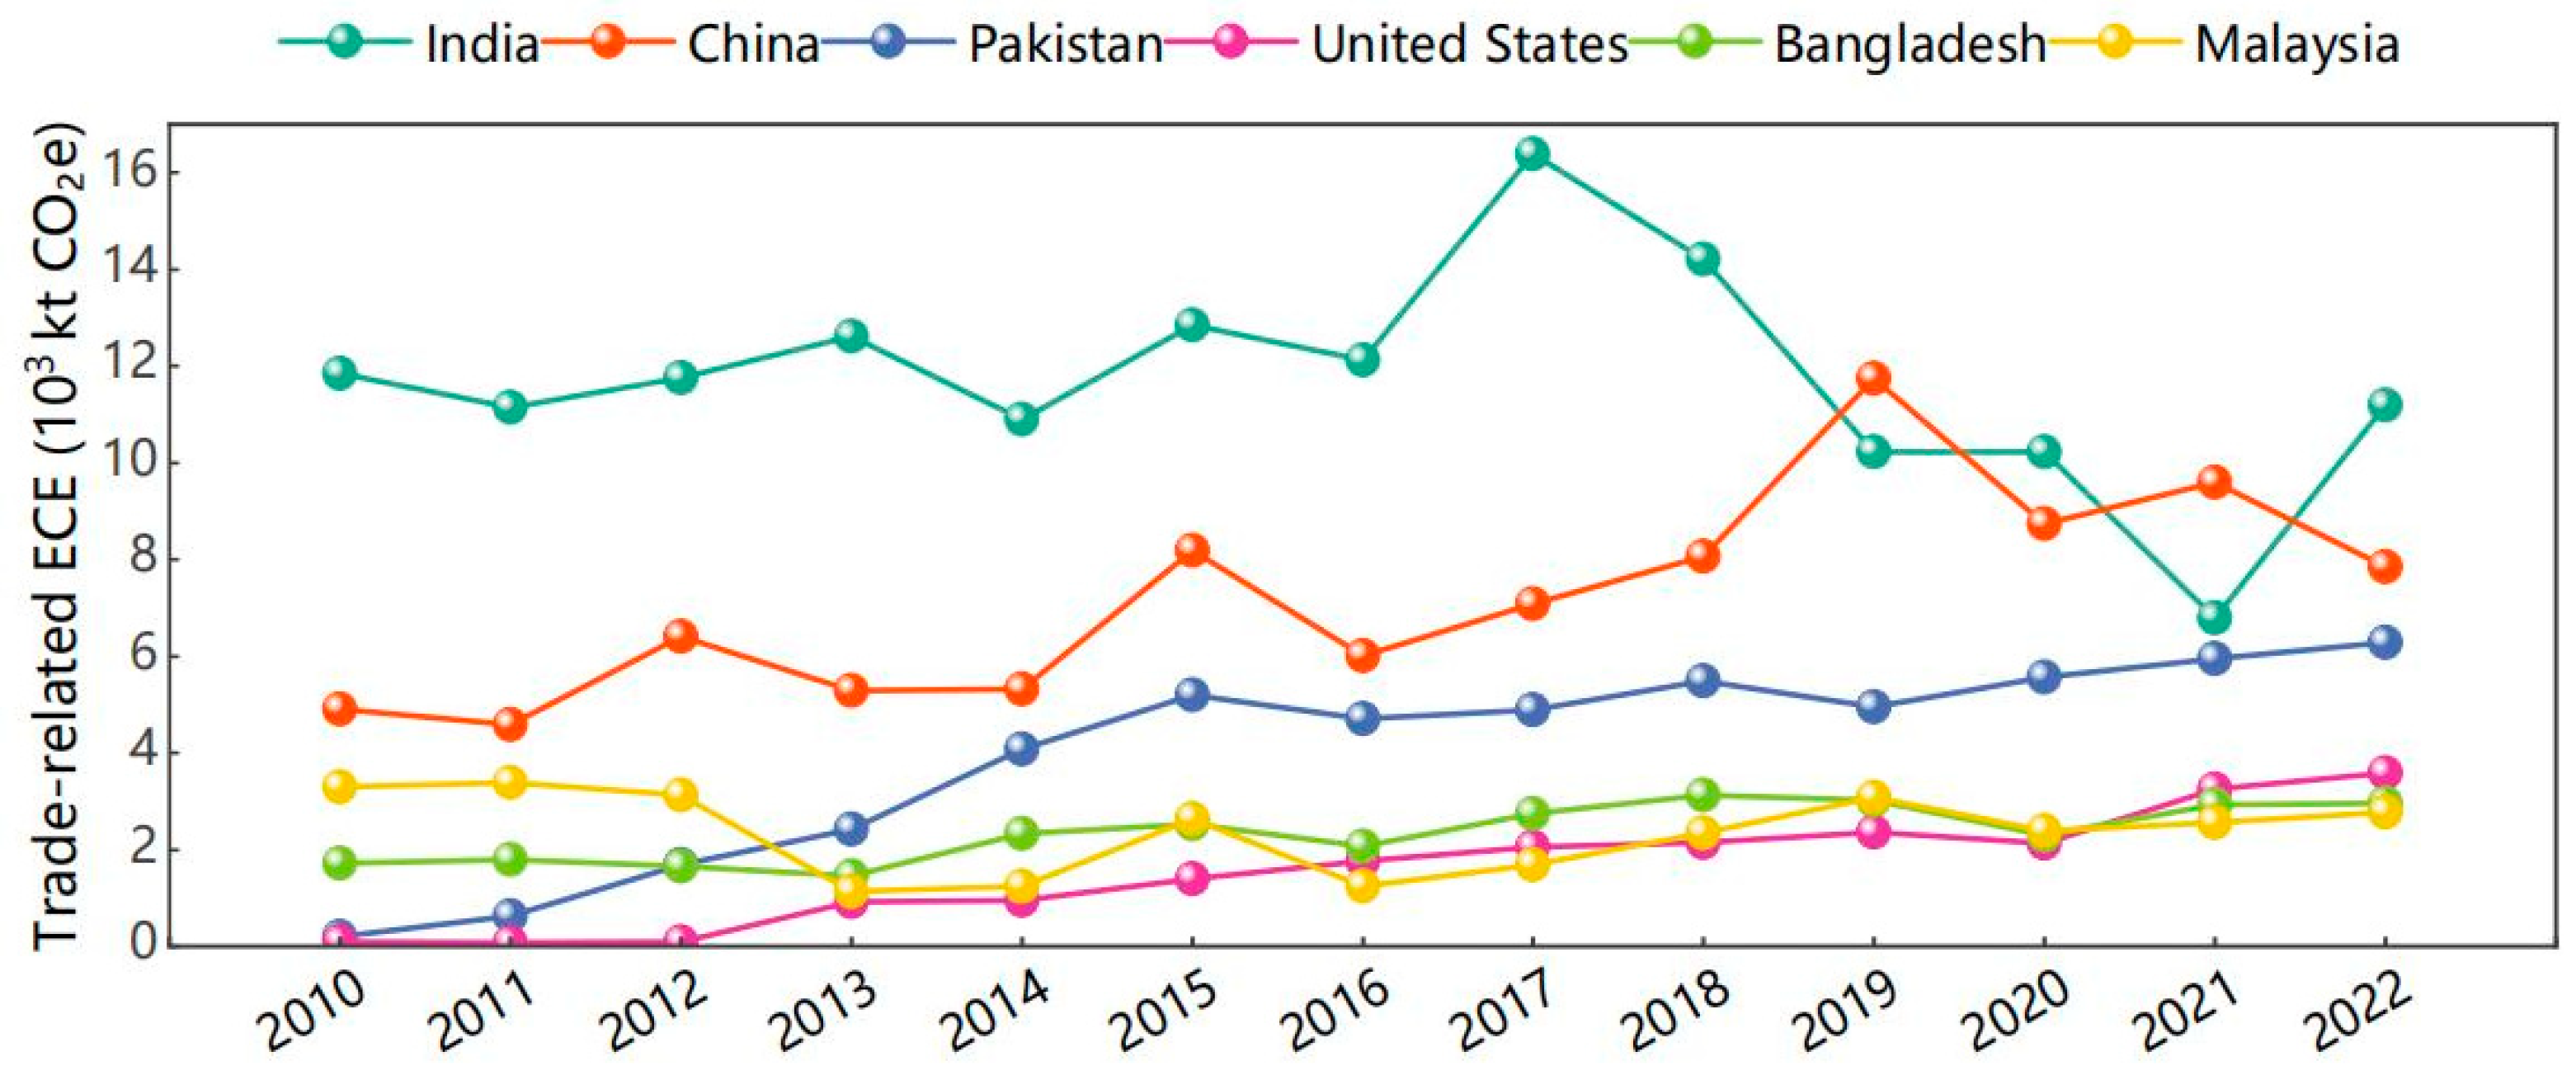
3.2. Embodied Carbon Emissions in Global Trade
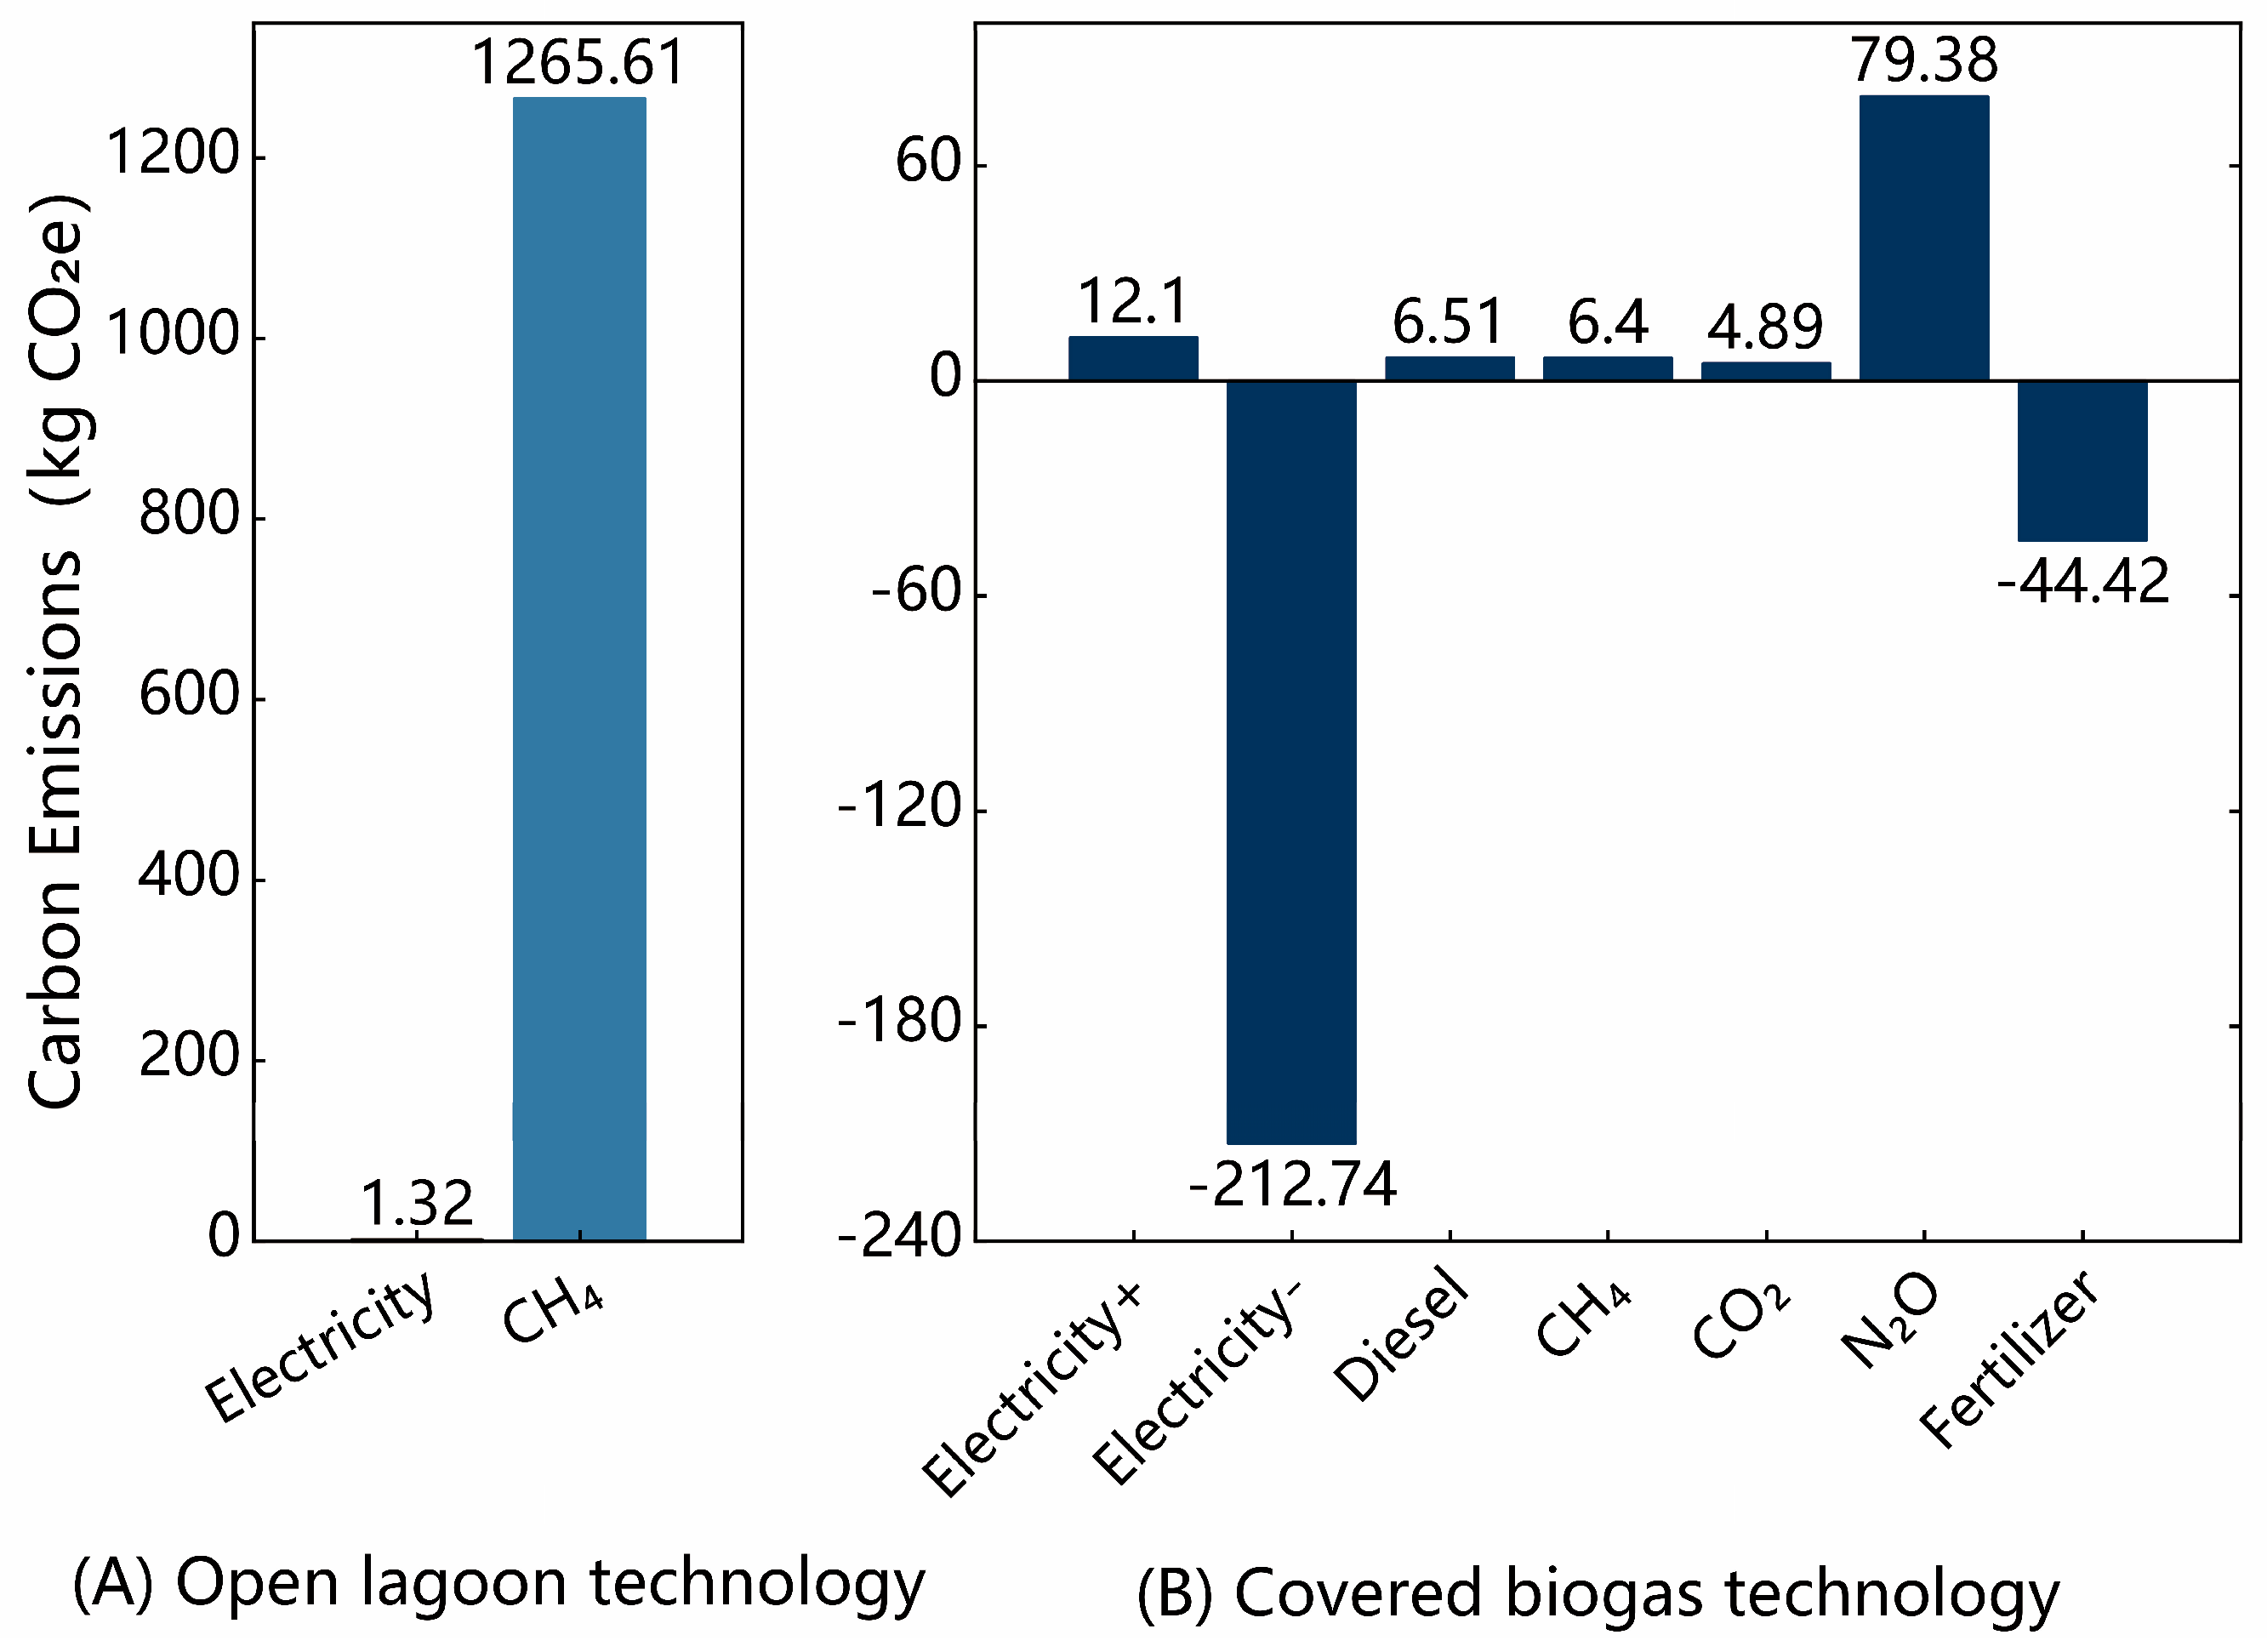
3.3. Sensitivity Analysis
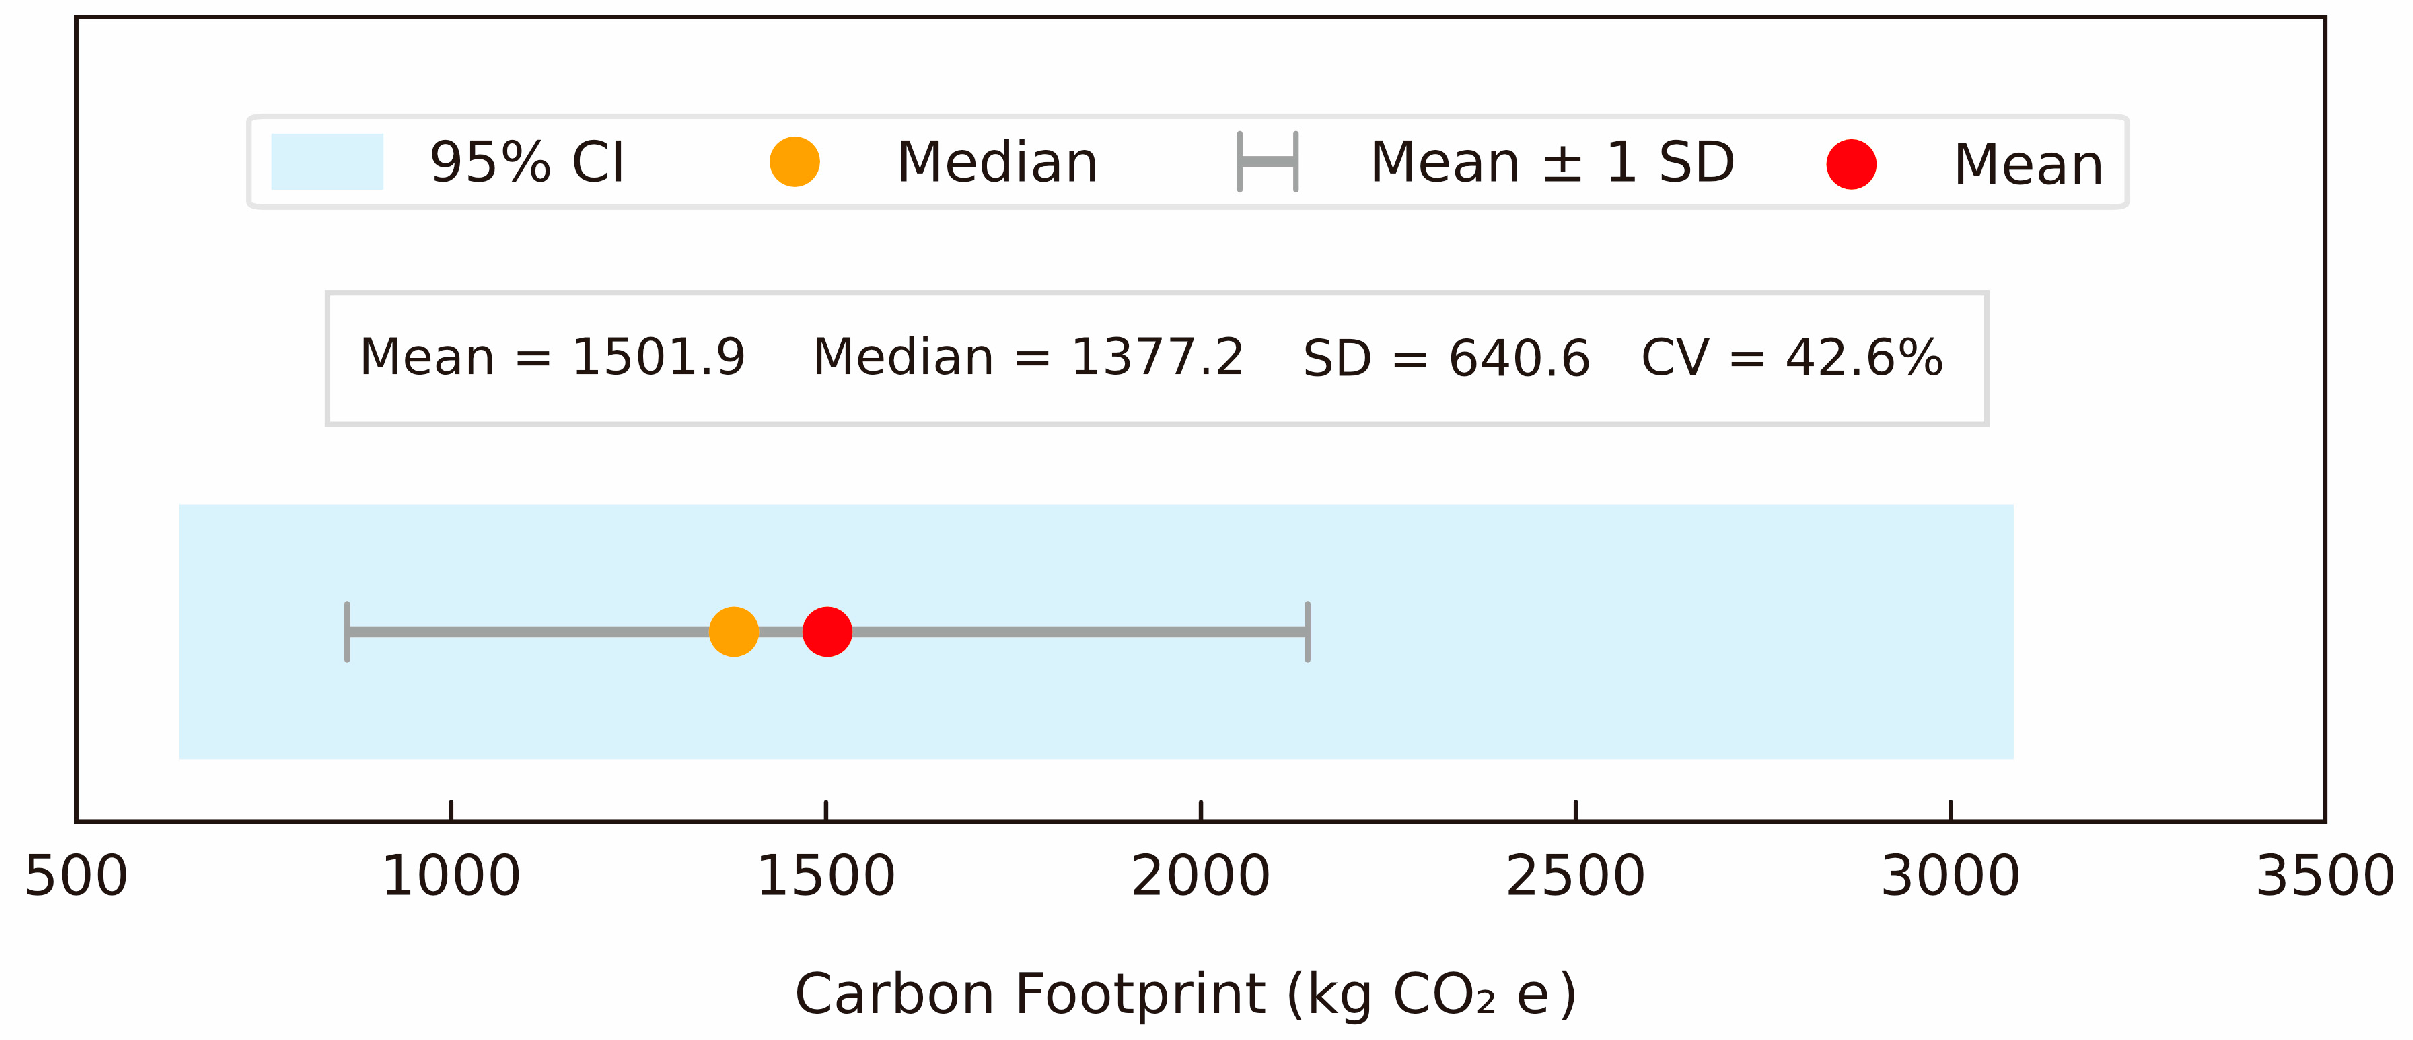
3.4. Uncertainty Analysis
4. Discussion and Recommendations
4.1. Production-Based Decarbonization Pathways
4.2. Trade-Based Decarbonization Pathways
5. Conclusions
Author Contributions
Funding
Data Availability Statement
Conflicts of Interest
Abbreviations
| RPO | Refined palm oil |
| ECE | Embodied carbon emissions |
| LCA | Life cycle assessment |
| SDGs | United Nations Sustainable Development Goals |
| GHG | Greenhouse gas |
| LUC | Land use change |
| CO2 | Carbon dioxide |
| CH4 | Methane |
| N2O | Nitrous oxide |
| HFCs | Hydrofluorocarbons |
| PFCs | Perfluorocarbons |
| SF6 | Sulfur hexafluoride |
| NF3 | Nitrogen trifluoride |
| CPO | Crude palm oil |
| IPCC | Intergovernmental Panel on Climate Change |
| AR5 | the Fifth Assessment Report |
| CO2e | Carbon dioxide equivalents |
| GWP | Global warming potential |
| CBAM | carbon border adjustment mechanism |
Appendix A

| Item | Unit | Emission Factor (kg CO2e/unit) |
|---|---|---|
| Dolomite | kg | 0.0463 |
| Urea | kg | 0.599 |
| Phosphate Rock | kg | 0.083 |
| Borate | kg | 2.217 |
| Paraquat | kg | 2.64 |
| Glyphosate | kg | 4.5 |
| Diesel | L | 0.564 |
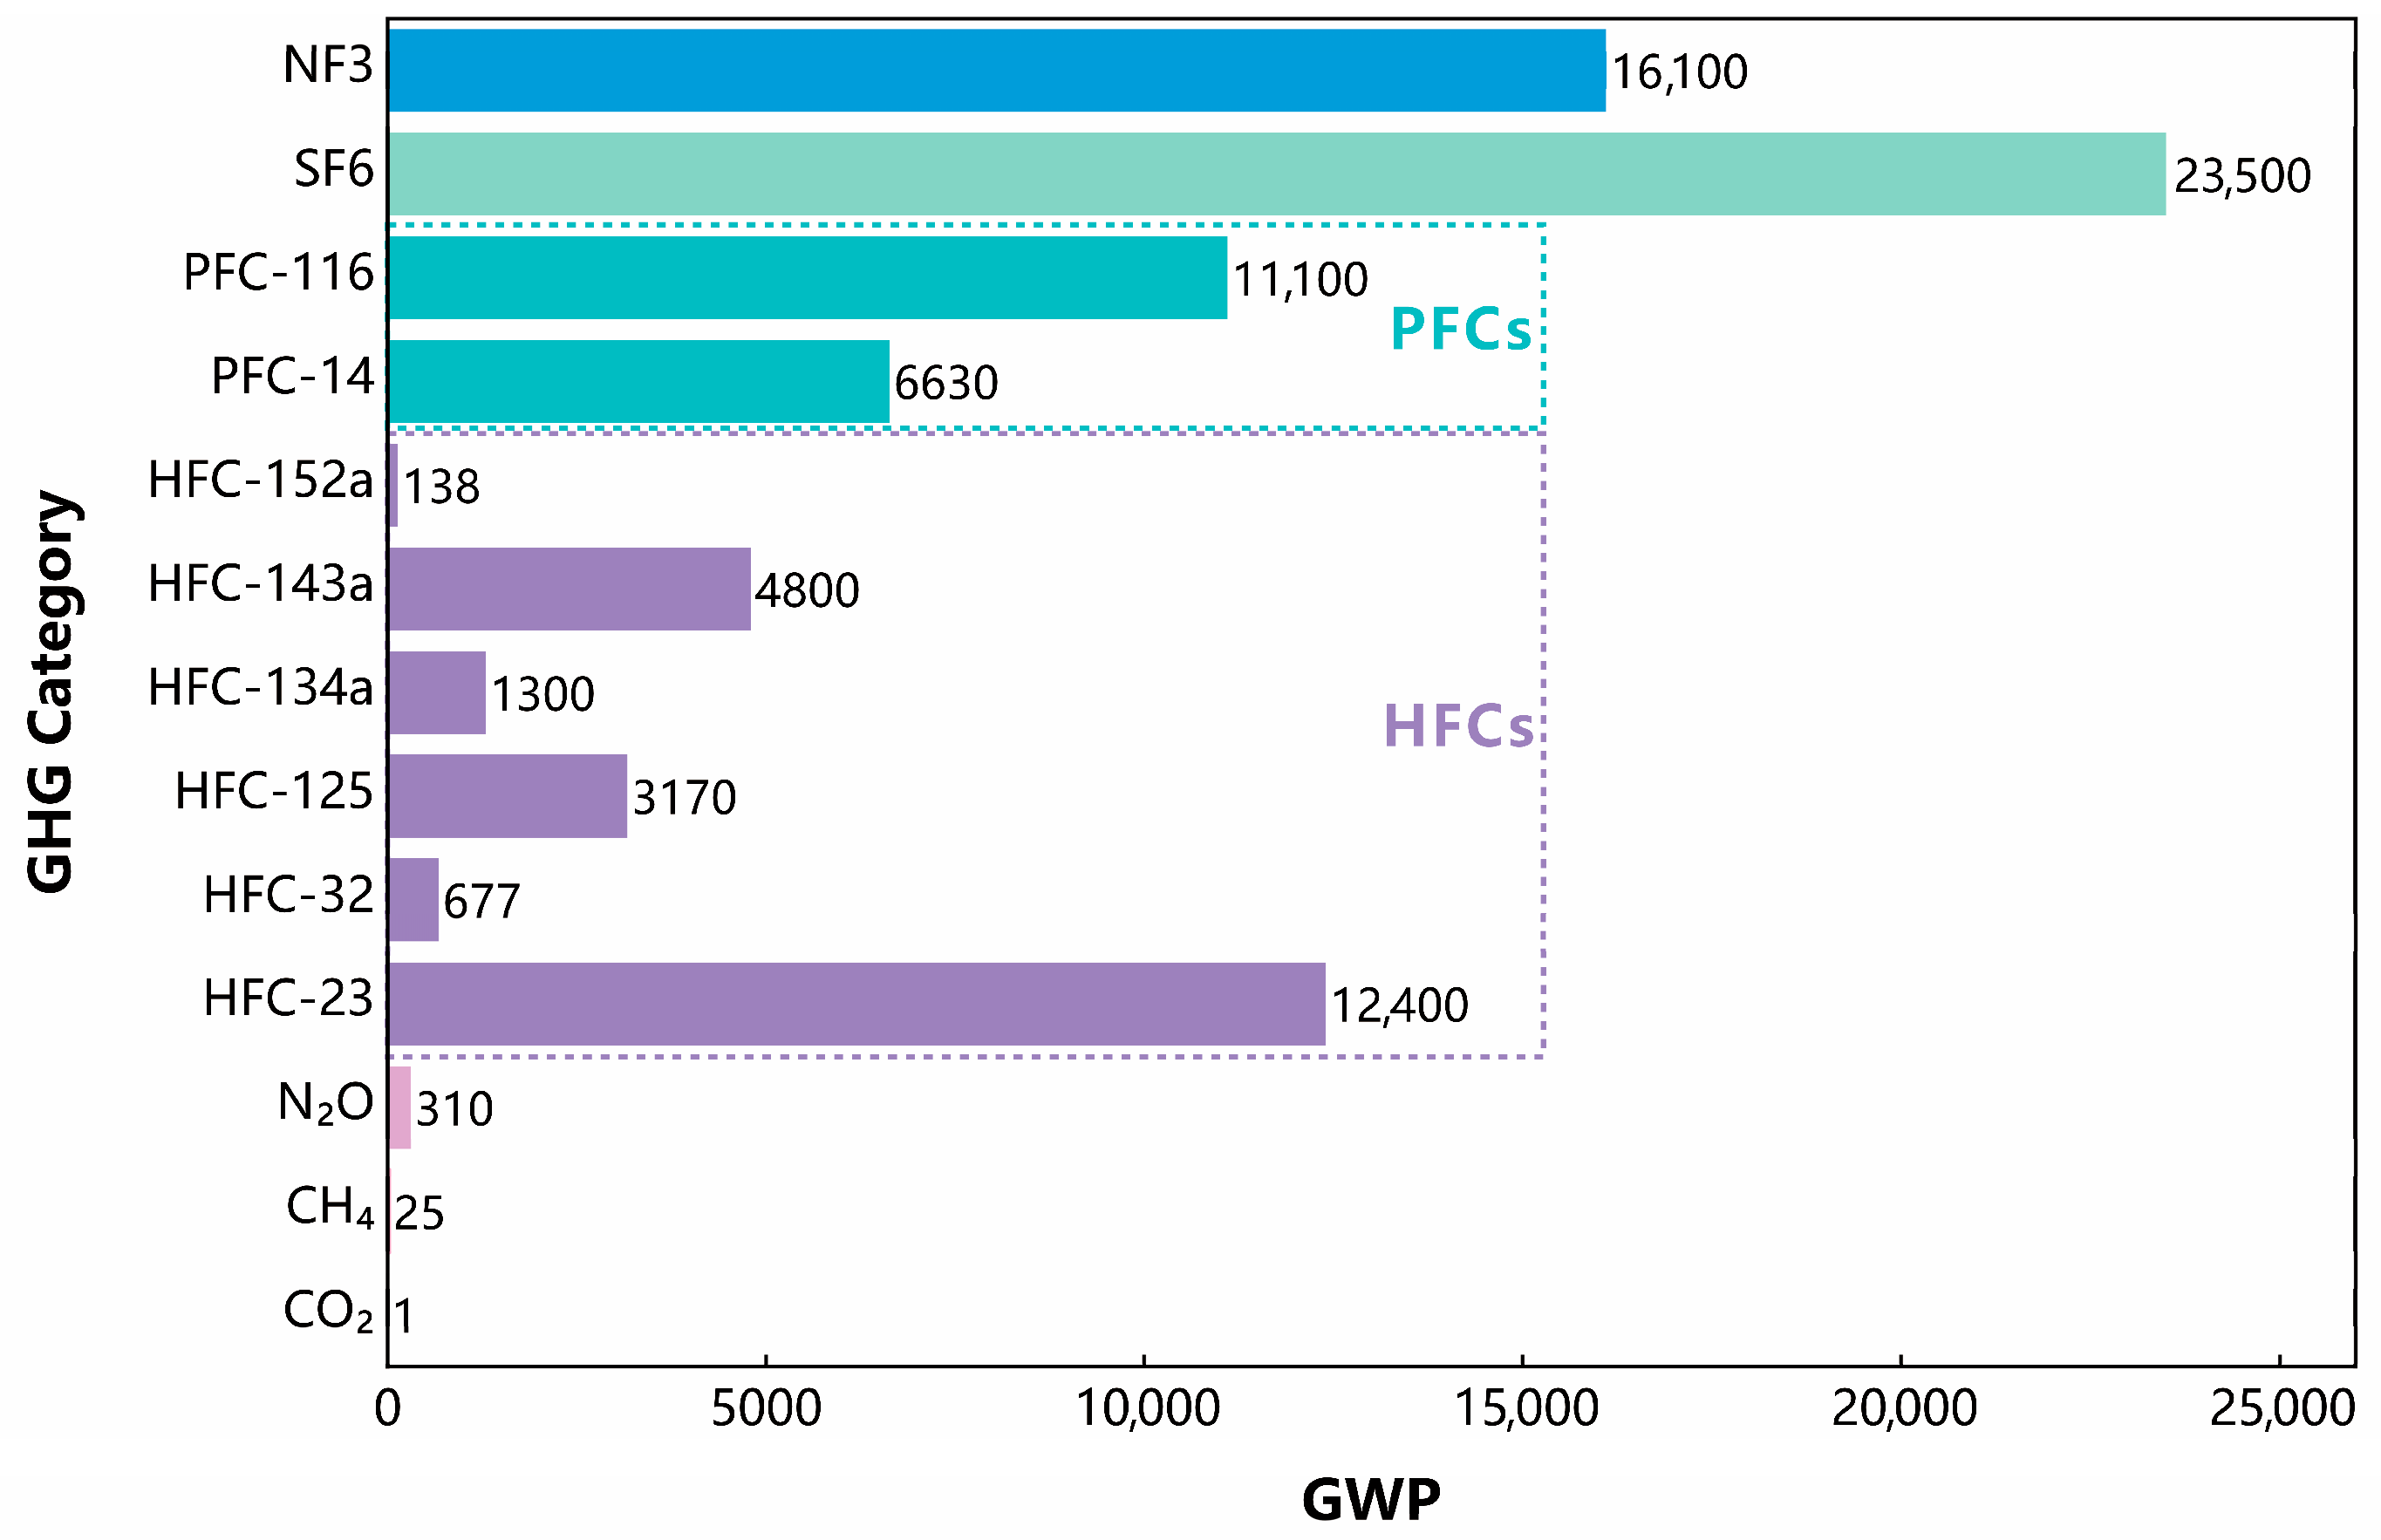
| CO2 | - | 1 |
| CH4 | - | 25 |
| N2O | - | 310 |
| Electricity | kWh | 0.537 |
| Boiler Fuel | kg | 0.564 |
| Water | L | 0.000464 |
| Phosphoric Acid | kg | 0.505 |
| Wastewater | L | 0.493 |
| Land Transport | t·km | 0.22 |
| Water Transport | t·km | 0.009 |
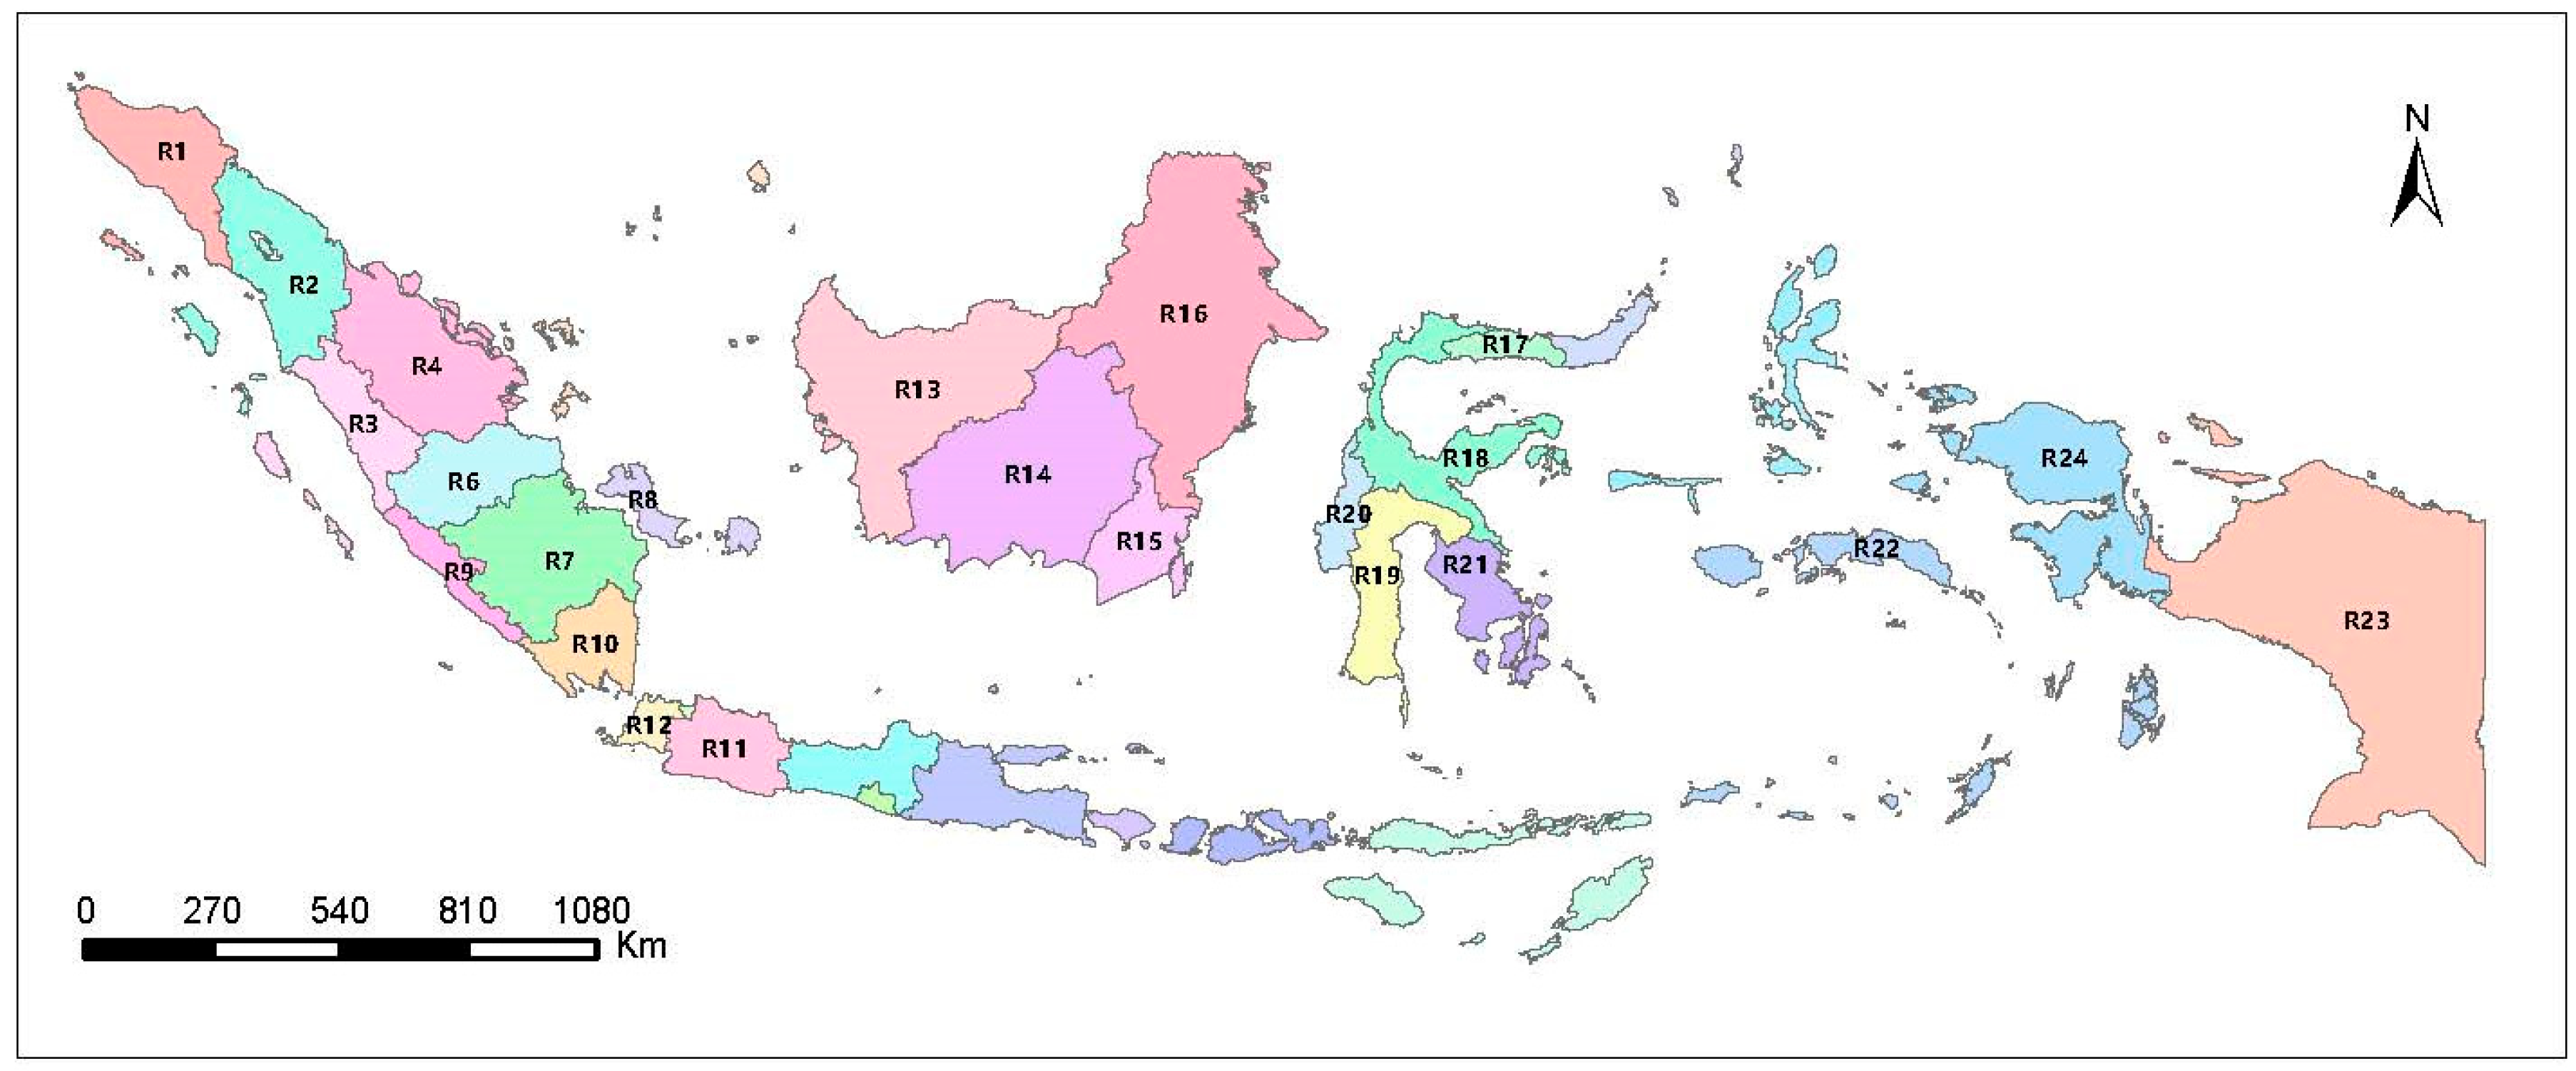
| Code | Region Name | Code | Region Name | Code | Region Name |
|---|---|---|---|---|---|
| R1 | Aceh | R9 | Bengkulu | R17 | Gorontalo |
| R2 | Sumatera Utara | R10 | Lampung | R18 | Sulawesi Tengah |
| R3 | Sumatera Barat | R11 | Jawa Barat | R19 | Sulawesi Selatan |
| R4 | Riau | R12 | Banten | R20 | Sulawesi Barat |
| R5 | Kepulauan Riau | R13 | Kalimantan Barat | R21 | Sulawesi Tenggara |
| R6 | Jambi | R14 | Kalimantan Tengah | R22 | Maluku |
| R7 | Sumatera Selatan | R15 | Kalimantan Selatan | R23 | Papua |
| R8 | Bangka Belitung | R16 | Kalimantan Timur | R24 | Papua Barat |
References
- FAO. The State of Agricultural Commodity Markets 2024—Trade and Nutrition: Policy Coherence for Healthy Diets; FAO: Rome, Italy, 2024. [Google Scholar] [CrossRef]
- Basiron, Y. Palm oil. In Bailey’s Industrial Oil and Fat Products; John Wiley & Sons, Inc.: Hoboken, NJ, USA, 2005. [Google Scholar]
- Hernandez, J.C.B.; Gutierrez, A.S.; Ramírez-Contreras, N.E.; Eras, J.J.C.; García-Nunez, J.A.; Agudelo, O.R.B.; Lora, E.E.S. Biomass-based energy potential from the oil palm agroindustry in Colombia: A path to low carbon energy transition. J. Clean. Prod. 2024, 449, 141808. [Google Scholar] [CrossRef]
- Zamri, M.F.M.A.; Milano, J.; Shamsuddin, A.H.; Roslan, M.E.M.; Salleh, S.F.; Rahman, A.A.; Bahru, R.; Fattah, I.M.R.; Mahlia, T.M.I. An overview of palm oil biomass for power generation sector decarbonization in Malaysia: Progress, challenges, and prospects. WIREs Energy Environ. 2022, 11, e437. [Google Scholar] [CrossRef]
- Ayompe, L.M.; Schaafsma, M.; Egoh, B.N. Towards sustainable palm oil production: The positive and negative impacts on ecosystem services and human wellbeing. J. Clean. Prod. 2021, 278, 123914. [Google Scholar] [CrossRef]
- Sustainable Development Goals: 17 Goals to Transform Our World; United Nations: Geneva, Switzerland, 2015.
- Farobie, O.; Hartulistiyoso, E. Palm Oil Biodiesel as a Renewable Energy Resource in Indonesia: Current Status and Challenges. BioEnergy Res. 2022, 15, 93–111. [Google Scholar] [CrossRef]
- USDA. Oilseeds: World Markets and Trade; USDA: Washington, DC, USA, 2025.
- Ahmad Hamidi, H.N.; Khalid, N.; Karim, Z.A.; Zainuddin, M.R.K.V. Technical Efficiency and Export Potential of the World Palm Oil Market. Agriculture 2022, 12, 1918. [Google Scholar] [CrossRef]
- Tandra, H.; Suroso, A.I. The determinant, efficiency, and potential of Indonesian palm oil downstream export to the global market. Cogent Econ. Financ. 2023, 11, 2189671. [Google Scholar] [CrossRef]
- F, F.; Amanda, T.; Dachyar, M.; Noor, Z.Z. 2030 oil palm plantation carbon footprint estimation using O-LCA and forecasting. J. Clean. Prod. 2024, 463, 142646. [Google Scholar] [CrossRef]
- El Hathat, Z.; Venkatesh, V.G.; Zouadi, T.; Sreedharan, V.R.; Manimuthu, A.; Shi, Y. Analyzing the greenhouse gas emissions in the palm oil supply chain in the VUCA world: A blockchain initiative. Bus. Strategy Environ. 2023, 32, 5563–5582. [Google Scholar] [CrossRef]
- Cheah, W.Y.; Siti-Dina, R.P.; Leng, S.T.K.; Er, A.C.; Show, P.L. Circular bioeconomy in palm oil industry: Current practices and future perspectives. Environ. Technol. Innov. 2023, 30, 103050. [Google Scholar] [CrossRef]
- Saswattecha, K.; Kroeze, C.; Jawjit, W.; Hein, L. Assessing the environmental impact of palm oil produced in Thailand. J. Clean. Prod. 2015, 100, 150–169. [Google Scholar] [CrossRef]
- Teng, S.; Khong, K.W.; Che Ha, N. Palm oil and its environmental impacts: A big data analytics study. J. Clean. Prod. 2020, 274, 122901. [Google Scholar] [CrossRef]
- Cazzolla Gatti, R.; Liang, J.; Velichevskaya, A.; Zhou, M. Sustainable palm oil may not be so sustainable. Sci. Total Environ. 2019, 652, 48–51. [Google Scholar] [CrossRef]
- Acobta ANb Ayompe, L.M.; Wandum, L.M.; Tambasi, E.E.; Muyuka, D.S.; Egoh, B.N. Greenhouse gas emissions along the value chain in palm oil producing systems: A case study of Cameroon. Clean. Circ. Bioeconomy 2023, 6, 100057. [Google Scholar] [CrossRef]
- Ogahara, Z.; Jespersen, K.; Theilade, I.; Nielsen, M.R. Review of smallholder palm oil sustainability reveals limited positive impacts and identifies key implementation and knowledge gaps. Land Use Policy 2022, 120, 106258. [Google Scholar] [CrossRef]
- Khatiwada, D.; Palmén, C.; Silveira, S. Evaluating the palm oil demand in Indonesia: Production trends, yields, and emerging issues. Biofuels 2021, 12, 135–147. [Google Scholar] [CrossRef]
- Jafari, Y.; Othman, J.; Witzke, P.; Jusoh, S. Risks and opportunities from key importers pushing for sustainability: The case of Indonesian palm oil. Agric. Food Econ. 2017, 5, 13. [Google Scholar] [CrossRef]
- Zhao, L.; Lv, Y.; Wang, C.; Xue, J.; Yang, Y.; Li, D. Embodied greenhouse gas emissions in the international agricultural trade. Sustain. Prod. Consum. 2023, 35, 250–259. [Google Scholar] [CrossRef]
- Yang, S.; Zhu, Z.; Fu, W.; Hu, S. Tele-connection of embodied carbon emissions from industries in China’s trade: A complex network analysis. J. Environ. Manag. 2024, 366, 121652. [Google Scholar] [CrossRef]
- Zahraee, S.M.; Golroudbary, S.R.; Shiwakoti, N.; Stasinopoulos, P. Palm oil biomass global supply chain: Environmental emissions vs. technology development of maritime transportation. Procedia CIRP 2022, 105, 817–822. [Google Scholar] [CrossRef]
- Jamaludin, N.F.; Muis, Z.A.; Hashim, H. An integrated carbon footprint accounting and sustainability index for palm oil mills. J. Clean. Prod. 2019, 225, 496–509. [Google Scholar] [CrossRef]
- Hansen, S.B.; Olsen, S.I.; Ujang, Z. Carbon balance impacts of land use changes related to the life cycle of Malaysian palm oil-derived biodiesel. Int. J. Life Cycle Assess. 2014, 19, 558–566. [Google Scholar] [CrossRef]
- Dohong, A.; Aziz, A.A.; Dargusch, P. Carbon emissions from oil palm development on deep peat soil in Central Kalimantan Indonesia. Anthropocene 2018, 22, 31–39. [Google Scholar] [CrossRef]
- Hashim, Z.; Subramaniam, V.; Harun, M.H.; Kamarudin, N. Carbon footprint of oil palm planted on peat in Malaysia. Int. J. Life Cycle Assess. 2018, 23, 1201–1217. [Google Scholar] [CrossRef]
- PAS 2050:2011; Specification for the Assessment of the Life Cycle Greenhouse Gas Emissions of Goods and Services. British Standards Institution: Herndon, VA, USA, 2011.
- ISO 14067:2018; Greenhouse Gases—Carbon Footprint of Products—Requirements and Guidelines for Quantification. ISO International Standards Organization: Geneva, Switzerland, 2018.
- Pieragostini, C.; Mussati, M.C.; Aguirre, P. On process optimization considering LCA methodology. J. Environ. Manag. 2012, 96, 43–54. [Google Scholar] [CrossRef]
- Rodriguez-Garcia, G.; Brandão, M.; Anex, R. Carbon Removal Accounting for a Sustainable Future: Distributing CO2 Flows in Multiservice Systems. Sustainability 2024, 16, 10909. [Google Scholar] [CrossRef]
- PT. ITS Kemitraan. Evaluating the Shift in Incoterms for Indonesian Export Products. World Bank. 2016. Available online: https://documents1.worldbank.org/curated/en/210851540824736420/pdf/Evaluating-the-Shift-in-Incoterms-for-Indonesian-Export-Products.pdf (accessed on 12 February 2025).
- IPCC. IPCC Fifth Assessment Report—Synthesis Report; IPCC: Geneva, Switzerland, 2014. [Google Scholar]
- Muhamad, H.; Sahid, I.B.; Surif, S.; Ai, T.Y.; May, C.Y. A Gate-to-gate Case Study of the Life Cycle Assessment of an Oil Palm Seedling. Trop. Life Sci. Res. 2012, 23, 15–23. [Google Scholar]
- Soraya, D.F.; Gheewala, S.H.; Bonnet, S.; Tongurai, C. Life cycle assessment of biodiesel production from palm oil in Indonesia. J. Sustain. Energy Environ. 2014, 5, 27–32. [Google Scholar]
- Tan, Y.; Muhamad, H.; Hashim, Z.; Subramaniam, V.; Chiew Wei, P.; Chong, C.L.; Ma, A.N.; Choo, Y.M. Life cycle assessment of refined palm oil production and fractionation (Part 4). J. Oil Palm Res. 2010, 22, 913–926. Available online: https://www.researchgate.net/publication/285819299_Life_cycle_assessment_of_refined_palm_oil_production_and_fractionation_Part_4 (accessed on 12 February 2025).
- Nasution, M.A.; Wibawa, D.S.; Ahamed, T.; Noguchi, R. Comparative environmental impact evaluation of palm oil mill effluent treatment using a life cycle assessment approach: A case study based on composting and a combination for biogas technologies in North Sumatera of Indonesia. J. Clean. Prod. 2018, 184, 1028–1040. [Google Scholar] [CrossRef]
- Austin, K.G.; Mosnier, A.; Pirker, J.; McCallum, I.; Fritz, S.; Kasibhatla, P.S. Shifting patterns of oil palm driven deforestation in Indonesia and implications for zero-deforestation commitments. Land Use Policy 2017, 69, 41–48. [Google Scholar] [CrossRef]
- Frischknecht, R.; Jungbluth, N.; Althaus, H.-J.; Doka, G.; Dones, R.; Heck, T.; Hellweg, S.; Hischier, R.; Nemecek, T.; Rebitzer, G.; et al. The ecoinvent Database: Overview and Methodological Framework (7 pp). Int. J. Life Cycle Assess. 2005, 10, 3–9. [Google Scholar] [CrossRef]
- Indonesian Oil Palm Statistics. Statistics Indonesia; BPS–Statistics Indonesia 2010–2022. Available online: https://www.bps.go.id/en/publication?keyword=Indonesian+Oil+Palm+Statistics&year=2012&sort=latest (accessed on 17 December 2024).
- UN Comtrade Database; United Nations: New York, NY, USA, 2024.
- Mooney, C.Z. Monte Carlo Simulation; Sage: Thousand Oaks, CA, USA, 1997. [Google Scholar]
- De Rosa, M.; Schmidt, J.; Pasang, H. Industry-driven mitigation measures can reduce GHG emissions of palm oil. J. Clean. Prod. 2022, 365, 132565. [Google Scholar] [CrossRef]
- Sertyesilisik, B.; Sertyesilisik, E. Impacts of the Trade Policies and Trade Tariffs on the Environmental Footprint of the Global Trade. In Global Tariff War: Economic, Political and Social Implications; Das, R.C., Ed.; Emerald Publishing Limited: Leeds, UK, 2021; pp. 313–324. [Google Scholar]
- McAusland, C.; Najjar, N. Carbon Footprint Taxes. Environ. Resour. Econ. 2015, 61, 37–70. [Google Scholar] [CrossRef]
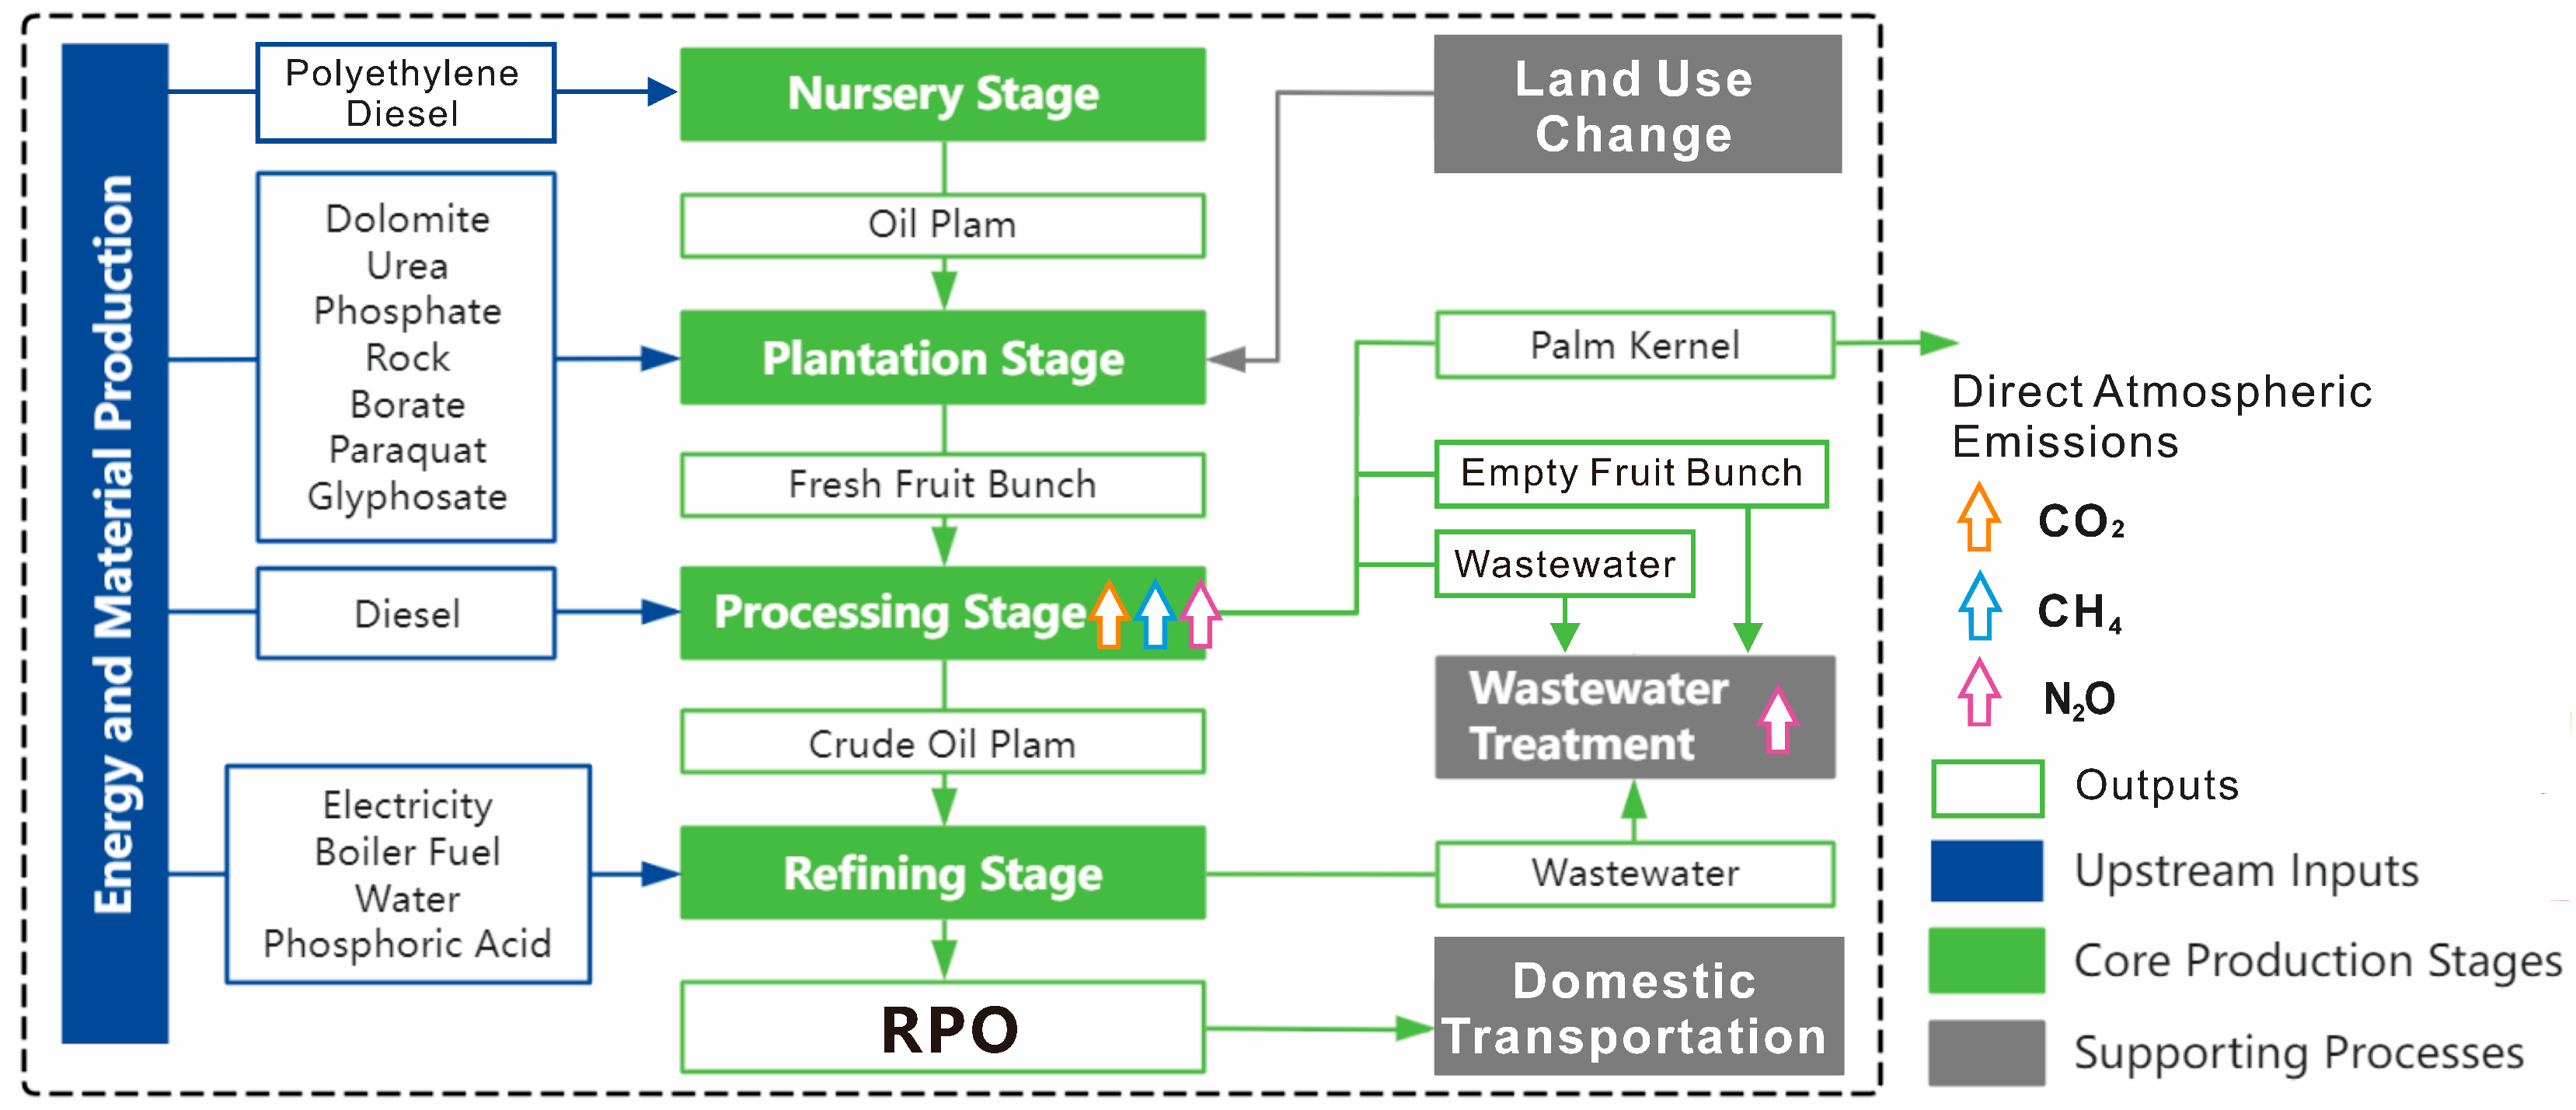

| Life Cycle Stage | Data Description | Source |
|---|---|---|
| Nursery Stage | Resource consumption and emissions | [34] |
| Plantation Stage | Plantation management, agricultural input usage | [35] |
| Processing Stage | Energy and material consumption in CPO production | [35] |
| Refining Stage | Energy consumption and emissions in RPO refining | [36] |
| Wastewater Treatment | Carbon emissions from treatment technologies | [37] |
| LUC Stage | Land conversion data (1995–2015) and land cover types | [38] |
| Stage | Carbon Emissions (kg CO2e) | Proportions (%) | Input/Output | Carbon Emissions (kg CO2e) | Proportions (%) |
|---|---|---|---|---|---|
| Nursery Stage | 4.54 | 0.21 | Polyethylene | 4.53 | 0.21 |
| Diesel | 0.01 | 0.00 | |||
| Plantation Stage | 97.59 | 4.44 | Dolomite | 3.72 | 0.17 |
| Urea | 51.29 | 2.33 | |||
| Phosphate Rock | 7.47 | 0.34 | |||
| Borate | 19.05 | 0.87 | |||
| Paraquat | 4.98 | 0.23 | |||
| Glyphosate | 11.08 | 0.50 | |||
| Processing Stage | 58.06 | 2.64 | Diesel | 2.27 | 0.10 |
| CO2 | 13.35 | 0.61 | |||
| CH4 | 0.02 | 0.00 | |||
| N2O | 0.22 | 0.01 | |||
| Electricity | 42.20 | 1.92 | |||
| Refining Stage | 33.80 | 1.54 | Electricity | 27.19 | 1.24 |
| Boiler Fuel | 6.25 | 0.28 | |||
| Water | 0.05 | 0.00 | |||
| Phosphoric Acid | 0.30 | 0.01 | |||
| Domestic Transportation | 14.82 | 0.67 | Land Transport | 13.42 | 0.61 |
| Water Transport | 1.40 | 0.06 | |||
| Wastewater Treatment | 1266.93 | 57.67 | Electricity | 1.32 | 0.06 |
| CH4 | 1265.61 | 57.61 | |||
| LUC | 721.09 | 32.82 | - | - | - |
| Total | 2196.84 | 100.00 |
| Life Cycle Stages | Input/Output | Carbon Footprint Change (%) |
|---|---|---|
| Nursery Stage | Polyethylene | 0.02 |
| Diesel | 0.00 | |
| Plantation Stage | Dolomite | 0.02 |
| Urea | 0.23 | |
| Phosphate Rock | 0.03 | |
| Borate | 0.09 | |
| Paraquat | 0.02 | |
| Glyphosate | 0.05 | |
| Processing Stage | Diesel | 0.01 |
| CO2 | 0.06 | |
| CH4 | 0.00 | |
| N2O | 0.00 | |
| Electricity | 0.19 | |
| Refining Stage | Electricity | 0.12 |
| Boiler Fuel | 0.03 | |
| Water | 0.00 | |
| Phosphoric Acid | 0.00 | |
| Transportation | Land Transport | 0.06 |
| Water Transport | 0.01 | |
| Wastewater Treatment | Electricity | 0.01 |
| CH4 | 5.76 | |
| LUC | LUC | 3.28 |
Disclaimer/Publisher’s Note: The statements, opinions and data contained in all publications are solely those of the individual author(s) and contributor(s) and not of MDPI and/or the editor(s). MDPI and/or the editor(s) disclaim responsibility for any injury to people or property resulting from any ideas, methods, instructions or products referred to in the content. |
© 2025 by the authors. Licensee MDPI, Basel, Switzerland. This article is an open access article distributed under the terms and conditions of the Creative Commons Attribution (CC BY) license (https://creativecommons.org/licenses/by/4.0/).
Share and Cite
Wang, H.; Li, X.; Sun, M.; Xie, Y.; Li, H. Life Cycle Carbon Footprint of Indonesian Refined Palm Oil and Its Embodied Emissions in Global Trade. Land 2025, 14, 1223. https://doi.org/10.3390/land14061223
Wang H, Li X, Sun M, Xie Y, Li H. Life Cycle Carbon Footprint of Indonesian Refined Palm Oil and Its Embodied Emissions in Global Trade. Land. 2025; 14(6):1223. https://doi.org/10.3390/land14061223
Chicago/Turabian StyleWang, Hanlei, Xia Li, Mingxing Sun, Yulei Xie, and Hui Li. 2025. "Life Cycle Carbon Footprint of Indonesian Refined Palm Oil and Its Embodied Emissions in Global Trade" Land 14, no. 6: 1223. https://doi.org/10.3390/land14061223
APA StyleWang, H., Li, X., Sun, M., Xie, Y., & Li, H. (2025). Life Cycle Carbon Footprint of Indonesian Refined Palm Oil and Its Embodied Emissions in Global Trade. Land, 14(6), 1223. https://doi.org/10.3390/land14061223