Abstract
Evaluating the walkability of embedded community service facilities is crucial for fostering age-friendly neighborhoods. Existing studies predominantly focus on qualitative analyses of single age groups, lacking a quantitative framework that integrates multigenerational demands and dynamically combines accessibility with facility usability. This study proposes a novel age-differentiated walkability evaluation framework through a case study of the Maple Community in Chengdu, China. The framework innovatively integrates facility classification weighting systems, population-specific distance decay functions, and multisource spatial data analysis to reveal intergenerational disparities in facility demand and spatial suitability. Key contributions include the following: (1) developing mobility-attenuated accessibility models tailored to distinct age groups, overcoming the limitations of traditional single-function approaches; (2) establishing a multidimensional evaluation system that bridges accessibility theory and usability metrics; (3) empirically demonstrating the spatial equity improvements through embedded facility optimization. The results highlight that elderly residents prioritize healthcare facilities (weight = 0.22), while adolescents rely heavily on cultural–recreational amenities (weight = 0.32). Post-renewal walkability scores in core areas increased by 52.3%, yet persistent peripheral disparities underscore intergenerational accessibility gaps. The framework provides theoretical and methodological advancements for age-friendly community planning, offering actionable insights for data-driven urban renewal policies.
1. Introduction
1.1. Research Background
In the era of globalization, the pace of urbanization is accelerating, bringing significant changes to the size and structure of urban populations worldwide [1,2]. According to the latest projections of the United Nations World Urbanization Prospects, the global urban population is expected to reach 68% the world’s total population by 2050, implying 2.5 billion new urban dwellers, mainly in Asia and Africa [3]. At the same time, many countries are rapidly aging, presenting new challenges for urban communities in terms of social inclusion and service provision. In China, the urbanization rate has surpassed 60% [4], and as of 2023, the proportion of people aged 65 and older had reached 15.4%, while those under 15 accounted for 17% [5]. This demographic trend—“increasing at both ends and shrinking in the middle”—has brought the livelihood needs of the elderly and children into sharper focus [6,7].
To address the diverse needs of different age groups, China has actively explored the development of elderly-friendly, child-friendly, and youth-oriented cities and communities. However, approaches targeting a single age groups have inherent limitations: in actual space use, the coexistence of residents across age groups often leads to “intergenerational conflict” due to varying needs [8]. How to coordinate the spatial needs of different age groups has become a critical issue in contemporary community governance. In response, the concept of the age-friendly community has been proposed by scholars and policymakers, aiming to provide residents of all ages with equitable access to health, well-being, and social inclusion opportunities [9]. Since 2018, China has introduced this concept and implemented pilot practices in various regions [7], integrating and extending the former models of “elderly-friendly” and “child-friendly” communities. With the promotion of age-friendly community construction, urban renewal efforts—particularly those focused on elderly and child services—have become a new direction in China’s community development agenda [10,11]. In this process, service and welfare infrastructure serves as a crucial foundation, covering healthcare, social care, education, leisure, retail, and financial services [12].
International experiences highlight the critical role of embedded community service facilities in promoting inclusivity. In New York, elderly well-being has been improved through enhanced community healthcare and support networks [13]; in Manchester, neighborhood-level collaborations have successfully integrated healthcare services with community activity centers [14]; and the “Age-Friendly Belfast” initiative in the UK has focused on infrastructure improvements, inclusive programming, and comprehensive service offerings to meet the needs of residents across all age groups [15,16]. In China, similar emphasis has been placed on embedded services. The National Development and Reform Commission (NDRC), together with the Ministry of Housing and Urban-Rural Development and the Ministry of Natural Resources, released the Guidelines for the Construction of Embedded Urban Community Service Facilities (Trial) [17]. Cities such as Hangzhou have followed with their own localized implementation plans [18]. Notably, in November 2023, the NDRC issued a nationwide implementation plan that called for embedding key services—elderly care, childcare, meal assistance, housekeeping, healthcare, fitness, cultural recreation, and play spaces—within communities as part of the “complete community” development initiative [19,20]. These measures emphasize age-friendliness and functional integration to better serve the full life cycle needs of residents.
1.2. Literature Review
Elderly-friendliness is not limited to the elderly but is to all groups. The core of an elderly-friendly community is to promote the physical and mental health of all residents in the entire life scenarios through matching the supply and demand of housing, public service facilities, transportation, public spaces, and other aspects [21,22].
In recent years, the theoretical and practical framework for elderly-friendly community planning has become more complex. From the perspective of mainstream research directions, it can be mainly divided into two research directions: accessibility and availability [23]. Accessibility and availability focus on different levels of community service facilities. Accessibility focuses on measuring the process of reaching community service facilities, while availability focuses on the use of service facilities.
In recent years, researchers have used accessibility analysis to evaluate the friendliness and accessibility of space from an age-friendly perspective. Commonly used accessibility calculation methods include Buffer Analysis, Network Analysis, Spatial Syntax, and the Two-step Floating Catchment Area Method (2SFCA). Huang, Xiaoran, and collaborators applied GIS-based methods and the 2SFCA model to assess access to elderly care services in central Shanghai [24,25]. Hu et al. integrated environmental psychology and GIS to create cognitively supportive environments, improving spatial comfort and accessibility for users with varying cognitive capacities [26].
On the basis of accessibility research, researchers have creatively proposed indicators such as inclusiveness and participation to more comprehensively evaluate the usage of communities. Forsyth et al.’s paper initially presents a framework that links urban design to the needs of the more vulnerable portions of the aging population, considering individual, physical, and social contexts [27]. João Boavida et al. developed a seven-domain model for age-friendly park design—covering accessibility, social engagement, and safe walking environments—and promoted the use of “smart” technologies that simultaneously serve children and the elderly [28]. Nelischer and colleagues advocated for “nested layouts” to support cross-generational interaction, extending the benefits of service facilities beyond primary user groups [29].
Availability, on the other hand, is different from accessibility research, as it focuses on measuring the usage of facilities [30]. The most commonly used evaluation method in availability assessment is the questionnaire survey, which quantitatively calculates the usability of different facilities by collecting the satisfaction level and frequency of users [31]. User experience and friendliness indicators, as well as Capacity Matching indicators, are commonly used evaluation metrics in facility availability assessment [32]. Capacity Matching is used to determine whether the total supply of service facilities can meet the potential demand [33]. Representative indicators include the ratio between the number of public infrastructures in a community and the number of people in different groups.
At present, research on the accessibility and availability of community facilities is gradually increasing. The objects are gradually becoming more refined, while the research methods adopted are becoming more comprehensive. However, there is still room for further improvement in the following three areas:
- The lack of comprehensive evaluation suitable for all different groups. Although a large number of studies have been conducted specifically for the elderly or children, there is little literature that considers the comprehensive use of community facilities by different age groups.
- The lack of quantitative consideration for the decline in attractiveness of community facilities. In real life, the elderly or children may find it more difficult to walk to facilities due to their physical condition and mobility. Although some scholars have proposed introducing Gaussian functions in calculations to simulate distance attenuation [34], they have not fully considered the differences in mobility among different populations.
- There is a lack of integration between accessibility and availability. Accessibility and availability are both important factors in infrastructure evaluation. Therefore, it is necessary to quantitatively calculate the arrival process from a spatial perspective and conduct micro-level investigations based on the usage patterns of different populations.
1.3. Research Questions and Objectives
Overall, several limitations persist in existing studies. Most rely heavily on qualitative approaches, lacking robust quantitative assessments of micro-scale environments such as neighborhoods and street blocks [35]. Although digital tools such as mobile data have enabled dynamic demand analysis for healthcare and education services, a standardized classification framework for embedded facilities has yet to be established [36,37,38]. Analyses tend to focus on the macro-urban level, overlooking fine-scale assessments of age-friendliness at the community level.
Unlike traditional commercial services, embedded community facilities fulfill essential needs across the life span, particularly in aging societies [34], yet their planning and operational models remain underexplored. These gaps are particularly critical in the context of rapid urban redevelopment and accelerated demographic aging, underscoring the need for empirical, multiscalar research.
To address these issues, this study takes the Maple Community in Chengdu as a case study and pursues three research objectives:
- Construct a classification system for embedded community service facilities and assign functional weights based on demand significance.
- Calculate walkability indices using accessibility models to quantify spatial access to services.
- Evaluate the spatial suitability and equity of facility distribution from the perspectives of different age groups. By integrating GIS spatial analysis and empirical survey data, the study provides a quantitative framework for assessing age-friendliness in embedded services. The findings are aligned with national policy trends and offer practical guidance for optimizing community-level public service delivery in the context of inclusive urban renewal.
The study drew on existing community-level accessibility and availability research methods. At the level of spatial accessibility, the buffer zone analysis method and the arrival time of different groups were introduced to measure the difficulty of reaching the service facility. At the spatial usage level, through field surveys and questionnaire surveys, the service needs of different groups were studied, and the corresponding distribution of facility preferences was calculated. By combining multiple methods, a quantitative evaluation tool for community infrastructure was ultimately provided.
2. Materials and Methods
2.1. Study Area
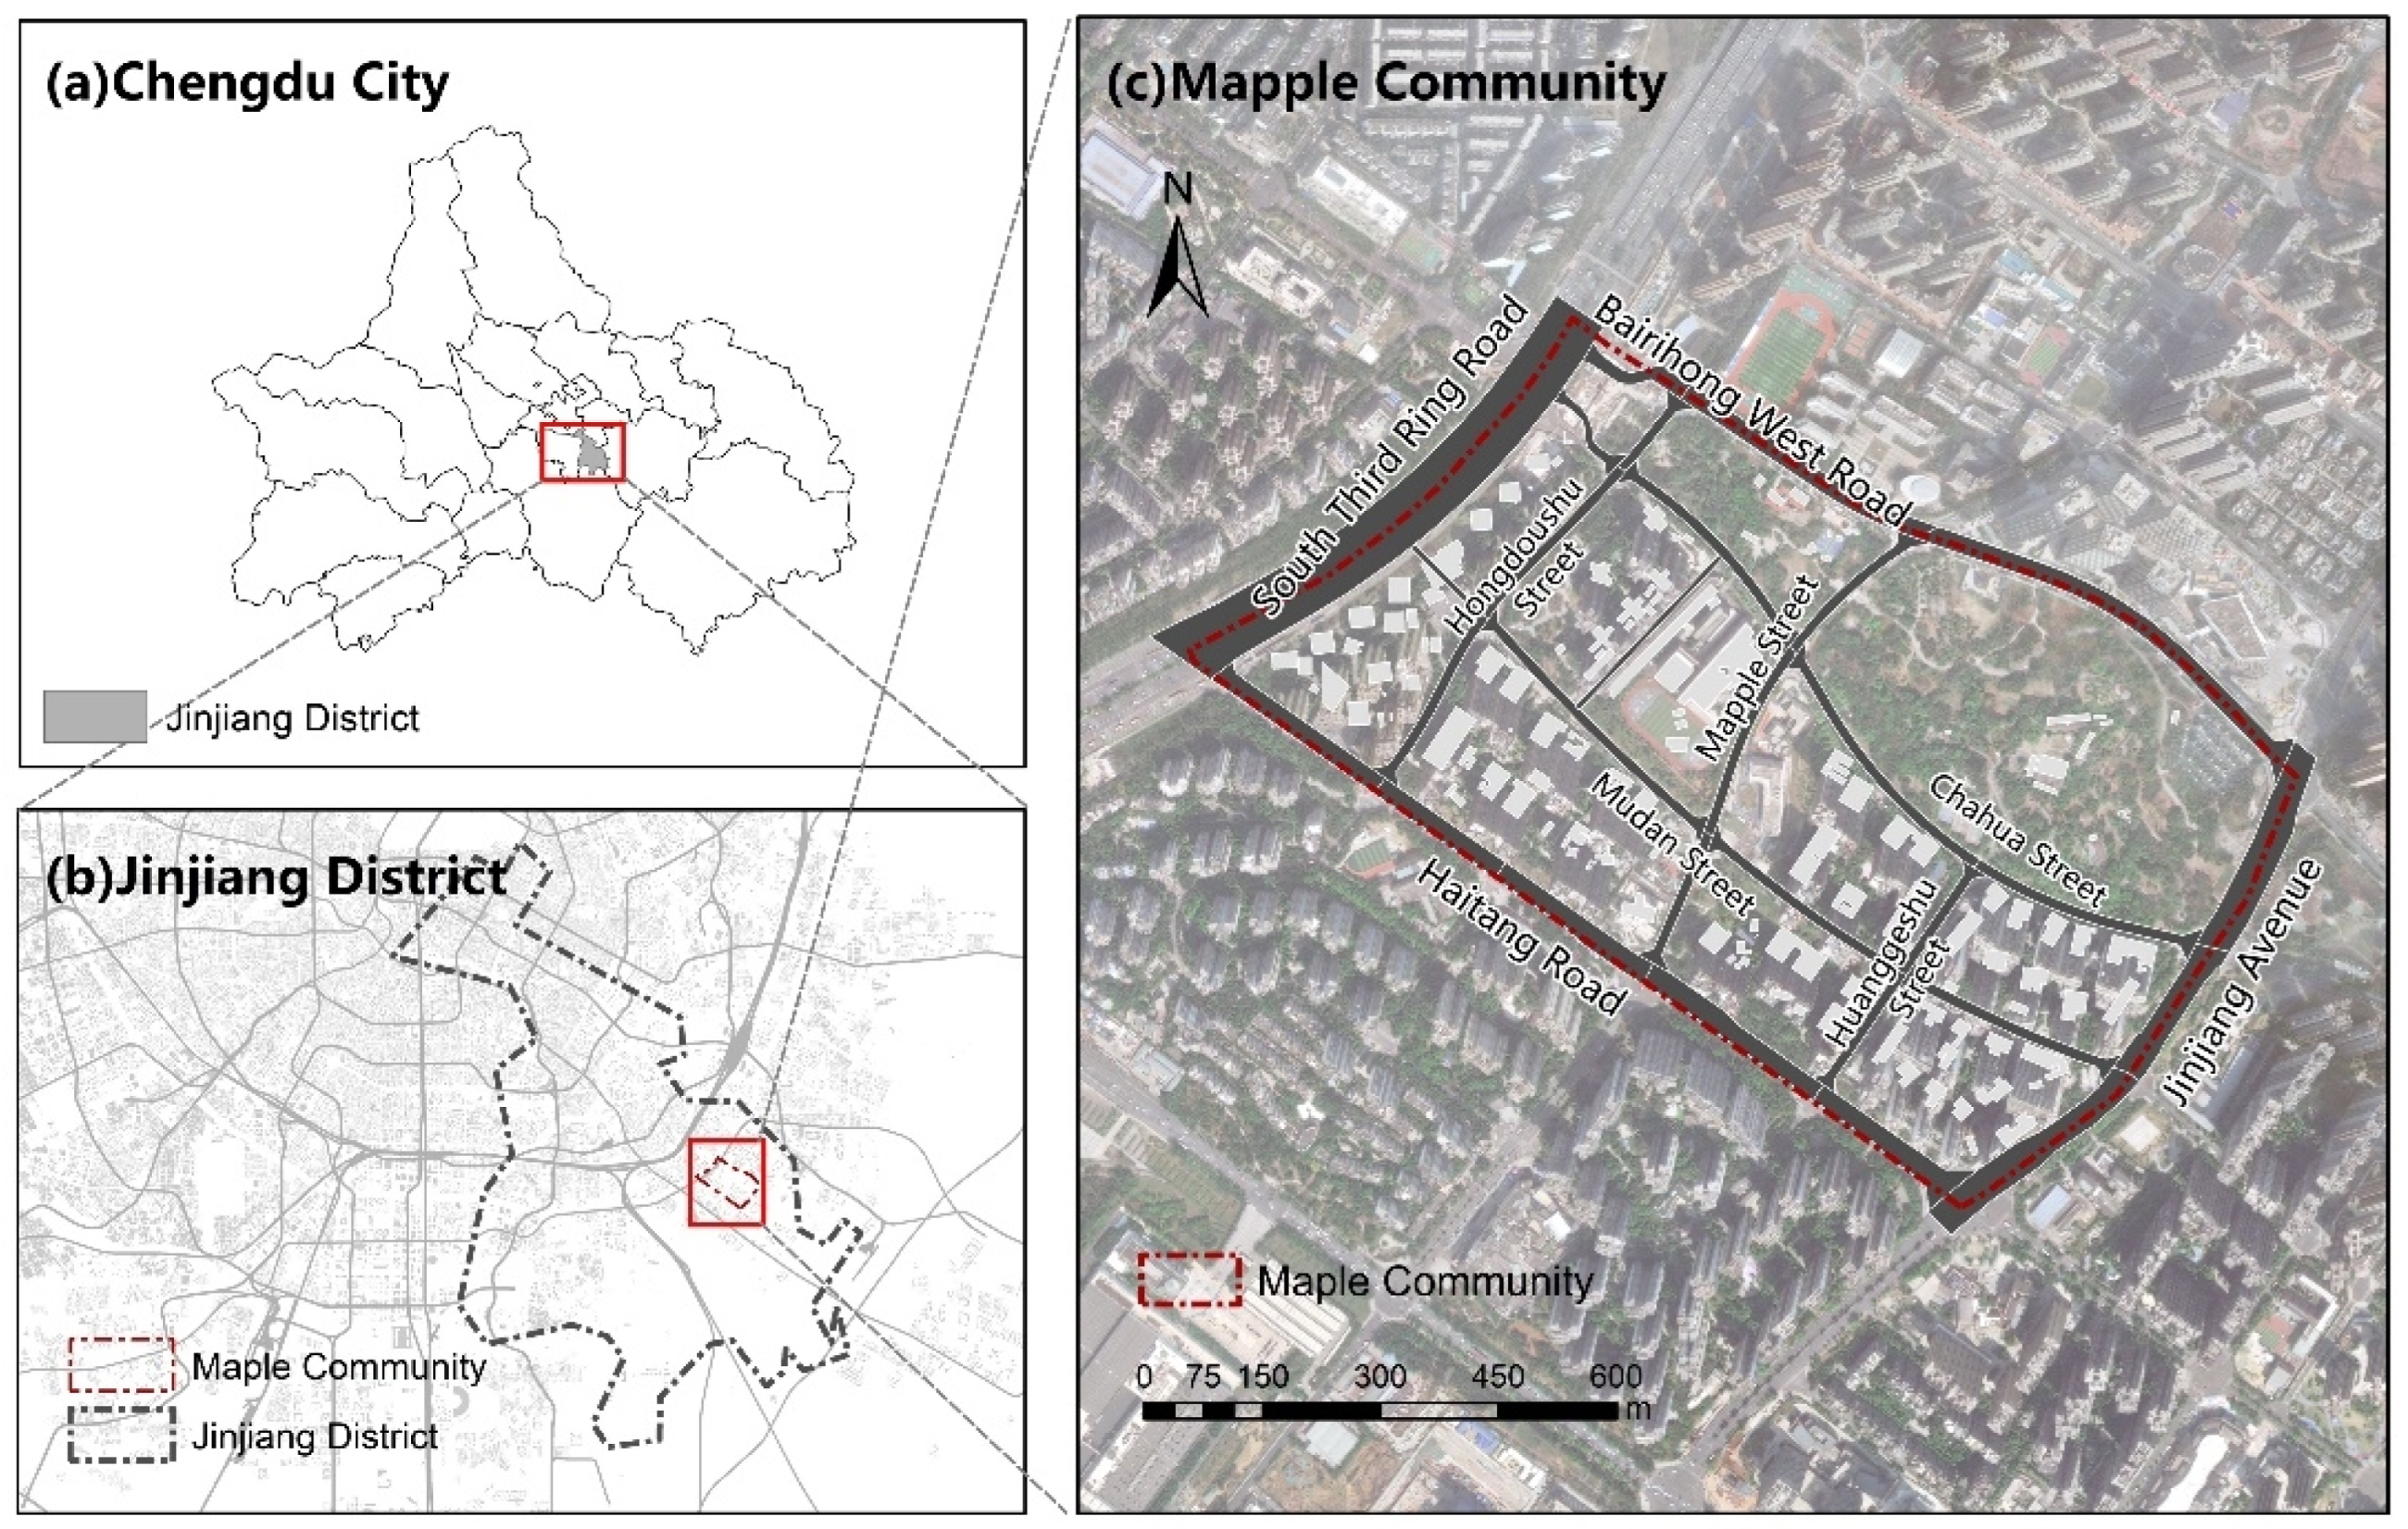
The study area, Maple Community, is located in the Chenglong Road Subdistrict of Jinjiang District, Chengdu City. It comprises seven residential complexes, including Sihai Yijia, Xinyuan Mingjia, and Jinjiang Yijia (Figure 1). Constructed between 2011 and 2015, the community covers an area of approximately 73 hectares, with a total of 14,293 households and a population of 33,000. Among the residents, 66% are middle-aged and young adults, while 34% fall into the “elderly and children” category.
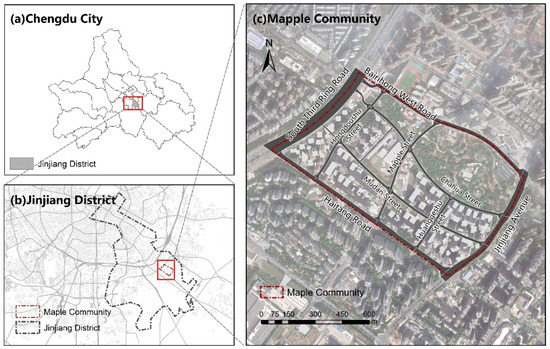
Figure 1.
Study area.
Despite its initial construction completion between 2011 and 2015, the community initially faced significant shortcomings in public facility provision, particularly affecting elderly residents’ mobility, social cohesion, and community engagement. Insufficient and unevenly distributed embedded community service facilities resulted in limited social interaction and lower walking activity among older residents. In response to these challenges, Maple Community has actively engaged in community-building and innovative operational practices since 2021 as part of Chengdu’s urban renewal initiatives. It has significantly improved public service provision, strengthened neighborhood connections, developed governance mechanisms, and addressed diverse residents’ needs across all age groups through newly established embedded facilities. In recognition of these achievements, Maple Community was selected in June 2024 for inclusion in the second batch of national case studies on complete community construction.
Given these factors, this area was selected as the case study for further investigation and research on the redesign and improvement of embedded community facilities.
2.2. Data Resource
This study began by organizing and classifying the existing community facility locations within the Maple Community. Points of Interest (POIs) data for the entire city of Chengdu were obtained from Gaode Map on June 2024. Considering edge effects, a buffer zone was created around the boundary of the Maple Community, and spatial intersection operations were performed to extract facilities located within that range. Referring to relevant research on the setting of buffer zone parameters for urban infrastructure at the community scale, this study set the buffer zone at 500 m [39].
Based on this classification framework, facilities were divided into three hierarchical levels: Level I facilities—key services that are strongly promoted; Level II facilities—services recommended for prioritized construction; Level III facilities—supplementary services implemented based on local demand and site conditions. Following this classification, seven major categories of embedded service facilities were selected as the focus of analysis: Elderly Care Facilities; Childcare and Daycare Facilities; Community Meal Assistance Facilities; Healthcare Facilities; Sports and Fitness Facilities; Cultural and Recreational Facilities; Housekeeping and Convenience Facilities.
In addition to facility data, all residential compounds within the community were identified and geocoded. On-site field investigations were conducted to verify the POI dataset and supplement missing entries. During the fieldwork, the entrances and exits of each residential unit were precisely located and marked to support accurate accessibility calculations. Several auxiliary datasets were also integrated into the analysis, including field survey questionnaire results used for demand-based facility weighting; road network data for calculating pedestrian travel time; facility classifications and location data processed using ArcGIS 10.7 software for spatial analysis.
To ensure data reliability, the following cleaning steps were performed before analysis: (1) POI de-duplication—Facilities with centroid-to-centroid spacing ≤ 15 m were regarded as the same entity, and the duplicate with the lower information integrity score was removed. (2) Coordinate correction—A field GPS campaign verified 92 POI locations; points showing an offset > 10 m were reprojected manually. (3) Road-network refinement—OSM “service”, “footway”, and “cycleway” layers were removed. (4) Residential entrance identification—Each entrance was buffered by 5 m to avoid double-counting overlapping points. All cleaning steps were implemented in Python 3.12 using the pandas-geopandas-shapely stack for geometry operations.
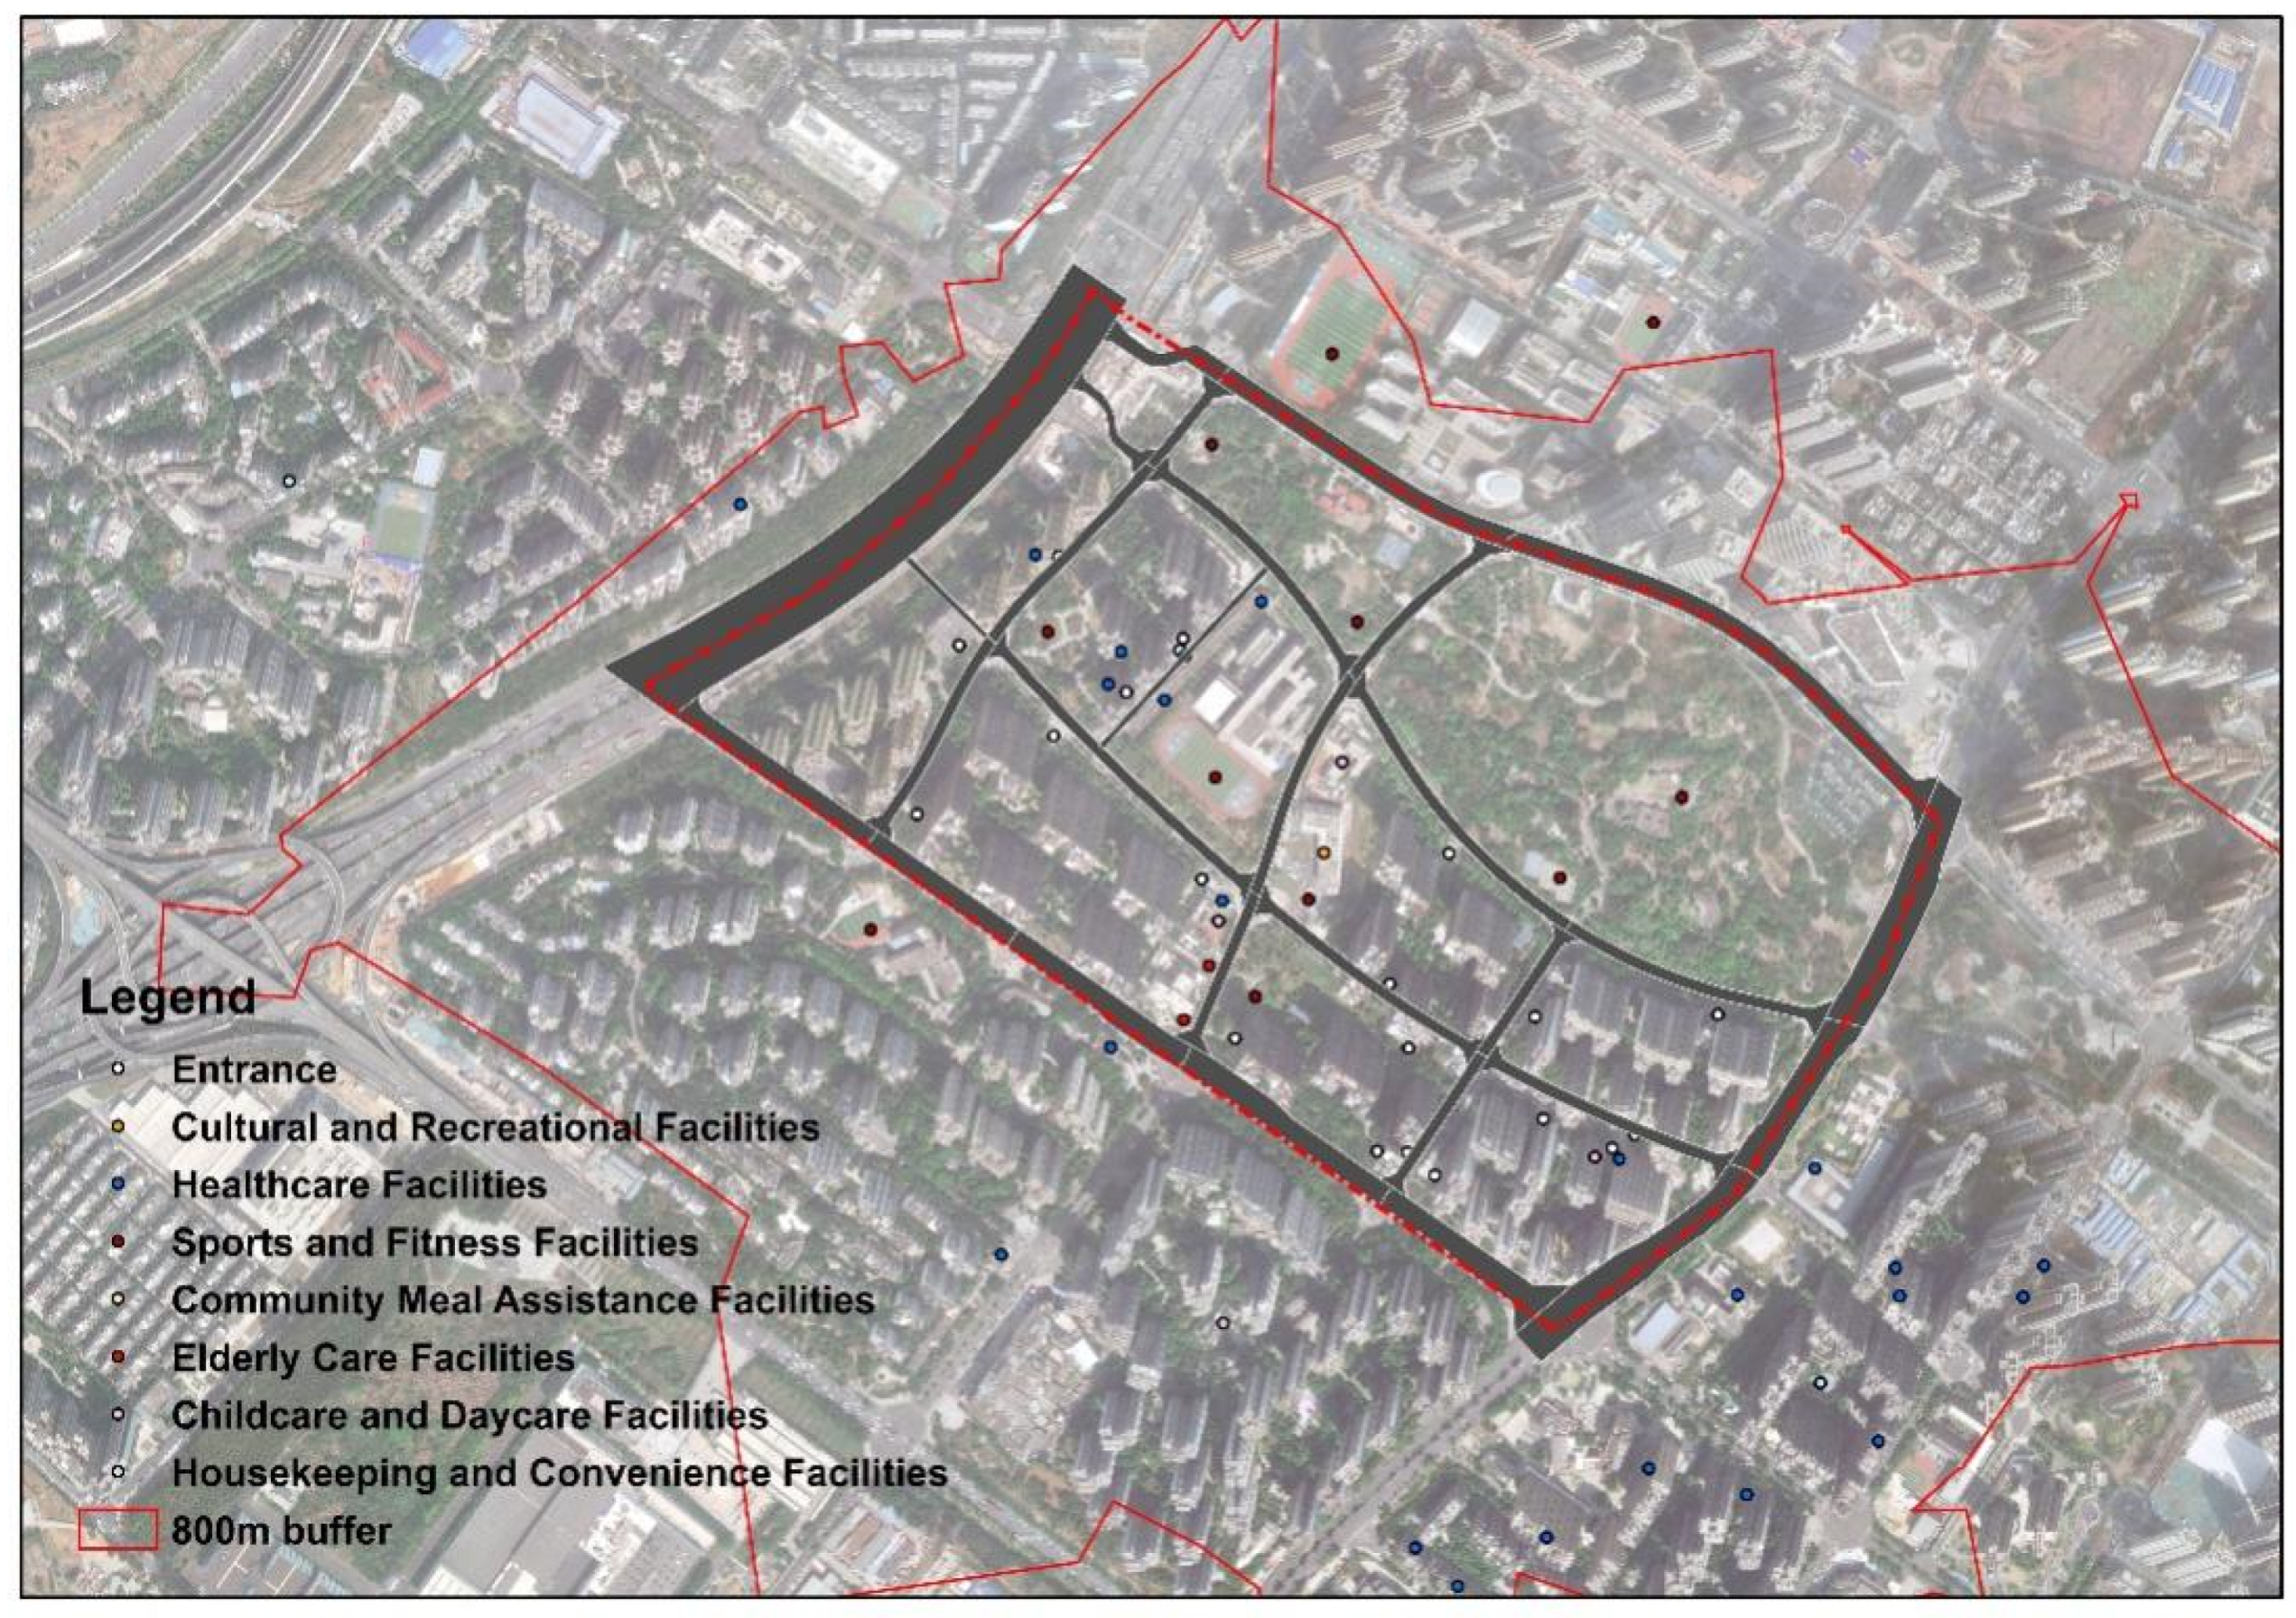
A comprehensive facility–residence point distribution map was then generated to visualize the spatial configuration of embedded service facilities and residential compounds within the Maple Community (Figure 2). The source and format of all data inputs are detailed in Table 1. In additions, the number of facilities by type is summarized in Table 2. In this study, the assignment of weights to the various types of facilities in the community references available theory. The more frequently a user visits a facility, the more important it is considered to be [40,41]. Based on the behavioral geography assumption that the frequency of facility use reflects the priority of demand, the demand index (demand presence x frequency of use) from the questionnaire was transformed into a weighting to ensure that the intensity of demand was positively correlated with the spatial allocation. At the same time, minimum weight thresholds (≥0.15) needed to be assigned to Level I facilities based on construction guidelines to prevent purely data-driven underestimation of public services.
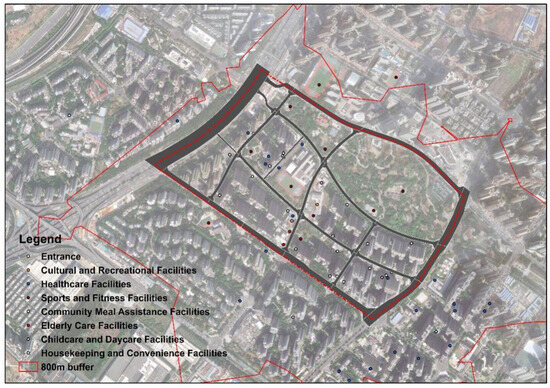
Figure 2.
The embedded service facilities and residential compounds within Maple Community.

Table 1.
Data types, descriptions, and sources.
Table 2.
Facility Category and quantity.
In terms of statistical bias control, the study was calibrated using stratified sampling. The sample quota was adjusted according to the proportion of the population in the age groups to ensure that the questionnaire data were consistent with the demographic structure of the community.
2.3. Study Design
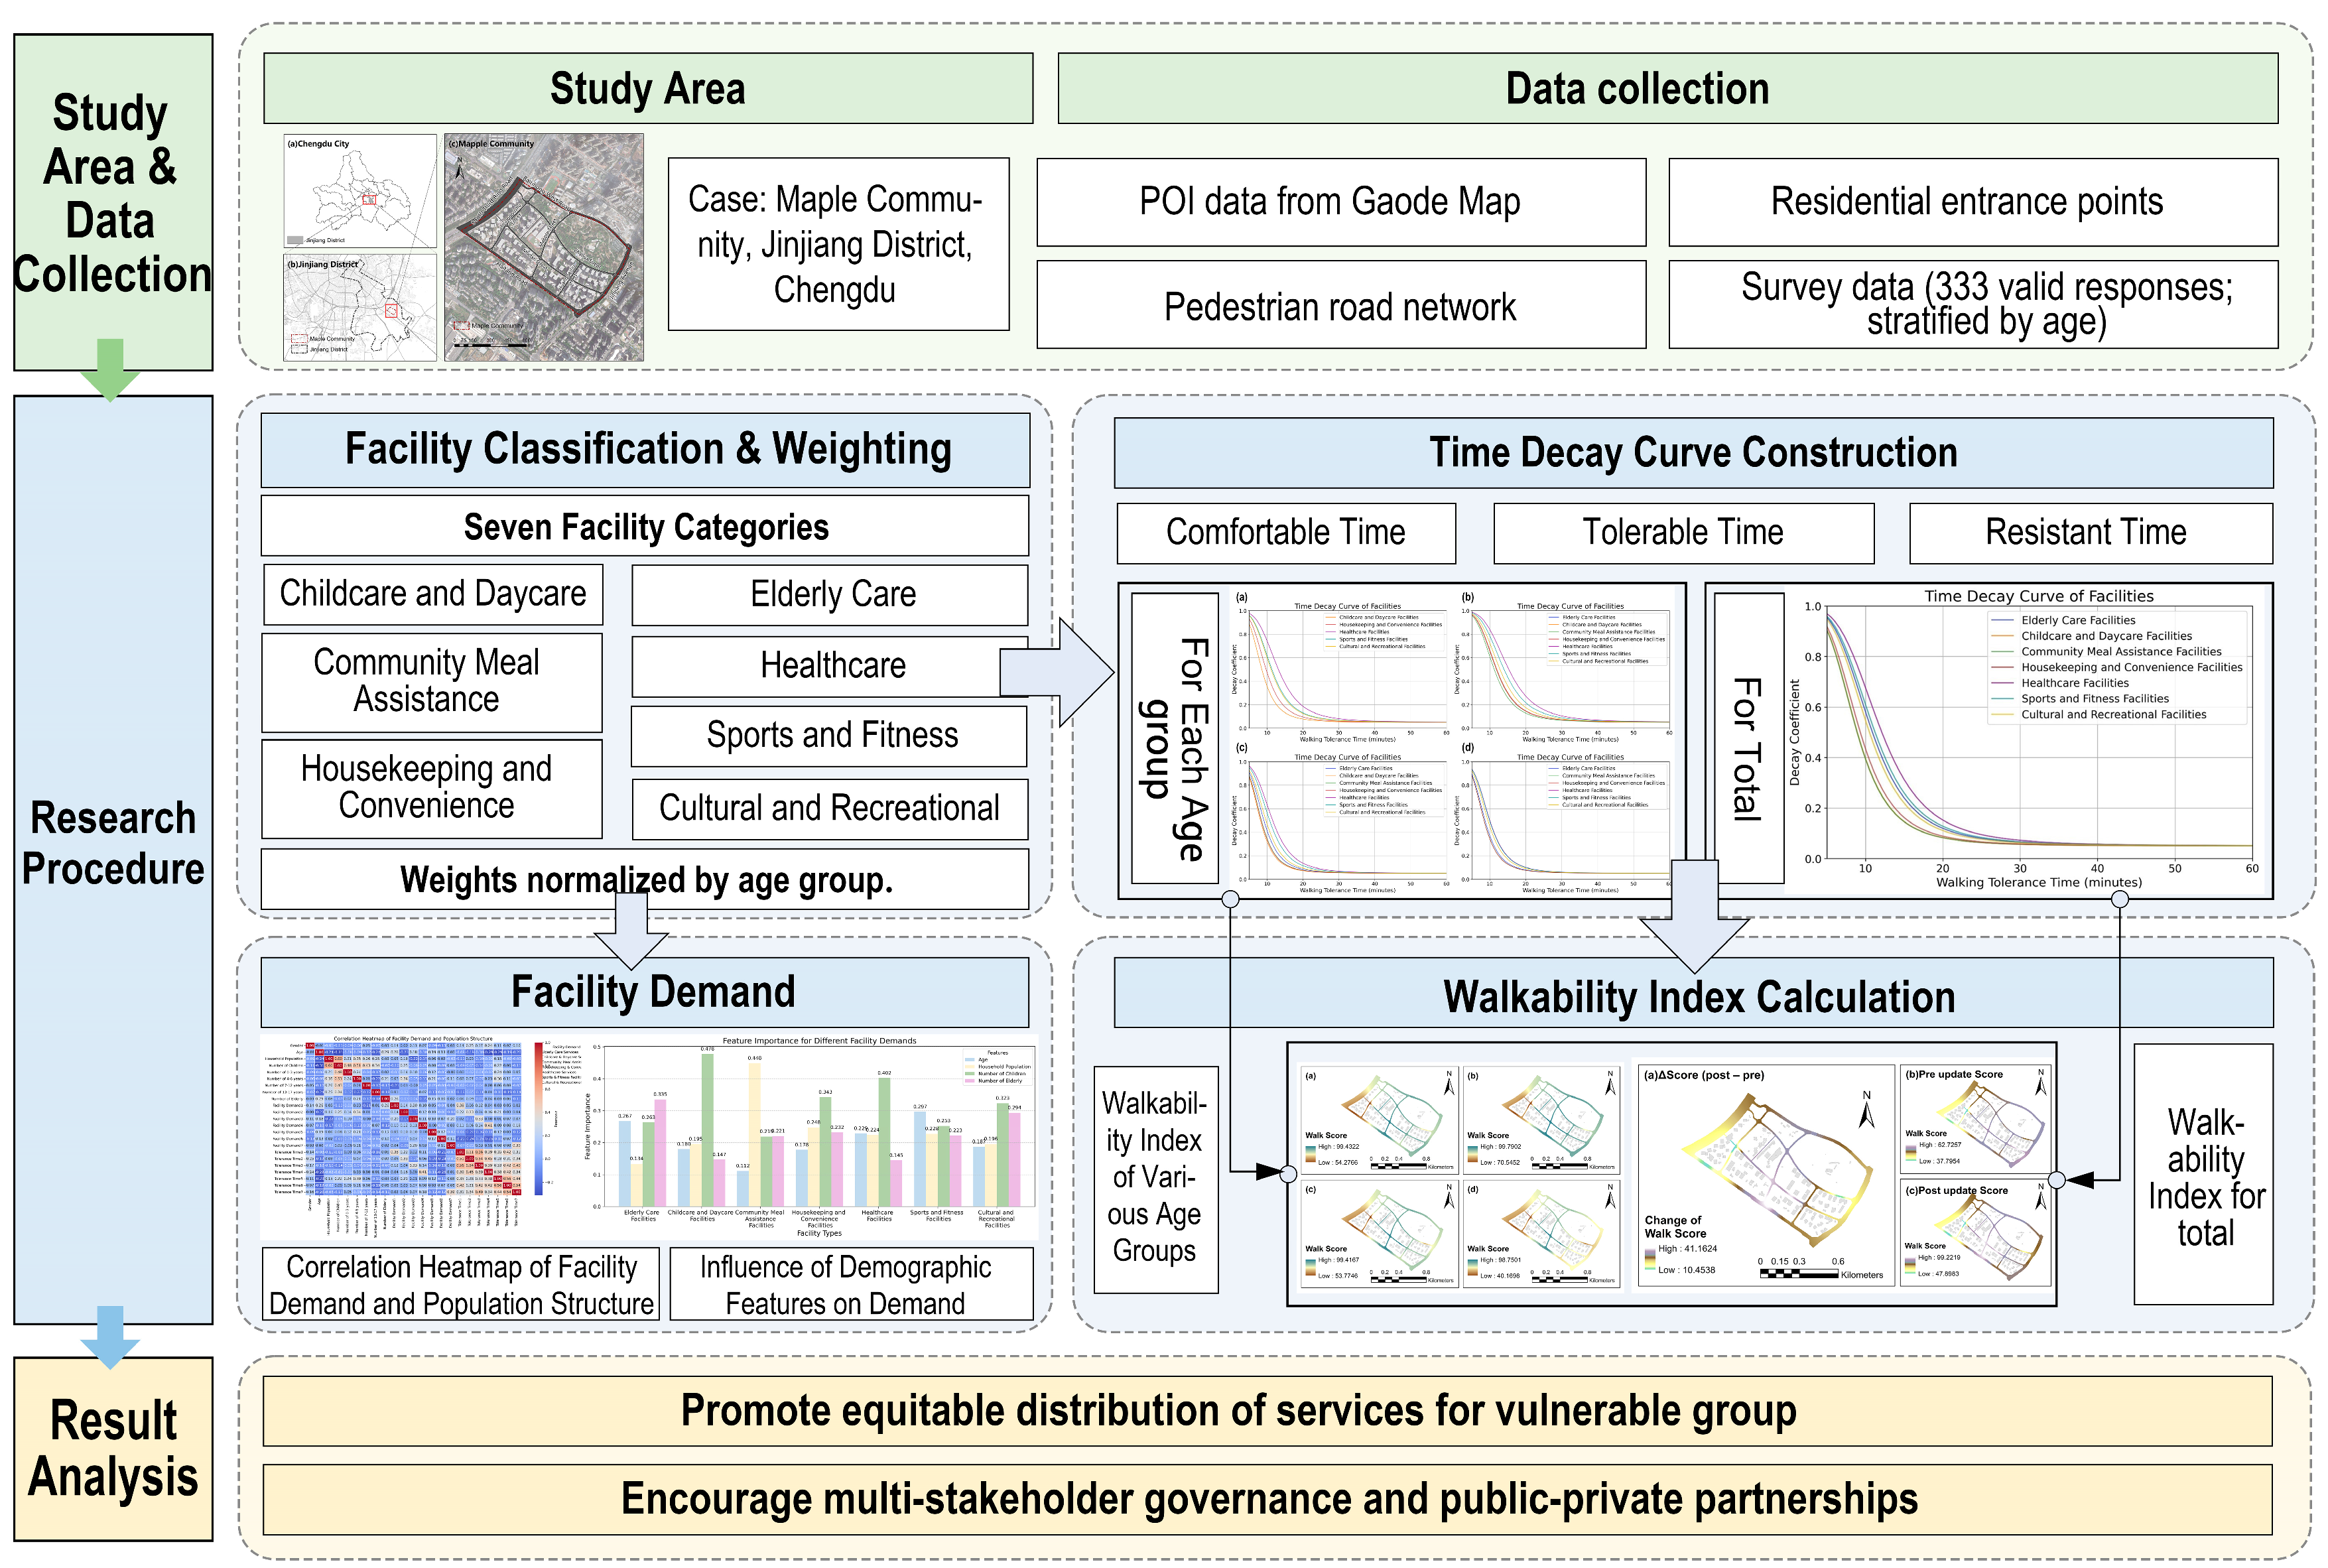
This study (Figure 3) adopted a structured approach to evaluate facility layout characteristics under the lens of age-friendly community planning. The analytical framework follows the logic of “differentiated demand analysis–population preference distribution–walkability index computation”. Considering differences in mobility and travel tolerance, we delineated activity circles for different population groups. Seven categories of embedded service facilities were selected for analysis. For each age group—adolescents, young adults, middle-aged adults, and older adults—we examined their distinct service needs and calculated the corresponding facility preference distribution. Based on these preferences, a facility weighting matrix was established to reflect the relative importance of each service type for different age groups, which was then used for evaluating spatial layout suitability of embedded service facilities.
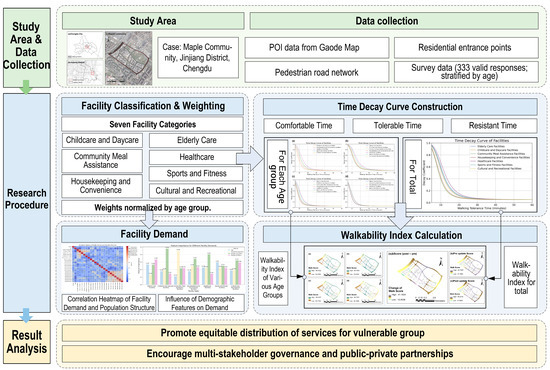
Figure 3.
Study design.
The framework constructed in this study is a theoretical integration of ‘design principles for aging’ and ‘walkability needs of multiage groups’, with the Accessibility–Availability–Age-Friendliness triad as the basis for conceptual synthesis.
In accessibility dimension, the framework has broken through the limitation of traditional GIS spatial analysis that only focuses on physical distance. The age-differentiated walking attenuation function was introduced to simulate the differences in time tolerance and path complexity among different groups, responding to the principle of Safe and Comfortable Traveling in the ageing-friendly design.
In availability dimension, through the demand weighting matrix and the evaluation of facility use efficiency, the matching index between facility function and age demand was established. The facility classification system combines policy guidance with residents’ actual usage frequency, realizing the theoretical integration of “top-down planning” and “bottom-up feedback”.
2.3.1. Facility Usage Frequency and Weighting Calculation
The computation of the walkability index in this study draws upon the gravity-based Walk Score model, which incorporates two core factors: (1) the distance decay coefficient from the point of assessment to the nearest facility and (2) the facility weight, reflecting the relative importance of each facility type. Following the principles established by the Walk Score methodology and the approaches proposed by Zhang et al. [42,43], we conducted a participatory public survey within the study site. The survey was specifically designed to capture inputs for generating facility weights and constructing time decay curves. The questionnaire consisted of 3 major sections:
- Demographic Information—This section collected basic socio-demographic attributes of respondents, including age, gender, household size, and number of elderly household members.
- Service Demand and Frequency of Use—Respondents were asked whether they had a need for each of the seven categories of embedded service facilities. Responses were coded as 0 (no demand) or 1 (has demand). Furthermore, for those indicating demand, they were asked about the frequency of usage, coded as 1 (never), 2 (occasionally), 3 (frequently).
- Computation of Demand Index—A demand index was calculated by multiplying the binary demand value by the usage frequency. The index values were then interpreted as follows: 0 = No demand; 1 = Demand but never used; 2 = Occasionally used; 3 = Frequently used.
A stratified random sampling method was adopted for data collection, targeting residents who had lived in the community for more than six months. The study was conducted in two phases. In the first phase, 108 valid responses were collected, and in the second phase, 225 valid responses were gathered, resulting in a total of 333 valid submissions. The sample consisted of 64 adolescents, 73 young adults, 93 middle-aged adults, and 103 seniors. This survey covered multiple aspects, including gender, age, family composition, community service needs, and walking tolerance time.
Facility scores were assigned based on the aggregated demand index and user preferences. Each facility was scored from 1 to 4 based on the average demand level across different age groups, with 1 representing highest priority and 4 lowest. These scores were further normalized to a 0–100 scale to enable weighting in the walkability index computation.
The final facility weight for each facility type (Table 3) and age group was derived from the standardized preference score. A higher weight indicates a stronger association between that facility type and the needs of the corresponding age group.
Table 3.
Embedded facility point weights by age group.
2.3.2. Facility Time Decay Curve Fitting
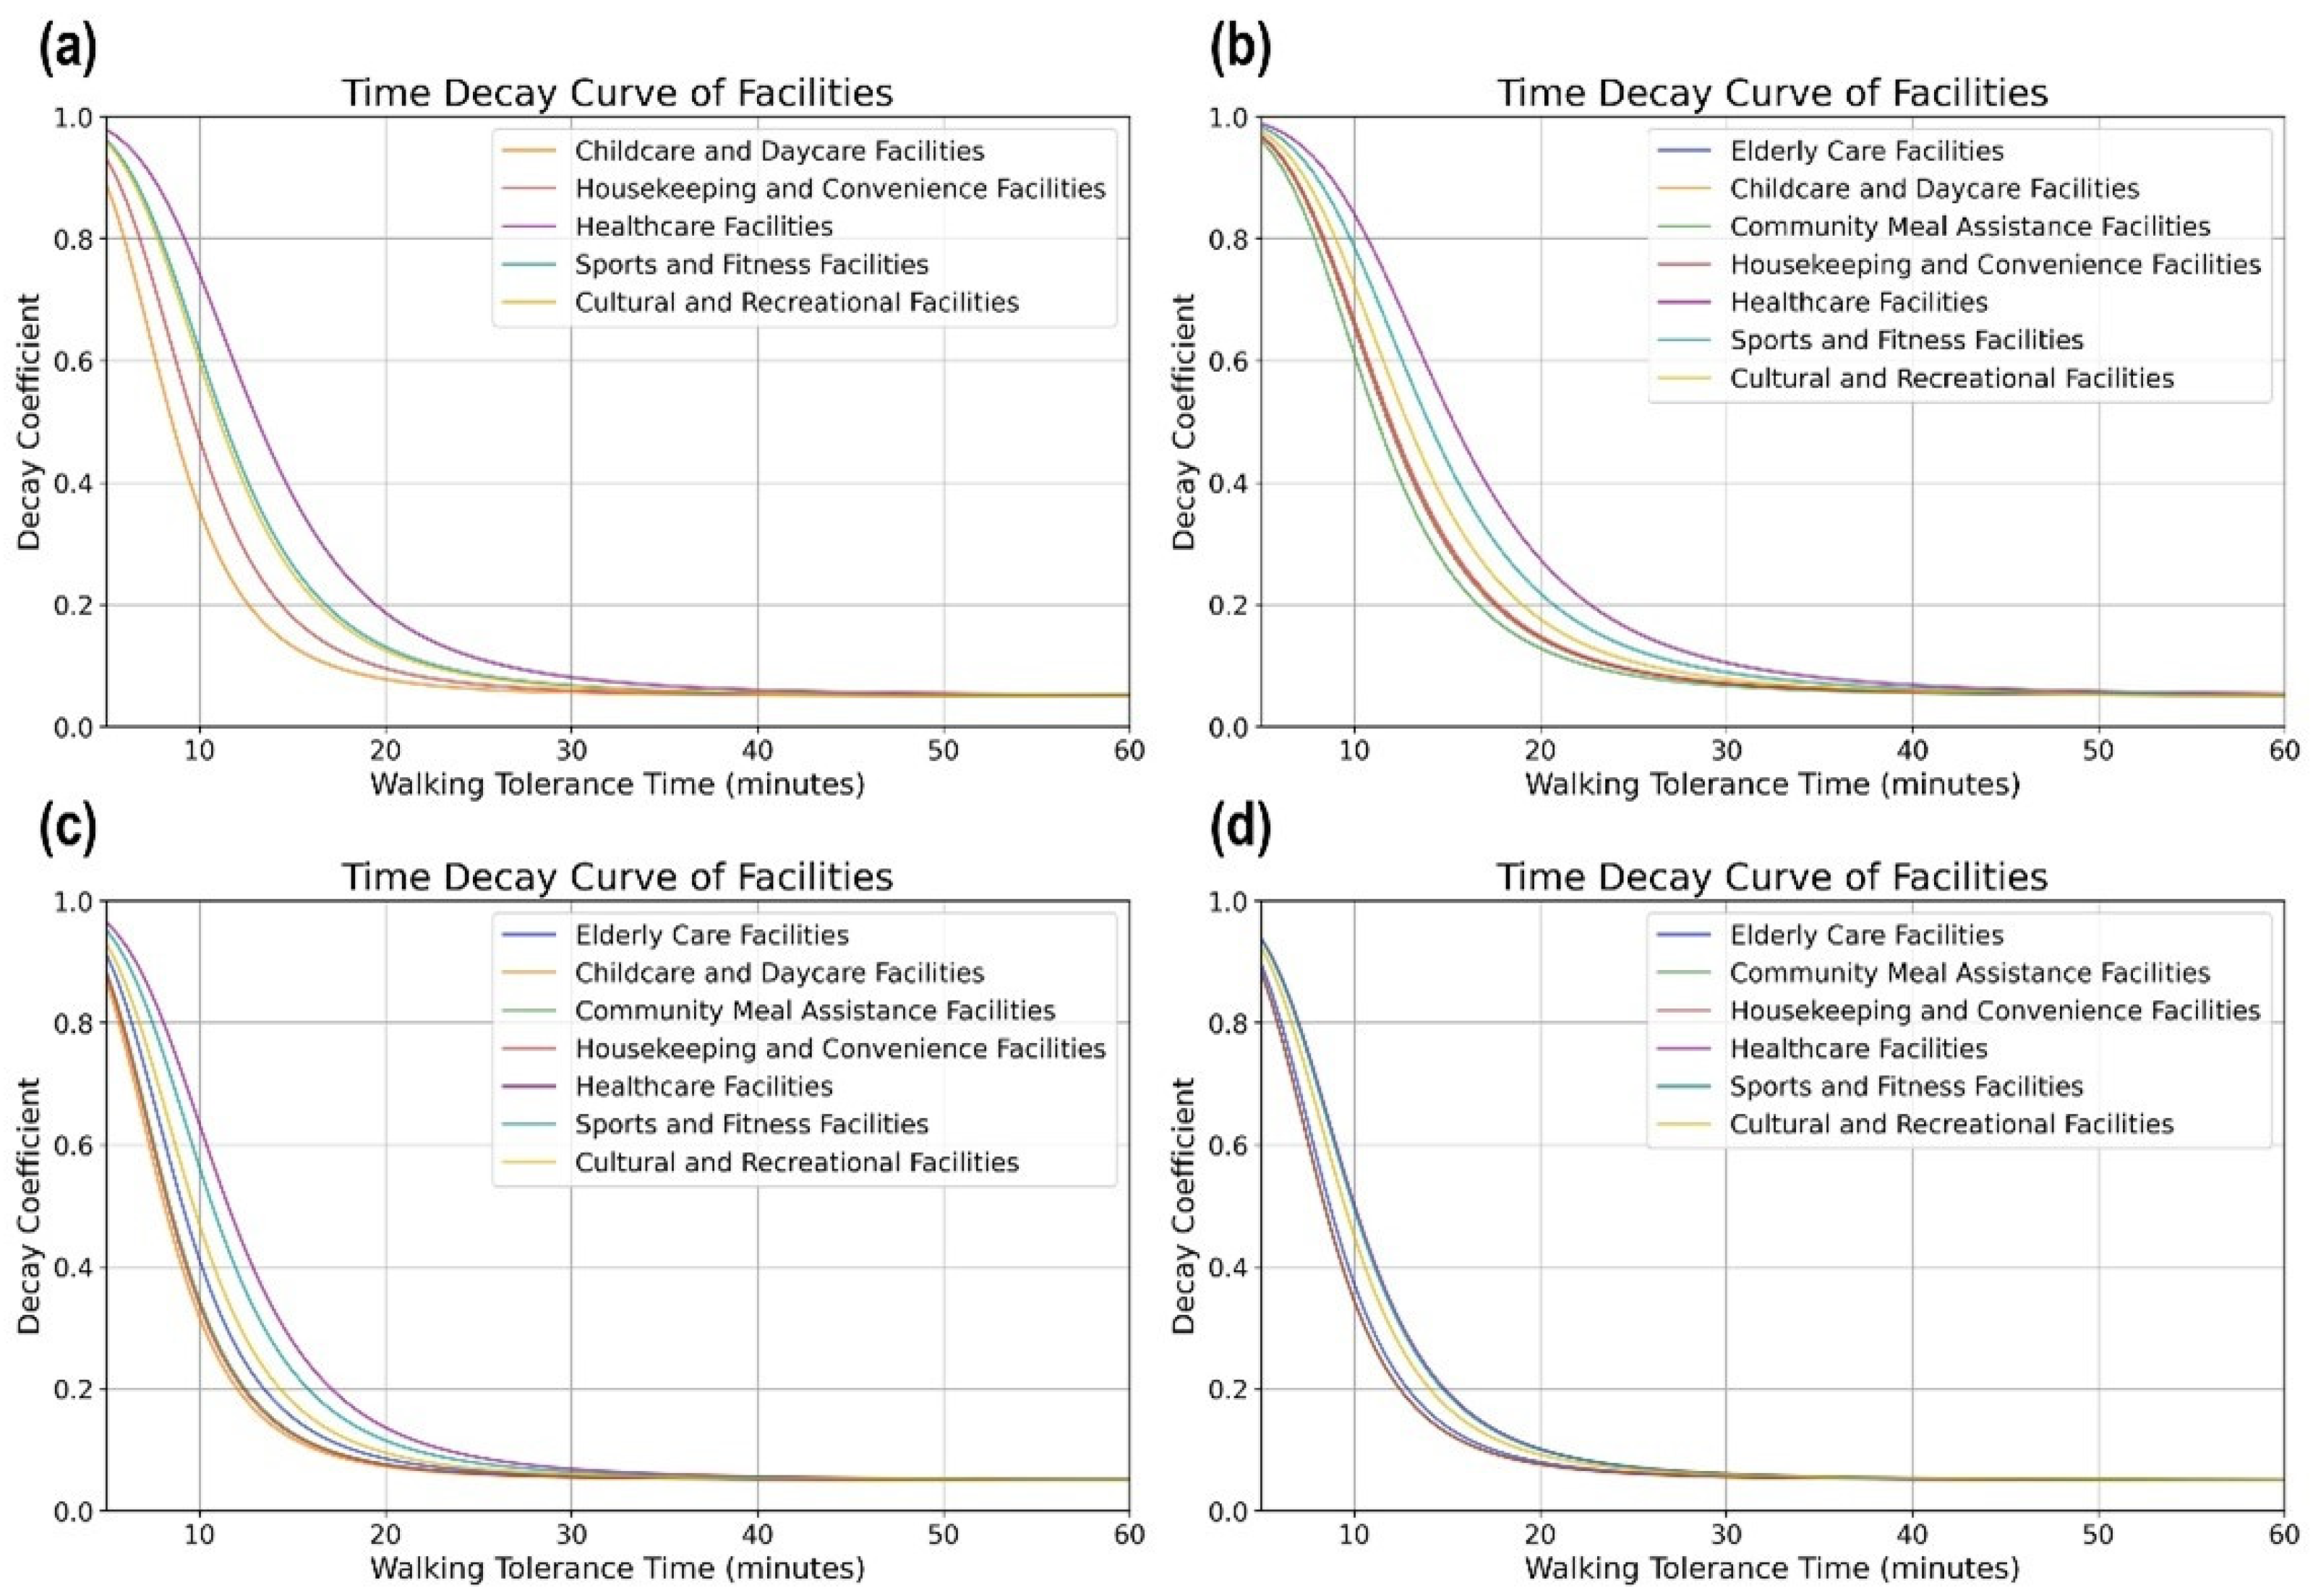
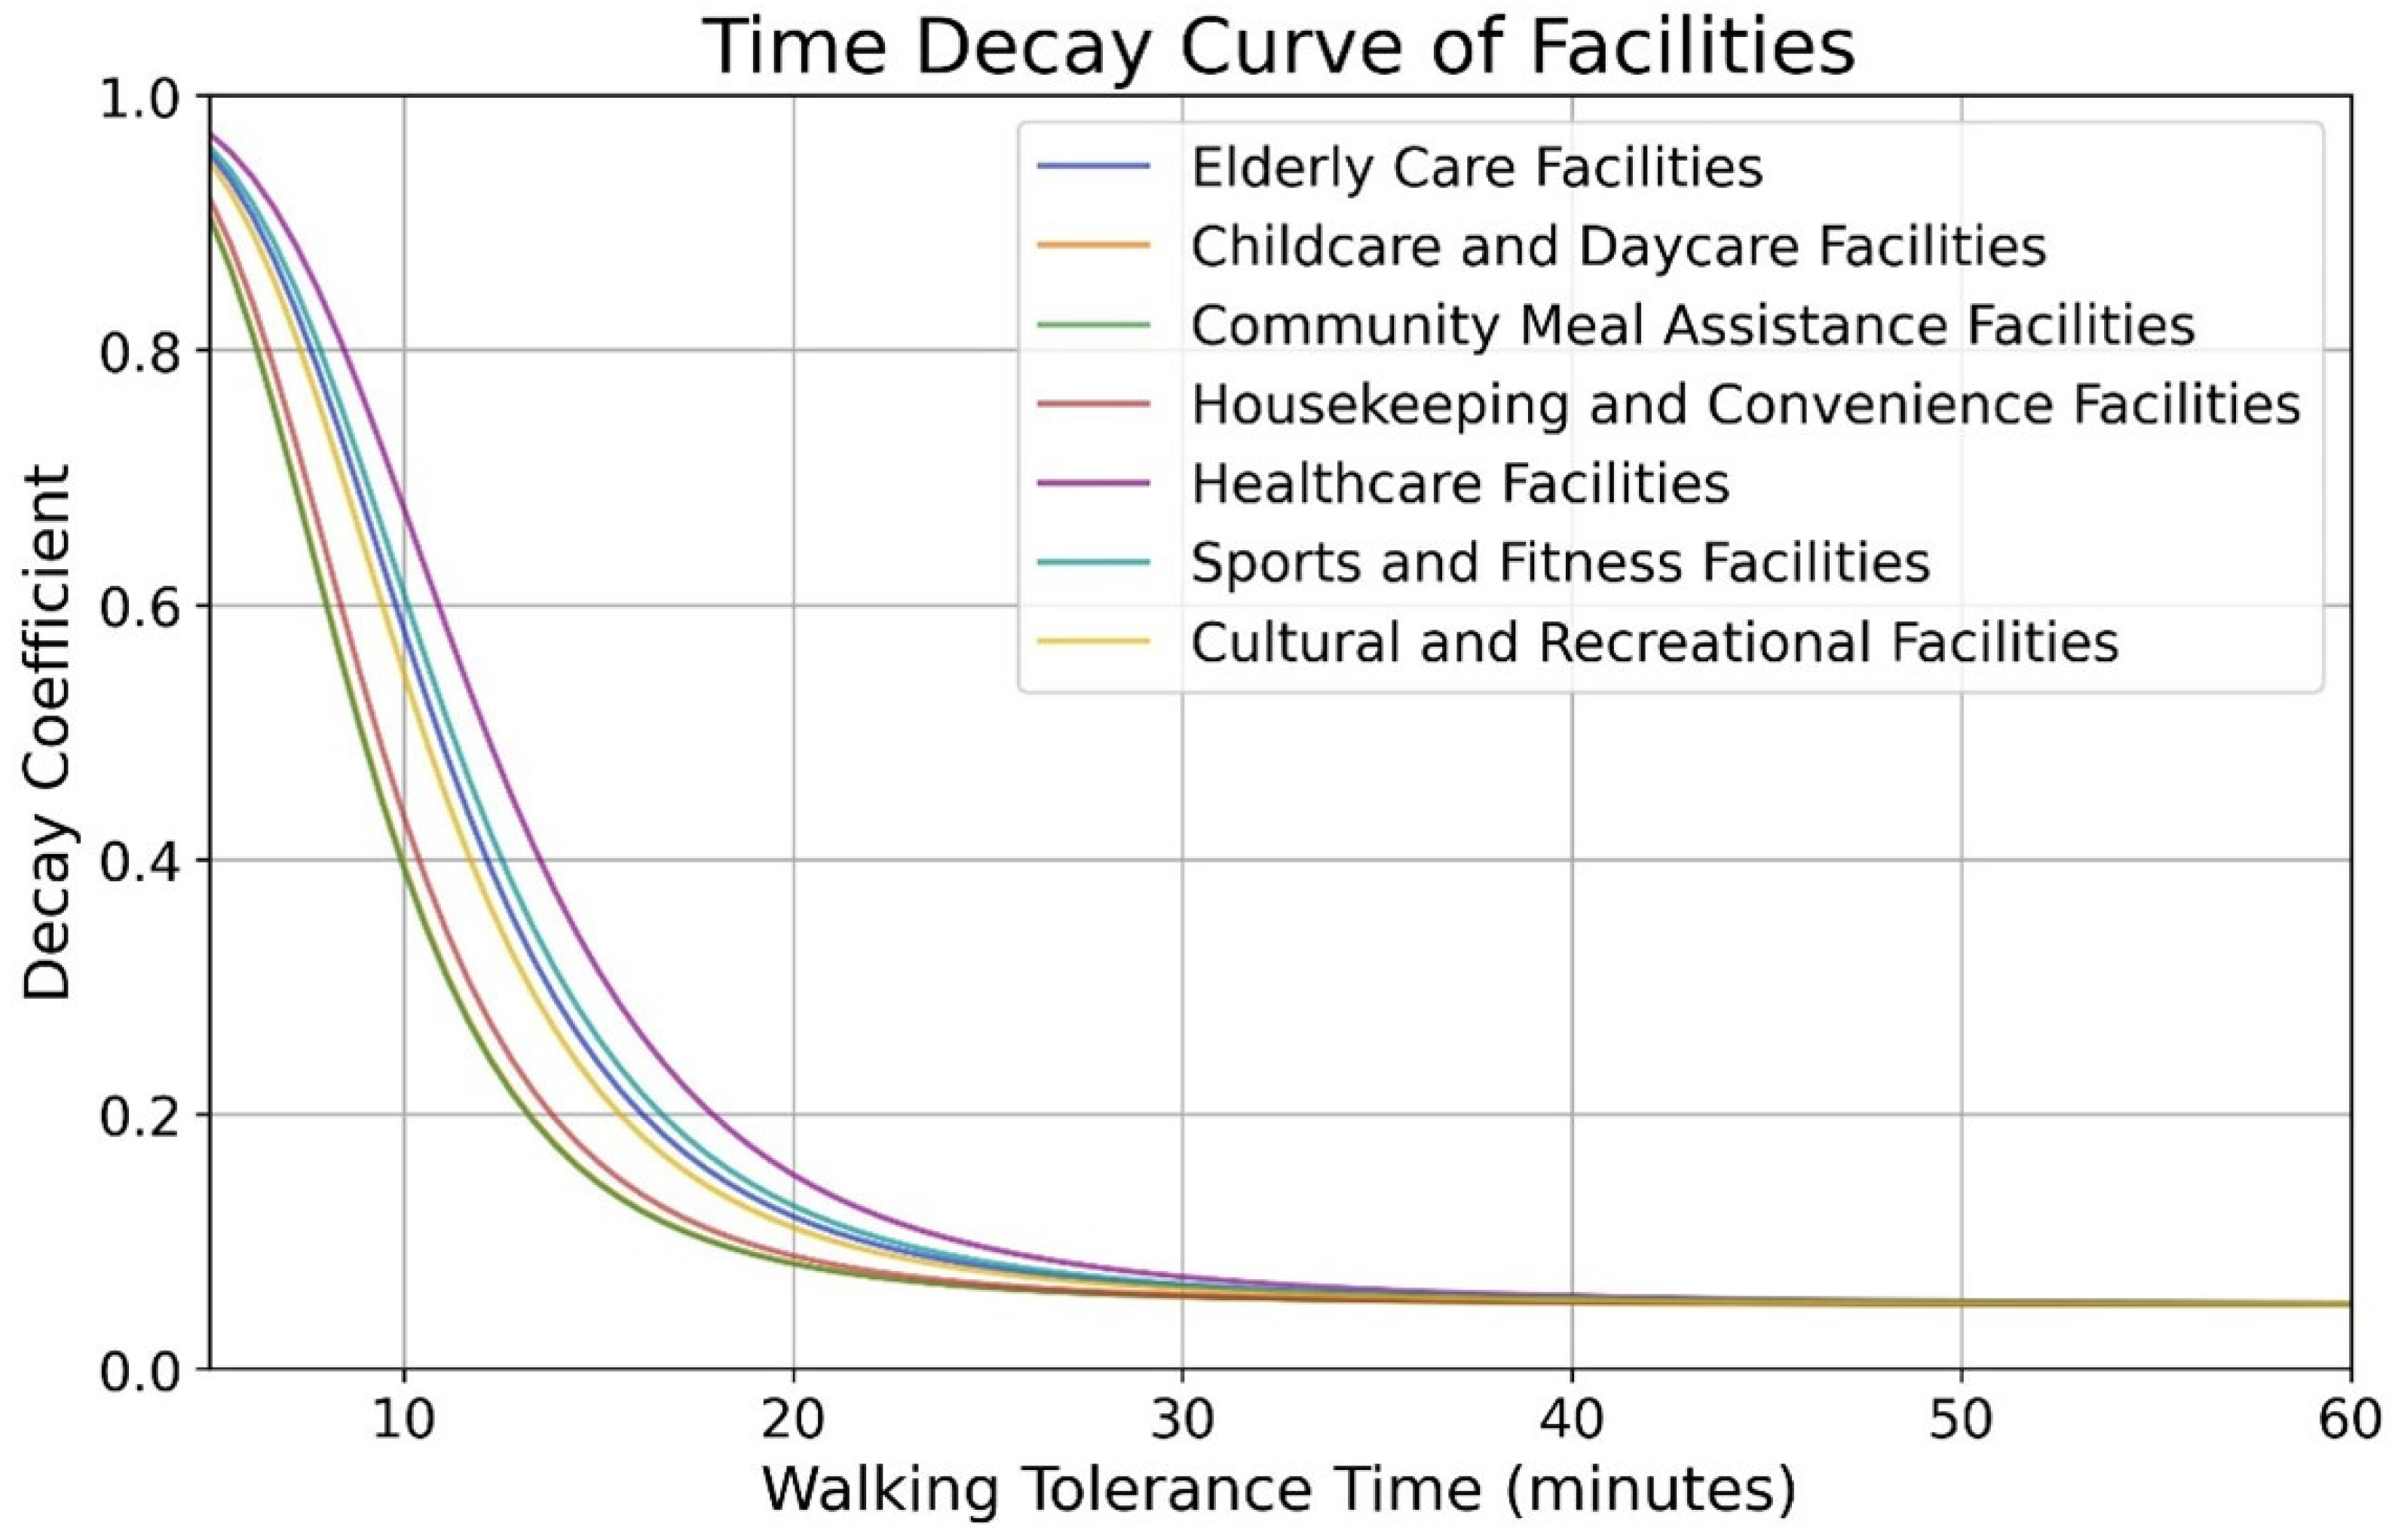
The concept of time decay reflects the reduction in individuals’ willingness to travel as walking time increases, representing the declining probability that a person will access a facility on foot [44,45]. To fit appropriate time decay curves for various facility types, this study conducted a questionnaire survey collecting three types of walking time preferences from residents: (1) Comfortable Walking Time; (2) Tolerable Walking Time; (3) Resistant Walking Time. Based on the collected data, we constructed time decay curves for each facility type (as shown in Figure 4 and Figure 5). The time decay function was defined such that when walking time is less than 5 min, no decay occurs, and the decay coefficient is 1; And when walking time exceeds 60 min, the decay coefficient is 0, indicating that the likelihood of walking to a facility approaches zero. The fitted decay function is expressed as
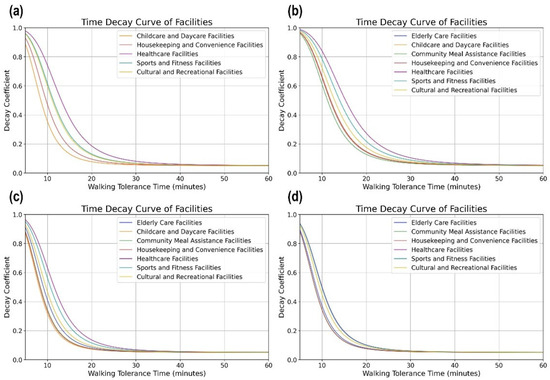
Figure 4.
Time decay curve of facilities: (a) adolescents, (b) young adults, (c) middle-aged adults, (d) elderly.
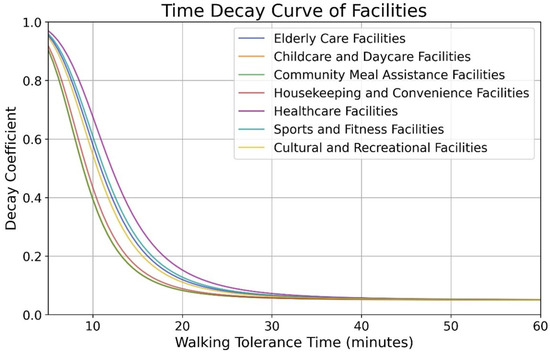
Figure 5.
Time decay curve of facilities. The picture shows the decay function for different types of facilities. The vertical axis represents the attractiveness of the facility, and the horizontal axis represents time. As the walking time increases, the attractiveness of the facilities gradually decreases. When the walking time tends to 30 min, the attractiveness of all types of facilities is basically at a very low level.
2.3.3. Facility Accessibility Evaluation
To evaluate the spatial accessibility of embedded service facilities, this study employed the Origin–Destination (OD) Cost Matrix method in ArcGIS. The OD Cost Matrix assumes that residents follow the minimum-time pedestrian route between origin and destination. Instead of a single average speed, we specified age-differentiated walking speeds derived from empirical gait studies: adolescents = 1.0 m s−1, young and middle-aged adults = 1.2 m s−1, and older adults = 0.9 m s−1. Using these group-specific velocities and a detailed pedestrian road network, we calculated the shortest walking time (x) from each residential entrance point to every facility location, thereby capturing realistic variations in mobility across different groups.
The calculated walking time () was then input into the previously established time decay function to derive the decay coefficient () for each facility [46]. This coefficient reflects the diminishing likelihood of residents accessing a facility as walking time increases. Subsequently, the decay coefficient () was multiplied by the facility weight ()—as determined in the formula below—to compute the walkability index () for each facility.
For each of the four age groups (adolescents, young adults, middle-aged adults, and older adults), the walkability indices () across all facility types were aggregated to obtain the base point walkability index () for each residential location. The formula is as follows:
where represent shortest walking time from the evaluation point to facility; represent base point walkability index at the evaluation point; represent different facilities type; represent time decay coefficient for facility; represent weight of facility.
After calculating the base point walkability indices, we applied the Inverse Distance Weighting (IDW) interpolation method, with the power parameter p = 2 to balance local sensitivity and surface smoothness to generate a continuous surface representing the area-wide walkability index across the study region. This surface illustrates the spatial distribution of accessibility to embedded service facilities. Based on the interpolated walkability index surface, we classified the area into five categories of walkability levels, as outlined in Table 4. This classification facilitated the creation of an accessibility map for embedded service facilities, highlighting areas with varying degrees of pedestrian accessibility.
Table 4.
Walkability index classification standards.
3. Embedded Service Facility Results in Age-Friendly Communities
3.1. Facility Demand from the Perspective of Age-Friendly Communities
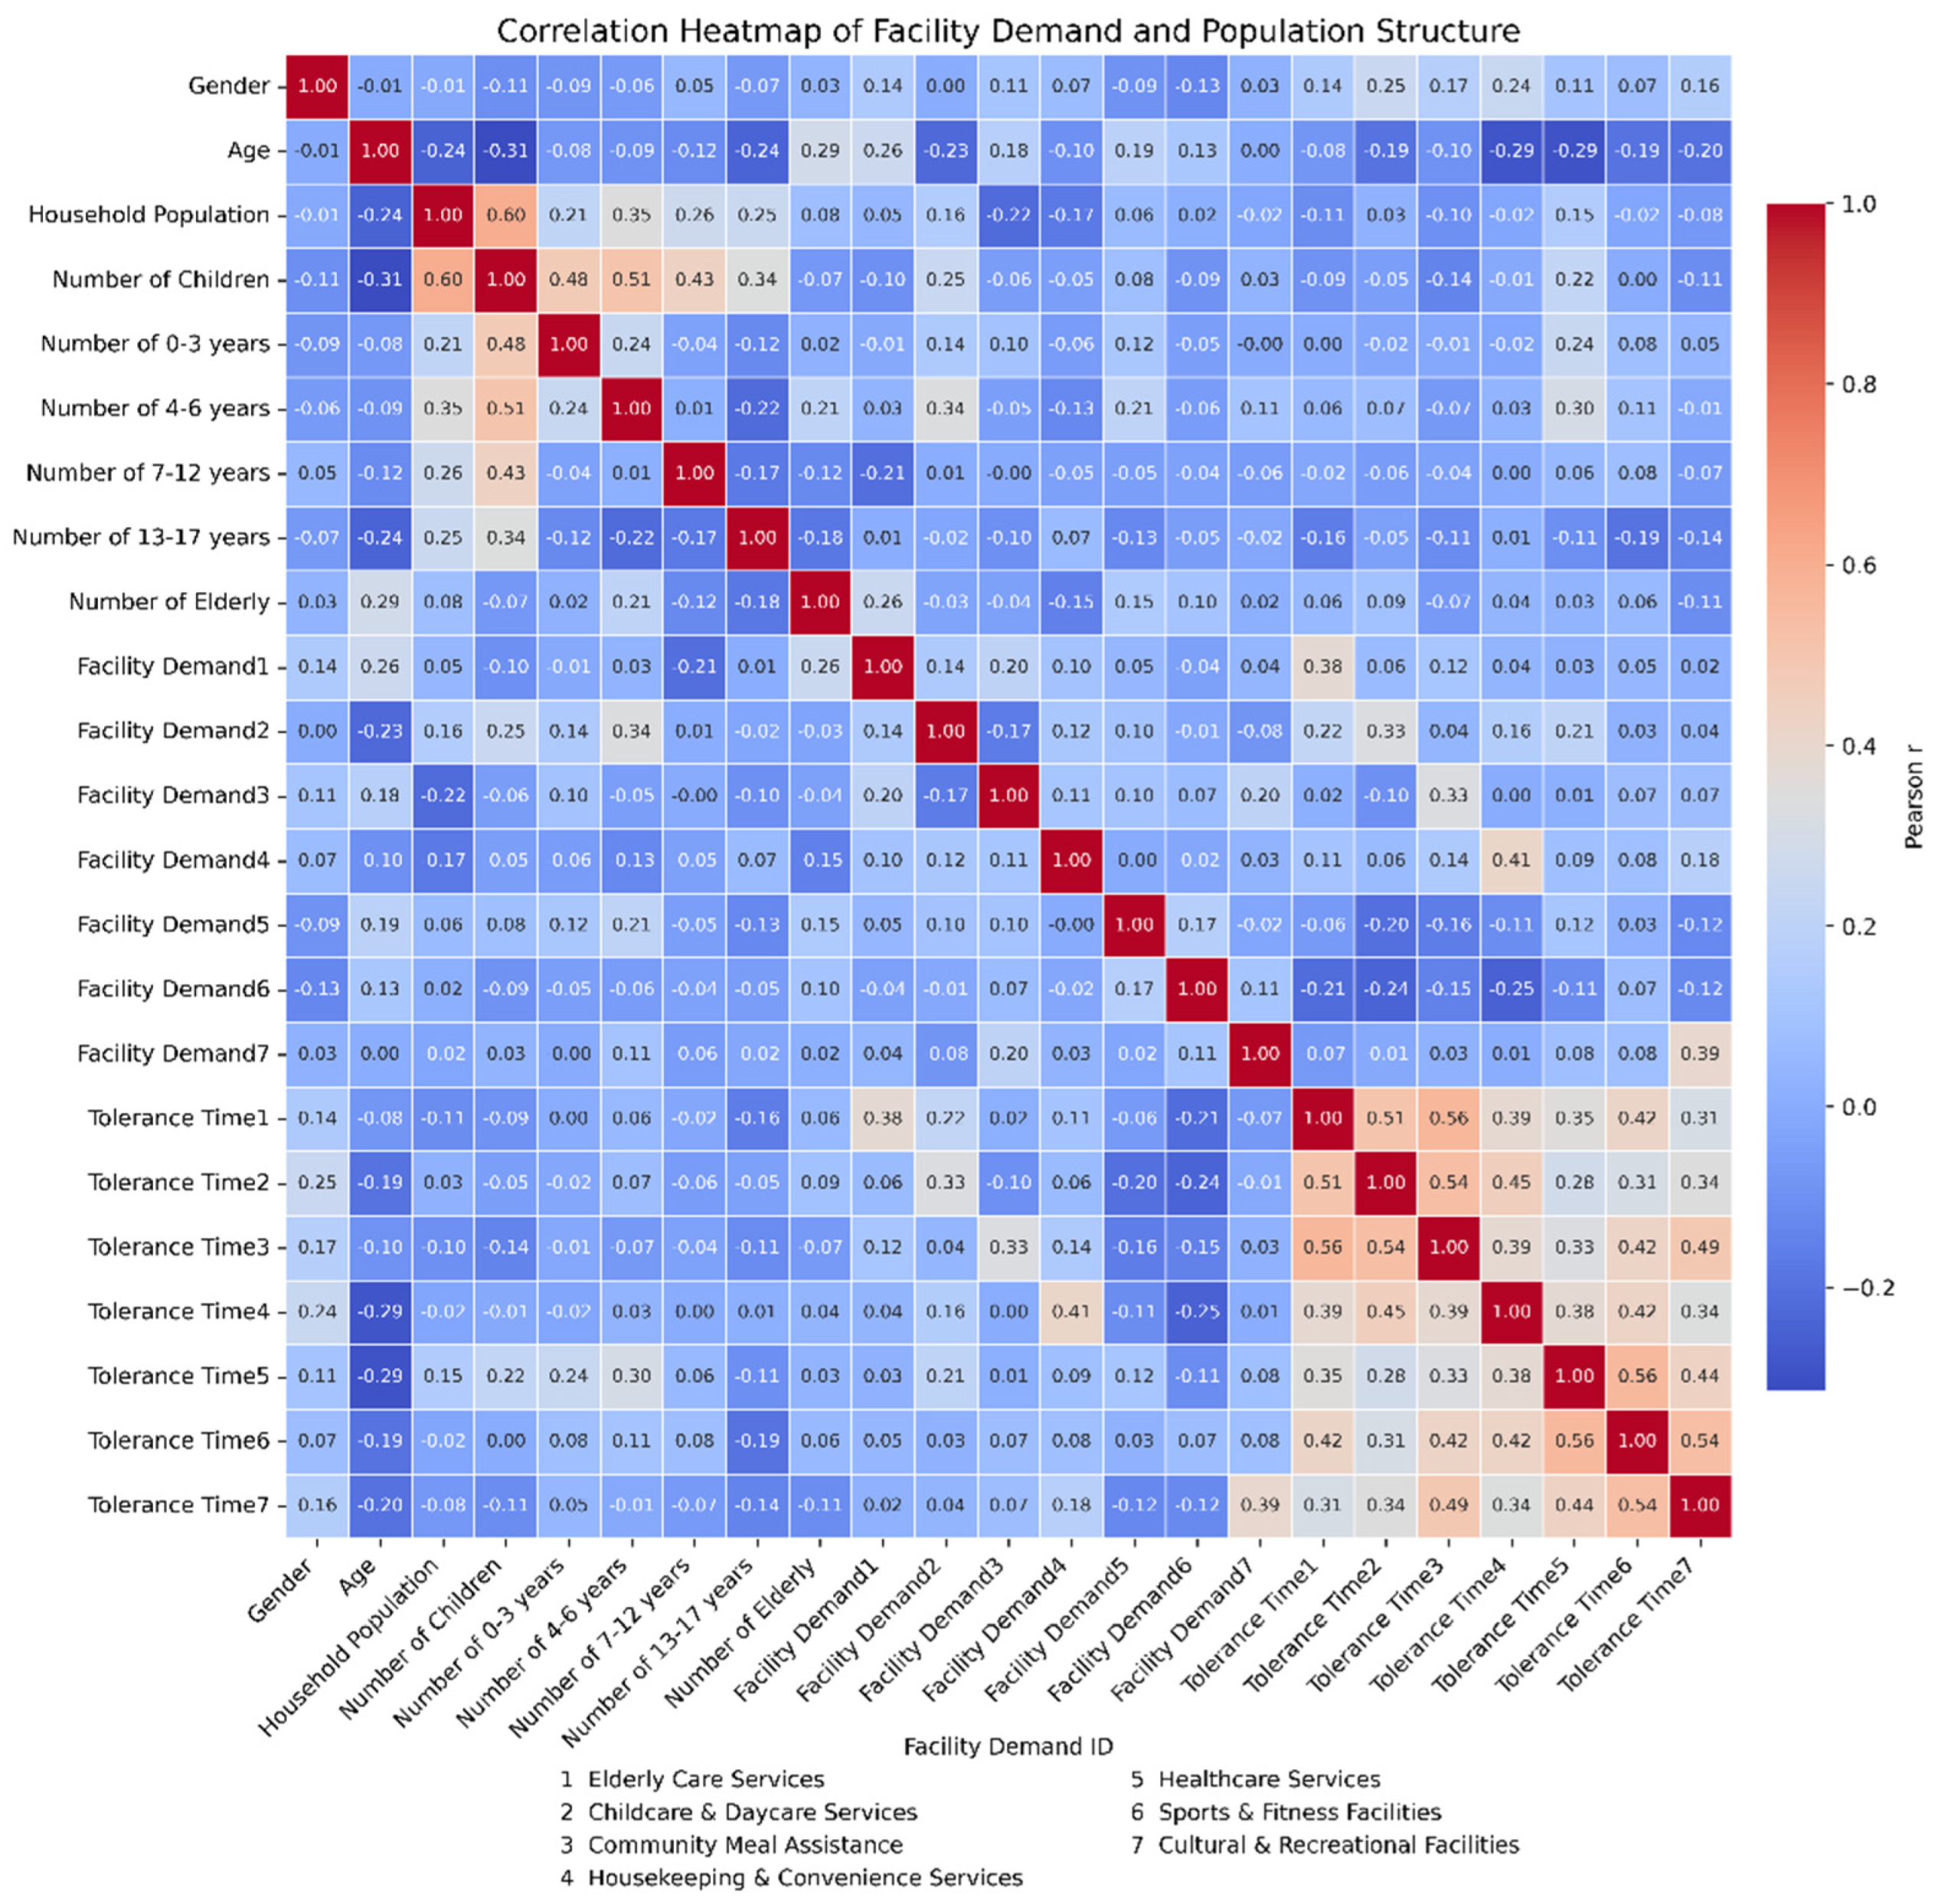
This study reveals the characteristics and differences in the demand for various embedded service facilities across different age groups in age-friendly communities through an analysis of the relationship between population structure and facility requirements. According to the data analysis from Figure 6, family size shows a significant positive correlation with the number of children (r = 0.60), particularly in the age groups of 0–3 years (r = 0.48), 4–6 years (r = 0.51), 7–12 years (r = 0.43), and 13–17 years (r = 0.34). This indicates that areas with larger family sizes, especially those with more children, exhibit a stronger demand for child-related facilities, such as daycare centers and early education facilities. As family size increases, particularly in households with more children, the demand for daycare services and early education facilities becomes more pronounced. The data from the chart clearly shows that family size and the number of children have a significant impact on the demand for these facilities, emphasizing the need to prioritize the provision of childcare and early education facilities in areas with high child population density in age-friendly community planning.

Figure 6.
Correlation heatmap of facility demand and population structure.
Additionally, the differences in the demands for different types of facilities among age groups demonstrate a distinct pattern. The elderly population, compared to other groups, shows a stronger concentration in the demand for elderly care and medical facilities, revealing their urgent need for healthcare and life support services. The heatmap data indicates a significant positive correlation between Facility Demand 1 (elderly care facilities) and the elderly population (r = 0.26), as well as a strong correlation between Facility Demand 5 (medical facilities) and the elderly population (r = 0.25). This suggests that, in the planning of age-friendly communities, priority should be given to the layout of elderly care and medical facilities, especially in areas with a high elderly population. Furthermore, the heatmap shows that areas with larger family sizes are closely associated with the demand for medical and elderly care facilities, reflecting the strong demand for health management services among the elderly within families and communities. This highlights the importance of ensuring the accessibility of these services in community planning.
The research has found a strong positive correlation between the number of children and the demand for childcare facilities, indicating that the number of children is a key factor affecting the planning of community day care centers and early education facilities. The demand for childcare facilities is more concentrated in areas with larger family sizes. The demand for cultural and entertainment facilities is correlated with the number of children and elderly people, but the influence of children is more significant, indicating that such facilities need to meet the activity needs of children. The demand for medical facilities is positively correlated with the number of children, which may reflect their need for emergency medical services or daily healthcare needs.
There is a correlation between the demand for cultural and entertainment facilities and the number of elderly people, but the degree of correlation is not high. The possible reason is that elderly people may be more inclined to participate in cultural activities such as calligraphy, chess, and community choir, which require specialized cultural spaces. In addition, analysis of the walking index shows that the walking ability of the elderly group is significantly limited in the peripheral area, indirectly indicating their dependence on nearby fitness facilities. In the future, some cultural facilities may be designed as intergenerational shared spaces, indirectly meeting the social needs of the elderly.
Figure 7 reveals the impact of family structure and population age composition on the demand for various types of service facilities. The heatmap clearly indicates a strong correlation between Facility Demand 7 (cultural and recreational facilities) and the needs of children, particularly in the age groups of 0–3 years (r = 0.12) and 4–6 years (r = 0.34). This suggests that these groups have a strong demand for sports, recreation, and cultural activity facilities. This finding underscores the need for age-friendly community planning to place greater emphasis on providing cultural, sports, and leisure facilities for children and adolescents, thereby enhancing the overall quality of life in the community. For different age groups, especially the elderly, the heatmap shows significant correlations with Facility Demand 1 (elderly care facilities) and Facility Demand 5 (medical facilities), highlighting the importance of elderly care and medical health facilities. These analyses indicate that the planning of embedded community facilities should pay closer attention to family structure and population age differences, rationally allocating various service facilities to better meet the diverse needs of different age groups in age-friendly communities.
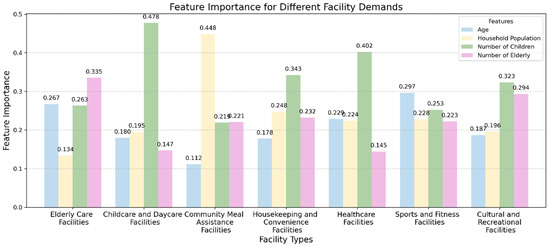
Figure 7.
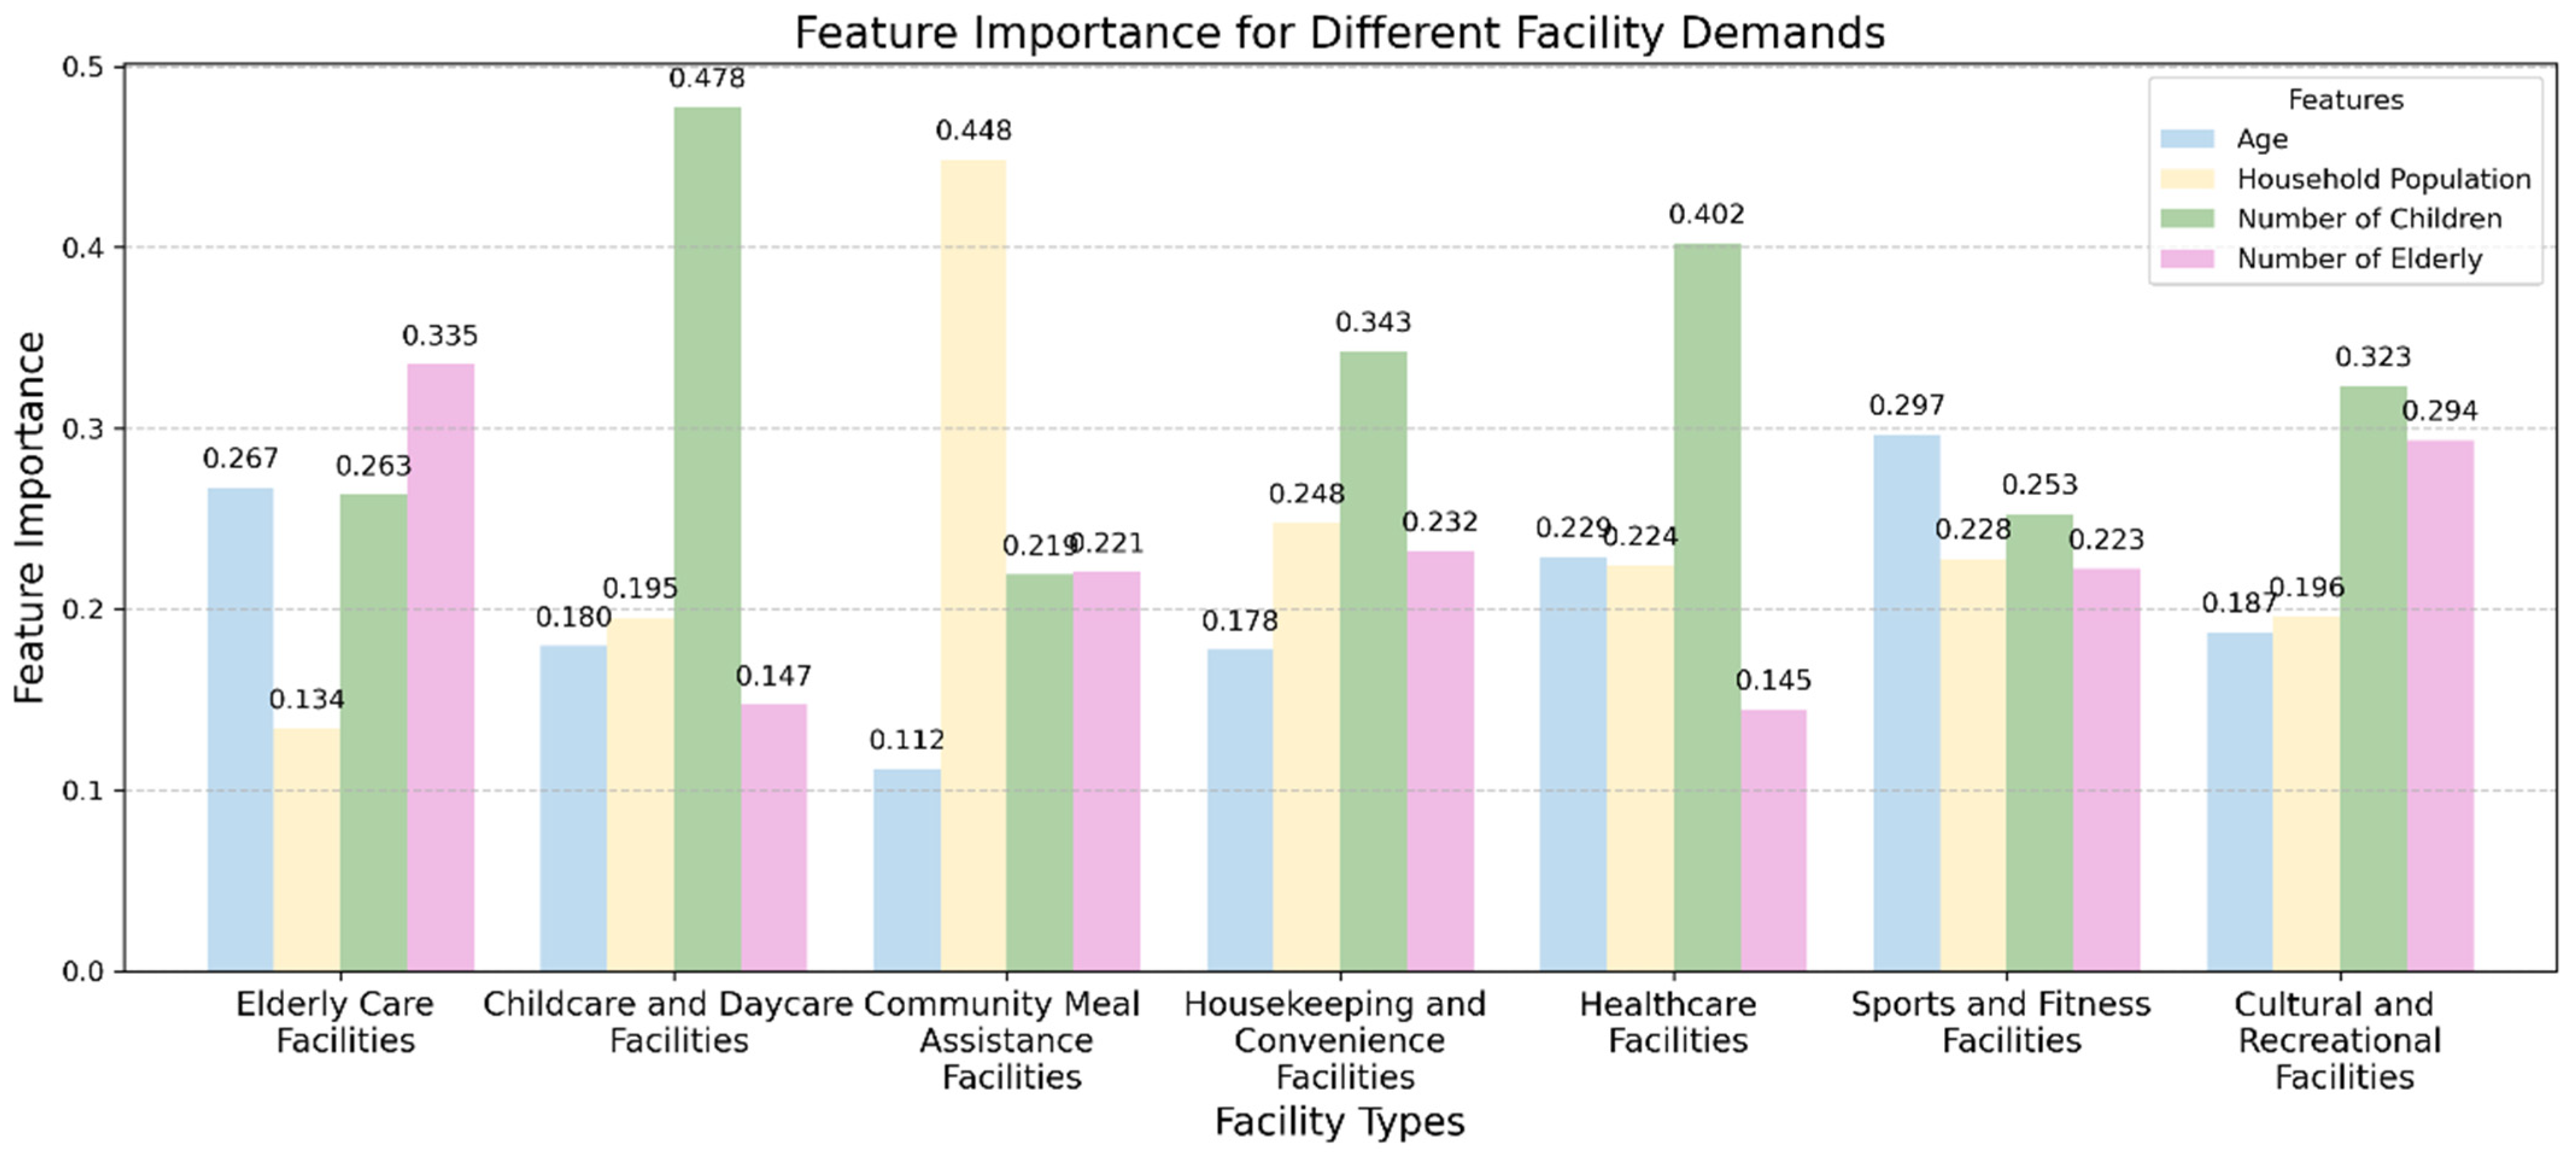
Influence of demographic features on demand for community service facilities. This study analyzes the relationship between population structure and facility demand, revealing the demand characteristics for embedded service facilities across different age groups in age-friendly communities. Figure 6 specifically examines the impact of four characteristics (age, household size, number of children, and number of elderly) on the demand for various facilities, including elderly care facilities, childcare facilities, community meal assistance facilities, household assistance facilities, medical facilities, sports and fitness facilities, and cultural and recreational facilities.
The research findings indicate significant differences in how each characteristic affects the demand for different facility types. For elderly care facilities, the number of elderly people shows the highest correlation with demand (r = 0.335), suggesting that age-friendly community planning should pay particular attention to the size and distribution of the elderly population, ensuring that sufficient care and health services are provided for the elderly. In contrast, the demand for childcare facilities is most strongly correlated with the number of children (r = 0.478), indicating that the number of children is a key factor influencing the planning of childcare facilities. Therefore, planning must prioritize the safety and accessibility of spaces for children. The demand for community meal assistance facilities is most strongly correlated with household size (r = 0.448), highlighting the significant influence of family size on the need for such essential service facilities. The demand for household assistance facilities shows a strong correlation with the number of children (r = 0.343), suggesting that households with children have a more concentrated demand for such services, which is crucial for planning family-friendly living environments. Furthermore, the demand for medical facilities shows a correlation with the number of children (r = 0.402), indicating that children’s healthcare needs and access to emergency medical services should be considered in facility planning. Sports and fitness facilities show a relatively high correlation with age (r = 0.297), indicating differences in demand for fitness facilities across age groups, particularly within the elderly population, which has a more urgent need for age-appropriate fitness facilities. The demand for cultural and recreational facilities is influenced by both the number of children (r = 0.323) and the number of elderly (r = 0.294), suggesting that such facilities must cater to the diverse activity needs of different age groups.
From an age-friendly perspective, these data highlight the differing needs of various age groups and provide a reference for community planning based on the characteristics of these needs. Particularly for children, priority should be given to increasing daycare and daytime care facilities to meet the needs of households with a larger number of children. For the elderly, elderly care and medical facilities should become the focus of community planning, especially in areas with a high elderly population, where planning should prioritize the accessibility of these facilities.
Additionally, the chart shows that “household size” has a balanced impact on facility demand, particularly in the case of community meal assistance and household convenience facilities (e.g., cleaning and convenience services), reflecting the broad demand for community service facilities driven by family structure. As family size increases, especially in households with a higher number of children or elderly, the demand becomes more concentrated in facilities providing basic life services and healthcare services.
Overall, the survey results reveal that the number of children has the most significant impact on the demand for childcare facilities, household assistance facilities, medical facilities, and cultural and recreational facilities, while the number of elderly primarily influences the demand for elderly care facilities and cultural and recreational facilities. Household size has a notable impact on the demand for community meal assistance and household assistance facilities, while age primarily affects the demand for elderly care, sports and fitness, and cultural and recreational facilities. These findings indicate that the impact of different characteristics on facility demand varies significantly, providing valuable quantitative data for landscape planning and the layout of public facilities in age-friendly communities, which will help achieve precise configuration and optimized design of facility demand.
3.2. Comparison of Walkability Index Before and After the Maple Community Update
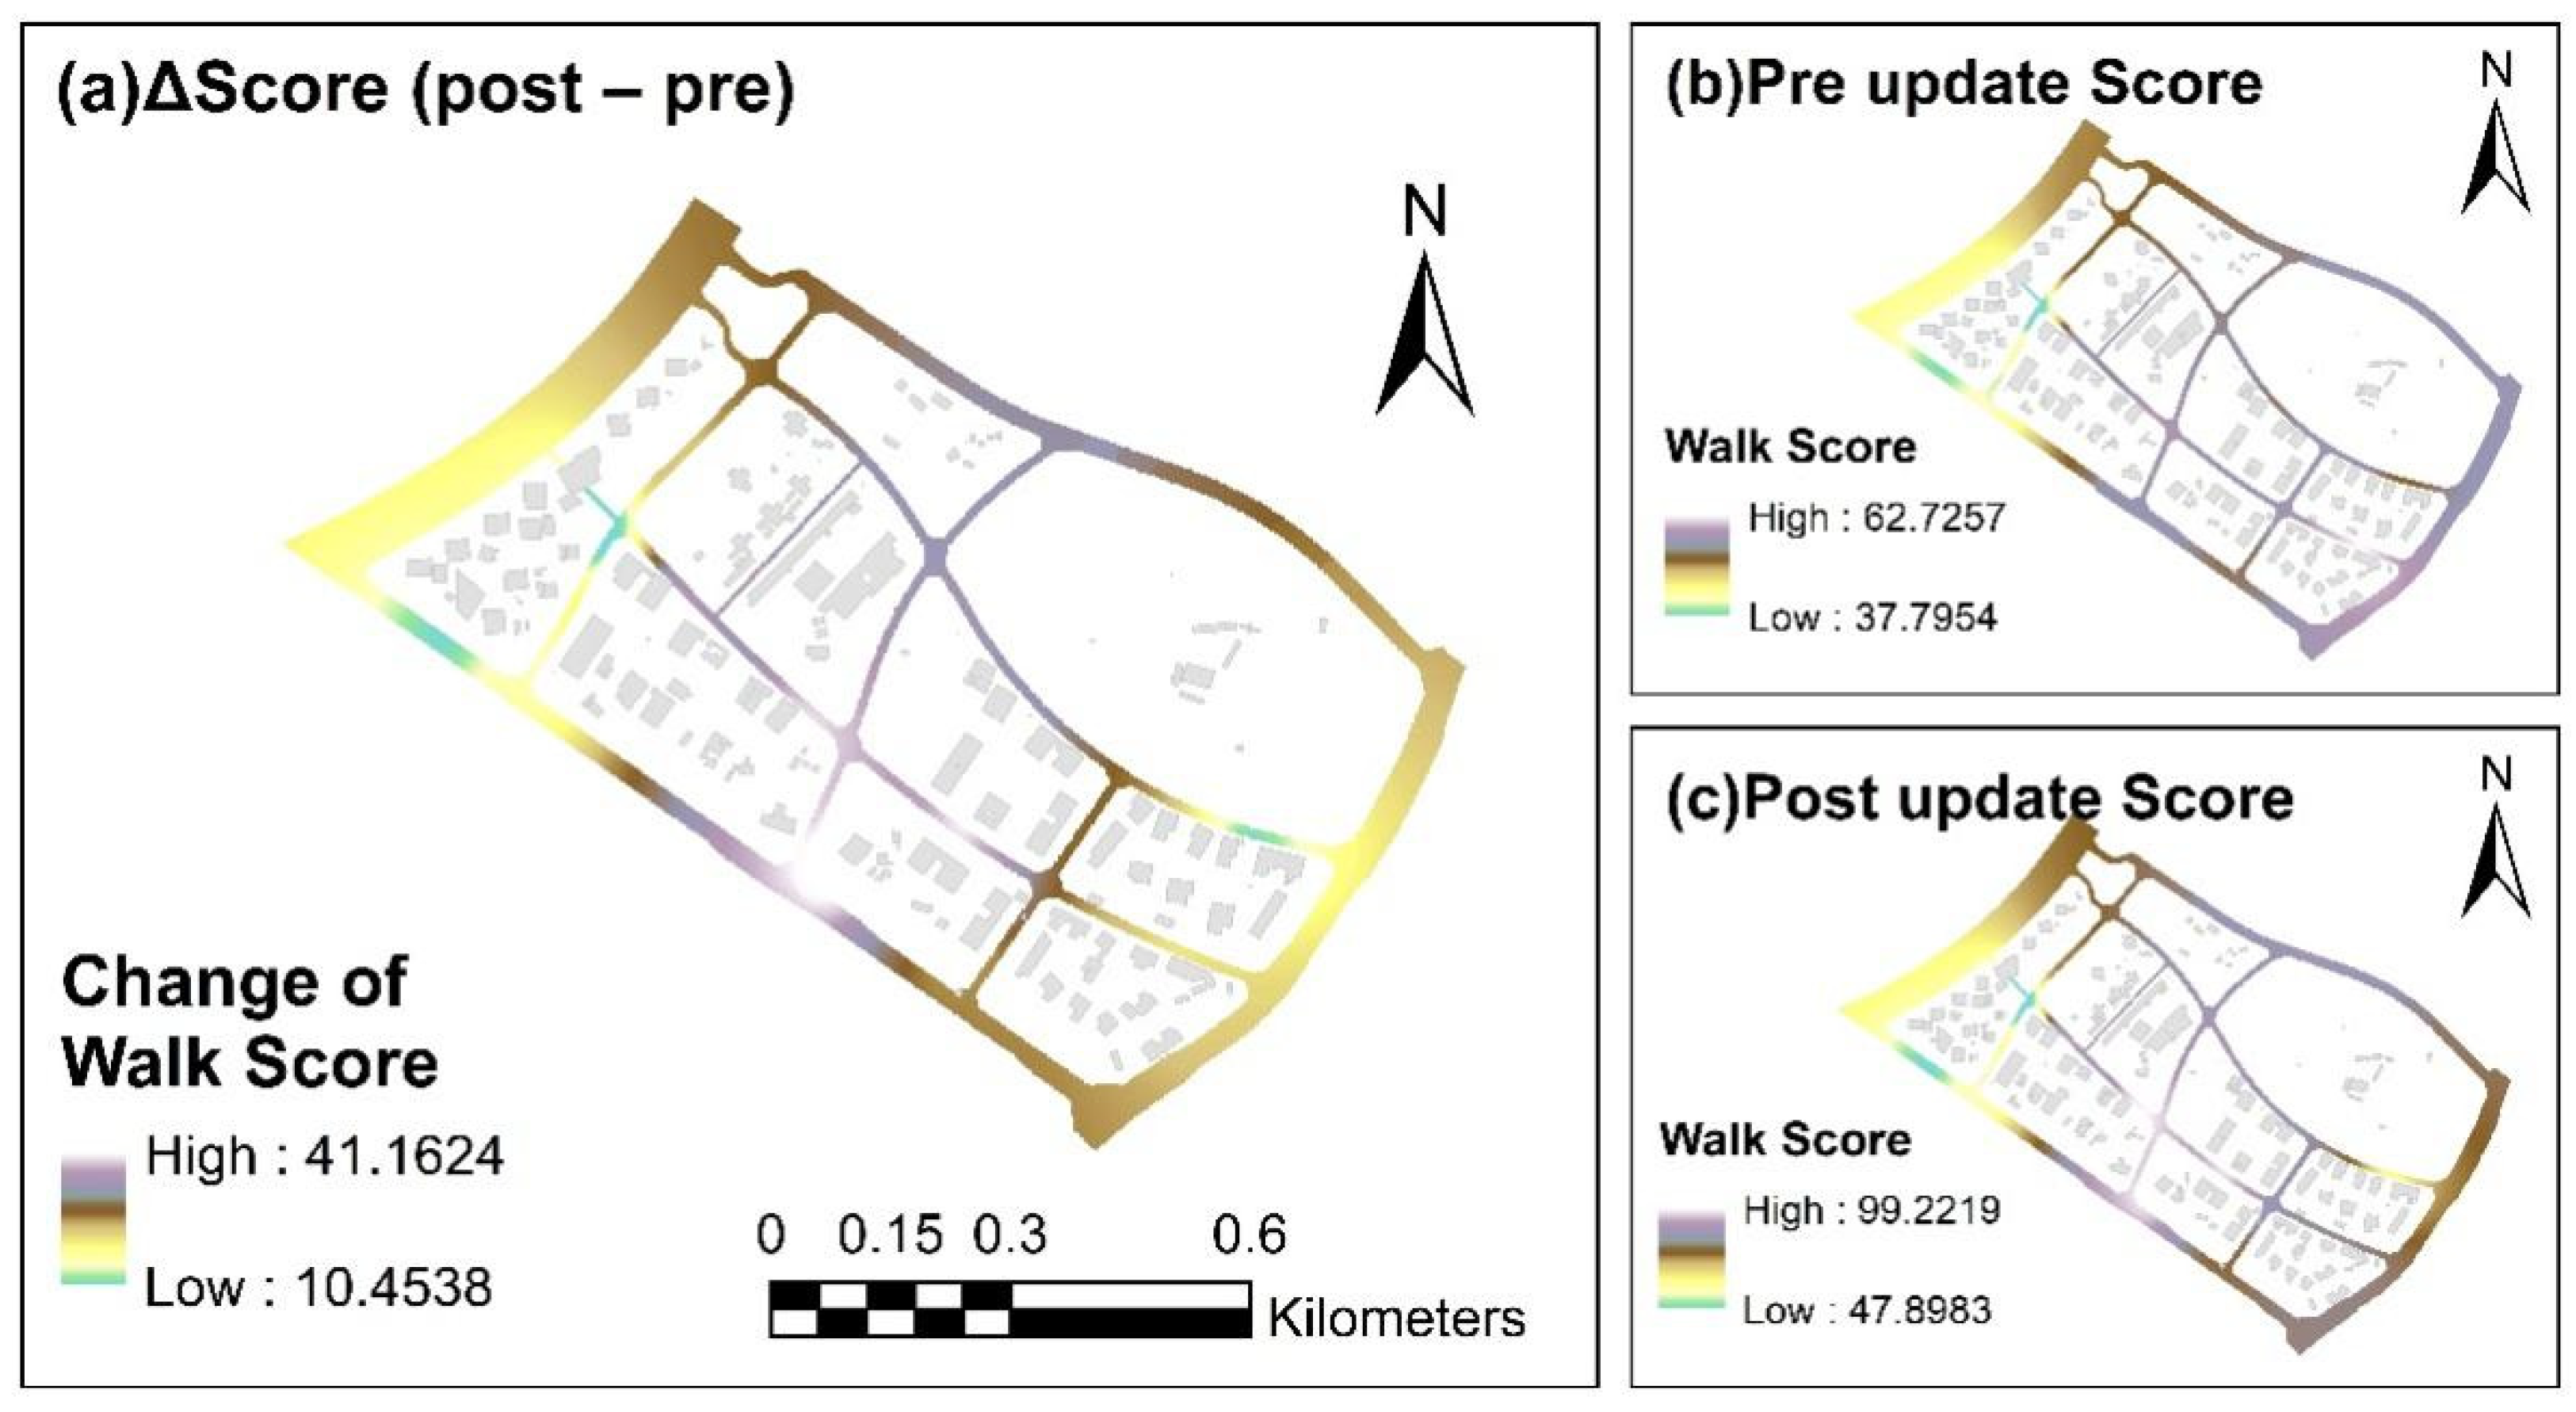
Figure 8 illustrates the changes in the Walk Score and its spatial distribution characteristics in the Maple Community before and after the update. Figure 8a highlights the differences between the pre- and post-update Walk Scores, with changes ranging from 10.4538 to 41.1624, emphasizing areas where Walk Scores have notably increased. A comparative analysis of these three panels clearly demonstrates that the walkability of the community has been comprehensively improved during the update, especially in regions with initially low Walk Scores, further validating the effectiveness of the optimization measures. Figure 8b shows the Walk Score before the update, revealing the variations in walkability across different areas of the community. Figure 8c displays the Walk Score after the update, with a range from 47.8983 (low) to 99.2219 (high). This represents a significant improvement compared to the pre-update values, particularly in areas that initially had lower scores, indicating a substantial enhancement in walkability.
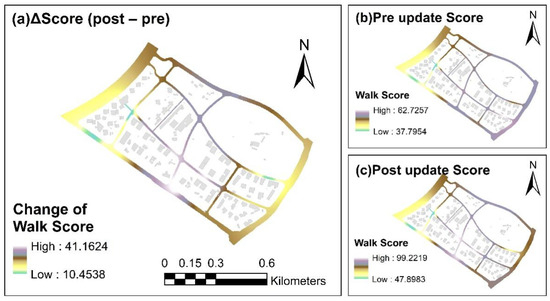
Figure 8.
(a) Post-update Walk Score–pre-update Walk Score; (b) pre-update Walk Score; (c) post-Uupdate Walk Score.
Panel (a) presents the spatial distribution of Walk Score changes, showing significant geographic disparities. The dark blue areas represent the largest negative changes, primarily concentrated in the southern and western parts of the Maple Community, indicating the greatest improvements in Walk Score in these areas. In contrast, the light blue areas exhibit smaller negative changes, suggesting that these regions experienced limited improvements in walkability, likely due to their initially higher levels of walkability. These distribution patterns further suggest that the Maple Community faces issues related to uneven spatial distribution and accessibility. The optimization measures have significantly improved accessibility in areas with lower Walk Scores, particularly in the southern and western regions, which were the most disadvantaged. This provides strong evidence for improving spatial equity and enhancing service accessibility within the community.
The changes in Walk Score not only reflect improvements in walkability within the community but also have a profound impact on inclusivity for residents of all age groups. After the update, the Walk Scores generally increased, especially in the previously weaker areas of the southern and western parts of the community, where walkability has significantly improved. This improvement may allow more community members, particularly the elderly and children, to more easily access key facilities and services, reducing isolation and fostering greater community cohesion. The enhancement of walkability has created a more convenient living environment for residents and has contributed to the ongoing development of an age-friendly city.
Overall, following the integration of service facility complexes, the Maple Community update has significantly enhanced overall walkability, particularly in areas with initially lower Walk Scores. The increase in Walk Score reflects the success of creating an age-friendly community, allowing residents of all age groups to find suitable walking paths and service facilities within the community, meeting diverse needs, and promoting social harmony and integration. Despite the overall improvements, there are still areas in panel (c) where the Walk Score changes are minimal, suggesting that these regions still require further optimization. Therefore, future efforts could focus on more refined facility adjustments and targeted measures to address local accessibility bottlenecks. This comprehensive optimization model provides a valuable reference for similar urban renewal projects in age-friendly cities and offers a framework that can be applied to more communities in the future.
3.3. Walkability Index of Various Age Groups in Maple Community
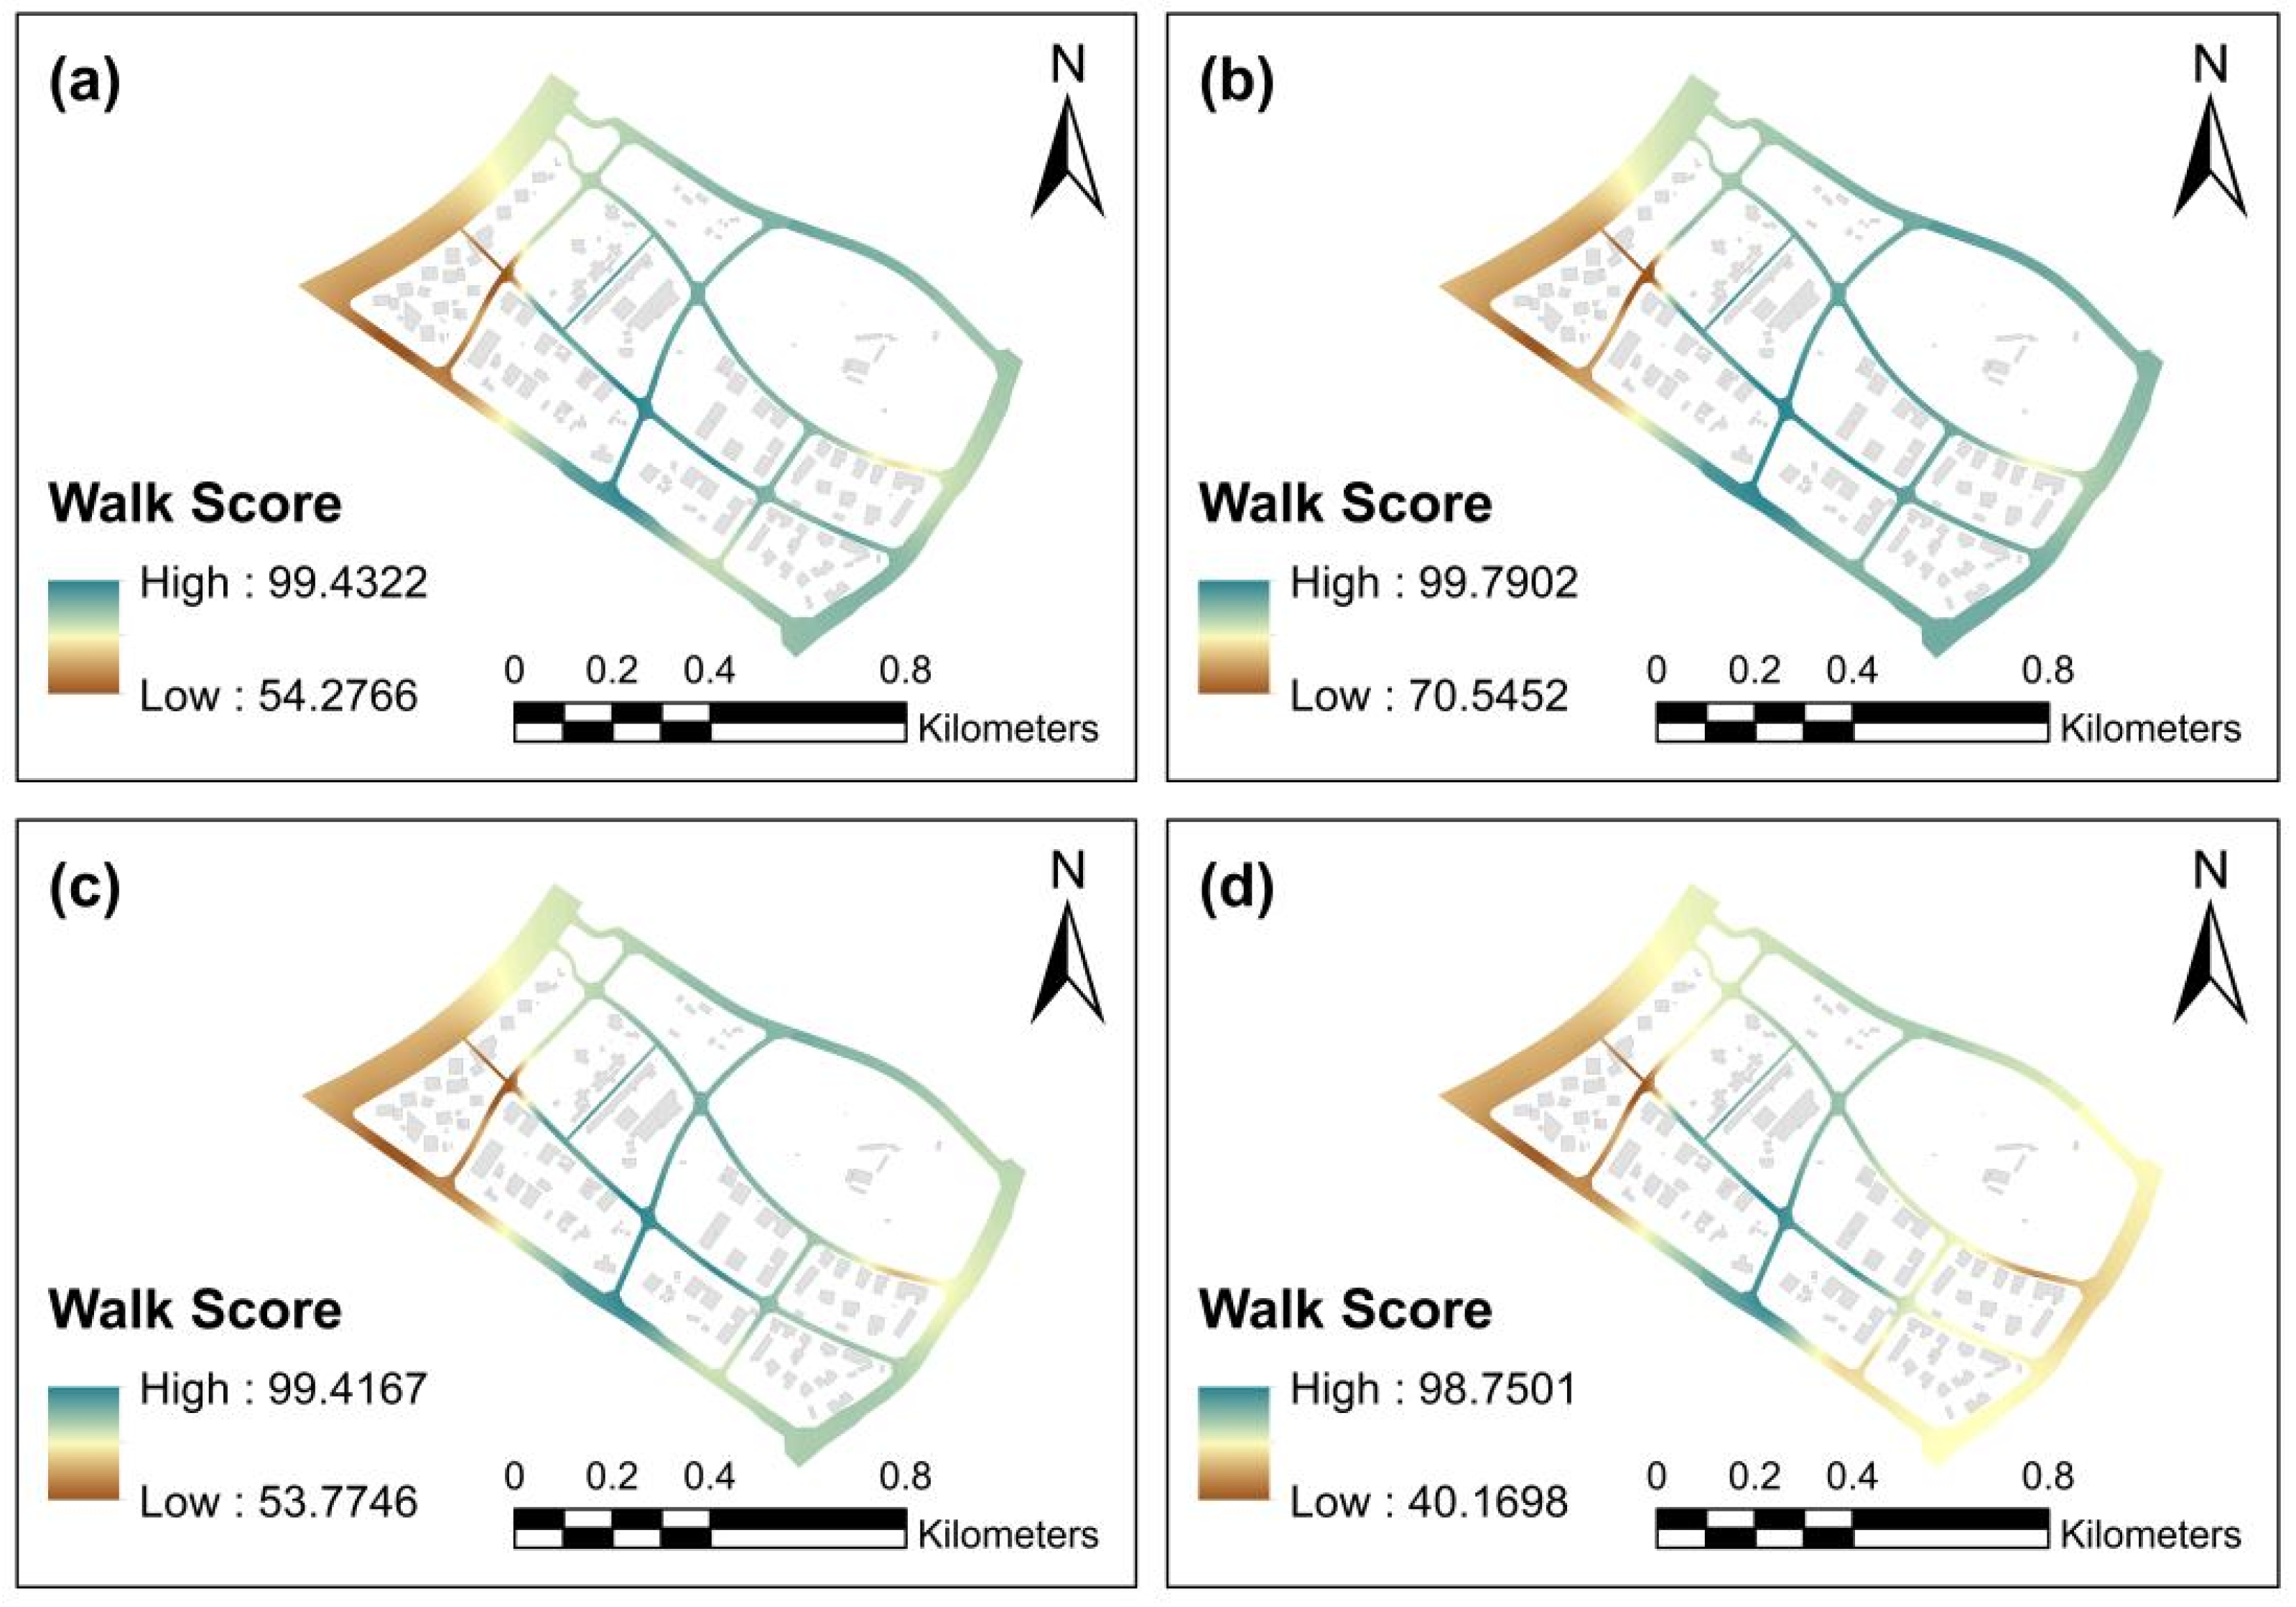
Figure 9 illustrates the variations in walkability among different age groups (adolescents, young adults, middle-aged adults, and elderly) within the Maple Community. From the perspective of spatial walkability, the Walk Score distributions in Figure 9a–d demonstrate marked spatial disparities. The Walk Score for adolescents Figure 9a shows a relatively even distribution, with walk-friendly areas mainly concentrated in the community’s center and gradually diminishing toward the outskirts. The young adult group Figure 9b shows a similar spatial distribution trend, but compared to adolescents, the areas with higher Walk Scores are more concentrated, particularly in the central areas. The middle-aged group Figure 9c has a slightly uneven distribution, especially in peripheral areas, where Walk Scores are lower, indicating limitations in walkability in these regions. The Walk Score distribution for the elderly group Figure 9d is the most uneven, with higher Walk Scores appearing only in certain parts of the community. Table 5 illustrates the distribution of walkability index in Maple Community.
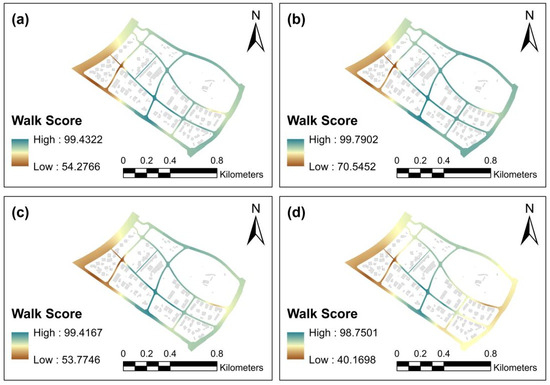
Figure 9.
Accessibility map of embedded service facilities: (a) walkability index for adolescents, (b) walkability index for young adults, (c) walkability index for middle-aged adults, (d) walkability index for the elderly.
Table 5.
Distribution of walkability index in Maple Community.
Further analysis of the Walk Score distribution within the Maple Community reveals significant differences across age groups. In the overall map, the Walk Scores for adolescents are generally higher, with areas in the 50 to 69 range comprising 6.05%, 70 to 89 range comprising 53.38%, and 90 to 100 range comprising 40.57%. This distribution indicates that adolescents have good walkability in most areas of the community. In contrast, the young adult group shows overall higher Walk Scores, with 24.6% in the 70 to 89 range and 75.4% in the 90 to 100 range. This distribution highlights the broader walk-friendly areas available to young adults within the community. The middle-aged group has a slightly more dispersed Walk Score distribution, while the elderly group shows substantial variation in Walk Scores, with only 1.32% in the 25 to 49 range, 32.63% in the 50 to 69 range, 58.35% in the 70 to 89 range, and just 7.71% in the 90 to 100 range. These data indicate that the elderly group faces significant walkability limitations, especially in areas with low Walk Scores. Therefore, analyzing these distributions helps to better understand the walkability disparities across age groups and provides guidance for future community optimization efforts.
In conclusion, there are significant differences in walkability across age groups within the Maple Community. Adolescents and young adults enjoy better walkability, especially in the central areas, while middle-aged adults and the elderly experience greater differences in walkability, particularly in peripheral areas where the Walk Scores are lower. These disparities reflect imbalances in road design, facility distribution, and accessibility, with the elderly group exhibiting the weakest walk-friendly environments. Future efforts to optimize road design and improve facility layouts, particularly in peripheral areas, could further enhance the community’s walkability and provide a more equitable walking environment for all age groups.
4. Discussion
4.1. The Impact of the Distribution of Embedded Service Facilities on Walkability in Age-Friendly Communities
While previous studies emphasize the critical role of service distribution in enhancing walkability [47], the specific impacts of different layouts of embedded service facilities on age-friendly communities remain underexplored. This study argues that optimizing the layout of embedded service facilities will substantially improve walkability for elderly and child populations within the community, a factor crucial to the development of age-friendly communities. Case studies from other cities further validate the conclusions drawn from this study. For example, a study in Bogotá [48] highlighted the positive effect of park spaces and street safety on elderly walking habits, which is consistent with the findings observed in the Maple Community. Research from Germany [49] indicates that traffic safety and pedestrian friendliness are key motivators for elderly walking behavior, with the distribution of embedded service facilities potentially influencing these motivational factors. These findings are consistent with the results of this study. Based on a multidimensional analysis, it can be inferred that these cases underscore the importance of creating environments that promote walking in age-friendly communities, particularly in areas with vulnerable populations, such as the elderly.
The findings of the study on the Maple Community clearly show that the spatial arrangement of embedded service facilities has a significant influence on the walkability of the community, especially regarding the observed disparities among different age groups. Areas with a higher population of elderly residents show a greater demand for services such as elderly care and healthcare, whereas regions with a higher concentration of children exhibit a stronger need for childcare and recreational facilities. The preferences for different facilities are also shaped by varying family sizes and characteristics. Modifications in accessibility indices highlight the disparities in how various age groups engage with embedded service facilities. These findings emphasize the critical role of a rational layout of embedded service facilities, particularly healthcare, childcare, and recreational facilities, as essential contributors to enhancing walkability and accessibility for all community members. Moreover, this study introduces the “Walkability Heaven” rating as a key benchmark for assessing walkability within the Maple Community. Relevant studies have established a correlation between walkability indices and health outcomes within the region. Walking not only reduces the incidence of common chronic diseases [50] but also offers valuable insights into designing pedestrian-oriented communities.
4.2. Optimization Suggestions for Embedded Service Facilities
Although progress has been made in updating embedded service facilities in the Maple Community, challenges persist in aligning the diverse needs of various community groups, particularly across different age demographics. Therefore, the full potential of embedded service facilities must be further examined to optimize walkability within age-friendly communities. While previous studies emphasize the importance of service distribution in enhancing walkability [42,49], there remains insufficient focus on the equitable distribution of embedded service facilities and the development of strategies for optimizing their layouts. This study asserts that optimizing the layout of embedded facilities will significantly improve walkability within the community, particularly in addressing the unique needs of vulnerable groups, such as the elderly and children.
To better address the needs of various groups within the community, future planning should prioritize optimizing the spatial distribution of embedded service facilities to ensure both fairness and accessibility. For instance, spatial analysis techniques could be employed to identify areas with low accessibility, facilitating the strategic placement or renovation of facilities to ensure a balanced distribution across various functional embedded services. This approach would not only contribute to creating a “15-minute living circle,” where essential services are within walking distance, but also substantially improve the overall quality of life in the community, thereby fostering the development of an age-friendly environment.
Real-time data from smart city technologies or mobile applications could enable urban planners to precisely monitor the usage of community embedded service facilities and adjust their distribution based on demographic needs, particularly in areas with larger elderly populations. Such approaches have already been successfully implemented in cities like Shanghai [51], where data-driven decision making has been instrumental in refining urban policies and services. Moreover, related studies have utilized a variety of innovative methods, including Google Street View maps, field surveys, and map evaluations, to assess the impact of walkable environments on physical activity [52].
Based on these findings, this paper offers the following practical planning and policy recommendations: First, enhance embedded facility provision. In the context of aging-community renewal, priority should be given to filling critical service gaps. Second, optimize the spatial distribution of facilities. Using spatial analysis to identify areas with low accessibility, service facilities should be strategically sited or retrofitted to ensure balanced spatial coverage of different functional types within the community. This supports the formation of “15-minute neighborhoods” with walkable access to daily services. Third, promote multistakeholder cooperation and functional integration. Government agencies should establish incentive policies to encourage participation from private and nonprofit sectors in the operation and management of embedded community service facilities. Collaborative models involving public, private, and social actors can improve long-term sustainability. Within the limited space of existing communities, integrated “one-stop” service models that combine elderly care, childcare, healthcare, and cultural activities should be adopted to improve spatial efficiency and service synergies.
Specifically, for the research area, a short-term, medium-term, and long-term facility service capacity enhancement plan can be implemented. In the short term, planners can design multigenerational facilities at major locations within the community, such as activity centers or sports fields, to meet the needs of all age groups in one place. In the mid-term stage, one comprehensive service center can be built, including public activity spaces such as intergenerational activity rooms. Urban planners can optimize the accessibility facilities of the main walking paths and ensure that community service facilities can cover 80% of residents within a 15 min walking distance. Finally, through the smart city platform, real-time monitoring of facility usage rates, dynamic adjustment of service types and spatial distribution, and accurate matching that is age-friendly can be achieved. Over time, the population structure within the community may change, and dynamic adjustments to facilities can adapt the functionality of these spaces to changes in population.
While prior research has identified correlations between walkability and factors such as traffic safety [53] and recreational facilities [54], the interactions between these factors in age-friendly communities remain underexplored. This study focuses on the Maple Community, yet cross-regional and cross-cultural studies could offer valuable comparisons across different geographic areas, providing insights into urban planning and community governance practices that address the needs of diverse populations. Future research should place a stronger emphasis on the equitable distribution of embedded service facilities, particularly for vulnerable groups such as the elderly and children, and strengthen efforts to plan and develop walkable infrastructure.
4.3. Research Innovations and Outlook
Compared to related research, this study has the following innovations:
- We proposed a walkability calculation method for embedded community service facilities from an age-friendly perspective. Empirical research was conducted through spatial accessibility calculations and questionnaire surveys.
- We proposed a distance attenuation function for community service facilities targeting different groups of people. Most previous studies have used a single function to calculate the decline in attractiveness of service facilities, while ignoring the heterogeneity of users. This study takes this factor into consideration.
- A comprehensive evaluation system for walkability was constructed by combining accessibility theory with usability theory.
On the other hand, this study has certain limitations. While the selected case community is representative to some extent, the sample size remains limited, and the generalizability of the findings to other urban contexts requires further validation. The walkability index used in this study primarily focuses on objective factors such as geographic distance, without incorporating subjective elements such as slope, physical barriers, or neighborhood safety—factors that may affect the walking experience of different age groups. This study used the Maple community as a case study. Given its relatively new development and its inclusion in the national inventory only a year ago, its rootedness and social connections may have an impact on the mobility patterns of older residents. Therefore, more case studies need to be included to increase the generalizability of the study.
Additionally, the research is mainly centered on spatial accessibility, without delving into service quality or user preferences. Future research could expand in the following directions:
- Conduct comparative analyses across more cities and communities to test the universality of the evaluation framework and develop context-specific optimization strategies.
- Integrate dynamic datasets such as real-time population flows and big data to assess the temporal efficiency and supply–demand balance of facilities, enabling more adaptive planning approaches.
- Enrich the evaluation index system by including indicators such as walking environment quality, user satisfaction, and intergenerational interaction benefits, thus providing a more comprehensive quantification of age-friendly community characteristics. Through continued empirical research and refinement of evaluation metrics, this line of inquiry can contribute to a deeper understanding of how embedded community service facilities function under aging pressures, offering robust theoretical support and policy insights for urban renewal practices.
- This study reveals the long-term constraints of early planning on the older population but does not delve into the causal relationship between social cohesion and facility accessibility. In the future, it is necessary to combine longitudinal data to analyze how embedded facility renewal can incrementally improve older residents’ social networks and sense of belonging to the community.
5. Conclusions
The results of this study suggest that the Maple Community was built in the early stages of 2011–2015, with public facilities configured without sufficient consideration of the differentiated needs of the older population, resulting in limited walking activities and low social participation. While the embedded facilities renewal initiated in 2021 significantly improved accessibility to the core area, early planning deficiencies in the peripheral areas still pose challenges to the social cohesion and daily mobility of older residents. Questionnaire data shows that older residents’ satisfaction with walking to community healthcare facilities increased from 42% to 68% after the update, but 31% of respondents in the outlying areas still report safety concerns for nighttime travel due to the slope of the roads and inadequate lighting. While the buildings as well as the infrastructure of the Maple Community have been established, there is still a need for further optimization in terms of what an embedded community should achieve.
This study investigated the walkability of embedded community service facilities from an age-friendly perspective. The main conclusions are as follows: First, in terms of the classification and weighting of embedded facilities, the study systematically identified key facility types in the community. Through questionnaire surveys, it established a weighting system based on the perceived importance of each facility type in meeting the needs of all age groups, with particular emphasis on services for the elderly and children. Second, regarding the calculation of the walkability index, the results show that the overall level of facility accessibility in the case community is moderate, with notable mismatches between the distribution of facilities and the spatial distribution of residents. Third, the spatial suitability of facility layouts from different age group perspectives reveals that while children are relatively well served by the existing facilities, the needs of older adults—particularly high-aged seniors—are not sufficiently addressed. Differences in mobility patterns and activity spaces between children and older adults led to significant disparities in the walkability index values between these two groups.
Author Contributions
Conceptualization, R.L.; methodology, R.L.; software, R.L.; validation, R.L., Y.W., R.W. and J.Y.; formal analysis, R.L.; investigation, R.L., X.C. and B.L.; resources, R.L. and Y.W.; data curation, R.L.; writing—original draft, R.L. and Y.W.; writing—review and editing, R.L.; visualization, R.L. and Y.W.; supervision, R.L., Y.W., R.W. and J.Y.; project administration, Y.W., R.W. and J.Y.; funding acquisition, J.Y. All authors have read and agreed to the published version of the manuscript.
Funding
This research was funded by the Central Universities Science and Technology Innovation Project (Grant Number: 2682024CX069) and the Sichuan Science and Technology Program Key Research and Development Project (Grant Number: 2024YFFK0441).
Institutional Review Board Statement
According to the guidelines of the authors’ institutions, ethical approval was not required for this study, as it involved anonymous and voluntary survey responses with no collection of identifiable or sensitive personal data.
Data Availability Statement
The data that support the findings of this study are available from the corresponding author upon reasonable request. The data are not publicly available due to privacy and anonymity.
Acknowledgments
We would like to express our respect and gratitude to the anonymous reviewers and editors for their professional comments and suggestions.
Conflicts of Interest
The authors declare no conflicts of interest.
References
- Gu, C. Urbanization: Processes and Driving Forces. Sci. China Earth Sci. 2019, 62, 1351–1360. [Google Scholar] [CrossRef]
- Mahtta, R.; Fragkias, M.; Gueneralp, B.; Mahendra, A.; Reba, M.; Wentz, E.A.; Seto, K.C. Urban Land Expansion: The Role of Population and Economic Growth for 300+ Cities. npj Urban Sustain. 2022, 2, 5. [Google Scholar] [CrossRef]
- United Nations. World Urbanization Prospects; United Nations Department of Economic and Social Affairs: New York, NY, USA, 2018; Available online: https://population.un.org/wup/publications (accessed on 1 August 2024).
- Gu, C. China’s Urbanization Process. In China’s Urbanization; Springer: Singapore, 2024. [Google Scholar] [CrossRef]
- National Bureau of Statistics of China. Statistical Communiqué of the People’s Republic of China on the 2023 National Economic and Social Development. 2024. Available online: https://www.stats.gov.cn/english/PressRelease/202402/t20240228_1947918.html (accessed on 4 December 2024).
- Yao, Z.; Li, H. The Research Framework and Planning Response for All-Age Friendly Neighborhood Renewal. Plan. Rev. 2024, 1, 34–41. [Google Scholar]
- Huang, Z.; Yuan, Y. Research on Spatial Translation and Design Strategy of All-Age Friendly Neighborhood Center. Urban. Archit. 2024, 8, 32–35, 40. [Google Scholar]
- Li, X.Y. Inclusive Design: Public Space Renewal Strategy for the Targets of Community for All Ages. Urban Dev. Stud. 2019, 26, 27–31. [Google Scholar]
- Harding, E. Towards Lifetime Neighbourhoods: Designing Sustainable Communities for All; International Longevity Centre UK: London, UK, 2007. [Google Scholar]
- Zhang, L.; Ye, Z. All-Age Regeneration Strategy of Existing Residential Areas Based on the Compound Feature of the Aged and the Young. Urban Dev. Stud. 2020, 27, 109–115. [Google Scholar]
- Tong, P.; Nie, T. Research on the Micro-Renewal Strategy of Outdoor Public Space in Old Urban Communities under the Lifetime Friendly: Taking Lingxian Road Community of Qingdao as an Example. Archit. Cult. 2022, 2, 93–96. [Google Scholar] [CrossRef]
- Obe, B.A. Lifetime Homes, Lifetime Neighbourhoods-Developing a Housing Strategy for Our Ageing Population. Policy Politics 2008, 36, 605–610. [Google Scholar] [CrossRef]
- Friedman, D.; Parikh, N.S.; Giunta, N.; Fahs, M.C.; Gallo, W.T. The Influence of Neighborhood Factors on the Quality of Life of Older Adults Attending New York City Senior Centers: Results from the Health Indicators Project. Qual. Life Res. 2012, 21, 123–131. [Google Scholar] [CrossRef]
- White, S.; Hammond, M. From Representation to Active Ageing in a Manchester Neighbourhood: Designing the Age-Friendly City. In Age-Friendly Cities and Communities; Policy Press: Bristol, UK, 2018. [Google Scholar] [CrossRef]
- Murtagh, B.; Ferguson, S.; Lyne Cleland, C.; Ellis, G.; Hunter, R.; Kou, R.; Rodriguez Añez, C.; Hino, A.A.F.; Becker, L.A.; Reis, R.S. Planning for an Ageing City: Place, Older People and Urban Restructuring. Cities Health 2021, 6, 375–388. [Google Scholar] [CrossRef]
- Buffel, T.; Rémillard-Boilard, S.; Walsh, K.; McDonald, B.; Smetcoren, A.S.; De Donder, L. Age-Friendly Approaches and Old-Age Exclusion: A Cross-City Analysis. Int. J. Ageing Later Life 2020, 14, 89–117. [Google Scholar] [CrossRef]
- National Development and Reform Commission; Ministry of Housing and Urban-Rural Development; Ministry of Natural Resources. Notice on the Issuance of the Guidelines for the Construction of Community Embedded Service Facilities (Trial)—Reform and Development Society [2024] No. 5. Nat. Resour. Commun. 2024, 2, 46–52, 55. [Google Scholar] [CrossRef]
- Hangzhou Development and Reform Commission. Policy Interpretation of the Implementation Plan for the Construction of Community Embedded Service Facilities in Hangzhou. Available online: https://www.hangzhou.gov.cn/art/2024/3/12/art_1229063385_1841171.html (accessed on 15 April 2025).
- General Office of the State Council of the People’s Republic of China. Notice by the General Office of the State Council of Forwarding the Plan of the National Development and Reform Commission for Implementing the Project to Construct Embedded Service Facilities in Urban Communities. Nat. Resour. Commun. 2023, 22, 5–8. [Google Scholar] [CrossRef]
- Wang, S.; Wang, Q.; Meng, C.; Gai, Y. Exploring the Connotation and Pathway of Better Community, from a Standardization Perspective: A Case Study of a Community in Jinan. Chin. Overseas Archit. 2025, 3, 1–6. [Google Scholar] [CrossRef]
- Scharlach, A. Creating aging-friendly communities in the United States. Ageing Int. 2012, 37, 25–38. [Google Scholar] [CrossRef]
- Scharlach, A.; Lehning, A. Creating Aging-Friendly Communities; Oxford University Press: Oxford, UK, 2015. [Google Scholar]
- Kabra, A.; Belavina, E.; Girotra, K. Bike-share systems: Accessibility and availability. Manag. Sci. 2020, 66, 3803–3824. [Google Scholar] [CrossRef]
- Huang, X.; Gong, P.; White, M. Study on Spatial Distribution Equilibrium of Elderly Care Facilities in Downtown Shanghai. Int. J. Environ. Res. Public Health 2022, 19, 7929. [Google Scholar] [CrossRef]
- Kanuganti, S.; Sarkar, A.K.; Singh, A.P. Quantifying Accessibility to Health Care Using Two-Step Floating Catchment Area Method (2SFCA): A Case Study in Rajasthan. Transp. Res. Procedia 2016, 17, 391–399. [Google Scholar] [CrossRef]
- Hu, X.; Wei, Y.; Tang, J. Design Strategy of Friendly and Healthy Environment for Urban Aging Community. IOP Conf. Ser. Earth Environ. Sci. 2020, 598, 012044. [Google Scholar] [CrossRef]
- Forsyth, A.; Molinsky, J.; Kan, H.Y. Improving Housing and Neighborhoods for the Vulnerable: Older People, Small Households, Urban Design, and Planning. Urban Des. Int. 2019, 24, 171–186. [Google Scholar] [CrossRef]
- Boavida, J.; Ayanoglu, H.; Pereira, C.V.; Hernandez-Ramirez, R. Active Aging and Smart Public Parks. Geriatrics 2023, 8, 94. [Google Scholar] [CrossRef] [PubMed]
- Nelischer, C.; Loukaitou-Sideris, A. Intergenerational Public Space Design and Policy: A Review of the Literature. J. Plan. Lit. 2023, 38, 19–32. [Google Scholar] [CrossRef]
- Sauer, J.; Sonderegger, A.; Schmutz, S. Usability, user experience and accessibility: Towards an integrative model. Ergonomics 2020, 63, 1207–1220. [Google Scholar] [CrossRef]
- Ferreira, J.M.; Acuña, S.T.; Dieste, O.; Vegas, S.; Santos, A.; Rodríguez, F.; Juristo, N. Impact of usability mechanisms: An experiment on efficiency, effectiveness and user satisfaction. Inform. Softw. Tech. 2020, 117, 106195. [Google Scholar] [CrossRef]
- Lavy, S.; Garcia, J.A.; Dixit, M. KPIs for facility’s performance assessment, Part I: Identification and categorization of core indicators. Facilities 2014, 32, 256–274. [Google Scholar] [CrossRef]
- Cui, X.; Ma, L.; Tao, T.; Zhang, W. Do the supply of and demand for rural public service facilities match? Assessment based on the perspective of rural residents. Sustain. Cities Soc. 2022, 82, 103905. [Google Scholar] [CrossRef]
- Cao, Y.; Guo, Y.; Zhang, M. Research on the equity of urban green park space layout based on Ga2SFCA optimization method—Taking the core area of Beijing as an example. Land 2022, 11, 1323. [Google Scholar] [CrossRef]
- He, H.; Rong, S.; Zhang, T. All-Age-Friendly Urban Environment Research Progress and Future Trends. New Archit. 2024, 4, 103–109. [Google Scholar] [CrossRef]
- Zou, S.; Zhang, S.; Zhen, F.; Li, Z. Evaluation and Optimization of Public Service Facilities in Community Life Circle under the All-Age-Friendly Concept. J. Urban Reg. Plan. 2023, 15, 143–163. [Google Scholar]
- Zhong, J.; Yi, F.; He, Z.; Cheng, G.; Huang, D. Research on Allocation of Community Service Facilities Based on Evaluation of Individual Accessibility of Vulnerable People. J. Geo-Inf. Sci. 2022, 24, 875–888. [Google Scholar] [CrossRef]
- Woo, J. Designing Fit for Purpose Health and Social Services for Ageing Populations. Int. J. Environ. Res. Public Health 2017, 14, 457. [Google Scholar] [CrossRef] [PubMed]
- Xiao, Y.; Piao, Y.; Pan, C.; Lee, D.; Zhao, B. Using buffer analysis to determine urban park cooling intensity: Five estimation methods for Nanjing, China. Sci. Total Environ. 2023, 868, 161463. [Google Scholar] [CrossRef] [PubMed]
- Lim, K.H.; Chan, J.; Leckie, C.; Karunasekera, S. Personalized trip recommendation for tourists based on user interests, points of interest visit durations and visit recency. Knowl. Inf. Syst. 2018, 54, 375–406. [Google Scholar] [CrossRef]
- Pinto, L.; Ferreira, C.S.; Pereira, P. Environmental and socioeconomic factors influencing the use of urban green spaces in Coimbra (Portugal). Sci. Total Environ. 2021, 792, 148293. [Google Scholar] [CrossRef]
- Zhang, Z.; Fisher, T.; Wang, H. Walk Score, Environmental Quality and Walking in a Campus Setting. Land 2023, 12, 732. [Google Scholar] [CrossRef]
- Zhang, Z.; Fisher, T.; Feng, G. Assessing the rationality and walkability of campus layouts. Sustainability 2020, 12, 10116. [Google Scholar] [CrossRef]
- Sun, J.X.; Zheng, W.M. Study on Accessibility of Public Service Facilities in All-Age-Friendly Communities Based on Walkability Index. Geogr. Res. 2024, 13, 198–210. [Google Scholar]
- Yang, G.Y. Study on Influencing Factors and Application of Urban Comfortable Walking System. Master’s Thesis, South China University of Technology, Guangzhou, China, 2012. [Google Scholar]
- Huang, J.Z.; Hu, G.Y.; Li, M. Suitability Study on Community Service Facility Layout from an Elderly Perspective: Based on Walkability Index Method. Urban Plan. Forum 2016, 6, 45–53. [Google Scholar]
- Mitra, R.; Siva, H.; Kehler, M. Walk-Friendly Suburbs for Older Adults? Exploring the Enablers and Barriers to Walking in a Large Suburban Municipality in Canada. J. Aging Stud. 2015, 35, 10–19. [Google Scholar] [CrossRef]
- Gomez, L.F.; Parra, D.C.; Buchner, D.; Brownson, R.C.; Sarmiento, O.L.; Pinzon, J.D.; Ardila, M.; Moreno, J.; Serrato, M.; Lobelo, F. Built Environment Attributes and Walking Patterns among the Elderly Population in Bogotá. Am. J. Prev. Med. 2010, 38, 592–599. [Google Scholar] [CrossRef]
- Kahlert, D.; Schlicht, W. Older People’s Perceptions of Pedestrian Friendliness and Traffic Safety: An Experiment Using Computer-Simulated Walking Environments. Int. J. Environ. Res. Public Health 2015, 12, 10066–10078. [Google Scholar] [CrossRef] [PubMed]
- Frank, L.D.; Sallis, J.F.; Conway, T.L.; Chapman, J.E.; Saelens, B.E.; Bachman, W. Many Pathways from Land Use to Health: Associations between Neighborhood Walkability and Active Transportation, Body Mass Index, and Air Quality. J. Am. Plan. Assoc. 2006, 72, 75–87. [Google Scholar] [CrossRef]
- Zhang, Z.; Wang, H.; Pang, L.; Fisher, T.; Yang, S. Comparisons of Built Environment Correlates of Walking in Urban and Suburban Campuses: A Case Study of Tianjin, China. Land 2023, 12, 1972. [Google Scholar] [CrossRef]
- Wei, Z.; Cao, K.; Kwan, M.-P.; Jiang, Y.; Feng, Q. Measuring the Age-Friendliness of Streets’ Walking Environment Using Multi-Source Big Data: A Case Study in Shanghai, China. Cities 2024, 148, 104829. [Google Scholar] [CrossRef]
- Chiang, Y.-C.; Sullivan, W.; Larsen, L. Measuring Neighborhood Walkable Environments: A Comparison of Three Approaches. Int. J. Environ. Res. Public Health 2017, 14, 593. [Google Scholar] [CrossRef]
- Lee, M.; Lee, H.; Hwang, S.; Choi, M. Understanding the Impact of the Walking Environment on Pedestrian Perception and Comprehension of the Situation. J. Transp. Health 2021, 23, 101267. [Google Scholar] [CrossRef]
Disclaimer/Publisher’s Note: The statements, opinions and data contained in all publications are solely those of the individual author(s) and contributor(s) and not of MDPI and/or the editor(s). MDPI and/or the editor(s) disclaim responsibility for any injury to people or property resulting from any ideas, methods, instructions or products referred to in the content. |
© 2025 by the authors. Licensee MDPI, Basel, Switzerland. This article is an open access article distributed under the terms and conditions of the Creative Commons Attribution (CC BY) license (https://creativecommons.org/licenses/by/4.0/).