Article

Distribution Characteristics of Soil Organic Carbon and Active Carbon Components in the Peat Swamp Wetlands of the Altai Mountains, China

1
College of Geographic Science and Tourism, Xinjiang Normal University, Urumqi 830054, China
2
Key Laboratory of Xinjiang Uygur Autonomous Region, Xinjiang Laboratory of Lake Environment and Resources in Arid Area, Urumqi 830054, China
*
Author to whom correspondence should be addressed.
Land 2025, 14(4), 670; https://doi.org/10.3390/land14040670
Submission received: 21 February 2025 / Revised: 10 March 2025 / Accepted: 14 March 2025 / Published: 22 March 2025

Abstract

:
Peat swamp wetlands, crucial carbon pools in terrestrial ecosystems, significantly impact regional carbon cycling and climate change. In this study, the peat swamp wetland in the Altay Mountains was selected as the research object. In July 2023, soil samples were collected in situ from a depth of 0–80 cm of the peat swamp wetland. Subsequently, the contents of soil organic carbon (SOC), dissolved organic carbon (DOC), particulate organic carbon (POC), and the physicochemical properties of the soil samples were determined. The distribution characteristics of soil organic carbon and its active carbon fractions at different soil depths and their influencing factors were investigated. The results demonstrate that (1) SOC, POC, and DOC concentrations were significantly higher in subsurface layers (20–80 cm) than in those of surface layers (0–20 cm), with SOC and POC peaking at 20–40 cm and DOC predominantly accumulating at 40–80 cm. (2) The concentrations of SOC, POC, and DOC reached minima at 0–10 cm, accounting for 17.25%, 16.91%, and 6.46% of the total 0–80 cm profile, respectively. POC represented 76.46% of SOC throughout the profile. (3) Available phosphorus (AP), total nitrogen (TN), ammonium nitrogen (NH4+N), and soil moisture (SM) accounted for an average of 68.94% of the variation in soil organic carbon and active carbon fractions at a depth of 0–80 cm. Higher levels of soil moisture and total nitrogen content emerged as the primary factors responsible for the reduction in soil organic carbon and active carbon fractions. In shallow soils (0–20 cm), an increase in the content of available phosphorus and ammonium nitrogen contributed to a decline in the soil’s active carbon fraction. Conversely, the situation was reversed in deeper soils. This study thus offers scientific insights into alpine peat bog wetland soil carbon dynamics and environmental responses.

1. Introduction

Peat swamp wetlands are a transition zone connecting the carbon cycling in terrestrial and aquatic ecosystems [1]. Peatland ecosystems, while occupying a mere 3% of terrestrial land surfaces, contain 30% of the pedospheric carbon pool [2], constituting a pivotal terrestrial carbon reservoir in the Earth system’s carbon cycling. Peatland pedologic carbon reservoirs exhibit acute sensitivity to climatic perturbations [3], rendering these wetland systems critical for terrestrial biosphere stabilization and planetary climate regulation [4]. Labile organic carbon (LOC) within soil organic carbon (SOC) is more sensitive to changes in external environmental factors due to its higher biodegradability and reactivity. It can directly participate in the internal biochemical cycle of the soil, which is of great significance for regulating the soil carbon cycle and revealing the evolution pattern of the soil carbon pool [5].
Soil organic carbons (SOCs) in peat bog wetlands, and their labile carbon fractions, are highly vulnerable to diverse environmental factors, and the degrees of sensitivity to changes in soil environmental factors vary remarkably. Notably, investigations in Northeast China’s alpine peatlands have documented that, during transitions in hydrologic conditions from anaerobic to aerobic regimes, both microbial communities (bacteria, fungi, actinomycetes) and enzymatic activities (sucrase, cellulase) exhibit marked positive associations with soil labile carbon fractions in these ecosystems. When the hydrological conditions shifted from anaerobic to aerobic conditions, they jointly contributed to the transformation of soil labile carbon fractions [6]. A study on the peat swamp wetlands in Ruoergai, China, revealed that, when the precipitation decreased from 100% of the original amount to 70% and the precipitation frequency remained low, the DOC content in the soil decreased from 499 ± 26.76 μg/g to 397.81 ± 23.04 μg/g [7]. Investigations in Western Sichuan Plateau’s peat swamp wetlands demonstrated markedly elevated soil organic carbon concentrations within the surface horizon (0–10 cm depth) compared to subsurface strata (10–30 cm depth). Furthermore, it exhibited strong negative correlations with edaphic pH and bulk density. Multivariate analysis identified mean annual temperature and soil compaction parameters as dominant environmental regulators of soil organic carbon spatial distribution [8]; A study on the peat swamp wetlands in Gahai, Gannan, China, revealed that vegetation degradation led to a decrease in litter inputs to the soil. The SOC content decreased by 41.9%, with concomitant marked reductions in particulate organic carbon (POC) content within surface soil horizons (0–20 cm depth). Total soil nitrogen coupled with belowground biomass emerged as the primary determinant driving SOC dynamics [9,10]. Investigations in Hudson Bay’s ombrotrophic peatlands demonstrated a progressive latitudinal decline in soil organic carbon density across the Canadian boreal continuum [11]. Investigations across Ireland’s montane and mid-elevation ombrotrophic peatlands revealed that topsoil organic carbon concentrations exhibited a significant positive correlation with elevation, peaking in high-altitude zones. In contrast, the soil organic carbon in low-altitude wetlands in the central region decreased as the altitude increased [12]. In the research on peat bog wetlands in northeastern Germany, it was revealed that greater anthropogenic activities and higher drainage intensity significantly decreased the soil organic carbon content. Moreover, under better-drained conditions, the organic carbon content in reed peat bog wetlands was 20.1% higher than that in sedge peat bog wetlands [13]. Meanwhile, in the study of high-altitude tropical peat bog wetlands in Costa Rica, it was found that a higher precipitation frequency caused the soil DOC content to decrease from 1050 mg/L to 0.15 mg/L [14]. Currently, research on organic carbon and active carbon fractions in peat bog wetlands predominantly focuses on shallow soils in high-altitude or high-latitude regions. There is a scarcity of research on deep soils at high altitudes in mid-latitudes. Moreover, the organic carbon and active carbon fractions of peat bog wetland soils are regulated by diverse environmental factors at different soil depths. Thus, comprehending the response mechanism between soil organic carbon and active carbon fractions in mid-latitude high-altitude peat bog wetlands and environmental factors can offer a theoretical foundation and data support for regional soil carbon cycling and global warming.
The Altai Mountains are both a representative distribution area of alpine peatland ecosystems in northwest China and one of the most climate-sensitive regions globally. The peat bog wetlands are mainly distributed in the alpine tundra at an altitude of 2300 m.a.s.l. With a peat layer nearly 10 m thick, these wetlands are typical perennial permafrost peat bogs [15]. Current research in this region primarily centers on soil organic carbon (SOC) density and storage capacity, whereas the response mechanisms of SOC and its active carbon components to environmental factors remain insufficiently explored. Systematic quantification of soil physicochemical properties, SOC content, and labile carbon fractions (DOC, POC) was conducted across pedogenic horizons (0–80 cm) in the Kharasaz peatland, Altai Mountains. This study investigates (1) the vertical distribution characteristics of soil organic carbon and labile carbon fractions across pedogenic strata in the Altai Mountain’s alpine ombrotrophic peatlands. (2) This study clarifies how soil organic carbon and active carbon components interact with soil properties at varying depths in the Altai Mountains’ alpine peat bog wetlands. This investigation elucidates pedospheric carbon cycling mechanisms in alpine ombrotrophic peatlands, providing critical insights into their C sequestration potential and regional climate adaptation dynamics.

2. Materials and Methods

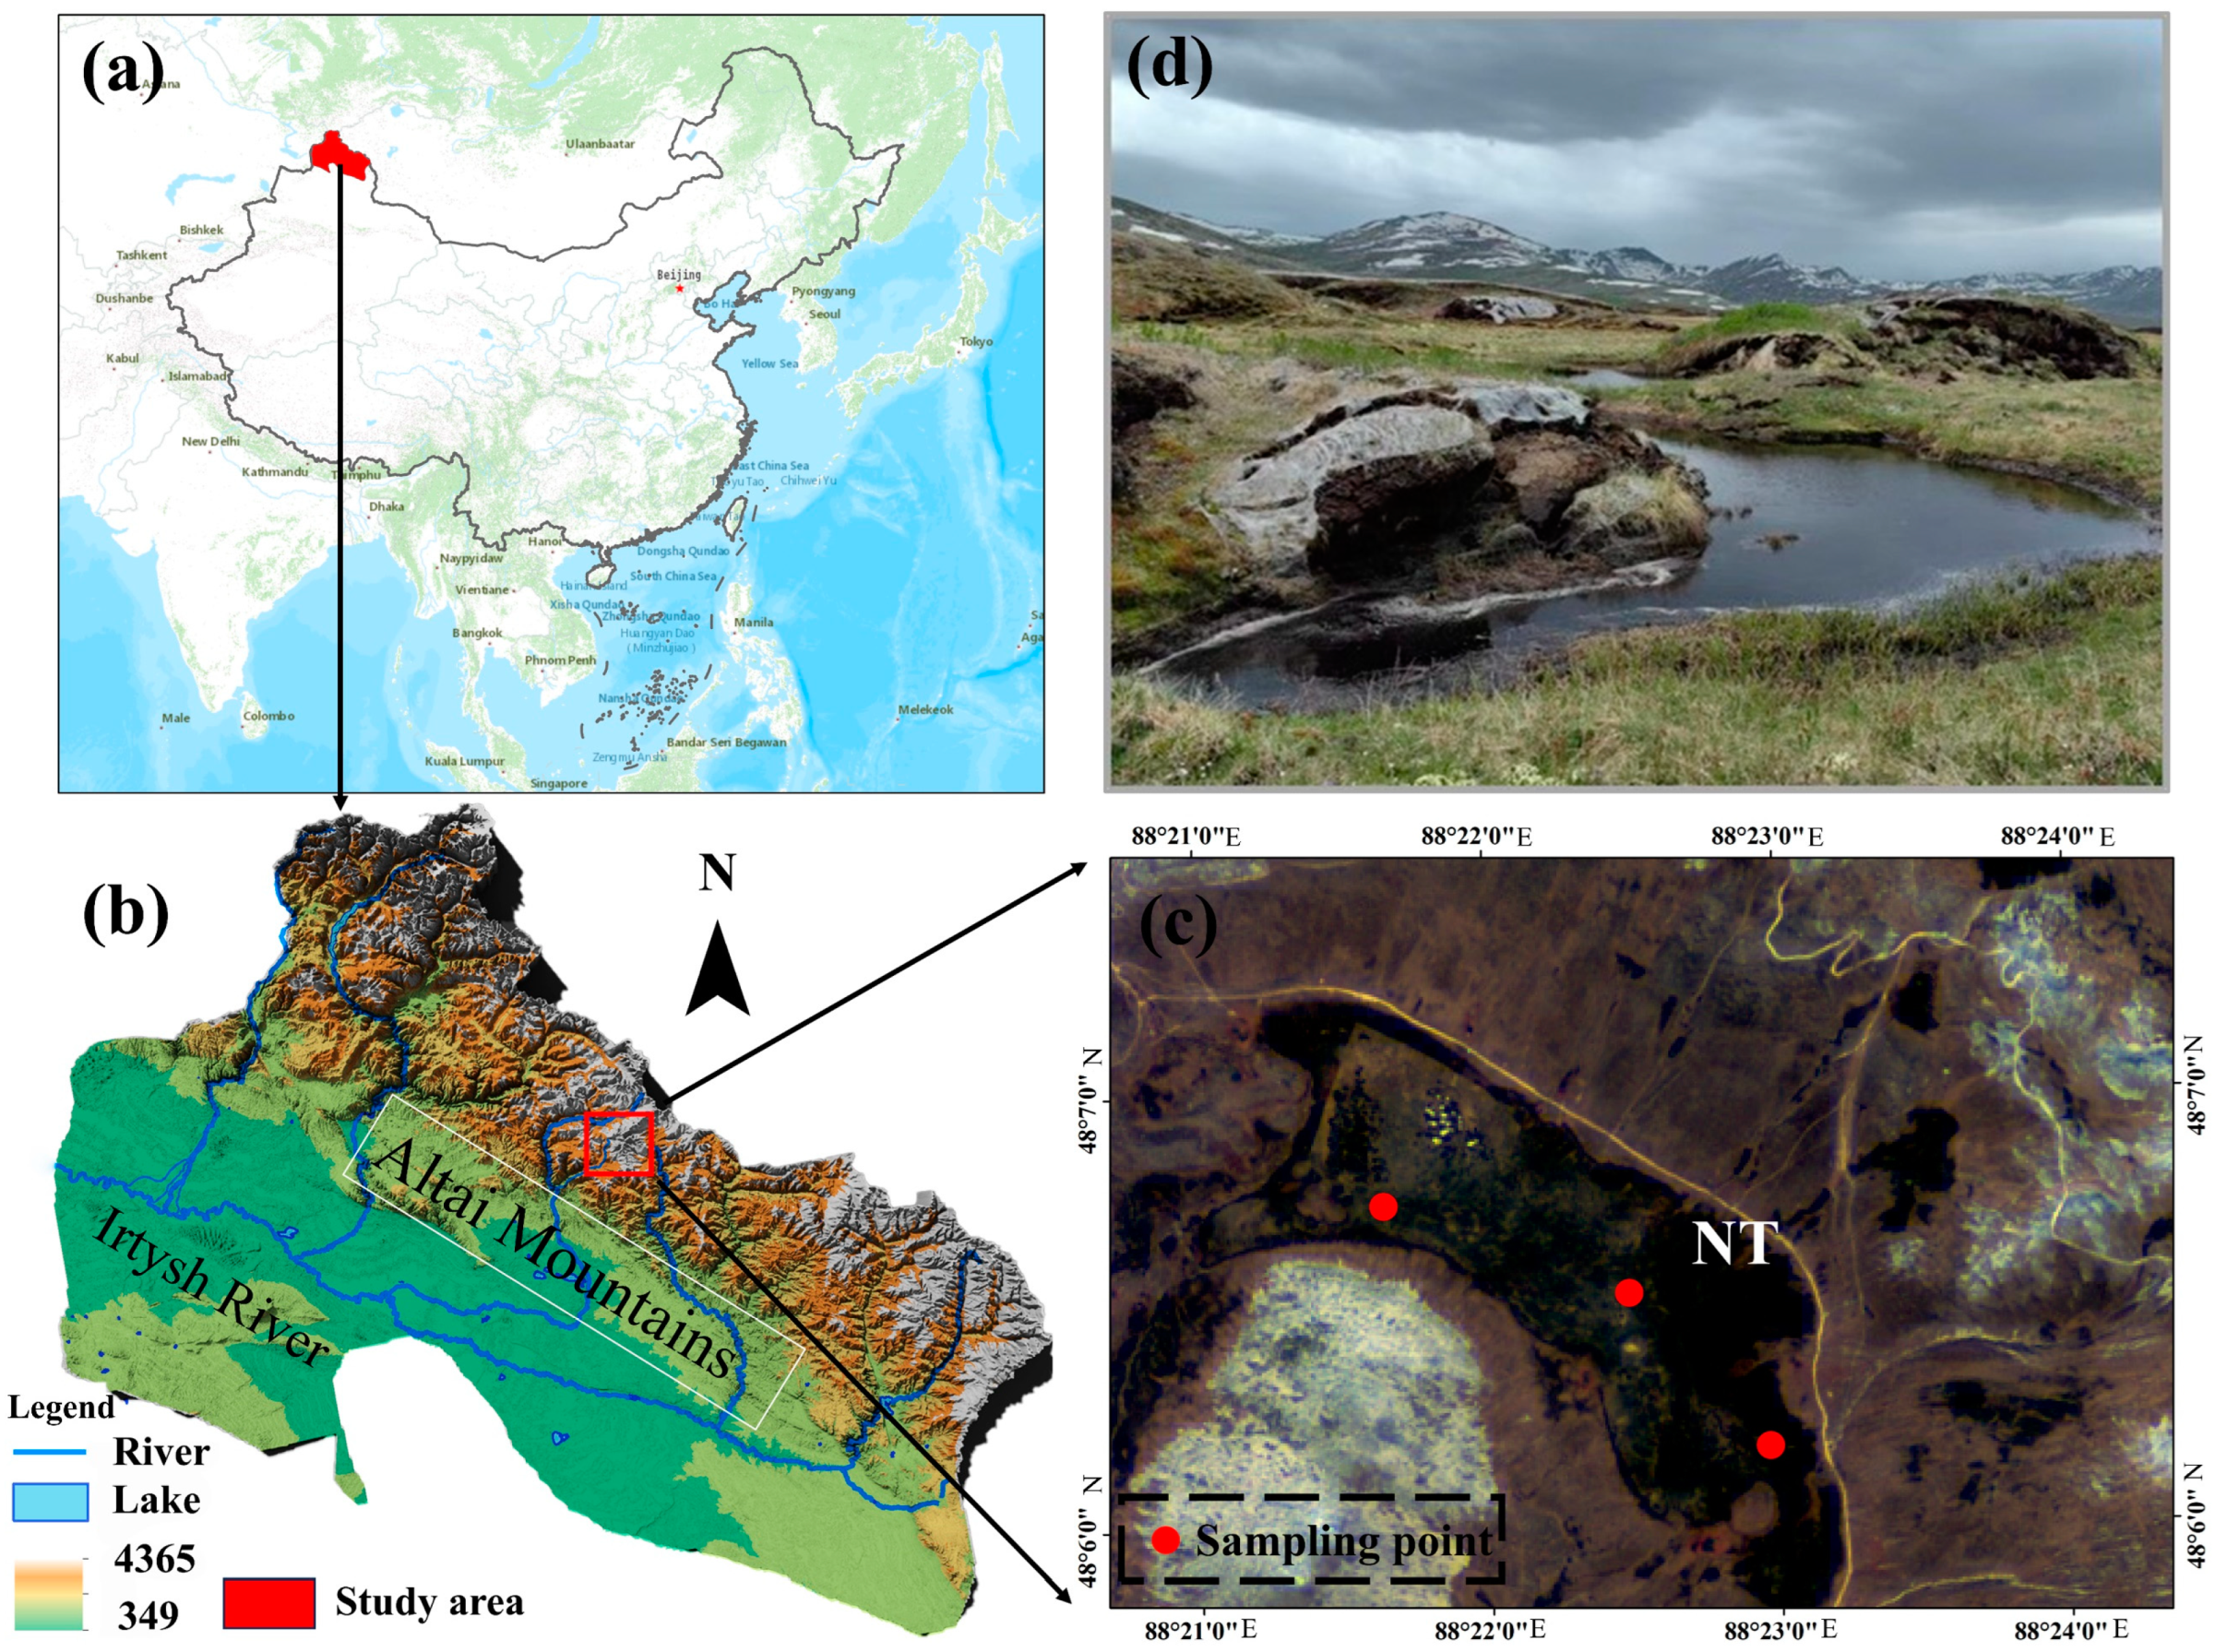
2.1. Site Description

The Harasazi Peat Bog Wetland (48.11° N, 88.36° E) is located on the southern slope of the central Altai Mountains in Xinjiang, China. The mountain range is oriented northwest–southeast, and the wetland is mainly distributed in the swampy depressions between 2400 and 2600 m.a.s.l. The area has a typical temperate continental cold climate, with a short and cool summer and a long and cold winter (lasting more than 200 days). The snow-covered period lasts up to 6 months, with the snow thickness of about 1–2 m. The average annual temperature ranges from −3.6 °C to −1.8 °C [15]; the orographic uplift of moisture-laden westerlies enhances condensation, leading to increased precipitation on windward mountain slopes. The annual precipitation ranges from 400 to 600 mm. The mountainous areas serve as an important headwater region of the Irtysh River. In summer, atmospheric precipitation and snow–ice melt provide sufficient water recharge for the development of the swampy wetland. The widely distributed mountain basins and river valleys cause poor surface drainage, thus providing favorable geological conditions for the development of bog wetlands. Peat bogs account for approximately 35.2% of the area of bog wetlands. The Harasazi peat bog is a typical rain-fed peat bog [1,16]. Atmospheric precipitation and snow–ice meltwater are the main water sources for peat bogs. These peat bogs develop into large complexes of frost-heave mounds (Figure 1). As the altitude increases, the soil type gradually transitions from alpine–subalpine meadow soil to alpine tundra soil. The thickness of the peat layer is approximately 6 m. The peat bog vegetation is dominated by perennial cold-resistant plants such as Carex lasiocarpa, Carex pamirensis, and Herba sphagni.

2.2. Soil Sample Collection

To investigate the carbon dynamics of peat bog soils at different depths, in July 2023, we chose the Harasazi peat bog as the research object and established three 10 m × 10 m sample plots at locations with relatively closed hydrological conditions in the study area (Figure 1). After removing vegetative residues and stones from the topsoil, we used a soil profile collection device (5 cm in diameter and 1.5 m in length) to drill continuous and intact peat soil columns (about 1 m) in three replicates at three sample sites. During soil sampling, a soil temperature sensor (Campbell Scientific, Logan, UT, USA) was employed to measure the soil temperature at five different depths. In the field, a stainless-steel knife was used to cut the peat soil profiles (0–10, 10–20, 20–40, 40–60, and 60–80 cm). Simultaneously, the ring-knife method was employed to collect soil samples from different soil depths in the three sample plots. The collected soil samples were sealed with sealing film and then placed in sealed bags. Laboratory processing involved air-drying, grinding, and sieving to remove roots and stones, enabling subsequent analysis of soil physicochemical properties.

2.3. Measurement and Methodology of Soil Indicators

The soil moisture content (SM) was quantified via the gravimetric method; soil pH was assessed through potentiometric determination at a standardized 1:5 water–soil mass ratio. Available phosphorus (AP) was quantified via molybdenum–antimony spectrophotometric determination. Ammonium nitrogen (NH4+) concentrations were assessed using indophenol blue chromogenic analysis. Nitrate nitrogen (NO3) levels were analyzed through dual-wavelength UV absorption spectroscopy. Total phosphorus (TP) was determined by molybdenum–antimony anti-spectrophotometry (UV-1200 spectrophotometer, Shanghai Metash Instrument Co., Ltd., Shanghai, China). Total nitrogen (TN) was measured via micro-Kjeldahl digestion. The quantification of soil organic carbon (SOC) was achieved through potassium dichromate (K2Cr2O7) oxidation under controlled thermal conditions. Dissolved organic carbon (DOC) was quantified with a TOC/TNb analyzer (multi N/C 2100S, Analytik Jena AG, Jena, Germany), while particulate organic carbon (POC) was fractionated using wet-sieving techniques [17].

2.4. Statistical Analysis

Dataset management and analysis were performed with Microsoft Excel 2016. ANOVA was performed with SPSS Statistics 27. Pearson correlation analysis explored relationships between SOC, DOC, POC, and soil physicochemical properties. The impacts of environmental factors on SOC, DOC, and POC were quantified and visualized via Origin 2019b. Redundancy analysis was conducted using Canoco 5.0.

3. Result

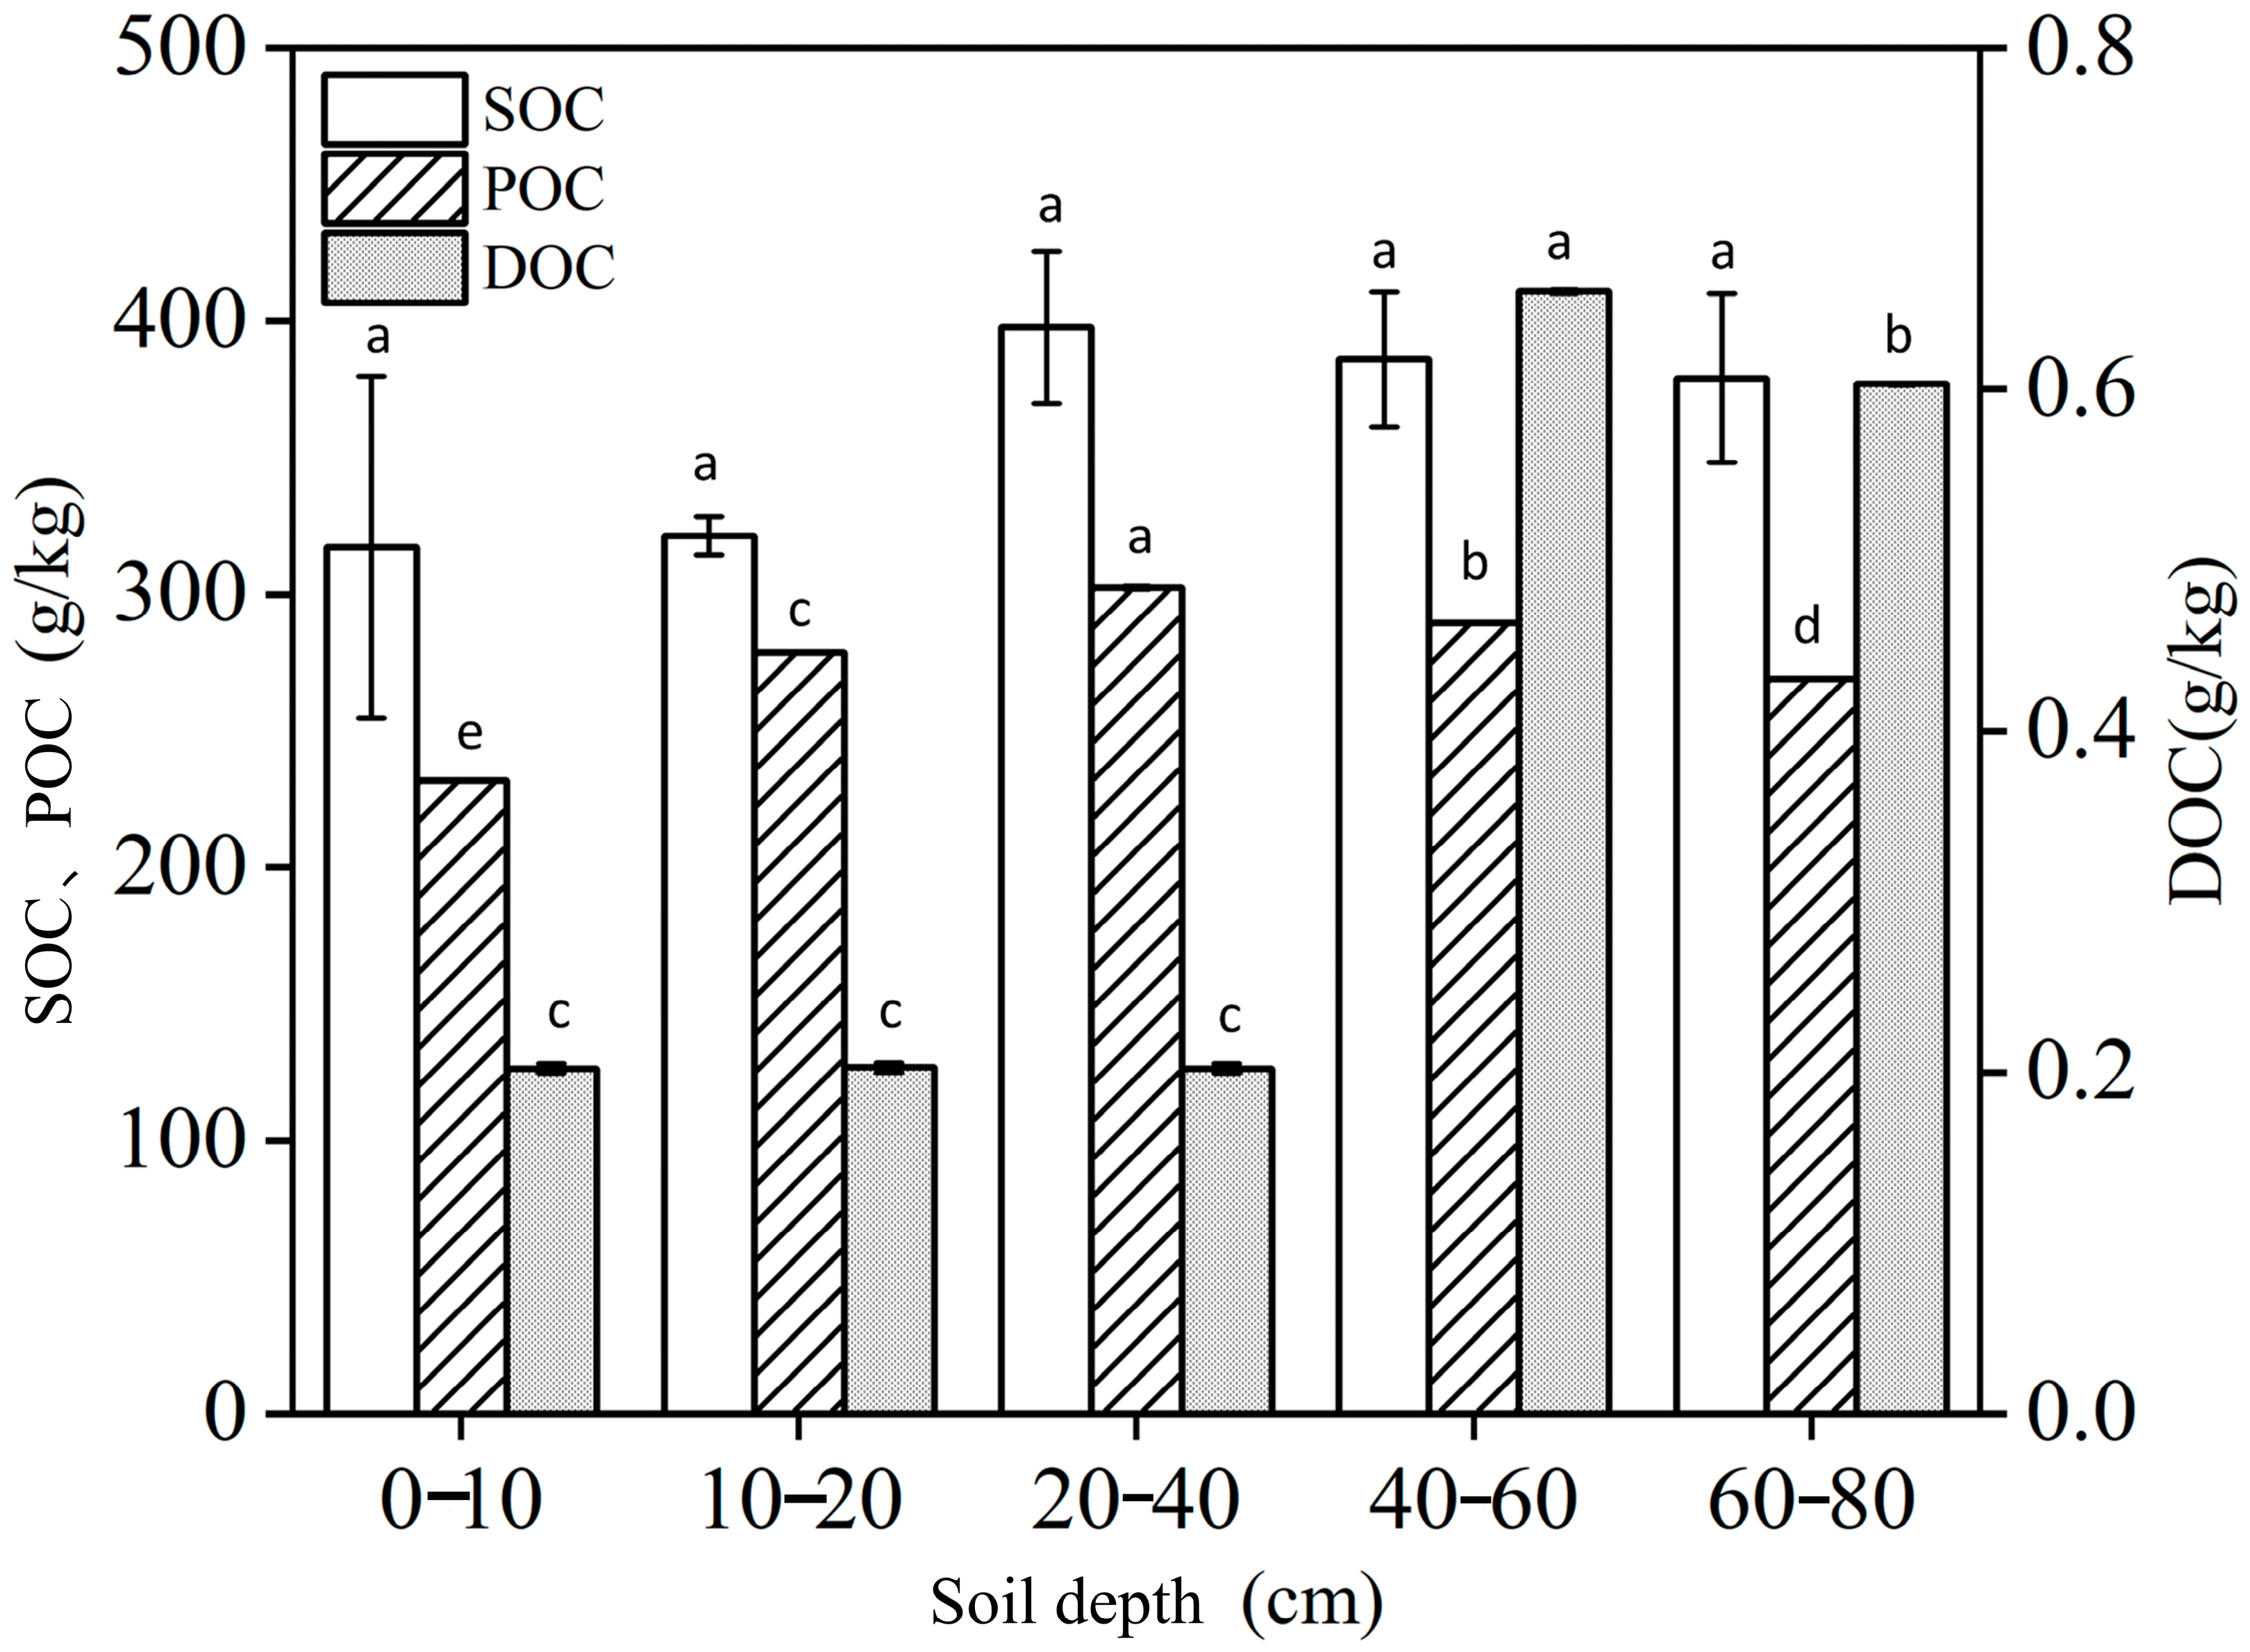
3.1. Distribution Characteristics of SOC, POC, and DOC in Soil Profiles at Different Depths

Figure 2 shows that SOC, particulate organic carbon (POC), and dissolved organic carbon (DOC) concentrations in surface soil layers (0–20 cm) were lower than in subsurface horizons (20–80 cm). No significant differences in SOC content were observed among soil depths (p > 0.05), but subsurface layers (20–80 cm) had higher SOC concentrations than surface layers (0–20 cm). In the 0–80 cm soil profile, the average SOC content ranked as follows: 20–40 cm (397.64 g·kg−1) > 40–60 cm (386.00 g·kg−1) > 60–80 cm (379.18 g·kg−1) > 10–20 cm (321.38 g·kg−1) > 0–10 cm (309.47 g·kg−1). The highest SOC content (383.44 g·kg−1) occurred at 20–40 cm depth, which was 20.21% higher than that at 0–10 cm depth.
The POC content exhibited a similar trend to the SOC content across different soil layers, with the POC content in deeper soils (20–80 cm) being significantly higher than that in shallower soils (0–20 cm). Within the 0–80 cm soil profile, particulate organic carbon (POC) concentrations exhibited a depth-dependent gradient: 20–40 cm (302.35 g·kg−1) > 40–60 cm (289.40 g·kg−1) > 10–20 cm (278.74 g·kg−1) > 60–80 cm (269.04 g·kg−1) > 0–10 cm (231.88 g·kg−1). There were significant differences in POC content among different soil depths (p < 0.05). Relative to the surface 0–10 cm layer, the particulate organic carbon (POC) content increased by 20.2%, 30.4%, 24.8%, and 16.0% in the 10–20 cm, 20–40 cm, 40–60 cm, and 60–80 cm layers, respectively. Similar to SOC, POC reached its highest content (302.35 g·kg−1) at 20–40 cm depth and the lowest at 0–10 cm.
In different soil depths, the DOC content was significantly lower than the POC content, and it only accounted for 0.1% of the SOC content. No significant difference in DOC content was observed within the 0–40 cm soil layer (p > 0.05). DOC content generally increased with soil depth, reaching a maximum of 0.6576 g·kg−1 at 40–60 cm and a minimum of 0.2023 g·kg−1 at 0–10 cm. Within the 40–80 cm layer, DOC concentrations demonstrated significant differences (p < 0.05), representing 67.48% of the total profile content. Collectively, SOC, POC, and DOC exhibited preferential accumulation within the 20–60 cm layer, while surface soils (0–10 cm) maintained the lowest carbon concentrations.

3.2. Distribution Characteristics of Soil Physicochemical Properties at Different Depths

Table 1 shows that soil temperature and humidity fluctuated slightly in different soil layers, with ranges of 5.5–8.05 °C and 21.13–28.1%, respectively. The temperature of the surface soil (0–10 cm) was significantly lower than that of other soil layers (p < 0.05), and the soil temperature reached its highest value of 8.05 °C at 40–60 cm depth. In contrast, soil humidity showed an opposite trend. Soil moisture showed significant differences (p < 0.05) between the 0–10 cm and 20–80 cm soil layers. The soil humidity was highest at the 0–10 cm depth, at 28.1%, which was 24.82% higher than that at the 40–60 cm depth.
The soil pH was generally acidic. It reached its maximum value of 4.77 at a depth of 10–20 cm and then gradually decreased with increasing soil depth. Significant differences in pH existed among soil layers (p < 0.05). The total nitrogen (TN) and phosphorus (TP) concentrations progressively increased with soil depth. TN in the 60–80 cm layer was 29.84% higher than in the 0–20 cm surface layer. Notably, TP exhibited similar vertical trends to TN, reaching its minimum concentration (0.92 g·kg−1) in surface soils (0–20 cm) and peaking at 1.92 g·kg−1 in the 20–40 cm layer.
Nitrate nitrogen (NO3-N) and available phosphorus (AP) contents gradually decreased with increasing soil depth. In the surface layer (0–20 cm), NO3-N and AP accounted for 56.35% and 74.31% of their total contents in the entire soil profile, respectively. Ammonium nitrogen (NH4+-N) exhibited the lowest concentration (926.00 mg·kg−1) at 10–20 cm depth while reaching its maximum (1172.01 mg·kg−1) in the 40–60 cm layer.

3.3. Impact of Soil Physicochemical Properties on SOC, POC, and DOC in Soils at Different Depths

Figure 3A showed that, in the 0–10 cm soil layer, dissolved organic carbon (DOC) had no significant correlations with physicochemical properties (p > 0.05). However, soil organic carbon (SOC) was significantly positively correlated with particulate organic carbon (POC) and soil temperature (p < 0.01). Both SOC and POC were significantly negatively correlated with available phosphorus (AP), nitrate nitrogen (NO3-N), and soil moisture (p < 0.01), and negatively correlated with ammonium nitrogen (NH4+-N) (p < 0.05), indicating that POC and SOC likely shared similar carbon sources.
Figure 3B demonstrated that, within the 10–20 cm soil layer, dissolved organic carbon (DOC) exhibited significant negative correlations with available phosphorus (AP), total phosphorus (TP), total nitrogen (TN), and ammonium nitrogen (NH4+-N) (p < 0.01). Particulate organic carbon (POC) and DOC displayed inverse relationships with soil moisture (p < 0.05) but positive associations with NH4+-N and soil temperature (p < 0.05). Additionally, soil organic carbon (SOC) showed a negative correlation with POC (p < 0.05).
Figure 3C revealed that dissolved organic carbon (DOC) exhibited significant negative correlations with soil organic carbon (SOC), particulate organic carbon (POC), ammonium nitrogen (NH4+-N), total phosphorus (TP), and total nitrogen (TN) (p < 0.01) while showing a strong positive correlation with available phosphorus (AP) (p < 0.01). SOC was negatively correlated with AP (p < 0.05). POC demonstrated a significant negative correlation with soil moisture (p < 0.05) and a positive correlation with soil temperature (p < 0.05).
Figure 3D demonstrated significant inverse correlations between dissolved organic carbon (DOC) and both pH (p < 0.01) and total nitrogen (TN) (p < 0.05) while exhibiting a positive association with particulate organic carbon (POC) (p < 0.05). Soil organic carbon (SOC) showed a marked positive linkage with POC (p < 0.05), whereas POC itself was strongly positively correlated with nitrate nitrogen (NO3-N) (p < 0.05).
Figure 3E demonstrated that dissolved organic carbon (DOC) exhibited strong positive correlations with total phosphorus (TP), total nitrogen (TN), and soil moisture (p < 0.01). Soil organic carbon (SOC) showed significant positive associations with particulate organic carbon (POC), ammonium nitrogen (NH4+-N), and pH (p < 0.01). Notably, POC displayed highly positive linkages with NH4+-N and pH (p < 0.01), whereas it was inversely related to TP and TN (p < 0.05).
Redundancy analysis (RDA; Figure 4) revealed that edaphic factors collectively accounted for 88.22–98.88% of the variance in SOC and labile carbon fractions across the 0–80 cm pedon. Monte Carlo permutation tests (Table 2) further quantified the hierarchical influence of environmental drivers on carbon dynamics within stratified horizons. Redundancy analysis elucidated depth-dependent drivers of soil organic carbon (SOC) and active carbon fractions (particulate organic carbon, POC; dissolved organic carbon, DOC): 0–10 cm: available phosphorus (39.8%), pH (33.7%), and nitrate nitrogen (18.9%); 10–20 cm: soil moisture (45.3%), ammonium nitrogen (43.1%), and available phosphorus (8.4%); 20–40 cm: ammonium nitrogen (83.4%), available phosphorus (14.7%), and total nitrogen (0.8%); 40–60 cm: total phosphorus (65.5%), nitrate nitrogen (21.4%), and total nitrogen (10.9%); 60–80 cm: total nitrogen (77.5%), soil moisture (16.9%), and available phosphorus (3.9%); these values collectively explained the variability in SOC-POC-DOC associations across soil profiles. The above-mentioned study revealed that available phosphorus, total nitrogen, nitrate nitrogen, ammonium nitrogen, and soil moisture were the key factors influencing soil organic carbon and its active carbon fractions.

4. Discussion

4.1. Vertical Distribution of Soil Organic Carbon and Its Active Carbon Fractions in Peat Bog Wetlands

Vertical stratification significantly governs SOC stability and labile carbon dynamics [18]. This study found that the soil organic carbon (SOC), particulate organic carbon (POC), and dissolved organic carbon (DOC) contents were higher in deeper soil layers (20–80 cm) than in shallower layers (0–20 cm). SOC and POC were predominantly accumulated in the 20–40 cm soil layer, whereas DOC was partitioned into deeper soil strata (40–80 cm profile) (Figure 2). These results corroborate prior evidence demonstrating vertical attenuation of organic carbon fractions across stratigraphic profiles in altitudinal peatland ecosystems [15]. On the one hand, this phenomenon may result from the leaching effects of periodic precipitation and snowmelt water on surface soils, leading to carbon loss in the upper soil layers. Meanwhile, a high abundance of plant roots can increase soil porosity, which, in turn, transports carbon from the surface soil to deeper soil layers [19]. In deeper soil layers with less disturbance from environmental factors, SOC, POC, and DOC decompose slowly, resulting in a more stable soil carbon pool and facilitating the accumulation of soil carbon. On the other hand, the waterlogged environments caused by cyclical precipitation impede the direct transport of plant litter and animal residues to the surface soil. Meanwhile, plant roots increase the carbon accumulation in the soil by transporting organic carbon in the form of root litter and root deposits to deeper soil layers [20]. W Ma, Q Liu, G Li, and W Chang [9] demonstrated that soil leaching, induced by periodic flooding environments, leads to the migration of carbon from the surface soil to deeper soil layers. In this study, 22.07% of the soil organic carbon (SOC) content was concentrated in the 20–40 cm soil layer, which was consistent with the 26.36% in the Witzwil peatland in Switzerland (Table 3). Previous studies have shown that the roots of Sphagnum spp. and Cyperaceae are mainly distributed within the 20–40 cm soil layer, and dead roots serve as the primary source of SOC in this horizon [21]. Moreover, in this study, the dominant vegetation in the peatland was Carex lasiocarpa and Sphagnum. The soil layer at a depth of 20–40 cm was predominantly inhabited by methanogenic bacteria, whose decomposition rate was 1/5–1/10 that of aerobic bacteria [22]. This facilitated the continuous accumulation of SOC at the 20–40 cm depth. Conversely, in the tussock-type peatlands of northeastern Germany, soil organic carbon (SOC) is primarily distributed in the surface soil layer (0–15 cm) (Table 3). Elevated SOC concentrations were observed in surficial peatland strata, exceeding subsurface levels by 30–50%. This phenomenon might be ascribed to the continuous incorporation of crop residues due to long-term agricultural practices. Moreover, soil aggregates in the surface layer protected SOC, with the protection efficiency reaching 40–60% [23]. In this study, the higher accumulation of SOC and lower DOC content might be ascribed to the high exogenous carbon input to the soil. This input significantly increased the population and activity of soil microorganisms, thereby accelerating the rate of SOC accumulation [24]. Soil-dissolved organic carbon (DOC) is highly water-soluble. Favorable moisture conditions facilitate the loss of DOC with water, thus reducing the DOC content in the soil. Some studies have demonstrated that microorganisms are more active in weakly acidic or alkaline environments, and microbial decomposition reaches its maximum when the soil pH ranges from 6.5 to 7.5 [25]. In contrast, the average pH of the Kharasaz peat bog soil is 4.4, presenting severe soil acidification. This greatly diminishes soil microbial activity and suppresses microbial mineralization and decomposition of humus and organic matter, resulting in substantially lower dissolved organic carbon (DOC) content compared to particulate organic carbon (POC) in the soil.

4.2. Relations of Soil Organic Carbon and Its Active Carbon Fractions in Different Soil Horizons to Various Environmental Factors

Surface plant litter and rhizodeposits constitute the principal origins of soil organic carbon (SOC). Changes in vegetation type and density typically influence the accumulation and turnover of soil organic carbon [27]. The active carbon fractions of soil organic carbon contribute to the soil carbon pool in varying proportions. Moreover, the sources of active carbon fractions differ among different soils. This leads to the active carbon fractions showing different sensitivities to changes in soil environmental factors [28]. Soil-dissolved organic carbon (DOC) represents the most labile carbon component within soil organic carbon [29]. Our analysis revealed marked inverse correlations between dissolved organic carbon (DOC) and total nitrogen (TN) across soil strata below 10 cm depth (p < 0.05), with no significant association observed in surficial horizons (0–10 cm) (Figure 3). In agreement with the research conclusions of this paper, some studies suggest that an increase in soil total nitrogen content significantly inhibits the increase in soil DOC [30]. However, other studies have found that a higher soil total nitrogen content has a promoting effect on soil DOC, presenting a highly significant positive correlation between soil DOC and soil total nitrogen (p < 0.01) [31]. This could be because, as the soil’s organic carbon content increases, microorganisms utilize DOC as an energy and carbon source. During soil organic matter decomposition, total nitrogen (TN) is converted into inorganic forms like ammonium (NH4+) and nitrate (NO3) [32]. Plant roots absorb a portion of these inorganic nitrogen compounds, thereby reducing TN levels in the soil. The topsoil layers (0–20 cm) exhibited significant inverse correlations between particulate organic carbon (POC) concentrations and soil moisture levels (p < 0.05). On one hand, higher soil moisture enhanced the activity of soil microorganisms, accelerating the decomposition rate of soil organic matter. Meanwhile, microorganisms utilized soil organic carbon as an energy source to accelerate the mineralization and decomposition of POC in the soil [33]. On the other hand, in wet conditions, peat bog soils exhibit high permeability and water mobility. Periodic precipitation can cause the transport or loss of POC from the soil via water flow or surface runoff. This, in turn, accelerates soil structure degradation and further reduces the accumulation of POC in the soil [34]. In this study, in shallow soils, the contents of SOC and POC were significantly positively correlated (p < 0.05), while, in deep soils, they were significantly negatively correlated (p < 0.05). This is because, in shallow soils, soil microorganisms accelerate the decomposition of soil organic matter under aerobic conditions, and soil POC mainly originates from plant residues and root exudates [35]. This enables microorganisms to decompose soil POC rapidly, resulting in a decrease in soil POC content. Microorganisms convert the POC released during decomposition into a more stable form of soil organic carbon that exists in the soil. In deeper soil layers, the anaerobic environment and low biological activity limit the decomposition of soil organic matter [36]. This facilitates prolonged retention of particulate organic carbon (POC) within the soil profile.

5. Conclusions

(1) Vertical stratification analysis revealed progressive enrichment of soil organic carbon (SOC) and its labile fractions (POC, DOC) with depth in the Altay Mountain peat swamp, predominantly concentrated in subsurface strata (20–60 cm). No significant inter-horizon variations in SOC concentrations were observed. POC constituted 76.46% of total SOC, whereas DOC represented a minimal 0.1% proportion.
(2) In the 0–20 cm soil layer of the peat-bog wetland, SOC and POC were significantly correlated, indicating that their carbon sources were approximately identical. In shallow soils, elevated levels of ammonium nitrogen, nitrate nitrogen, total phosphorus, and total nitrogen led to significantly decreased levels of soil organic carbon (SOC) and particulate organic carbon (POC). In contrast, higher concentrations of available phosphorus, total phosphorus, total nitrogen, and ammonium nitrogen significantly reduced the content of dissolved organic carbon (DOC).
(3) Multivariate statistics highlighted available phosphorus, total nitrogen, ammonium, and moisture as dominant controls on SOC and labile C fractions throughout the soil column (0–80 cm). Specifically, in surficial horizons (0–20 cm), AP, pH, moisture, and NH4+-N collectively explained 64.1% of the organic-ACF variance. Comparatively, total phosphorus (TP), TN, and NH4+-N accounted for a 69.4% variance explanation in subsurface soils (20–80 cm).

Author Contributions

G.M.: conceptualization, methodology, validation, formal analysis, investigation, writing—original draft. Y.L.: conceptualization, methodology, resources, writing—review, and editing, supervision, funding acquisition. C.S.: Investigation, Data curation. All authors have read and agreed to the published version of the manuscript.

Funding

The research presented in this paper was funded by a grant from the National Natural Science Foundation of China (Project No. 2023E01009).

Data Availability Statement

The authors do not have permission to share data.

Acknowledgments

We are grateful to Chongru Shi for their assistance in data processing and reviewing the manuscript.

Conflicts of Interest

This research was conducted without any financial or interpersonal competing interests.

References

  1. Liu, Y.; Zhang, Y.; Chen, X.; Chen, Z.; Tong, Y. Change of Organic Carbon Composition in Peat Profiles over the Permafrost Areas of Xinjiang Altai Mountains in China and Its Influence Mechanism. Mt. Res. 2024, 42, 300–311. [Google Scholar]
  2. Li, M.L.; Mu, C.C.; Sun, Z.Q.; Wang, T.; Wang, W.J. Variation of carbon source/sink of subalpine coniferous forested wetland along water environmental gradient in Changbai Mountains of China. Acta Ecologica Sinica. Acta Ecol. Sin. 2024, 44, 2256–2269. [Google Scholar]
  3. Liu, Q.; Tang, J. Vertical distribution and correlation analysis of soil active organic carbon components in saline-alkali reed wetland. Sci. Technol. Eng. 2020, 20, 1760–1766. [Google Scholar]
  4. Cui, D.; Yan, J.-j.; Liu, H.-j.; Chen, C. Soil labile organic carbon fractions and the differences of their concentrations in different types of wetlands in Yili valley. Chin. J. Ecol. 2019, 38, 2087–2093. [Google Scholar]
  5. Liu, X.; Shao, X.; Jiang, X.; Tao, J.; Ji, B.; Xu, D.; Yang, H.; Wu, M.; Sheng, X. Distribution Characteristic of Contents of Soil Organic Carbon in Jingning Wangdongyang Mountain Wetland Nature Reserve. Wetl. Sci. 2020, 18, 183–190. [Google Scholar]
  6. Xiao, Y.; Huang, Z.; Lu, X. Changes of soil labile organic carbon fractions and their relation to soil microbial characteristics in four typical wetlands of Sanjiang Plain, Northeast China. Ecol. Eng. 2015, 82, 381–389. [Google Scholar] [CrossRef]
  7. Zhang, X.; Hu, Y.; An, J.; Yue, Y.; Ding, Y.; Gao, J. Response of Contents of Dissolved Organic Carbon in Soil of Bog in Zoigê Plain to Precipitation Changes. Wetl. Sci. 2018, 16, 546–551. [Google Scholar]
  8. Chen, L.; Huang, X.; Xue, D.; Chen, H.; Lin, B.; Liang, D. Distribution characteristics of soil organic carbon and its influencing factors in the peatlands of Western Sichuan Plateau, China. Chin. J. Appl. Environ. Biol. 2022, 28, 267–275. [Google Scholar]
  9. Ma, W.; Liu, Q.; Li, G.; Chang, W. Temporal Dynamics and Content of Soil Particulate Organic of Gahai Wetland in Gansu Province During Vegetation Degradation Succession. Acta Pedol. Sin. 2025. [Google Scholar] [CrossRef]
  10. Ma, W.; Wang, H.; Li, G.; Shi, W. Temporal Dynamics of Soil Organic Carbon Content of Gahai Wetland in South Gansu at Different Stages of Vegetation Degradation. J. Soil. Water Conserv. 2015, 29, 254–259. [Google Scholar]
  11. Packalen, M.S.; Finkelstein, S.A.; McLaughlin, J.W. Climate and peat type in relation to spatial variation of the peatland carbon mass in the Hudson Bay Lowlands, Canada. J. Geophys. Res. Biogeosci. 2016, 121, 1104–1117. [Google Scholar] [CrossRef]
  12. Li, Y.; Xu, H.; Zhang, C. Opposite relationships between soil organic carbon and elevation in the midlands and mountainous areas in Ireland related to different types of peat. Appl. Geochem. 2024, 170, 106096. [Google Scholar] [CrossRef]
  13. Heller, C.; Zeitz, J. Stability of soil organic matter in two northeastern German fen soils: The influence of site and soil development. J. Soils Sediments 2012, 12, 1231–1240. [Google Scholar] [CrossRef]
  14. Ricardo, S.-M.; Paola, G.-A.; Rolando, S.-G.; Germain, E.-H.; Roy, P.-S.; María, P. Exploring Dissolved Organic Carbon Variations in a High Elevation Tropical Peatland Ecosystem: Cerro de la Muerte, Costa Rica. Front. Water 2022, 3, 742780. [Google Scholar] [CrossRef]
  15. Chen, X.; Zhang, Y.; Wu, Z.; Yang, Y.; Chen, Z.; Liu, Y. Estimation of Organic Carbon Stocks and Their Influence Factors in the Permafrost Peatlands of the Altai Mountains. Wetl. Sci. 2023, 21, 876–886. [Google Scholar]
  16. Chen, H.; Wu, N.; Wang, Y.; Yang, G.; Ju, P.; Zhu, D.; He, Y.; Zhu, Q.; Gao, Y.; Liu, X. A historical overview about basic issues and studies of mires. Sci. Sin. Terrae 2021, 51, 15–26. (In Chinese) [Google Scholar]
  17. Clark, J.D.; Plante, A.F.; Johnson, A.H. Soil Organic Matter Quality in Chronosequences Of Secondary Northern Hardwood Forests In Western New England. Soil. Sci. Soc. Am. J. 2012, 76, 684–693. [Google Scholar] [CrossRef]
  18. Yang, Y.; Chen, X.L.; Liu, L.X.; Li, T.; Dou, Y.X.; Qiao, J.B.; Wang, Y.Q.; An, S.S.; Chang, S.X. Nitrogen fertilization weakens the linkage between soil carbon and microbial diversity: A global meta-analysis. Glob. Change Biol. 2022, 28, 6446–6461. [Google Scholar] [CrossRef]
  19. Lucas, M.; Santiago, J.P.; Chen, J.Y.; Guber, A.; Kravchenko, A. The soil pore structure encountered by roots affects plant-derived carbon inputs and fate. New Phytol. 2023, 240, 515–528. [Google Scholar] [CrossRef]
  20. Zhang, J.-Z.; Ma, C.; Gao, H.-J. Investigation of soil organic carbon mineralization and microbial community structure evolution of north east paddy black soil in waterlogged and aerobic conditions. J. Agro-Environ. Sci. 2017, 36, 1160–1166. [Google Scholar]
  21. Loisel, J.; Gallego-Sala, A.V.; Amesbury, M.J.; Magnan, G.; Anshari, G.; Beilman, D.W.; Benavides, J.C.; Blewett, J.; Camill, P.; Charman, D.J.; et al. Expert assessment of future vulnerability of the global peatland carbon sink. Nat. Clim. Change 2020, 11, 70–77. [Google Scholar] [CrossRef]
  22. Lin, X.; Tfaily, M.M.; Steinweg, J.M.; Chanton, P.; Esson, K.; Yang, Z.K.; Chanton, J.P.; Cooper, W.; Schadt, C.W.; Kostka, J.E. Microbial community stratification linked to utilization of carbohydrates and phosphorus limitation in a boreal peatland at Marcell Experimental Forest, Minnesota, USA. Appl. Environ. Microbiol. 2014, 80, 3518–3530. [Google Scholar] [CrossRef] [PubMed]
  23. Hermansen, C.; Norgaard, T.; Wollesen de Jonge, L.; Moldrup, P.; Müller, K.; Knadel, M. Predicting glyphosate sorption across New Zealand pastoral soils using basic soil properties or Vis–NIR spectroscopy. Geoderma 2020, 360, 114009. [Google Scholar] [CrossRef]
  24. Hu, X.; Yin, P.; Liu, Z.; Huang, J.; Peng, Y.; Fan, J. Effect of short-term carbon input on the number and activity of soil microbes in alpine meadow soil in winter. J. Jinan Univ. (Nat. Sci. Med. Ed.) 2021, 42, 325–331. [Google Scholar]
  25. Luo, Q.; He, Q.; Wu, H.; Kou, L.; Fang, X.; Zhang, X.; Li, Y.; Chai, Y.; Zhang, R.; Dai, W. Characteristics of Soil Organic Carbon Fractions in Liao River Estuary Wetland and Their Influencing Factors. Ecol. Environ. Sci. 2024, 33, 333–340. [Google Scholar]
  26. Leifeld, J.; Müller, M.; Fuhrer, J. Peatland subsidence and carbon loss from drained temperate fens. Soil. Use Manag. 2011, 27, 170–176. [Google Scholar] [CrossRef]
  27. Feng, J.G.; He, K.Y.; Zhang, Q.F.; Han, M.G.; Zhu, B. Changes in plant inputs alter soil carbon and microbial communities in forest ecosystems. Glob. Change Biol. 2022, 28, 3426–3440. [Google Scholar] [CrossRef]
  28. Wang, Y.; Xu, Z.; Wang, S. Concentrations of Active Organic Carbon Components in Soils in Baijianghe Natural and Drained Peat Bogs and Their Influencing Factors. Wetl. Sci. 2021, 19, 691–701. [Google Scholar]
  29. Shen, H.; Cao, Z.; Hu, Z. Characteristics and Ecological Effects of the Active Organic Carbon in Soil. Chin. J. Ecol. 1999, 18, 32–38. [Google Scholar]
  30. Zhuang, Q.L.; Yuan, H.Y.; Qi, J.Q.; Sun, Z.R.; Tao, B.X.; Zhang, B.H. Phosphorus fertiliser application mitigates the negative effects of microplastic on soil microbes and rice growth. J. Hazard. Mater. 2024, 465, 133278. [Google Scholar] [CrossRef]
  31. Li, N.; Xin, H.; Lai, N.; Li, Y.; Lyu, C. Effects of different land-use methods on the organic carbon composition and soil microbial biomass carbon of farmland soil. Arid. Zone Res. 2024, 41, 1789–1796. [Google Scholar]
  32. Finn, D.; Kopittke, P.M.; Dennis, P.G.; Dalal, R.C. Microbial energy and matter transformation in agricultural soils. Soil. Biol. Biochem. 2017, 111, 176–192. [Google Scholar] [CrossRef]
  33. Yan, N.; Marschner, P.; Cao, W.; Zuo, C.; Qin, W. Influence of salinity and water content on soil microorganisms. Int. Soil. Water Conserv. Res. 2015, 3, 316–323. [Google Scholar] [CrossRef]
  34. Dong, Y.; Li, H.; He, H.; Wang, S. Holocene peatland development, carbon accumulation and its response to climate forcing and local conditions in Laolike peatland, northeast China. Quat. Sci. Rev. 2021, 268, 107124. [Google Scholar] [CrossRef]
  35. Zhao, Q.; Thompson, A.M.; Callister, S.J.; Tfaily, M.M.; Bell, S.L.; Hobbie, S.E.; Hofmockel, K.S. Dynamics of organic matter molecular composition under aerobic decomposition and their response to the nitrogen addition in grassland soils. Sci. Total Environ. 2022, 806, 150514. [Google Scholar] [CrossRef]
  36. Malik, A.A.; Martiny, J.B.H.; Brodie, E.L.; Martiny, A.C.; Treseder, K.K.; Allison, S.D. Defining trait-based microbial strategies with consequences for soil carbon cycling under climate change. ISME J. 2020, 14, 1–9. [Google Scholar] [CrossRef]
Figure 1. Study area location and terrain in the Altai Mountains. ((a,b) Location of the study area; (c) Sampling site distribution in the Kharasaz peat bog wetland; (d) environmental conditions at sampling sites).
Land 14 00670 g001
Figure 2. SOC, POC, and DOC in different soil depths. SOC: soil organic carbon; POC: particulate organic carbon; DOC: dissolved organic carbon; letters on the bars represent ANOVA, with significant differences when the letters are different and non-significant when the letters are the same, and lowercase letters indicate significant differences (p < 0.05) in SOC, POC, and DOC for different soil horizons within the same metric.
Land 14 00670 g002
Figure 3. Depth-stratified correlations between soil organic carbon (SOC), labile carbon fractions (POC/DOC), and physicochemical parameters (AP: available phosphorus; NH4+N/NO3N: inorganic nitrogen; TP/TN: total phosphorus/nitrogen; ST/SM: soil temperature/moisture. Depth intervals: (A) 0–10, (B) 10–20, (C) 20–40, (D) 40–60, (E) 60–80 cm. Significance: * p < 0.05, ** p < 0.01).
Land 14 00670 g003
Figure 4. Redundancy analysis of edaphic parameters and carbon dynamics in stratified soil horizons (The blue—colored entity represents the independent variable, while the red—colored one represents the dependent variable; carbon pools: SOC (soil organic carbon), POC (particulate), DOC (dissolved); nutrients: AP (available phosphorus), TP (total phosphorus), TN (total nitrogen); nitrogen species: NH4+N, NO3N; environmental controls: pH, ST (soil temperature), SM (soil moisture)).
Land 14 00670 g004
Table 1. Physico-chemical properties of soil at different soil depths.
Soil Depth (cm)0–1010–2020–4040–6060–80
Physicochemical Property
ST (°C)5.5 ± 0.367.28 ± 0.256.9 ± 0.328.05 ± 0.217.48 ± 0.28
SM (%)28.1 ± 0.0827.83 ± 0.2227.63 ± 0.2421.13 ± 0.2524.33 ± 0.30
pH4.38 ± 0.014.77 ± 0.014.54 ± 0.024.24 ± 0.044.06 ± 0.02
TN (g·kg−1)12.34 ± 0.1315.00 ± 0.0315.41 ± 0.0516.16 ± 0.0817.59 ± 0.35
TP (g·kg−1)0.92 ± 0.011.88 ± 0.951.92 ± 0.011.04 ± 0.041.58 ± 0.01
NO3-N (mg·kg−1)388.53 ± 0.51386.92 ± 1.06261.67 ± 0.28166.58 ± 0.28172.47 ± 0.28
NH4+-N (mg·kg−1)1054.87 ± 1.53926.00 ± 3.11950.83 ± 1.511172.01 ± 4.081076.12 ± 3.18
AP (mg·kg−1)25.39 ± 0.097.88 ± 0.153.24 ± 0.093.74 ± 0.154.52 ± 0.09
Note: AP: available phosphorous; NH4+-N: ammonium nitrogen; NO3-N: nitrate nitrogen; pH: soil acidity and alkalinity; TP: total phosphorus; TN: total nitrogen; ST: soil temperature; SM: soil moisture content.
Table 2. Ranking of importance and significance test results of soil physicochemical properties.
Soil DepthPhysicochemical PropertyOrder of ImportanceInterpreted Quantity/%Fp
0–10 cmAP139.86.60.002
pH233.735.50.002
NO3-N318.94.10.068
10–20 cmSM145.38.30.002
NH4+-N243.133.30.002
AP38.421.00.002
20–40 cmNH4+-N183.450.20.008
AP214.768.50.002
TN30.85.70.01
40–60 cmTP165.519.00.008
NO3-N221.414.80.002
TN310.942.50.002
60–80 cmTN177.534.30.002
SM216.926.80.002
AP33.9180.002
Note: AP: available phosphorous; NH4+-N: ammonium nitrogen; NO3-N: nitrate nitrogen; pH: soil acidity and alkalinity; TP: total phosphorus; TN: total nitrogen; SM: soil moisture content.
Table 3. The SOC content in different types of peatlands.
Wetland TypeVegetative HabitatSoil Depth (cm)SOC (g/kg)Literature Sources
The drained Witzwil peatland in SwitzerlandMolinietum caeruleae, Sphagnetum0–10265.2 ± 13.3[26]
10–20253.5 ± 14.7
20–30440.6 ± 41.3
30–50382.5 ± 37.2
50–65329.6 ± 47.2
Tussock-type peatlands in northeastern GermanyCarex0–1525.7[13]
15–3018.3
30–5515.6
60–7512.6
Peat bog wetlands in the Altai Mountains, ChinaCarex lasiocarpa, Herba sphagni0–10317.27 ± 62.64This study
10–20321.38 ± 7.02
20–40397.64 ± 27.83
40–60386.00 ± 24.72
60–80379.18 ± 30.96
Disclaimer/Publisher’s Note: The statements, opinions and data contained in all publications are solely those of the individual author(s) and contributor(s) and not of MDPI and/or the editor(s). MDPI and/or the editor(s) disclaim responsibility for any injury to people or property resulting from any ideas, methods, instructions or products referred to in the content.

