Article

Multiple Paths of Rural Transformation and Its Driving Mechanisms Under the Perspective of Rural–Urban Continuum: Taking Suzhou, China as an Example

School of Public Administration, Hohai University, 8 Fochengxi Road, Jiangning District, Nanjing 211100, China
*
Author to whom correspondence should be addressed.
These authors contributed equally to this work.
Land 2025, 14(6), 1145; https://doi.org/10.3390/land14061145
Submission received: 23 April 2025 / Revised: 20 May 2025 / Accepted: 22 May 2025 / Published: 24 May 2025

Abstract

:
Under the context of urban–rural integration, exploring the complex process and general patterns of rural transformation is a critical issue for advancing sustainable rural development. This study develops a theoretical framework for rural transformation from the perspective of the rural–urban continuum. By analyzing the shifting urban–rural dominance relationships across different periods in township units, we extracted the main paths of rural transformation. Empirical analysis of 46 townships in Suzhou, China from 1990 to 2020 reveals the following key findings: (1) The urban–rural dominance relationships in township units have undergone an evolution from “differentiation to intensification to stabilization” over the past three decades, shaped by two pivotal moments—the Sunan Model and the New Sunan Model. (2) By combining four modes (enhancement, weakening, stabilization, and exchange) across different time periods, three primary paths of rural transformation in Suzhou emerge: a continuous stabilization type, a mid-late enhancement type, and a mid-term weakening type. (3) The spatial heterogeneity of the driving mechanisms is particularly evident in the northern region’s modernization of agriculture, the southern region’s characteristic fisheries, the western region’s localized urbanization, and the eastern region’s integration of industry, city, and population (I-C-P). The diverse paths identified in this study offer a deeper understanding of the simplified macro trend in which rurality weakens and urbanity strengthens, providing valuable insights for the tailored promotion of rural revitalization.

1. Introduction

Entering the middle and late 20th century, the global countryside is generally in or entering the transformation stage of rapid reconstruction [1], and the rural space has shifted from homogeneous isomorphism to heterogeneous heterogeneity. Since China’s reform and opening up, it has experienced the world’s largest and fastest urbanization and industrialization process, with urban and rural elements changing from one-way flow to two-way convection [2]. Meanwhile, urban–rural interactions are becoming more frequent, with the boundaries between urban and rural areas tending to blur. As the core component of urban and rural regional system, the elements, structure and function of the countryside have also undergone a drastic transformation, with the gradual weakening of the agricultural production function, and the increasing prominence of non-commodity values such as ecological preservation and natural recreation, the rural space has shown a multifaceted and non-linear transformation [3].
The transformation path of the countryside is an important issue for scholars all over the world. Western studies mainly summarize the rural transformation mode and differentiation types from a qualitative point of view. Some early studies believe that rural modernization is an irreversible process from tradition to modernity, and attribute the main reason for urban–rural differences to disparity in regional development speed [4]. With the gradual acceptance of ‘post-rural’, ‘differentiated rural’ and other views [5,6], academics have provided an adaptive transformation framework for rural development in different regions by outlining the multiple transformation models of the countryside [7]. Compared with western views, the exploration of rural transformation paths in China is relatively late, and the concept has experienced a shift from linear to non-linear [8]. With the spread of theories such as post-productivism and multifunctional rural transformation in China [9], multiple paths provide a more objective and scientific perspective for studying rural transformation [10]. Throughout the existing path research results in China, the village unit has the most cases, but the results are too dependent on the locality [11,12], and the provincial and municipal units are relatively macroscopic, making it difficult to expose the micro features [13]. In addition, due to fewer empirical studies with a long-time span, the exploration of the evolution law of the rural transformation paths is still lacking. Moreover, coupled with the fact that the research methods are more qualitative than quantitative, and the lack of objective data support leads to a certain degree of subjectivity in the generalization of transformation paths [14]. Accordingly, there is an urgent need to take townships in the rapidly urbanized areas as the research object, to carry out the exploration of transformation paths over a long-time span, so as to refine the general law of transformation paths and enrich the empirical research of transformation paths.
The ‘rural–urban continuum’, as a systematic and holistic analytical perspective [15], treats the city and the countryside as the two ends of a continuum, between which there are various forms of mosaic landscapes, composing both urbanity and rurality, and can be defined, analyzed, and evaluated [16]. Existing studies tend to hold that areas with strong urbanity have weak rurality and are manifested as cities. However, regions with strong rurality have weak urbanity and are manifested as rural areas. To a certain extent, this ignores the possibility that both may be strong or weak simultaneously, which limits the understanding of the urban–rural relationship and makes it difficult to scientifically summarize the multiple paths of rural transformation. This article takes Suzhou City, located in the Yangtze River Delta metropolitan area of China, and one of the cities with the fastest urbanization and industrialization development, as the case site, and the towns and townships with the closest urban–rural communication as the research units. Through the perspective of the rural–urban continuum, the evaluation indices of rurality and urbanity are constructed to analyze the spatio-temporal evolution of rural transformation since 1990. Based on this, multiple transformation paths have been constructed and their driving mechanism explored. It is expected that this will provide reference for the integrated development of urban and rural areas in the new era.

2. Background and Research Methodology

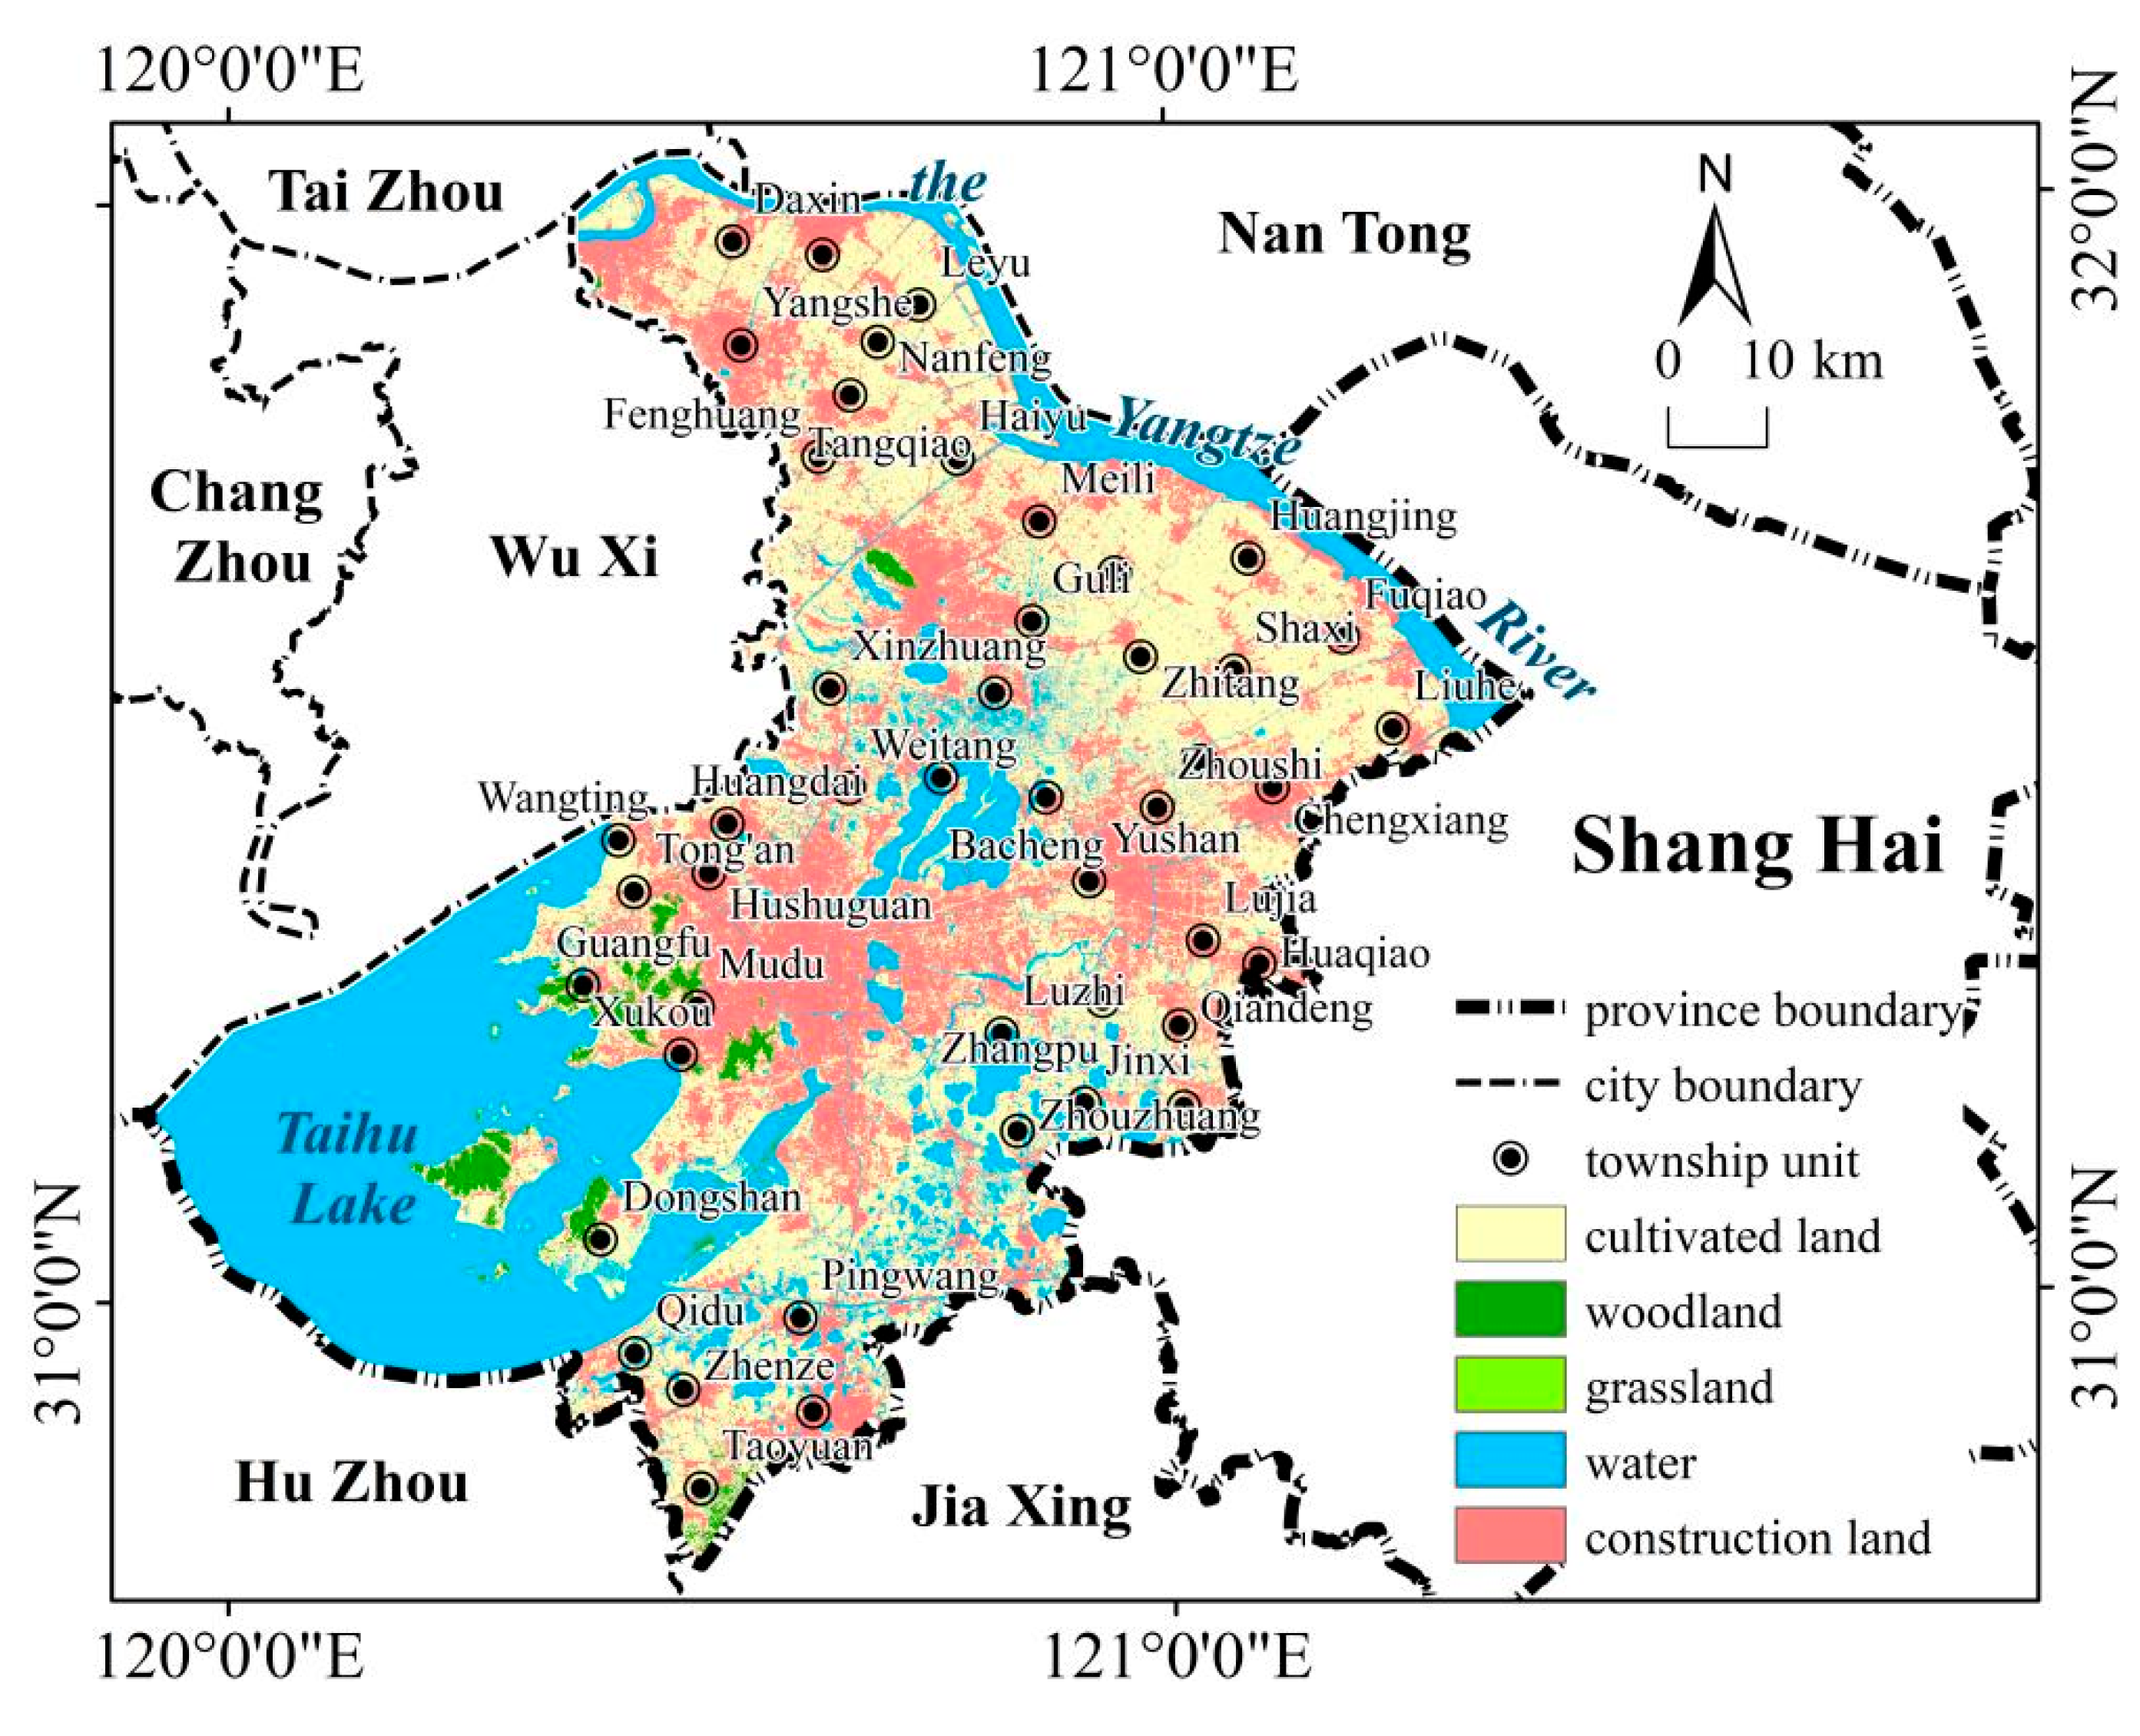
2.1. Study Area and Data

Suzhou is located in the middle of the Yangtze River Delta, east of Shanghai, south of Zhejiang Province, west of Taihu Lake, north of the Yangtze River, with a superior geographical location and convenient transportation. The total area of the city is 8657.32 km2, the total permanent population is 12.958 million at the end of 2023, the urbanization rate is 82.48%, the ratio of the three industrial structures is 0.8:46.8:52.4, and the per capita GDP reaches 27,049 USD, ranking 7th in China.
Since the reform and opening up, Suzhou’s rural space has undergone three transformations. Before 1978, constrained by the dual structure of urban and rural areas all over China, the proportion of agricultural workers in rural areas exceeded 70%. After the reform and opening up, Suzhou actively responded to the call of the state to vigorously develop the rural commodity economy [17], and explored the ‘Sunan model’ of farmers running industries and large-scale construction of township enterprises in rural areas, which led to the overdevelopment of the rural commodity economy and a profound transformation of the traditional economic model that used to be dominated by agriculture [18]. By the mid-1990s, problems of township enterprise such as the ownership structure was monopolistic, and spatial layout was scattered were revealed, the township enterprise’s production advantage was shaken. Until the late 1990s, Suzhou entered the ‘new Southern Jiangsu mode’ with industrial parks as the carrier [19], but new problems also began to emerge. A large number of rural residents have moved out, and the initial signs of rural hollowing out have emerged [20]. The layout of industrial parks shows a trend of scattered and low-density sprawl, and problems such as low efficiency of industrial land use, occupation of farmland, and environmental deterioration are superimposed [21]. With the comprehensive strength of the central urban areas and counties, the overall decline in the status of townships and the widening of the internal development gap have become increasingly serious. Since the 21st century, with the continuous promotion of new urbanization and rural revitalization strategies in whole China, the strategic significance of townships as key nodes of urban–rural integration has become more and more prominent [22]. In order to cope with the problems of the increasing withering of the countryside and the low-quality development of urbanization, Suzhou has carried out a large-scale removal of the administrative structure of townships and, at the same time, carried out the beautiful countryside strategy and the integration of primary/secondary/tertiary industries, which not only optimized the layout and structure of the townships and villages, but also accelerated the flow and reorganization of the elements. At this stage, the development of townships is characterized by differentiation.
According to the results of administrative division adjustment in Jiangsu Province, the number of townships in Suzhou in 1990, 2000, 2010, and 2020 is 166, 130, 60, and 52, respectively. This paper takes the townships in 2020 as the benchmark, and selects the 46 townships that have gone through the administrative division adjustment but still remain as the evaluation unit (Figure 1). As for the data, the socio-economic data come from the Suzhou Statistical Yearbook of the past years, Suzhou National Economic and Social Development Bulletin and China Economic and Social Big Data Research Platform. The land class data come from the results of the national Land Change Survey in 2020, and the administrative boundaries come from the National Centre for Fundamental Geographic Information (https://www.ngcc.cn/, accessed on 25 January 2025). In order to avoid the impact of administrative division adjustment, the boundaries of 2019 are uniformly used as the base map (the town-level administrative division of Suzhou City has not changed in 2019–2020) to ensure the comparability between different years.

2.2. Research Methods

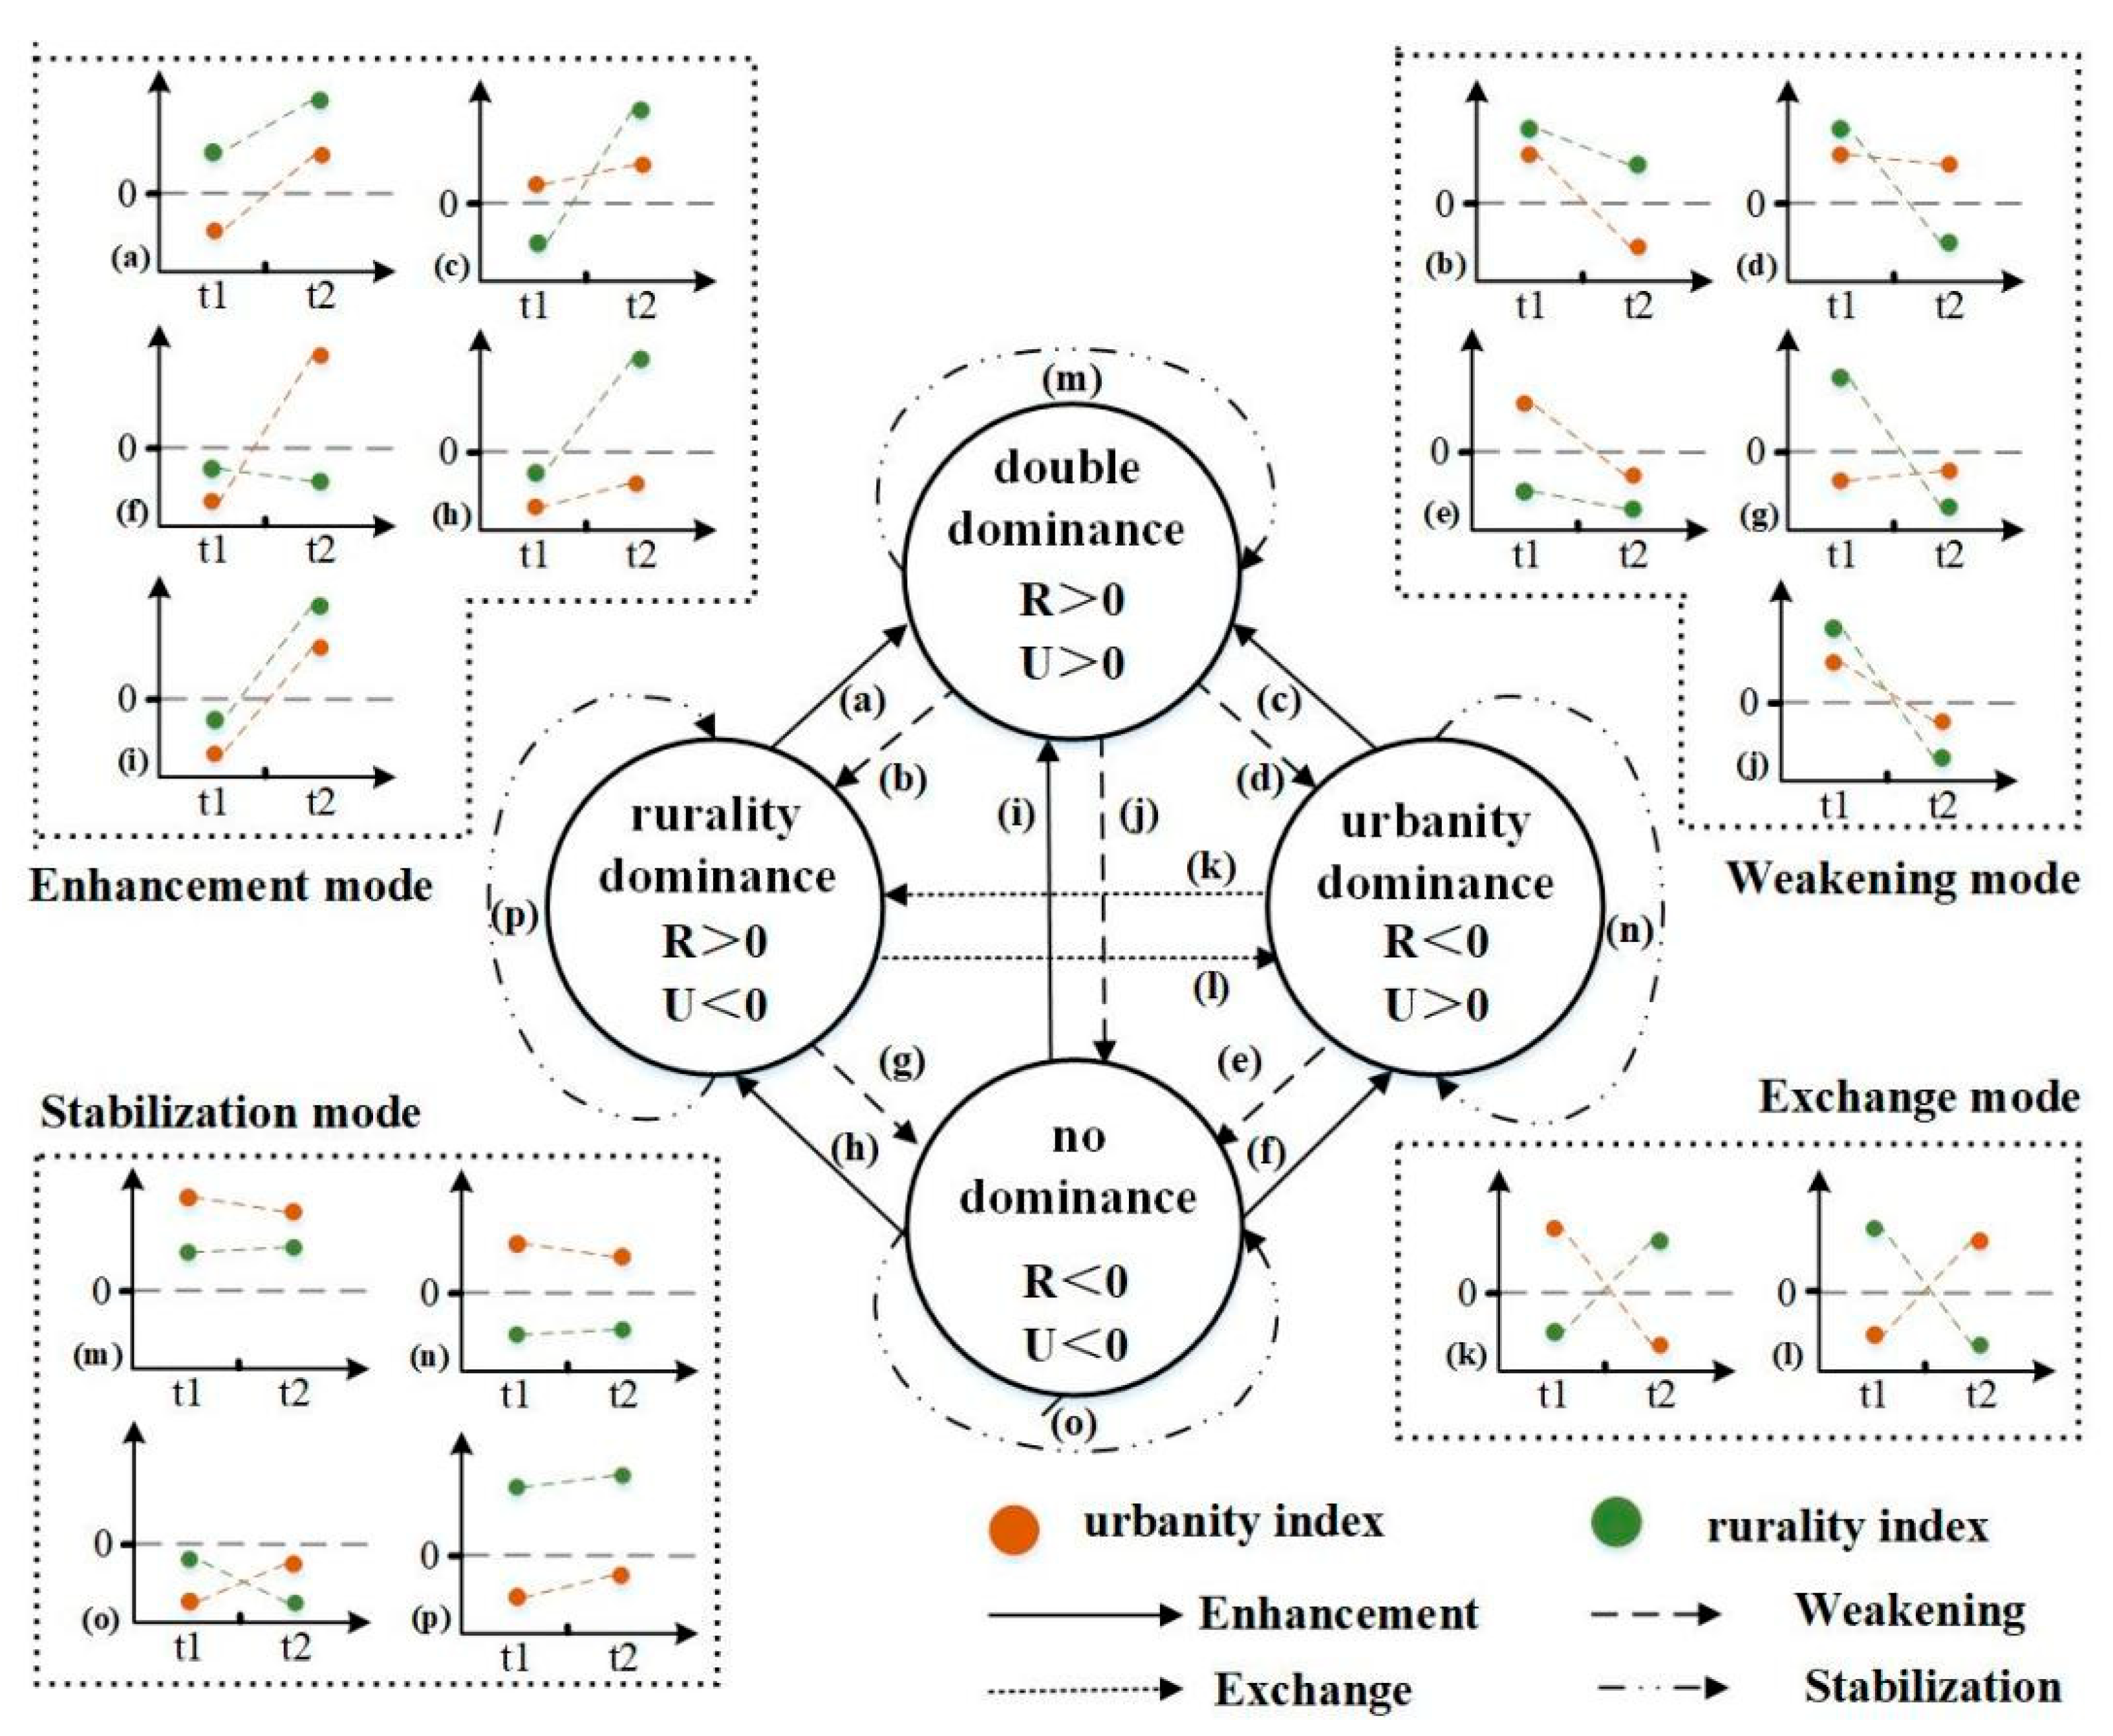
2.2.1. Theoretical Framework Construction

The rural–urban continuum, as a transitional zone composed of multiple elements and landscapes, presents changes in urbanity and rurality [23]. From the perspective of functionalism, the rural transformation in southern Jiangsu is regarded as a linear model of “weakening rurality and increasing urbanity” [24]. However, against the backdrop of the rapid advancement of industrialization and urbanization and the multi-functional transformation of rural areas, while rural areas have experienced an increase in their urbanity, they have also witnessed the integration and symbiosis of “new” and “old” elements represented by modern agriculture, ecological landscapes, and traditional culture. The rural and urban aspects have shown a more diverse and non-linear interactive state, and the dominance patterns of the two at different stages are also constantly changing. Based on this, we construct a theoretical framework of the transformation path from the perspective of the rural–urban continuum (Figure 2).
This paper defines an index greater than 0 as being dominated by that index. At a specific point in time, the research unit theoretically manifests as four dominant situations. The first category is double dominance (dominance of both urbanity and rurality), that is, compared with the surrounding towns, a certain town stands out in both characteristics. The second category is single dominance (dominance of either urbanity or rurality), that is, the town only has one prominent characteristic. The third category is no dominance (no characteristic dominance), that is, this township lacks individual development and individuality compared with the other units.
It should be noted that due to the influence of the internal and external environment of township development, the dominant situations are not fixed at different points in time. Based on the quantity and transformation situation dominated by the index, four modes can be summarized: enhancement, weakening, stabilization, and exchange mode. Among them, the first mode refers to the strengthening of the dominant function of the township at the two points before and after, i.e., from ‘no dominance’ to ‘single dominance’ or ‘double dominance’, and from ‘single dominance’ to ‘double dominance’, as well as from ‘single dominance’ to ‘double dominance’. The opposite is true for weakening mode. The third mode indicates that the dominant function remains unchanged, and the exchange type refers to the transformation of the single dominance of the township at different time points before and after.
Furthermore, different modes can be divided into multiple sub-modes. For example, the enhanced patterns include five: sub-mode a (R > 0, U < 0 to R > 0, U > 0), sub-mode c (R < 0, U > 0 to R > 0, U > 0), sub-mode f (R < 0, U < 0 to R < 0, U > 0), sub-mode h (R < 0, U < 0 to R > 0, U < 0), and sub-mode i (R < 0, U < 0 to R > 0, U > 0), and so on for other modes.
Considering that transformation modes are changes in the dominant situation as reflected by the shift between rurality and urbanity of the study unit over a period of time, the transformation path is defined as a combination of transformation patterns over multiple time periods reflecting changes in the dominant situation of the two of the township unit throughout the study period. The purpose of this paper is to summarize the transformation patterns of 46 townships in the periods of 1990–2000, 2000–2010, and 2010–2020, and then refine the main paths of rural transformation in Suzhou from the perspective of the rural–urban continuum.

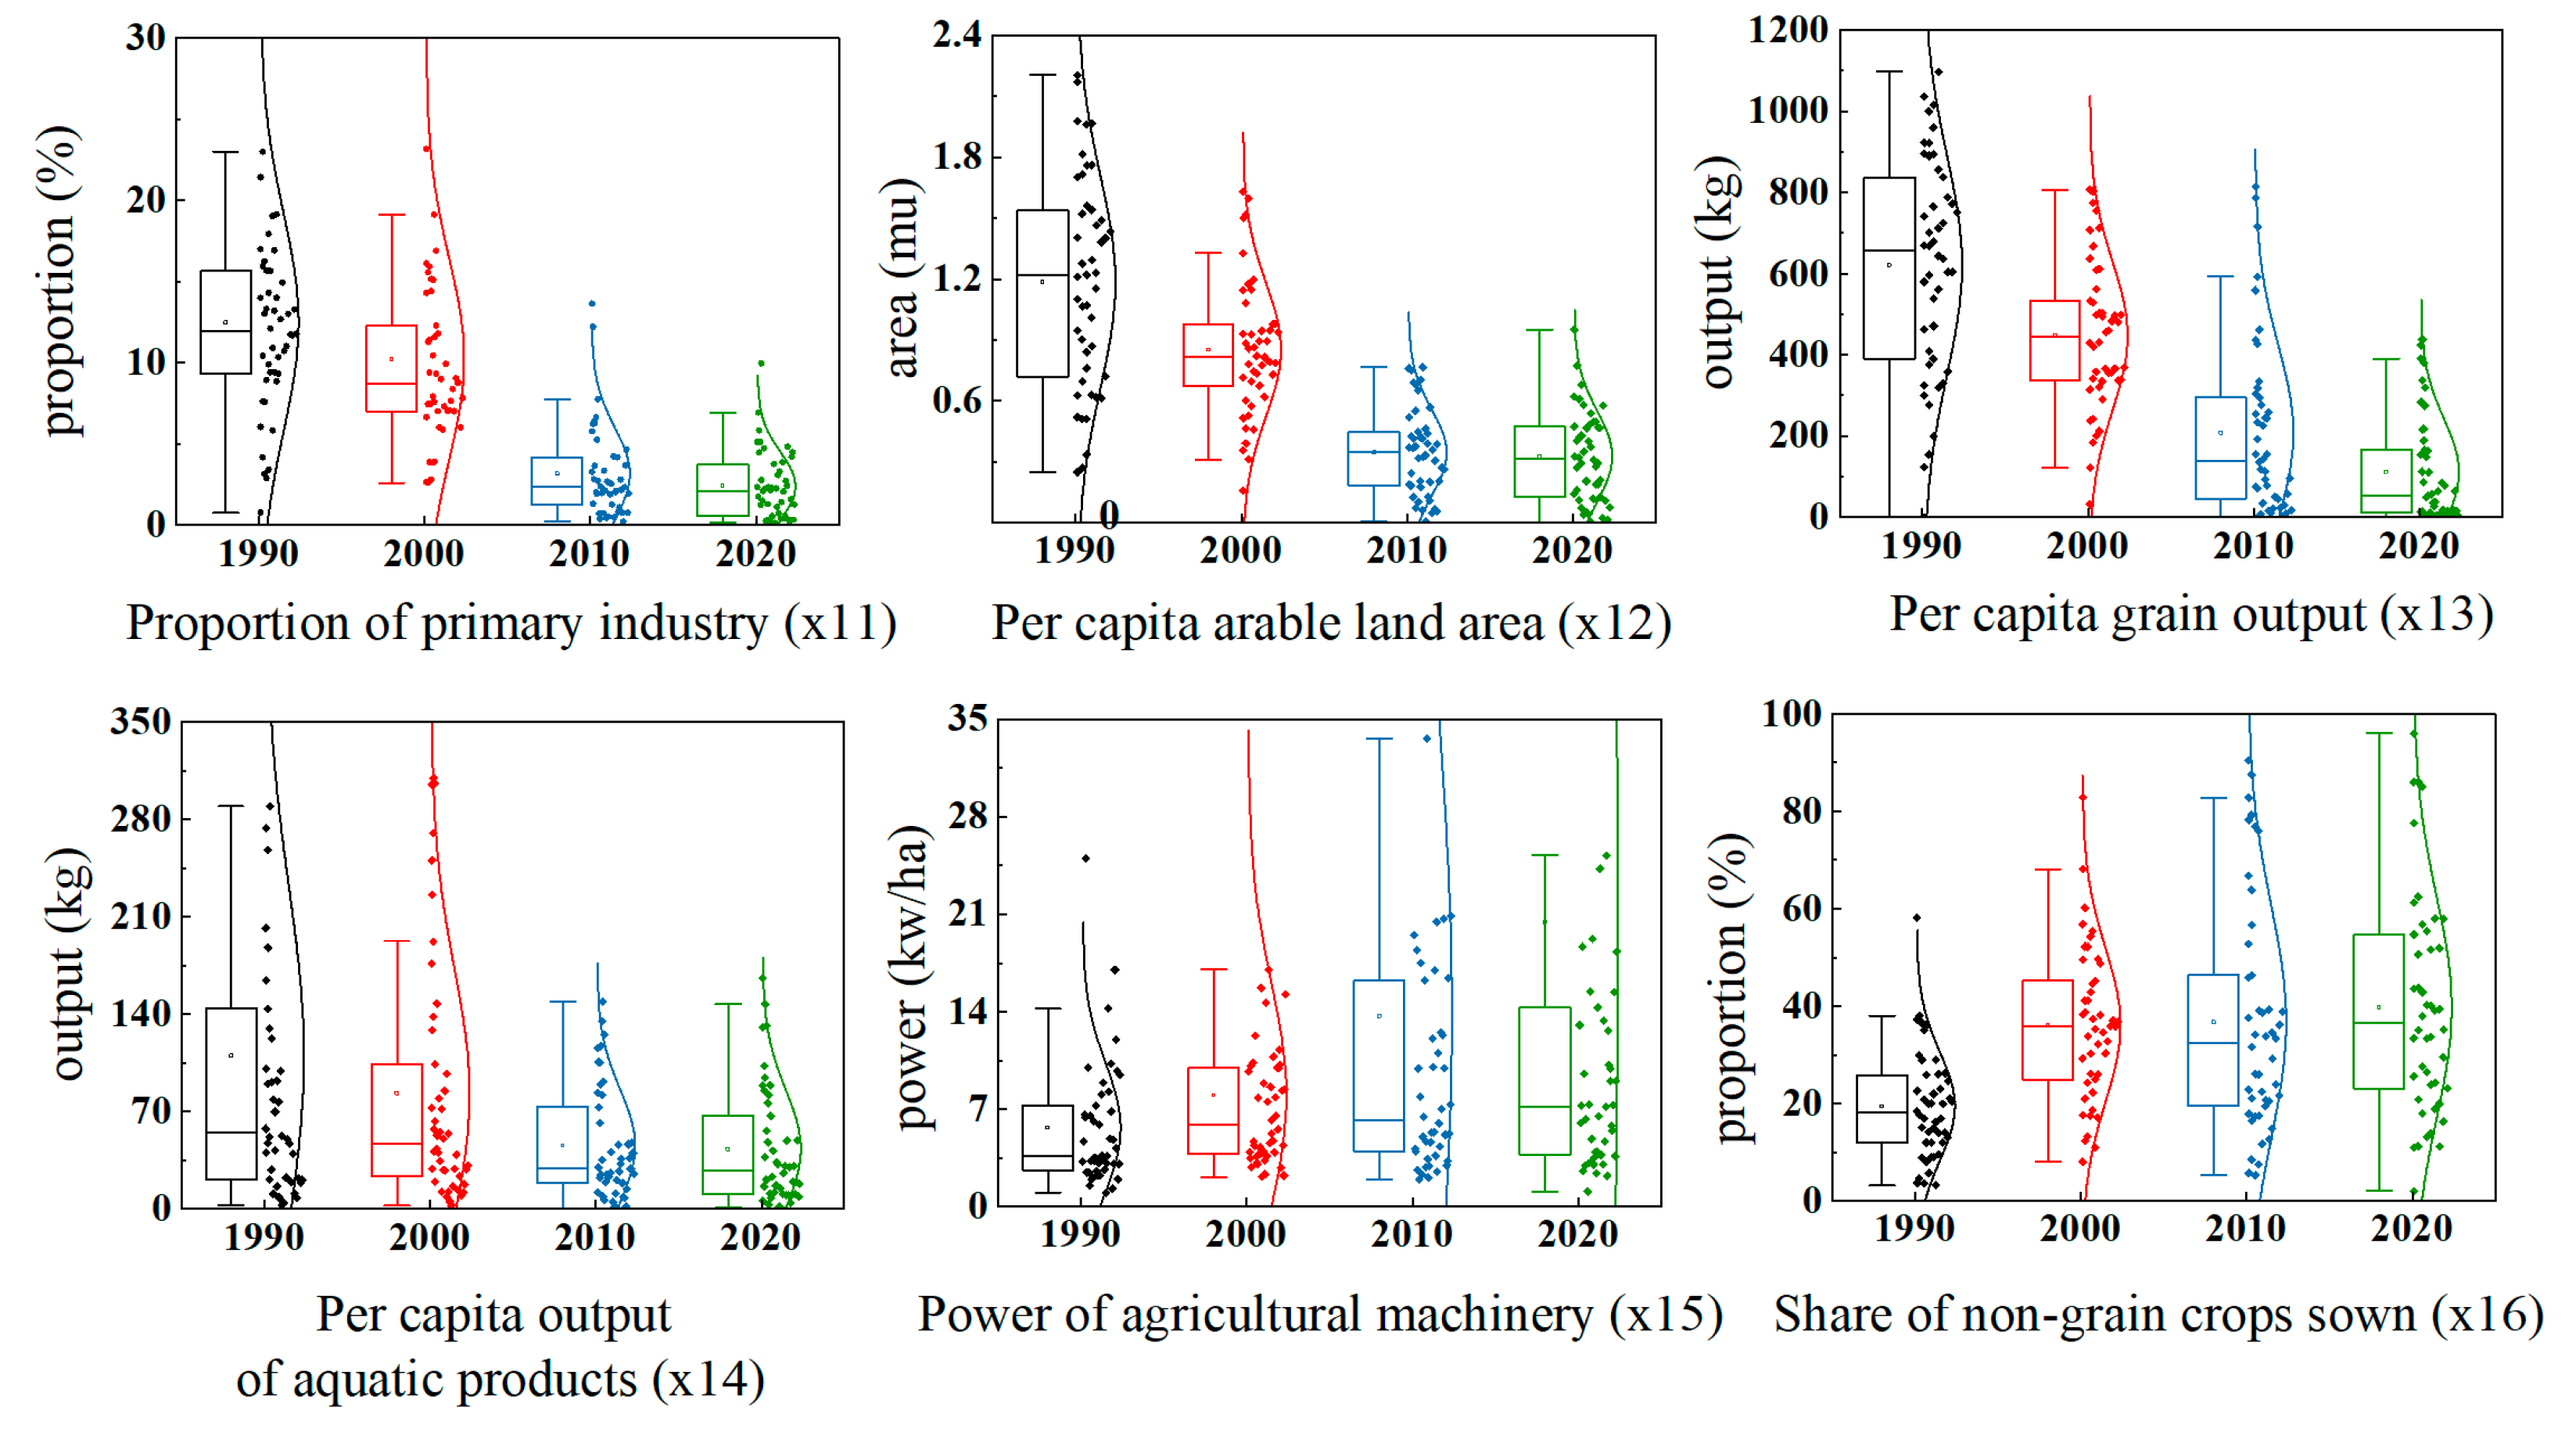
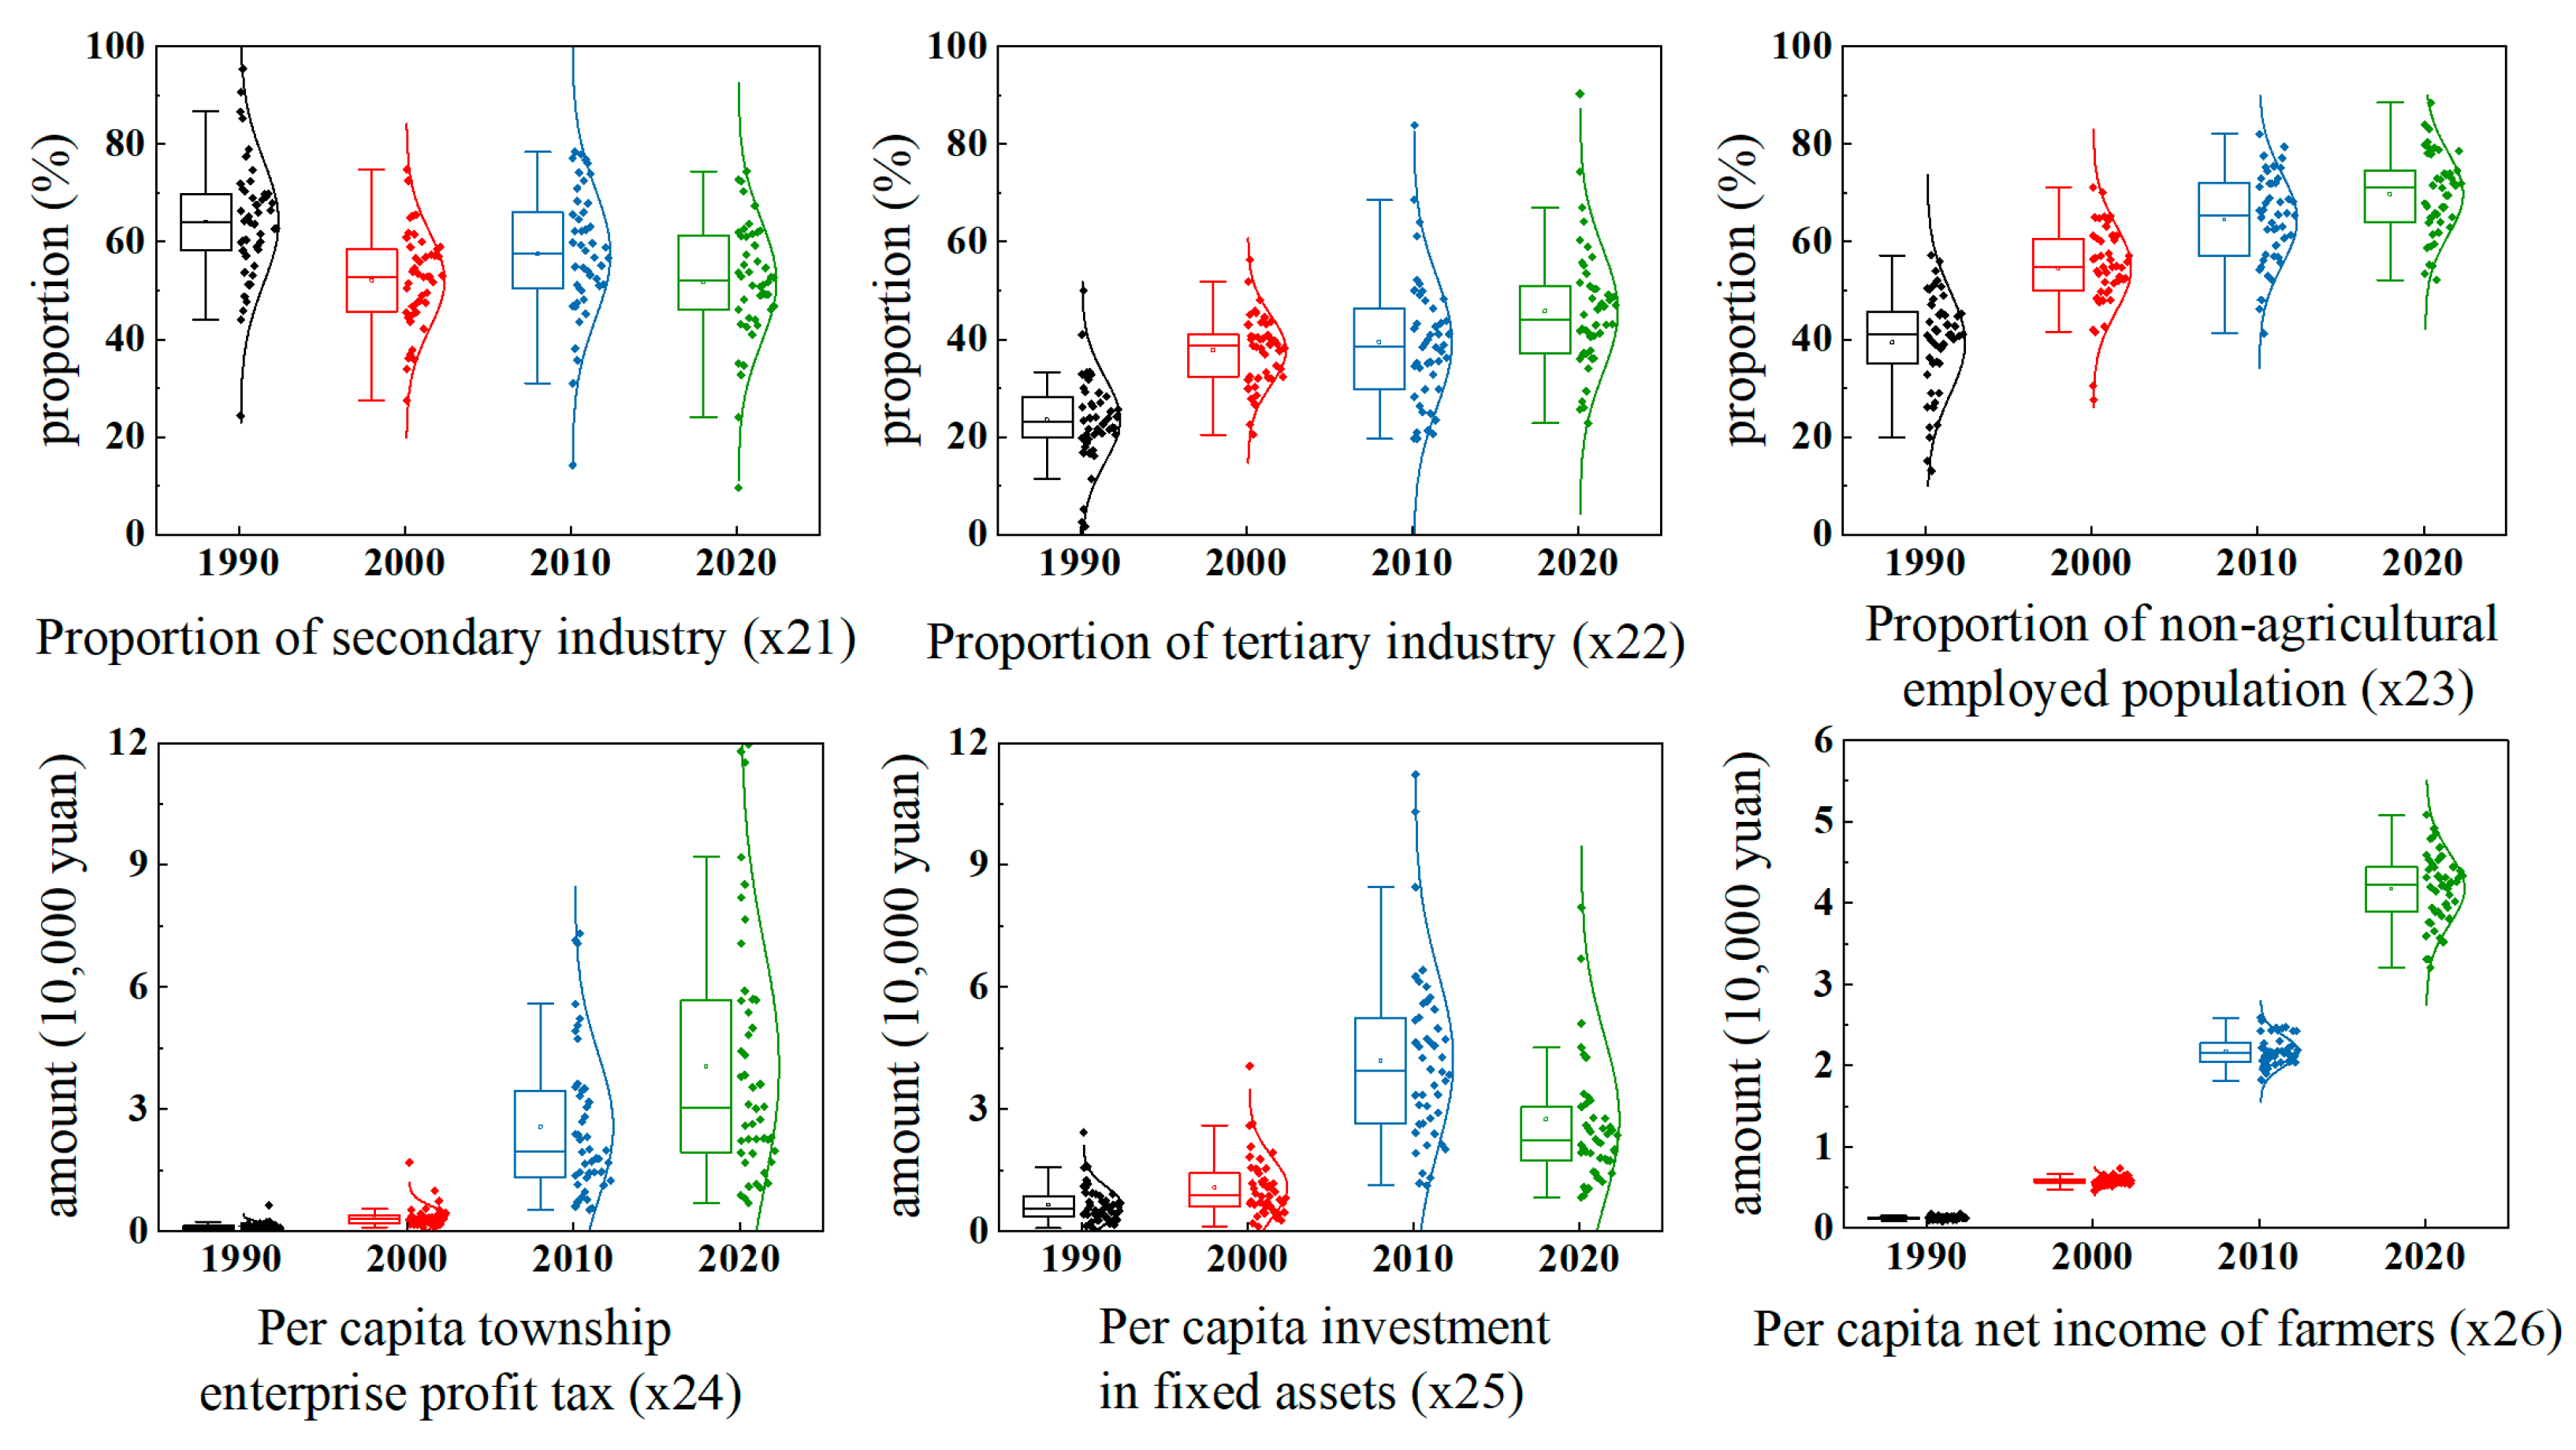
2.2.2. Evaluation Indices System

The evaluation object of this paper is the township unit, and the data at this level are not easy to obtain in the statistical yearbook, and the continuity of the indices statistics is affected due to the large period spanning from 1990 to 2020. Referring to the existing research results [25,26], 12 evaluation indices are selected for the rurality and urbanity indices (Table 1). Among the indicators of rurality, agricultural production is the main function of rural areas. It can be considered that the higher the proportion of primary industry in a place, the stronger its rurality. Similarly, per capita arable land area, per capita grain output, and per capita output of aquatic products are usually also positively correlated with rurality. The share of non-grain crops sown represents the degree of diversification of local agricultural production and reflects the regional agricultural characteristics and production advantages. The power of agricultural machinery indicates the level of intensification and mechanization of agricultural production, reflecting the agricultural production capacity.
Among the urbanity indicators, social progress has promoted the transformation and upgrading of the industrial structure, specifically manifested as the transformation from the primary industry to the secondary and tertiary industries, which can be measured by the proportion of the output value of the two major industries. The transformation of the industrial structure not only releases the vitality of regional economic development, but also creates more job opportunities, absorbs surplus agricultural labor force, and thereby increases the proportion of non-agricultural employed population. The per capita investment in fixed assets and the per capita township enterprise profit tax have also increased simultaneously. Social progress and policy reform have provided more welfare subsidies for rural areas and farmers, thereby significantly improving the net income of farmers.
In this paper, the Z-Score method is used to standardize the indices, and the method is as follows:
Z i j = x i j μ i σ i
where Z i j is the standardization index; x i j is the initial value of each indicator; μ i is the average value of a certain indicator; σ i is the standard deviation of a certain indicator; i is the number of indicators; and j is the ordinal number of the town unit.
Subsequently, we calculated the weights of the indices based on the entropy weight method and calculated the rurality and urbanality indices by weighting and summing the indices [27]. The method is as follows:
R ( U ) = i = 1 W i Z i j
where R represents the rurality index; U represents the urbanity index; and W i are the weights corresponding to each indicator.

2.2.3. Driving Factors Measurement

This paper uses the Geographically Weighted Regression (GWR) model to quantify and spatially analyze the influencing elements involved in rural transformation, and then refine and summarize the driving mechanisms. Compared with the traditional OLS model, the GWR model takes into account the issue of spatial effects and adds a spatial weight matrix to the linear regression model, which can more accurately demonstrate the spatial structural differentiation of local areas. The formula is as follows [28]:
Y i = β 0 ( u i , v i ) + k = 1 m β k ( u i ,   v i ) x i k + ε i
where Yi is the value of the dependent variable at location i; k is the number of independent variables; xik (k = 1,2…m) is the value of the independent variable at location i; (ui, vi) is the coordinates of the ith sampling point; εi is the random error term; β0(ui, vi) is the intercept term; βk(ui, vi) (k = 1, 2…m) is the coefficient of the kth regression analysis on the ith sampling point, which is a function of geographic location with the following formula:
β k ( u i , v i ) = [ X T W ( u i , v i ) X ] 1 X T W ( u i , v i ) Y , W i j = e x p [ ( d i j b ) 2 ]
where X and Y are the independent and dependent variable matrices, respectively; XT is the transpose matrix; W(ui,vi) is the spatial weight matrix, determined by the Gaussian function; b is the bandwidth, which controls the degree of smoothing of the regression model; and dij is the distance.

3. Research Results

3.1. Results of the Urban–Rural Dominance Evaluation

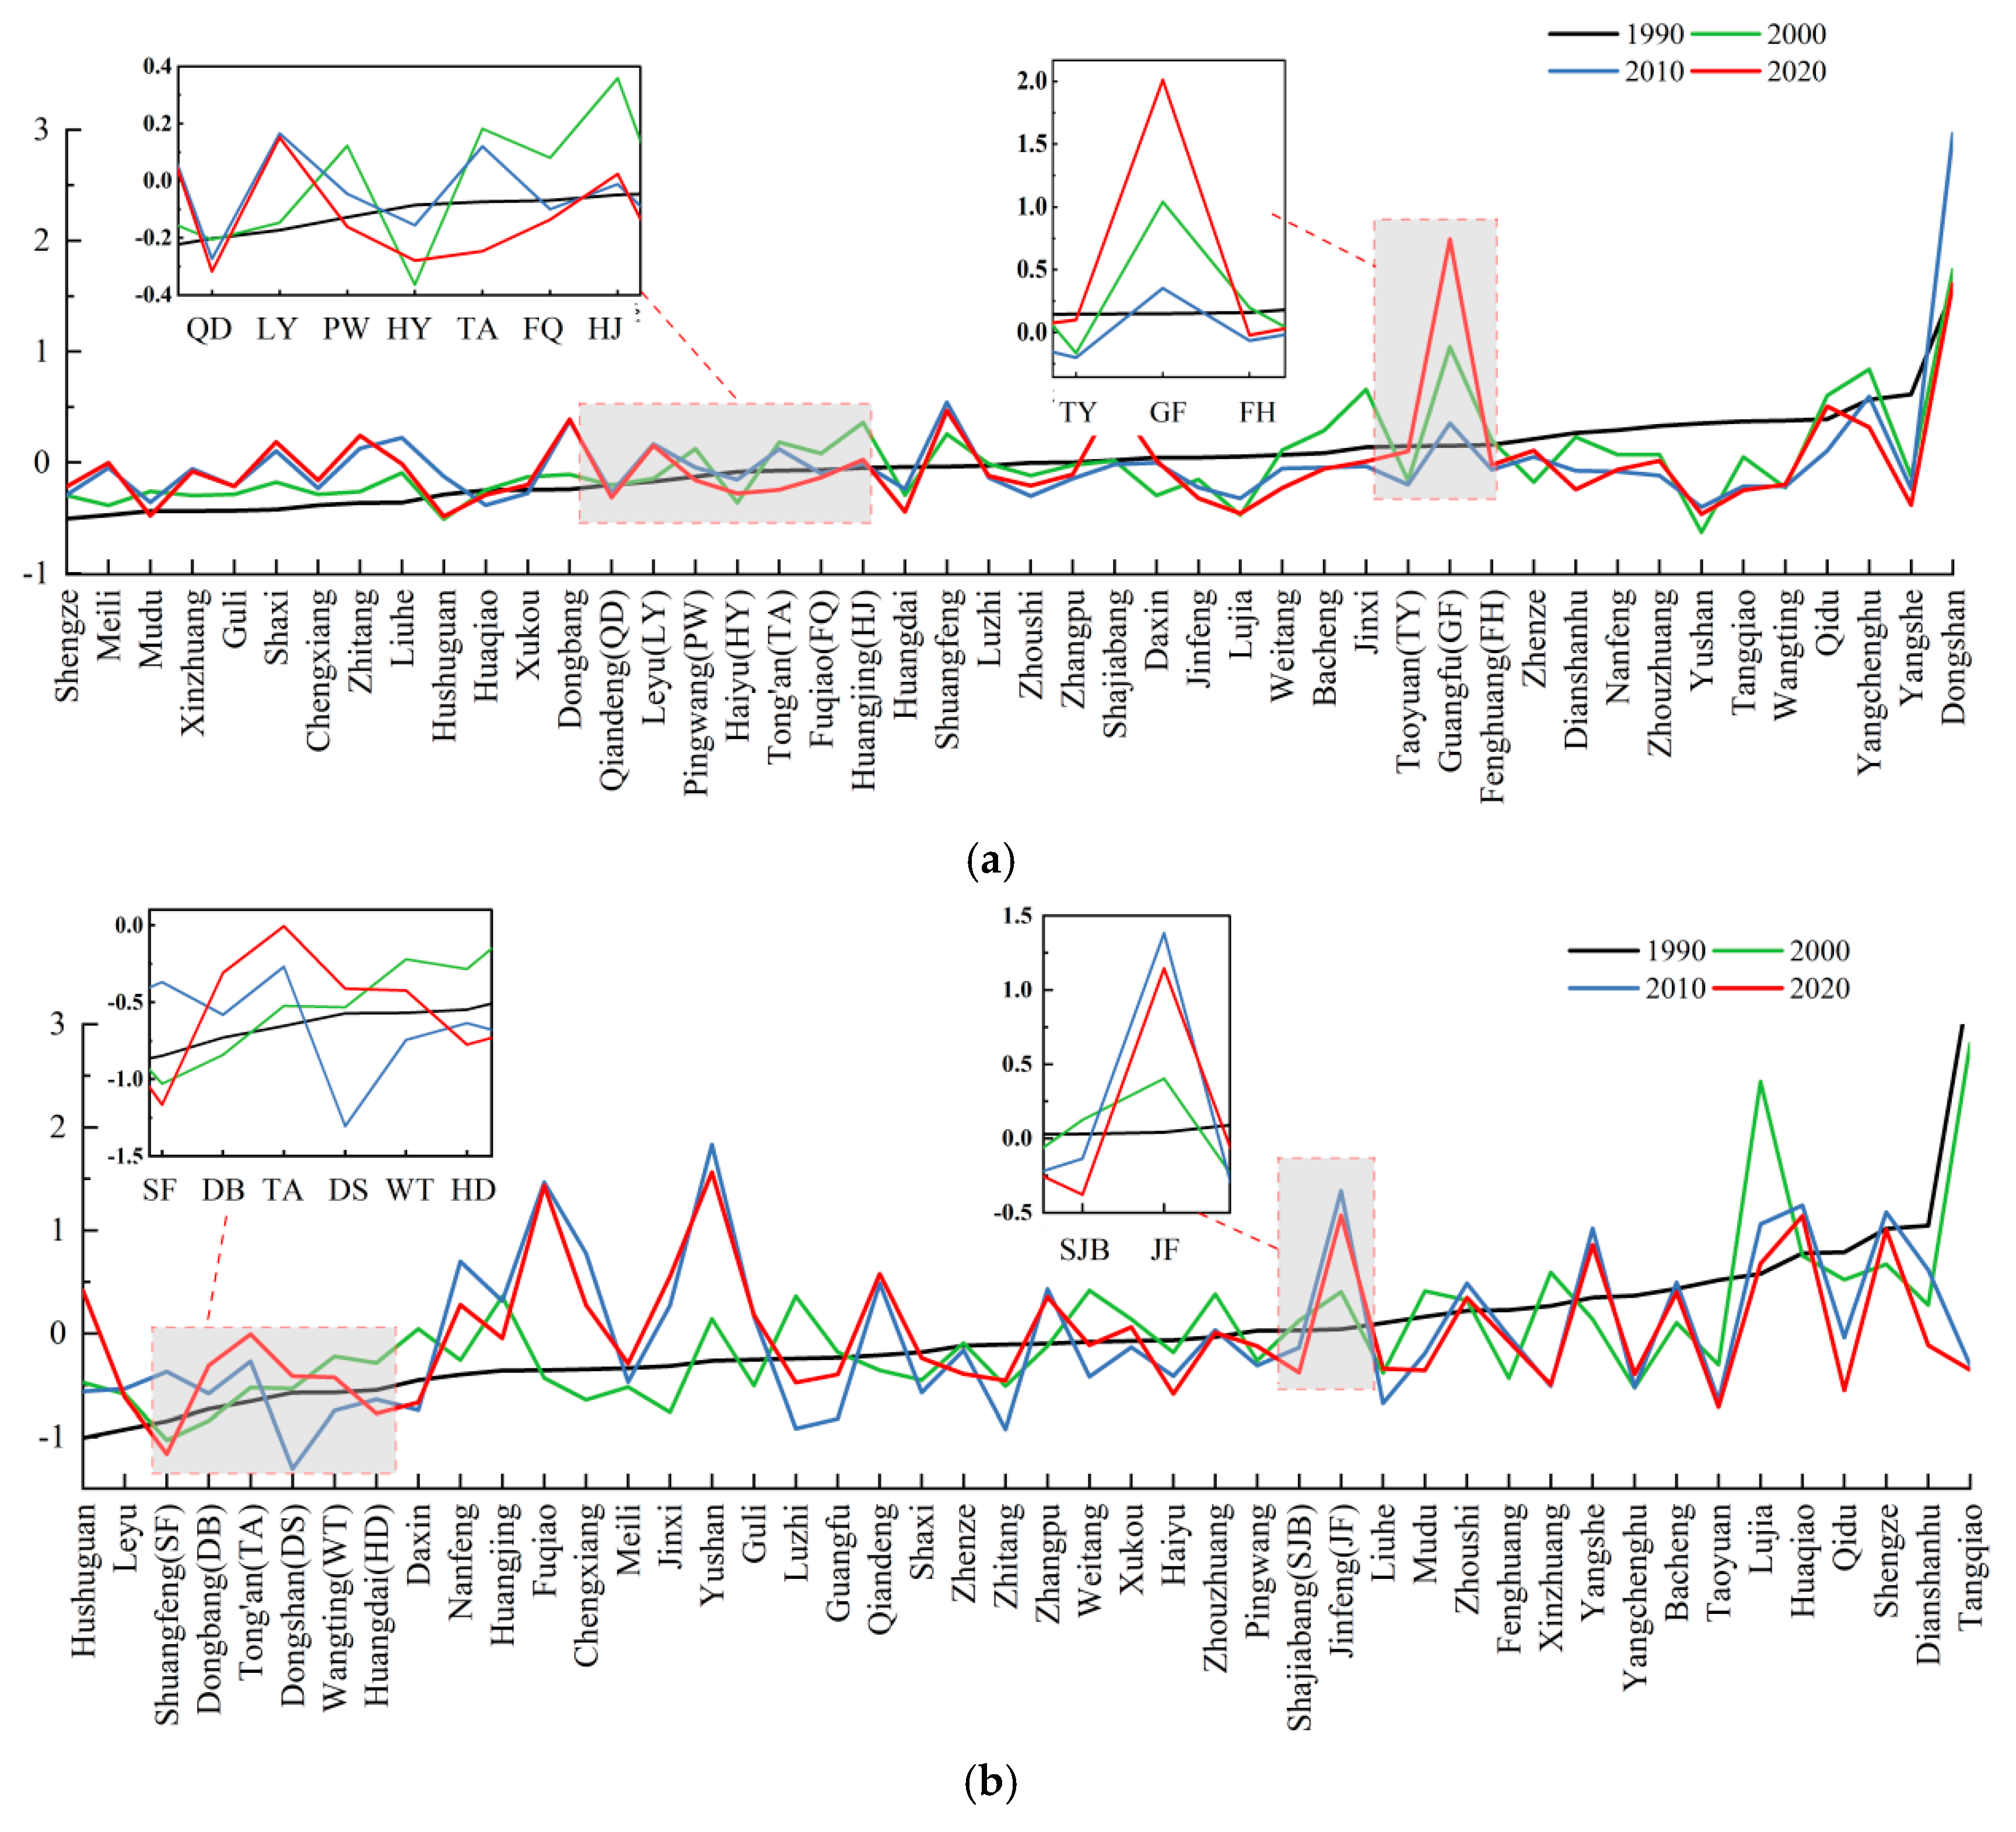
3.1.1. Chronological Change in Evaluation Indices

Since the 1990s, the contribution of primary production to the national economy in Suzhou has contracted rapidly, and the gap in primary production development between townships has narrowed. As shown in Figure 3, the indices of rurality in the 46 townships have generally declined, highlighted by the decline of the maximum value and the narrowing of the interquartile spacing on the box plot, especially in the indices of per capita arable land area (x12), per capita grain output (x13), and aquatic product output (x14). Under the combined effect of urban and rural push and pull, a large number of rural population migrated to towns and cities, and the shrinking of the agricultural labor force has, to some extent, pushed the transfer of agricultural land [29], which led to the mechanization of large-scale production in agriculture. The progress of agricultural technology, especially the extensive use of new agricultural machinery, and the policy support provided by the government, such as subsidies for the purchase (leasing) of agricultural machinery and inputs for agricultural science and technology innovation, has also promoted the development of modern agriculture in Suzhou, with the level of land-per capita agricultural machinery power rising. In order to meet market demand, farmers have also further adjusted their planting structure to agricultural products with higher comparative returns, which has led to an increase in the ‘non-grain conversion’ of arable land.
Unlike the changes in the rurality indices, the urbanity indices of Suzhou are mostly on an upward trend (Figure 4). After the 1990s, Suzhou, based on its location advantage, seized the opportunity of Shanghai Pudong development [30], and promoted the development of foreign investment and private economy based on the industrial parks, which led to a rapid rise in the per capita township enterprise profit tax (x24). Since 2000, Suzhou has taken the upgrade of the industrial structure as a key hand to gradually shift the focus to high-tech industries and strategic emerging industries [31]. It has gradually shifted its focus to high-tech industries and strategic emerging industries, and introduced various support policies including financial subsidies, tax incentives, land supply, enterprise technical guidance and training, etc. [31], which provide a strong engine for the development of tertiary industries. During the past three decades, although the proportion of secondary industry (x21) in townships has declined, it is still dominant. The proportion of tertiary industry (x22) has been increasing, and the optimization and upgrading of industrial structure has led to an increase in the proportion of non-agricultural employed population (x23). The superimposed effects of the increase in the total social economy, the introduction of government policies to benefit farmers, and the process of agricultural modernization have not only promoted the transformation and upgrading of the rural economy but also greatly improved the living standards of farmers. By 2020, the urban–rural income ratio in Suzhou was 1.85, lower than the 2.19 in Jiangsu Province and the 2.56 in the whole country during the same period, and the urban–rural wealth gap has further narrowed.

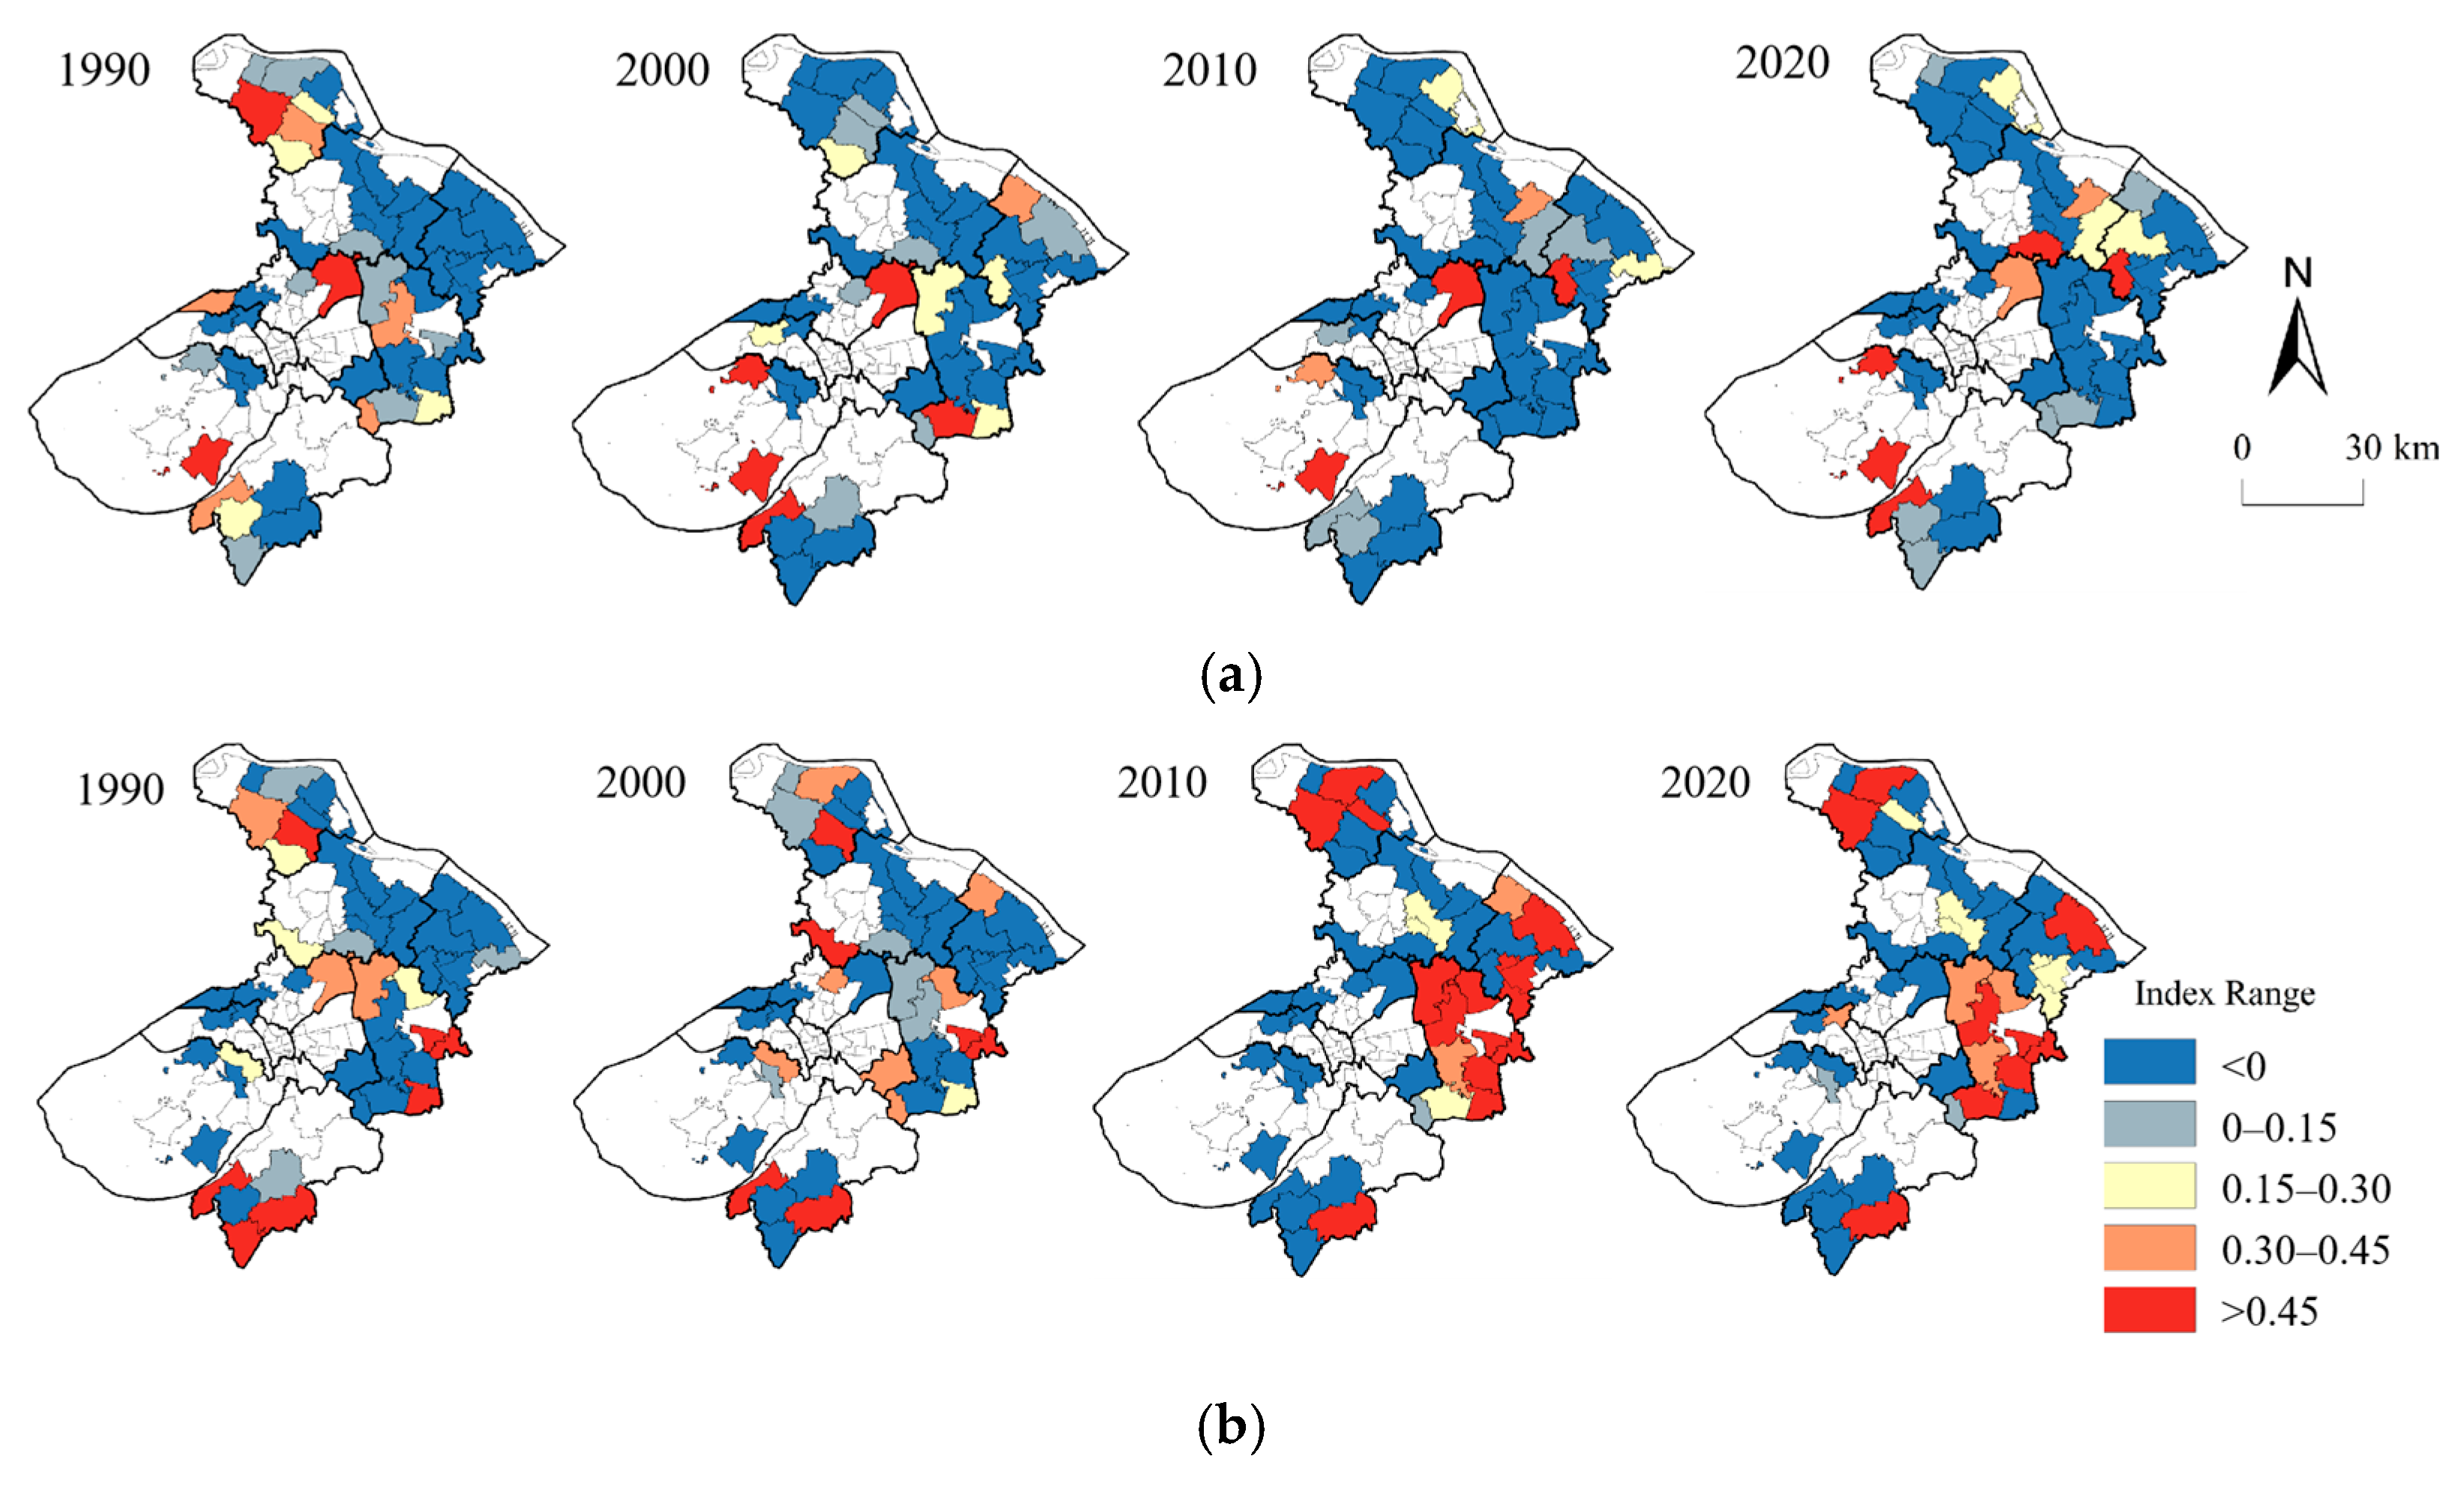
3.1.2. Spatial and Temporal Evolution of Urban–Rural Dominance

The changes in the rurality and urbanity indices of the 46 townships over the four years are shown in Figure 5, by arranging the indice values for 1990 in ascending order and then plotting the corresponding folded directions for the other three years. Firstly, the indice changes all show a clear fluctuation trend, and the fluctuation increases with time, and the townships with lower indices in the early years develop less fluctuation than the ones with higher indices in the later years. For example, the rurality indice changes in townships such as Qiandeng and Haiyu are smaller than those in towns such as Guangfu, and the urbanity indice changes in towns such as Tong’an and Wangting are smaller than those in towns such as Jinfeng, whereas the fluctuation of the urbanity indice is stronger than that of rurality on the whole. From 1990 to 2020, the fluctuation range of the indice of townships in the bottom 50% of the rurality indice is from 0.033 to 0.631, with an average strength of 0.264. Meanwhile, the fluctuation range of the indice of townships in the top 50% of the rurality indice is from 0.027 to 1.862, with an average strength of 0.397. The urbanity indice is also the same, the top 50% fluctuating in the range of 0.044 to 1.828, with an average strength of 0.535. The bottom 50% ranges from 0.009 to 3.785, with an average intensity of 0.621.
Secondly, the changes in the indices all show a trend of rising fluctuations at low levels and falling fluctuations at high levels, reflecting a narrowing of the indice gap between townships as a whole. At the same time, most townships have similar trends in indice changes in 2010 and 2020, indicating that the dominant urban–rural changes in the latter period are deeply influenced by the earlier period. After experiencing the drastic transformation brought about by industrialization and urbanization, the development pattern of most townships has basically settled since 2010, with more than 80% of townships experiencing a change in the rurality indice of less than 0.2, and 50% of townships experiencing a change in the urbanity indice of less than 0.2 in 2010–2020, with an average fluctuation of only 0.178 and 0.270 for both. The above analysis shows that after the rapid transformation period from 1990 to 2010 period of rapid transformation, the rurality and urbanity indices of each township have fluctuated to different degrees, while the development mode of the townships has gradually taken shape after 2010, and the two indices have remained in a relatively stable state. At the same time, the order of the indices of some townships was replaced during the transition process. For example, the urbanity indice of Ba Township in 1990 was as high as 0.434 (8th), much higher than that of Yushan Township, which was −0.264 (31st), but after a large fluctuation in 2010, the indice of Ba Township in 2020 was only 0.397 (11th), while Yushan Township rose to 1.564 (1st).
The spatial distribution pattern of rural and urban indices is shown in Figure 6. In 1990, there was a certain similarity in the spatial distribution of the two indices, and the high-value areas were mainly distributed in Zhangjiagang along the Yangtze River in the north, Xiangcheng in the middle, and Wuzhong and Wujiang in the south near Taihu Lake. By 2020, the high-value area of the rural indice shifted from Zhangjiagang to Changshu and Taicang, and Wuzhong and Wujiang still showed high-value agglomeration. Except for some of the high-value areas of the urban indice that remained in Zhangjiagang, most of them moved to Taicang, Kunshan and Wujiang, which border Shanghai in the east. The spatial and temporal evolution of urban–rural dominance maps the differentiated transformation paths of townships. Zhangjiagang and Kunshan, as the core areas of secondary development, the former with convenient shipping conditions and the latter with favorable locational conditions, both show a decline in rurality and a rise in urbanity. Wujiang’s early urbanity is more prominent in the city, but its core industry is dominated by the silk textile industry, and in recent years, the advantage is not obvious in the industrial competition with Nantong, Huzhou and other neighboring regions, and it is difficult to sustainably drive the economic growth of the whole region, and by 2020, only Shengze Town showed a dominant urbanity. Changshu, Taicang, along the river plain area, laid out a large number of permanent basic farmland, agricultural modernization level continues to enhance to drive the rurality enhancement. Wuzhong and Wujiang are located in the water town of superior river and lake resources. In recent years, water environment management has greatly improved the aquaculture conditions, coupled with the rise in rural e-commerce, to further broaden the sale of aquatic products, local agricultural products to further expand the scale of production of rural rurality directly enhance the level.

3.2. Multiple Paths to Rural Transformation

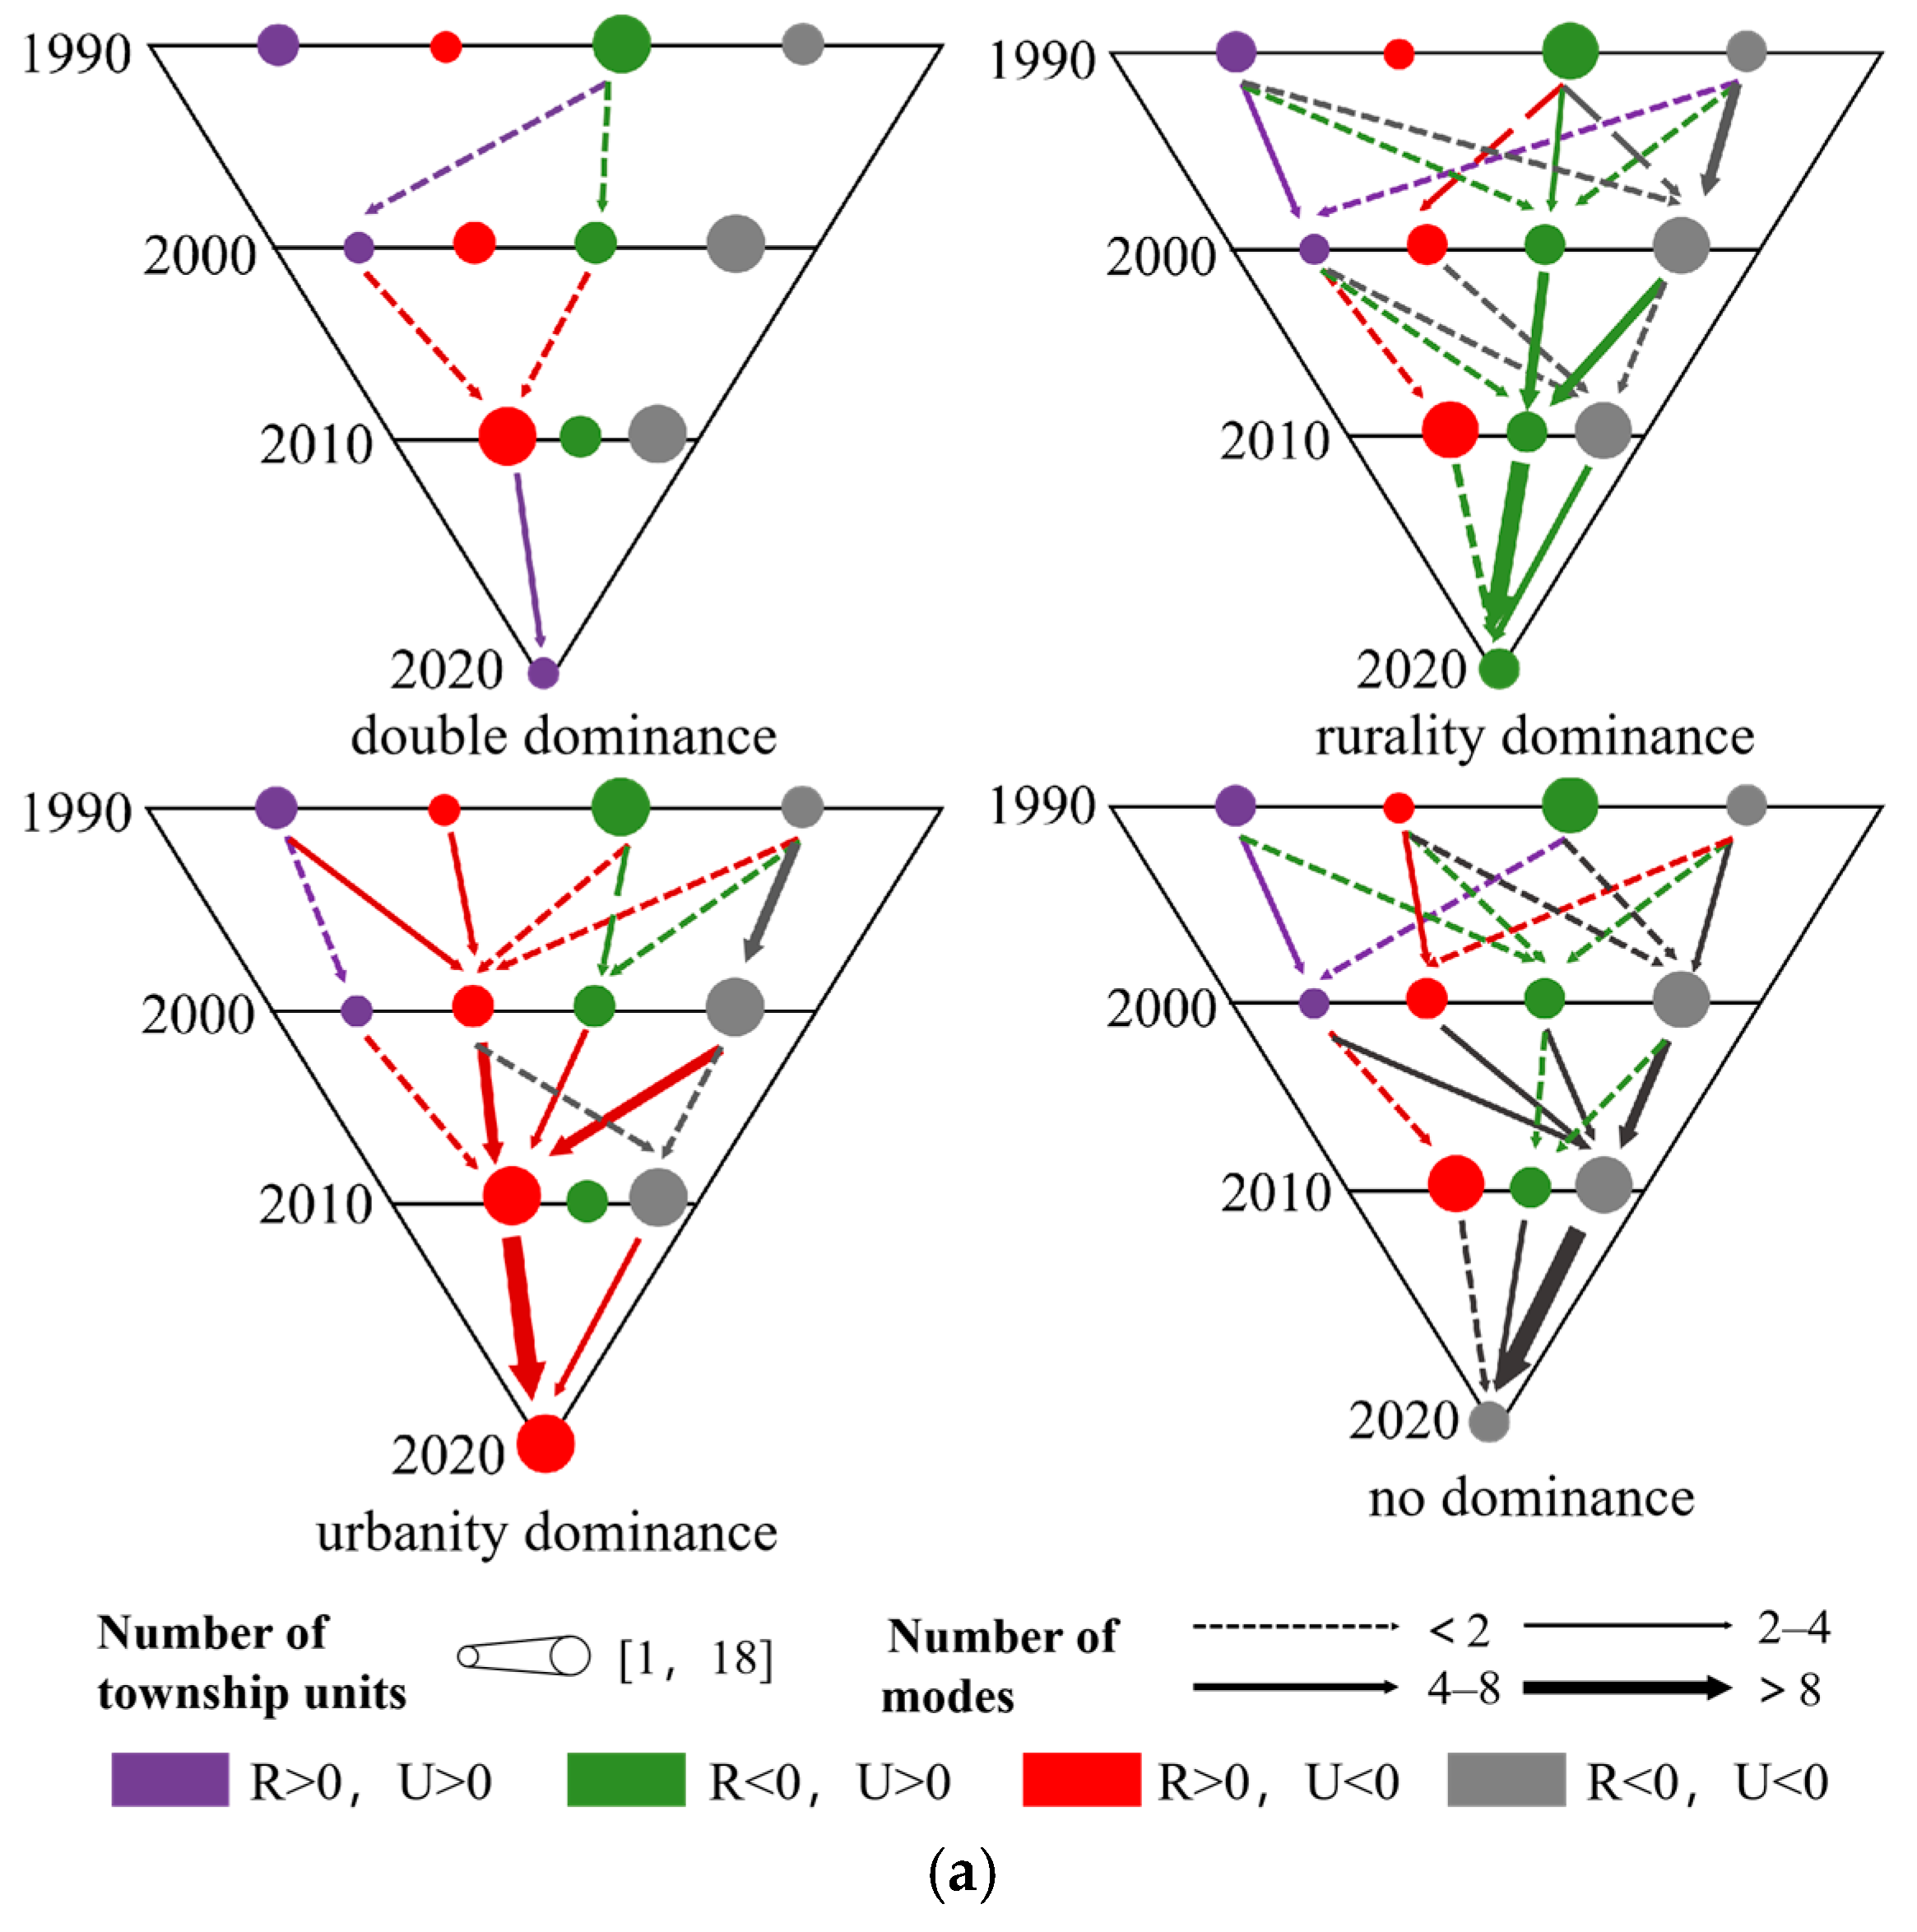
3.2.1. Transformation Patterns at Different Times

The rurality and urbanity indices for the 46 townships are placed in the planar coordinate system shown in Figure 7a, with the horizontal and vertical axes showing the range of values for the rurality and urbanity indices, respectively. The distribution of the rurality and urbanity indices for the townships in 1990 is relatively concentrated, with only a few extreme values present. The proportion of single dominance of rurality (R > 0, U < 0) is 22%, more than the 15% of urbanity (R < 0, U > 0). A total of 24% of the townships with both urbanity and rurality indices are above the average, which belongs to the case of double dominance (R > 0, U > 0). However, the proportion of townships with no dominance (R < 0, U < 0) reaches up to 39%, which belongs to the general class of villages and townships that lack distinctive features. In this period, the advantage of the Sunan model was more obvious, and the urbanity of some townships had increased, but had not yet been absolutely dominated. In spite of the impacts of industrialization and urbanization, many townships were still dominated by rurality because of their deep agricultural roots. In 2000, the indices of rurality and urbanity were slightly expanded along the horizontal and vertical axes, and the ratio of urbanity-dominated townships reached 26%, which exceeds that of the rurality-dominated townships (22%). The number of townships without dominance and double dominance has been slightly increased. During this period, the transition from the Sunan model to the new Sunan model, Suzhou shifted from an ‘endogenous’ development model dominated by township enterprises to an externally oriented economy represented by the ‘three externalities’ (foreign trade, foreign economy, foreign trade, and foreign investment) [32], supported by large-scale industrial parks. The development of secondary and tertiary industries has greatly promoted the urbanity of townships, resulting in the number of urbanity-led townships exceeding the number of rurality-led townships for the first time, and the contraction of the rurality and urbanity indices on the horizontal axis was more significant in 2010, which manifested an elliptical pattern of the gap between the urbanity indices widening and the gap between the rurality indices narrowing. The proportion of townships with a single dominance of urbanity and rurality further expanded to 39% and 26%, with increased differentiation between townships. At this stage, urbanity-led townships continue to absorb the dividends brought by the new Sunan model, while many places have seen the first results of specialized and modern agricultural development models under the support of urban–rural integration, cultural and tourism integration, and other policies, and the transformation path of townships is taking shape. By 2020, urbanity-led townships still accounted for 35% of the total, with rurality-led and non-led townships each accounting for 30% of the total, and the overall pattern of urban and rural dominance continued as it did in 2010.
The transformation of urban–rural dominance relations in townships during the 30-year period and the proportion of modes in different periods are shown in Figure 7b,c. In the first 10 years, the stabilization mode of transformation reaches 56%, and the urban–rural dominance of most townships maintains the original situation, with the transformation between no dominance being the most prominent. The weakening, enhancement and exchange modes account for only 20%, 13% and 11%. In the middle decade, the proportion of weakening and enhancement modes expanded to 35% and 20%, while the proportion of stabilization mode declined to 37%, reflecting that the townships are moving towards differentiated development, with special features and heterogeneity gradually coming to the fore. In the weakening mode, the number of townships in which urbanity dominance becomes no dominance is the highest, followed by the number of those in which dual dominance becomes urbanity dominance. In the enhancement mode, the number of no dominance shifting to rurality dominance is the highest, followed by shifting to urbanity dominance. In this phase, urbanity dominance replaced no dominance as the main scenario of urban–rural dominance in township units. In the last 10 years, the main body of all four transformation modes was dominated by the stabilization mode, which accounted for 78% of the total, while the weakening and enhancement modes declined to 7% and 15%. A small proportion of these townships transformed from no dominance to a single dominance of rurality or urbanity. The above transformation of urban–rural dominance shows that rural transformation is a complex process, with more than 40% of the townships under the influence of the Sunan model in the first 10 years displaying weakening, enhancement, and exchange transformation modes. In the middle 10 years, under the role of the new Sunan model, the differentiation of townships has further intensified, with the non-stabilization mode accounting for more than 60%. And in the last 10 years, the stabilization mode has predominated, although some townships still display the transformation mode under the guidance of the policy of rural revitalization or a new type of urbanization in China.

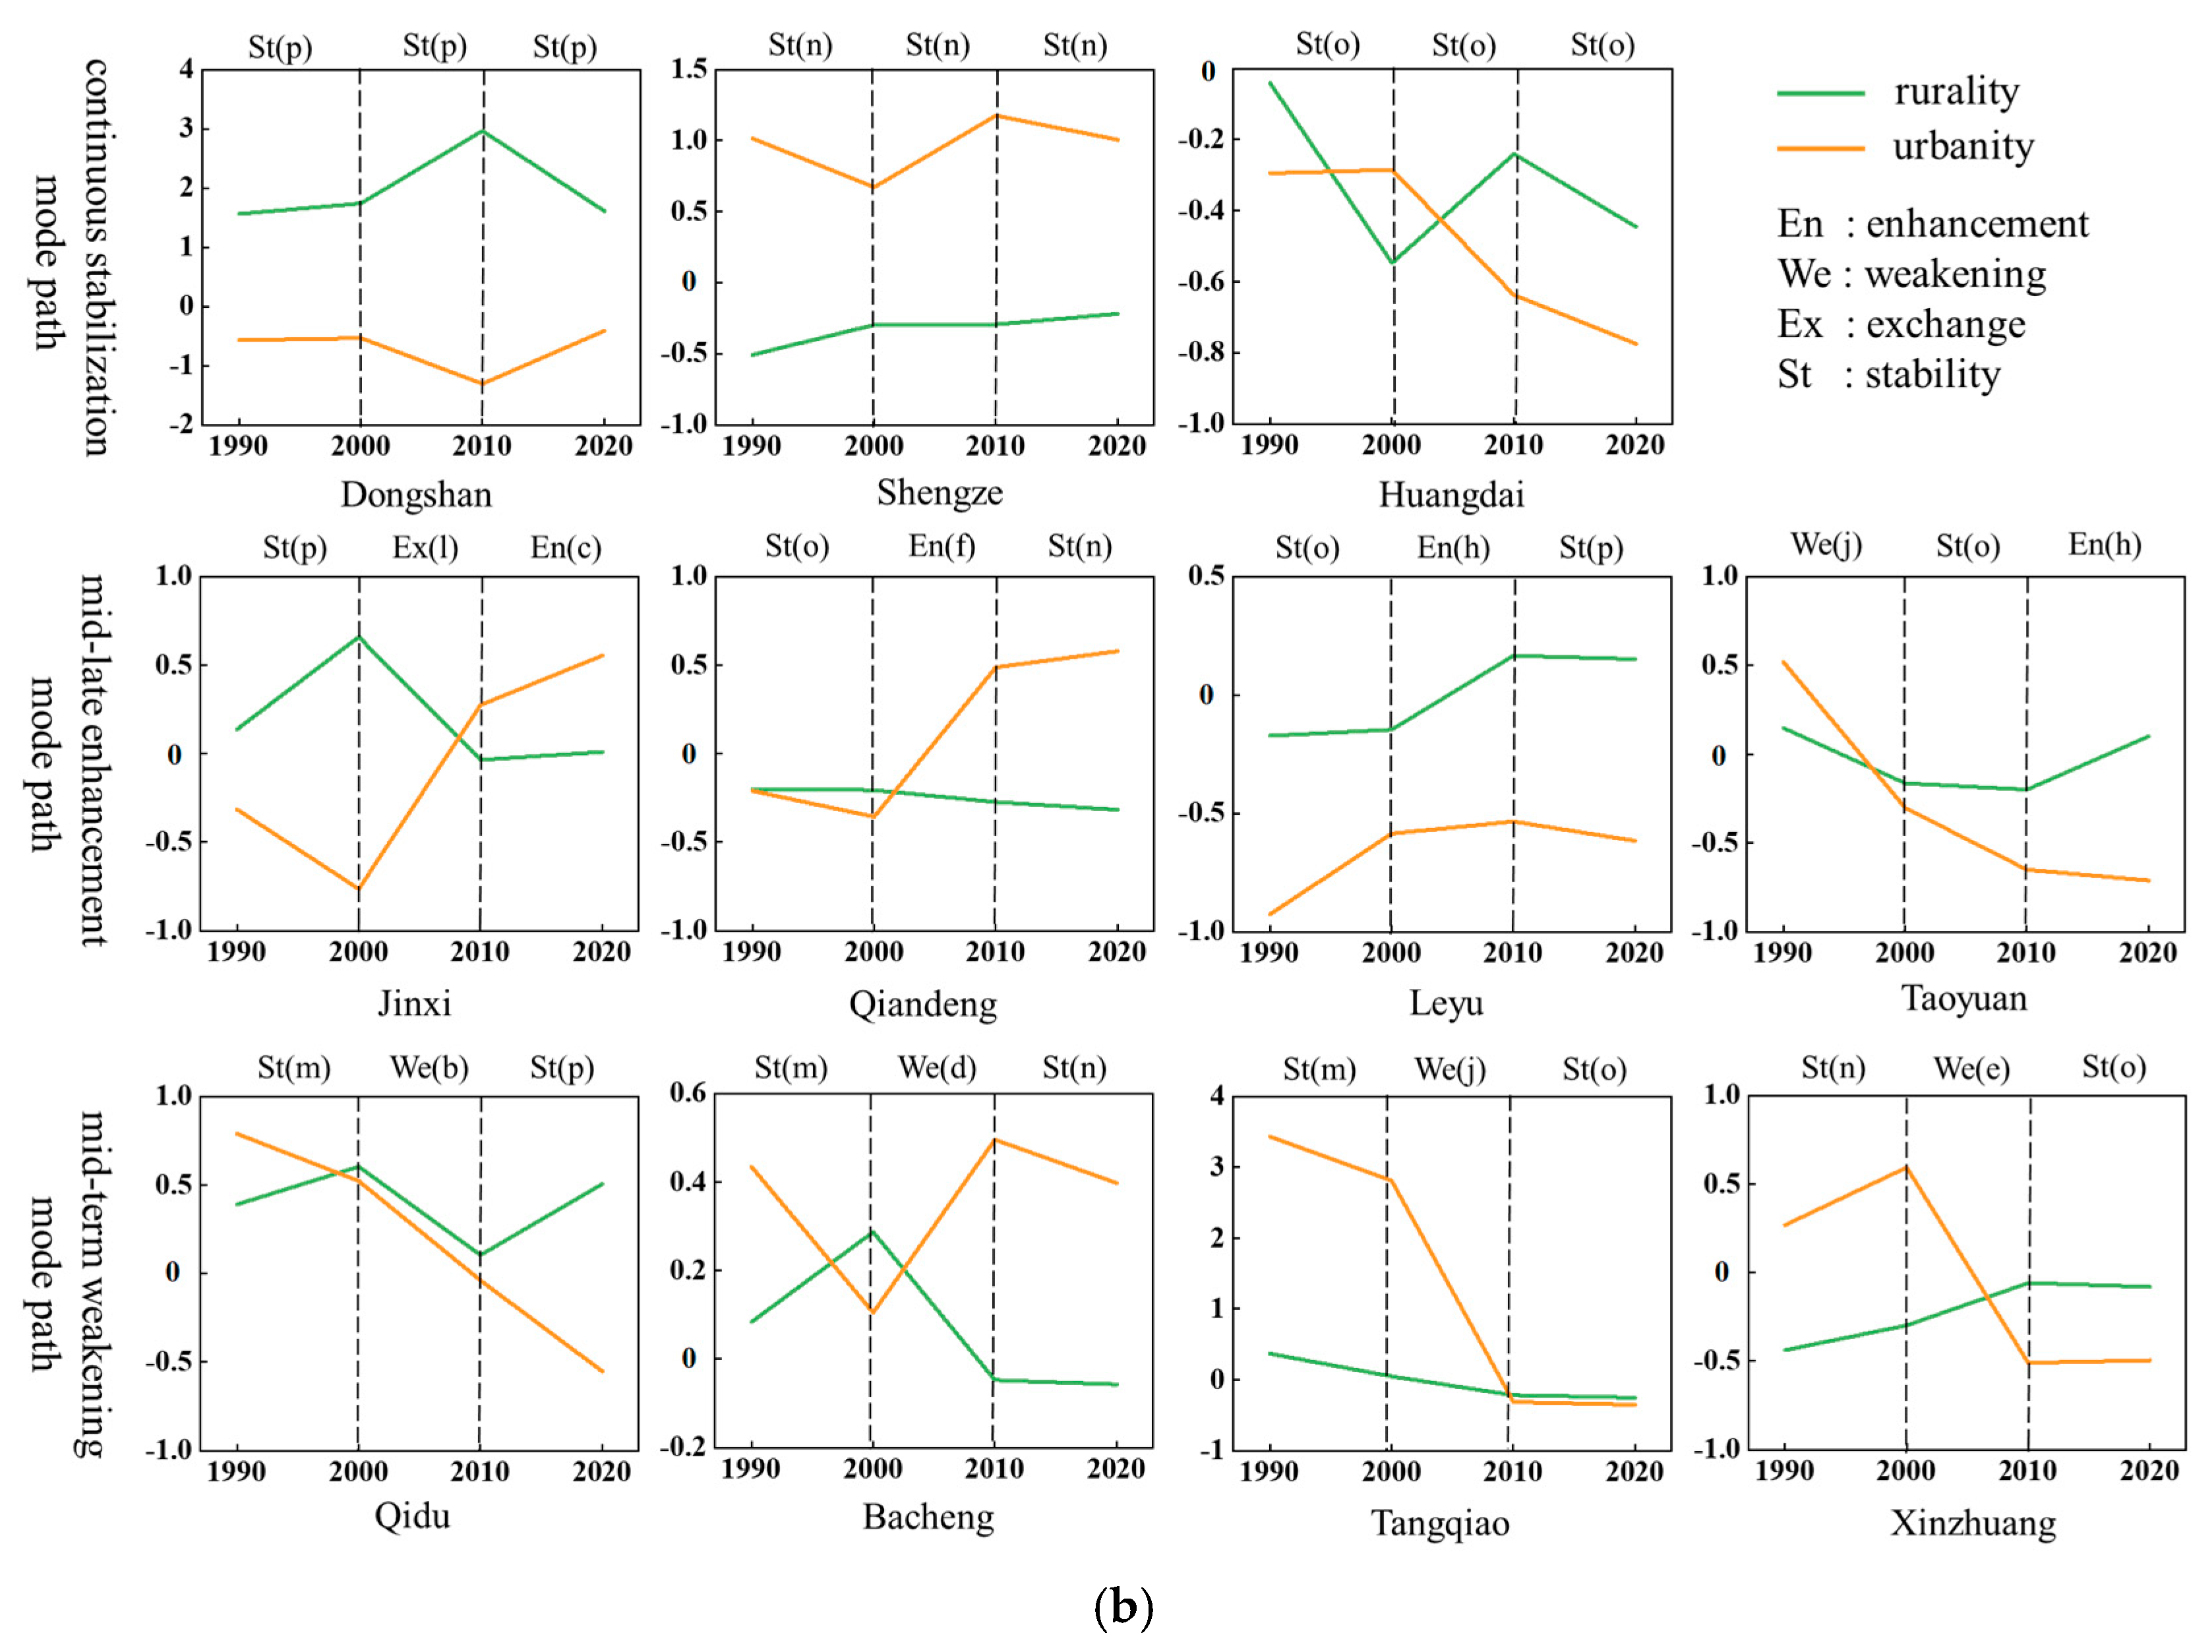
3.2.2. Multiple Transformation Paths

According to the four types of rural–urban dominant scenarios in 2020, the rural transformation paths of Suzhou is plotted as shown in Figure 8a, with the number of townships of dominant types in each year indicated by circles of different sizes, and the difference in the number of different transformation modes between years indicated by arrows of different thicknesses. It is clear that the transition modes in the first and middle 10 years are more complex, while the transition modes in the last 10 years are dominated by the stabilization mode for the three types of scenarios: rurality dominance, urbanity dominance, and no dominance. The following three main transition paths can be summarized by sorting out the transition paths of the four different dominant scenarios (Figure 8b).
1. Continuous stabilization mode path. As the name suggests, the townships in this transformation path have a stabilization mode in 1990–2000, 2000–2010, and 2010–2020, i.e., the dominant situations of rurality and urbanity have not switched in the three time periods. Typical townships include Dongshan Township in Wuzhong with single dominance of rurality (stability mode p-p-p for the three time periods according to Figure 2), Shengze Township in Wujiang with single dominance of urbanity (stability mode n-n-n), and Huangdai Township in Xiangcheng with no dominance (stability mode o-o-o), where the above-mentioned townships fluctuated in the indices of rurality and urbanity during the three time periods, but did not undergo any mode change.
2. Mid-late enhancement mode path. This type of township shows an enhancement mode in the middle or late stage, in which enhancement is rurality-dominated townships such as Leyu Township of Zhangjiagang (stabilization mode o—enhancement mode h—stabilization mode p) and Taoyuan Township of Wujiang (weakening mode j—stabilization mode o—enhancement mode h), and urbanity-dominated townships are enhanced, such as Jinxi Township of Kunshan (stabilization mode p—exchange mode l -enhancement mode c) and Qiandeng Township (stabilization mode o—enhancement mode f—stabilization mode n). Although the rurality and urbanity indices of the above-mentioned townships have changed during the period of the southern Jiangsu model, they have not changed or still maintained their original dominance, and the rural or urban dominance has been further strengthened since the new southern Jiangsu model, especially the rural revitalization strategy.
3. Mid-term weakening mode path. The common characteristic of this type of townships is that they show a stabilization mode in the early and late stages, and a weakening mode only in the middle stage, which fully explains that their urban–rural indices had a certain quantitative change during the Sunan model period, but the qualitative change took place in the period of the new Sunan model, and the original dominance of rurality and urbanity was weakened to only retain one of them or to become non-dominant, and the dominance has been maintained since then. Throughout the transformation process, typical townships such as Qidu Township of Wujiang (stabilization mode m—weakening mode b—stabilization mode p), which changed from double dominance to single dominance in rural areas, Bacheng Township of Kunshan (stabilization mode m—weakening mode d—stabilization mode n), and Tangqiao Township of Zhangjiagang (stabilization mode m—weakening mode j—stabilization mode o), which became non-dominant, as well as Xinzhuang Township of Changshu, whose single dominance in urbanity changed to non-dominance (stabilization mode n—weakening mode e—stabilization mode o).

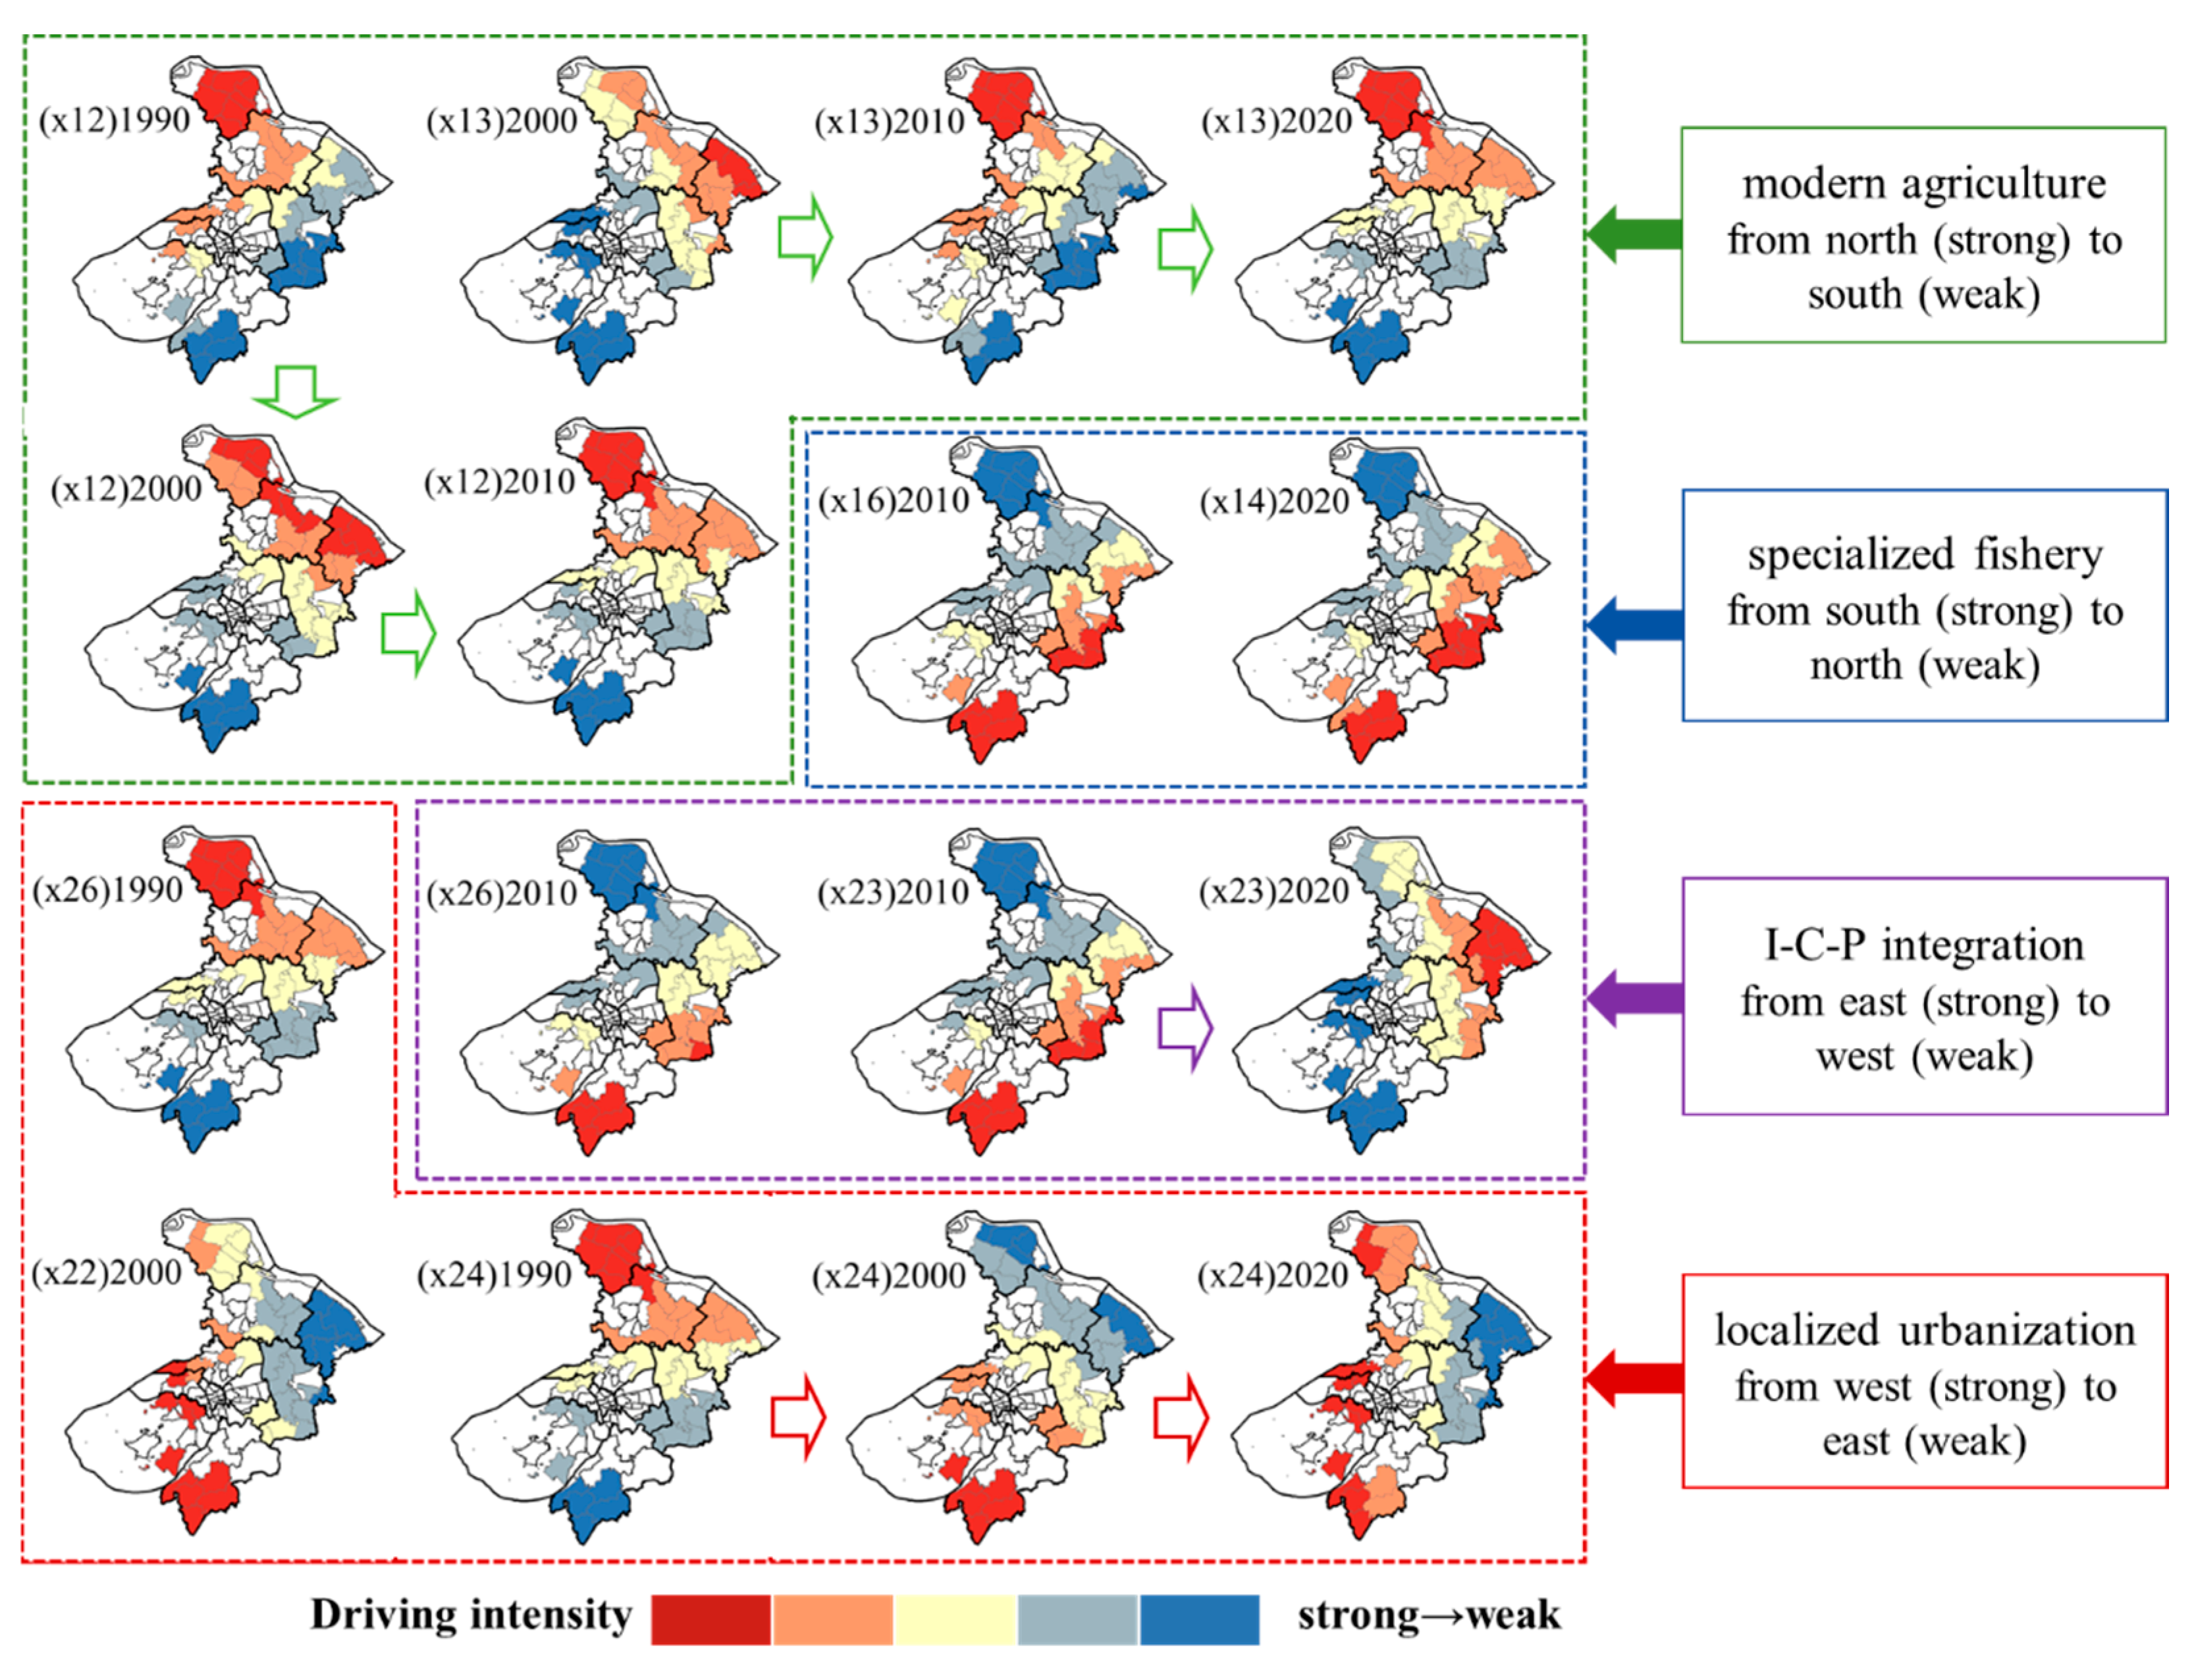
3.3. Driving Mechanisms for Rural Transformation

In order to further explore the driving mechanism of rural transformation in Suzhou, this paper takes the per capita GDP, which measures the level of economic and social development, as an explanatory variable, and 12 indices as explanatory variables, and conducts spatial regression analyses with the help of the GWR model. Previously, in order to exclude the bias of the results caused by the interaction between indices, the covariance test of the indices was carried out, and the proportion of the secondary industry in 2000 (x21) and the proportion of the tertiary industry in 1990, 2010, and 2020 (x22) were excluded. As shown in Figure 9, the significance factors and their respective regression coefficients for different years indicate temporal heterogeneity. In particular, the driving strength of the significance factor in 1990 is ranked in order of absolute value as follows: x24 > x12 > x26, the result for 2000 is as follows: x12 > x24 > x22 > x13 > x11, the result for 2010 is as follows: x16 > x12 > x13 > x26 > x23, and the result for 2020 is as follows: x24 > x14 > x23 > x13.
Based on the results of GWR’s analyses, combined with the actual development of Suzhou City, this paper summarizes the driving mechanisms of rural transformation in Suzhou from four aspects (Figure 10).
1. Modernized construction of the traditional granary. Among the rurality indices, the influence of per capita arable land area (x12) and per capita grain output (x13), which represent grain production capacity, shows a spatial pattern of ‘strong in the north—weak in the south’ in the four time points of 1990, 2000, 2010, and 2020. The northern part of Suzhou, consisting of the river plain, has always been a traditional grain-producing area, while the southern part of the city has a dense water network and thus relatively scarce arable land resources. After the rural revitalization strategy was put forward, the Suzhou government actively introduced a number of supporting policies to further promote the construction of modern agriculture in the traditional northern ‘granary’. Zhangjiagang, on the one hand, pays close attention to the production of food and important agricultural products, promotes the construction of high-standard farmland and variety improvement, and strengthens the scientific and technological support of agricultural production. On the other hand, Zhangjiagang actively purchases agricultural machinery and equipment, promotes the reduction in fertilizers and pesticides to increase the efficiency of the construction of green and high-quality agricultural products through the construction of production bases to serve the sustainable development of modern agriculture. Changshu steadily advances the construction of the ‘food basket’ project, strengthens the production responsibility system for food security, and so on, to strengthen the foundation of stable production and supply, to create ‘Changshu rice’ and other regional public agricultural brands, and to guide the leading enterprises of agricultural industrialization to extend the chain, make up for the chain, and to promote the upgrading of the agricultural industry. Taicang, known as the ‘national granary’, has created a modern agricultural demonstration area, continued to optimize the expansion of ecological recycling agriculture, built a large-scale high-standard farmland, and continued to explore the green development path, creating a ‘the land of fish and rice in the new era’ of the Suzhou model. According to statistics, Zhangjiagang, Changshu, and Taicang accounted for 54.20% and 52.77% of the city’s total sown area and total output of grain crops in 2001, and by 2020, this figure will have risen to 66.49% and 67.73%, respectively.
2. Market-based operation of advantageous fisheries. Unlike the indices representing food production, per capita aquatic product output (x14) and the share of non-grain crops sown (x16), which reflect ‘non-grain-conversion’ agricultural production, show a spatial impact of ‘strong in the south-east and weak in the north-west’ after 2010. The spatial influence of the two indices is ‘strong in the southeast and weak in the northwest’ after 2010. With the deepening of the ‘greater food approach’ in all regions [33], fishery has become increasingly prominent in the diversified food supply system of Suzhou, and has become an advantageous industry for rural revitalization in the city, and the ratio of total fishery output value to total agricultural output value has narrowed from 1:3.26 in 1990 to 1:1.69 in 2020, especially in the case of aquaculture, which has a long history. Especially in Kunshan and Wujiang, which have a long history of aquaculture and rich fishery resources, many explorations have been carried out to transform the traditional pond fishery into a modern urban fishery, and since 2010, Kunshan has focused on the construction of modern fishery parks, the promotion of environmentally friendly eco-farming modes and recycling technology, achieving a win–win situation for the development and protection of the waters, and the hairy crabs of Yangcheng Lake have been selected as a national geographic indications product. Brand premium not only drives the integration of local fisheries and secondary and tertiary industries, the leisure and tourism function of fisheries has also been further explored, coupled with the rise in e-commerce mode, not only driving more than 10,000 villagers to re-employment, but also injecting sustained momentum into the revitalization of rural industries [34]. Wujiang started with the governance of Lake Taihu aquaculture, innovative ecological transformation of aquaculture ponds, ‘aquaponics’, and other new forms of business. In 2001, Kunshan and Wujiang freshwater aquaculture area and aquatic product production accounted for 47.22% and 38.71% of the city’s total, and by 2020, these data had increased to 51.76% and 47.48 per cent, accounting for half of Suzhou.
3. Fundamental support of township industry. Among the urbanity indices, the per capita township enterprise profit tax (x24), which represents the level of economic development of Sunan model, shows a distinct spatial and temporal heterogeneity during the 30-year period, with the high-value area appearing in the northwestern part of Zhangjiagang and Changshu in 1990, and then shifted to Wuzhong and Wujiang in the southwestern part of the country in 2000, and mainly distributed in the western part of Suzhou in 2020. At the end of the 20th century, Zhangjiagang seized the opportunity of the reform and opening up era, and actively laid out township enterprises, which directly drove the growth of farmers’ income through the creation of additional jobs [35]. In 1990, the total output value of township industry exceeded 7.7 billion CNY, and the per capita township enterprise profit tax ranked among the city’s top with 0.11 million CNY. In the same year, the spatial pattern of per capita net income of farmers (x26) was nearly the same as per capita township enterprise profit tax (x24). In the 21st century, Wujiang took the lead in the province in the implementation of enterprise property right system reform, to promote the private economy ‘beyond the plan’, and became the leader of the private economy in Jiangsu [36]. Since 2001, Wuzhong has started from the electronic information and equipment manufacturing industry, and at the same time, has fully exploiting the natural and cultural advantages of the Taihu Lake Basin, actively promoting the transformation of the industrial structure. Affected by this, the proportion of the tertiary industry (x22) in 2000, the high value of the degree of influence is distributed in the southwest along the Xiangcheng, Wuzhong, and Wujiang, the spatial pattern and the per capita township enterprise profit (x24) are relatively close. By 2020, with the transformation and upgrading of industrial structure and the adjustment of regional development orientation, the contribution of small and scattered township enterprises to driving regional tax revenue has been declining. On the one hand, modern industrial parks under the new Sunan model achieve greater economies of scale through enterprise agglomeration [37]; on the other hand, the reform of the tax system of the provincial directly managed counties makes the driving role of traditional township enterprises on local economic development continue to weaken [38]. In contrast, townships in the western region are still located downstream of urban areas in the industrial chain, and the profits and taxes of township enterprises still play an important supporting role in the local economy, which greatly enhances the level of local urbanization in rural areas in the new urbanization process.
4. Leapfrog development in the integration of production and urbanization. The proportion of non-agricultural employment population (x23), another indice of the level of urbanization, was high in Wujiang and Kunshan in the southeast in 2010, and gradually concentrated in Taicang in 2020, showing a spatial pattern of ‘strong in the east-weak in the west’. At the beginning of the 21st century, Wujiang took the private economy and outward-oriented economy as the double-wheel drive for development, and cultivated tens of thousands of market entities; meanwhile, it fully tapped the resource endowment of Jiangnan water town, constructed the resource-growing industrial system for the integration of primary/secondary/tertiary industries, and made every effort to push forward the integration of the development of agriculture, culture and tourism, as well as the urban–rural integration of space. Kunshan took the initiative to dock Shanghai Pudong reform and development needs, in a few years to achieve the ‘internal to external’ and ‘agricultural to industrial’, in 2005 topped the list of China’s top 100 counties. The growth of industries directly generated demand for non-agricultural employment, and the influx of a large number of laborers also pushed the government, enterprises, and other parties to transform industrial parks into industrial communities to promote the integration of industry and city. The spatial pattern of per capita net income of farmers (x26) and the proportion of non-farm employment population (x23) in this period are nearly the same. Wuzhong textile center, Shengze, Kunshan industrial powerhouse Yushan, and other townships have achieved about 10% growth in the proportion of non-farm employment, while Yushan’s per capita GDP occupies the top of the list of townships in Suzhou. Since 2010, Taicang has taken the port as the key to its leapfrog development, promoting a ‘double-center-driven, multilevel driven’ spatial pattern, with the main city as the main center and the port as the sub-center, and continuously perfecting the ‘dual-center-driven, multi-level driven’ spatial pattern. The spatial pattern of ‘double-center drive, multi-level drive’ constantly improves the living consumption, exhibitions and fairs, and other urban functions supporting, to open up to lead the development of leapfrog, and in undertaking the transfer of industries in Shanghai, at the same time continue to deepen the cooperation with foreign enterprises. Taking German enterprises as an example, in 2020, Taicang gathered 350 German enterprises, with an annual industrial output value of more than 50 billion CNY, absorbing nearly 30,000 people in the labor force annually, and the growth of enterprises and the improvement of the community facilities have promoted the formation of a new pattern of ‘promoting the city by production and promoting production by the city’.

4. Discussion

In the process of industrialization, urbanization, and modernization, the economically developed regions represented by Suzhou have accelerated the flow of urban and rural elements, forming a complex and diversified path of rural transformation. Empirical results show that a part of the townships have become more prominent in the process of transformation in terms of rurality and urbanity, while a considerable part of the townships still tends to be simplified, and villages are gradually dying out in the process of urban–rural integration. The Plan of the Rural Revitalization Strategy (2018–2022) in China proposes that village revitalization should be promoted in a categorical manner in line with the laws of village development and evolutionary trends, and in accordance with the current development status of different villages, their locational conditions and resource endowments, rather than a one-size-fits-all approach. Therefore, it is necessary to classify and implement policies for villages and towns with different types of development, which will help to solve the problems of rural development and promote common prosperity in urban and rural areas.
For the rurality-led areas, it is necessary to base on the production function of the countryside, make good use of the resource endowment advantages of the Jiangnan water township, further improve the level of new quality of agricultural and rural industries, and realize the multiple goals of soil and water conservation, crop production capacity enhancement, and farmers’ well-being [39]. At the same time, village planning as a leader, enriching the industrial structure of the countryside and the composite use of space, promoting farmers and collective economic organizations to generate income, enhancing the vitality of the countryside dynamic development, and realizing the township from ‘vegetable garden’, ‘backyard garden’, to ‘spiritual home’ [40,41]. For urbanity-led areas, reference can be made to the development experience of Kunshan Model Town to deepen the development of export-oriented economy with the main line of opening up to the outside world at a higher level, use land policy to rationally allocate resources, create characteristic advantageous industry chain clusters, and further guide the flow of urban resources to the countryside [42]. While the urban and rural dual-dominant region has both good agricultural conditions and huge construction potential, the government should give appropriate policy inclination [43].
On the one hand, based on the resource background of rural areas, while preserving the traditional appearance of rural areas, we should inherit and promote the characteristic culture of rural areas, rationally develop natural resources, and achieve the reproduction of material and cultural spaces in rural areas. For instance, new forms such as “live-streaming & rural tourism” can be utilized to promote the integration of agriculture, culture, and tourism, and become a new engine for driving the sustainable development of rural areas [44,45]. On the other hand, it should optimize the spatial layout of the national territory, provide a key carrier for the flow of factors between urban and rural areas, and expand the road to common prosperity and urban–rural integration. In contrast, as the development characteristics of non-dominant regions are not obvious, comprehensive land consolidation can be carried out to promote the improvement of rural human settlements and improve the conditions of production and living in rural areas, as well as the ecological environment.

5. Conclusions

By exploring the transformation paths of 46 townships in Suzhou during 1990–2020 and their driving mechanisms, the study reveals the complex process and main paths of rural transformation in the developed areas of Southern Jiangsu, as follows:
Firstly, the fluctuation trends of the rurality and urbanity indices of the research units intensified over time, manifested as an increase in low-value fluctuations and a decrease in high-value fluctuations. Overall, the indices gap between towns narrowed. The indices change trends of most towns in 2010 and 2020 were similar. Especially after the drastic transformation brought about by industrialization and urbanization, many towns and townships have formed relatively fixed development models since 2010. By 2020, high rural indice values are mainly concentrated in Shuangfeng Town of Taicang, Shajiabang Town of Changshu, Dongshan Town of Wuzhong, and Qidu Town of Wujiang, which are typical townships that have preserved the natural scenery and humanistic features of the Jiangnan water townships. High urbanity values are laid out in Jinfeng and Yangshe Towns of Zhangjiagang, Fuqiao Town of Taicang, most of the townships in Kunshan, and Shengze Town of Wujiang, and the above areas have experienced a metamorphosis from the Sunan model to the new Sunan model and have also achieved the transition from rapid urbanization to new urbanization.
Secondly, this paper divides the research time range into three stages: 1990–2000, 2000–2010, and 2010–2020. Based on this, the analysis of the rural transformation model in Suzhou City is carried out. The research finds that in the first ten years, more than 40% of the townships showed transformation modes of weakening, enhancement, and exchange. In the middle ten years, as the differentiation of townships intensified, more than 60% of them showed unstable patterns. Over the last ten years, the stable patterns have approached 80%. The urban–rural dominance relationships in township units have undergone an evolution from “differentiation to intensification to stabilization” over the past three decades. Three main paths of Suzhou’s rural transformation are thus extracted. Continuous stabilization mode path means a stable mode in all three time periods, with typical townships including the rurality-dominated Dongshan Township, the urbanity-dominated Shengze Township, and the non-dominated Huangdai Township of Xiangcheng. Mid-late enhancement mode path means an enhancement mode in the mid- to late-stage, including the rurality-dominated Leyu Township of Zhangjiagang, Taoyuan Township of Wujiang, and the urbanity-dominated Jinxi Township and Qiandeng Township of Kunshan. Mid-term weakening mode path means a stabilization mode in the early and late stages, and a weakening mode only in the mid-stage, including the double-dominated weakened to single or non-dominated Qidu Township of Wujiang, Bacheng Township of Kunshan, and Tangqiao Town of Zhangjiagang, as well as the urbanity-dominated weakened to no-dominated Changshu Township of Changshu.
Thirdly, the driving mechanism of rural transformation in Suzhou is mainly intertwined by the modernized construction of the traditional granary in the north, market-based operation of advantageous fisheries in the south, fundamental support of township industry in the west, and leapfrog development of industry–city integration in the east. The areas of Zhangjiagang, Changshu and Taicang along the river in the north have become Suzhou models of “the land of fish and rice in the new era” through the construction of modern agricultural demonstration areas; Wujiang Lake in the south and Kunshan in the east are actively promoting the green transformation of urban fisheries, and in recent years, they have injected impetus into rural revitalization through e-commerce channels. Township enterprises in Xiangcheng and Wuzhong in the west are still the backbone of county economic growth, driving the level of local urbanization in rural areas. Taicang and Kunshan in the east have taken the initiative to integrate into the industrial layout of the Shanghai metropolitan area, giving full play to the huge advantages of local labor resources and hinterland economy, and further promoting the integration of industry, city, and people.

Author Contributions

P.X.: Conceptualization, methodology, investigation, and data curation. H.M.: Writing—original draft preparation, visualization, and software. J.S.: Validation, formal analysis, writing—review, and editing. Y.Y.: Resources, supervision, and funding acquisition. All authors have read and agreed to the published version of the manuscript.

Funding

This research was funded by the National Natural Science Foundation of China (Grants No. 42471242 and 42401234).

Data Availability Statement

This research received data from the local government and the data are confidential.

Conflicts of Interest

The authors declare no conflicts of interest.

References

  1. Woods, M. Engaging the global countryside: Globalization, hybridity and the reconstitution of rural place. Prog. Hum. Geogr. 2007, 31, 485–507. [Google Scholar] [CrossRef]
  2. Liu, S.Y.; Wang, Y.G. From native rural China to urban-rural China: The rural transition perspective of China transformation. Manag. World 2018, 34, 128–146, 232. [Google Scholar]
  3. Qu, Y.B.; Zhan, L.Y.; Zhang, Q.Q.; Wu, M.J. Unpacking the “supply-utilization-demand” interplay: Keys to multifunctional sustainability in rural China. Geogr. Sustain. 2024, 5, 445–458. [Google Scholar] [CrossRef]
  4. Lynch, K. Rural-Urban Interaction in the Developing World; Routledge: London, UK; New York, NY, USA, 2004; pp. 32–33. [Google Scholar]
  5. Halfacree, K.H. Locality and social representation: Space, discourse and alternative definitions of the rural. J. Rural. Stud. 1993, 9, 23–37. [Google Scholar] [CrossRef]
  6. Marsden, T.; Murdoch, J.; Lowe, P.; Munton, R.C.; Flynn, A. Constructing the Countryside: An Approach to Rural Development; Routledge: London, UK, 1993; pp. 144–160. [Google Scholar]
  7. Wilson, G. Multifunctional Agriculture. A Transition Theory Perspective; Cromwell Press: London, UK, 2007. [Google Scholar]
  8. Yuan, Y.; Zhang, X.L.; Li, H.B.; Hu, X.L. Rural space transition in Western countries and its inspiration. Sci. Geogr. Sin. 2019, 39, 1219–1227. [Google Scholar]
  9. Zhu, X.Y.; Gao, J.L.; An, F.P. Rural multifunctionality: A comprehensive literature review. Prog. Geogr. 2024, 43, 1233–1246. [Google Scholar]
  10. Cao, Z.; Li, Y.R.; Chen, Y.F. Approaches to rural transformation and sustainable development in the context of urban-rural integration. Acta Geogr. Sin. 2019, 74, 2560–2571. [Google Scholar]
  11. Qu, Y.B.; Dong, X.Z.; Ma, W.Q.; Zhao, W.Y. New rural community construction or retention development: A comparative analysis of rural settlement transition mechanism in plain agriculture area of China based on actor network theory. Chin. Geogr. Sci. 2024, 34, 436–452. [Google Scholar] [CrossRef]
  12. Ma, L.B.; Tao, T.M.; Li, Z.Y.; Wu, S.S.; Zhang, W.B. Study on spatial divergence of rural resilience and optimal governance paths in oasis: The case of Yongchang County in the Hexi Corridor of China. Environ. Dev. Sustain. 2024, 26, 4603–4627. [Google Scholar] [CrossRef]
  13. Yin, S.; Yang, X.J. Rural transformation adaptation and development path optimization in vulnerable environment areas: A case study of Minqin County, Gansu province. Hum. Geogr. 2024, 39, 54–63. [Google Scholar]
  14. Guo, Y.Z.; Liu, Y.S. The process of rural development and paths for rural revitalization in China. Acta Geogr. Sin. 2021, 76, 1408–1421. [Google Scholar]
  15. Li, Y.H. Urban-rural interaction patterns and dynamic land use: Implications for urban-rural integration in China. Reg. Environ. Change 2012, 12, 803–812. [Google Scholar] [CrossRef]
  16. Yuan, Y.; Zhao, W.T.; Li, H.Q.; Mu, H. Analyzing the driving mechanism of rural transition from the perspective of rural-urban continuum: A case study of Suzhou, China. Land 2022, 11, 1146. [Google Scholar] [CrossRef]
  17. Dong, X.Y. A review of the theory and practice of “Sunan Model” for 30 years. Mod. Econ. Res. 2008, 8, 19–24. [Google Scholar]
  18. Xu, Y.M. The new Sunan model is on the horizon. Mod. Econ. Res. 2001, 8, 22–24. [Google Scholar]
  19. Wang, Z.K.; Shi, J.C. Evolution and sustained development of Sunan model. J. Shanghai Jiaotong Univ. (Philos. Soc. Sci.) 2024, 32, 101–116. [Google Scholar]
  20. Qin, Q.; Li, G.B.; Wang, Y. Space-time evolution and mechanisms of traditional village hollowing in Suzhou: A case study of Houbu, Tangli and Wengxiang villages. Agric. Econ. 2021, 2, 38–40. [Google Scholar]
  21. Wang, L.; Shen, J.F.; Chung, C.K.L. City profile: Suzhou-a Chinese city under transformation. Cities 2015, 44, 60–72. [Google Scholar] [CrossRef]
  22. Tang, W.C.; Luo, Z.D.; Geng, L. Reopen the path of endogenous development: Rethinking the roles and mechanisms of township and village enterprises in the development of small towns in Sunan. Urban Plan. Forum 2013, 2, 95–101. [Google Scholar]
  23. Hu, X.L.; Li, H.B.; Zhang, X.L.; Yuan, Y. On the recognition of rural definitions. Acta Geogr. Sin. 2020, 75, 398–409. [Google Scholar]
  24. Lv, Z.Y.; Lin, G. Hybridity: Rethinking rurality. Geogr. Res. 2017, 36, 1873–1885. [Google Scholar]
  25. Long, H.L.; Liu, Y.S.; Zou, J. Assessment of rural development types and their rurality in Eastern coastal China. Acta Geogr. Sin. 2009, 64, 426–434. [Google Scholar]
  26. Dong, Y.M.; Guo, Y.; Li, Z.G.; Lin, S.N. Spatio-temporal differentiation and driving mechanisms of rurality in the Yangtze River Economic Belt. J. Nat. Resour. 2022, 37, 378–395. [Google Scholar] [CrossRef]
  27. Han, S.H.; Zhao, Y.X. The Impact of Digital Economy on China’s Energy “Dual Control” Goals. China Popul. Resour. Environ. 2024, 34, 67–75. [Google Scholar]
  28. Wang, Y.Z.; Duan, X.J.; Wang, L.; Zou, H.; Yang, Q.K. Spatial and temporal differentiation and driving mechanisms of economic development in the Yangtze River Economic Belt. Rsour. Environ. Yangtze Basin 2020, 29, 1–12. [Google Scholar]
  29. Xu, J.; Zhang, Z.F. The effect of family off-farm work on farmers’ participation in farmland transfer. China Land Sci. 2020, 34, 99–107. [Google Scholar]
  30. Song, L.F. Exploration of the practice and theory of the leading development of the Southern Jiangsu region: From the “Sunan model”, “New Sunan model” to the “Sunan modernization model”. Nanjing Soc. Sci. 2019, 1, 1–10. [Google Scholar]
  31. Wen, T.J.; Xie, X.; Gao, J.; Dong, X.D. Local government system innovation and industrial transformation and upgrading: A case study on Suzhou’s industrial district. Acad. Res. 2016, 2, 82–89+177–178. [Google Scholar]
  32. Wu, X.L.; Tan, Q.M. The new Sunan model: A theoretical framework of rural revitalization. J. Huazhong Agric. Univ. (Soc. Sci. Ed.) 2019, 2, 18–26+163–164. [Google Scholar]
  33. Yuan, Y.; Wang, Y.H.; Xu, P. Cultivated land use control from the perspective of “non-grain” governance: Response logic and framework construction. J. Nat. Resour. 2024, 39, 942–959. [Google Scholar] [CrossRef]
  34. Pan, S.T.; Gong, J.W.; Gao, X.W.; Shi, Q.H. The employment effects and mechanisms of the implementation of rural e-commerce development policy in China. Chin. Rural. Econ. 2024, 4, 141–162. [Google Scholar]
  35. Chen, Y.F.; Liu, Y.S.; Long, H.L.; Wang, J.Y. Rural development process and driving mechanisms of South Jiangsu: A case study of Suzhou City. Prog. Geogr. 2010, 29, 123–128. [Google Scholar]
  36. Office of Suzhou Municipal Committee for the Compilation of Local Chronicles. 70 Glorious Years of Wujiang: From the Home of Silk to a City of Joyful Living. Available online: https://dfzb.suzhou.gov.cn (accessed on 26 September 2019).
  37. Ye, Z.P. Industrial governance capacity and industrial development in China: Based on the case of Kunshan City with a process-tracing approach, Jiangsu Province. Chin. J. Urban Environ. Stud. 2020, 3, 29–49. [Google Scholar]
  38. Wang, W.L. Does the system in which counties are directly managed by the province reduce regional economic performance? Based on the comparison of typical sample cities and counties in Jiangsu and Zhejiang Provinces. Economist 2022, 4, 109–117. [Google Scholar]
  39. Gu, G.Z.; Shi, L.N.; Wen, Q.; Niu, S.D. Coupling and coordination of the multifunction and value of arable land at the regional scale from the perspective of rural hollowing governance. Prog. Geogr. 2024, 43, 587–602. [Google Scholar]
  40. Tian, Y.Y.; Jiang, G.H.; Xing, Y.Q.; Wu, S.D.; Kong, X.R.; Zhou, T. From process to effects: An approach for integrating dominant and recessive transitions of rural residential land (RRL). Land Use Policy 2025, 148, 107387. [Google Scholar] [CrossRef]
  41. Cheng, Y.Q.; Hu, S.G.; Yang, R.; Tao, W.; Li, H.B.; Li, B.H.; Liu, P.L.; Wei, F.Q.; Guo, W.; Tang, C.C.; et al. Protection and utilization of the traditional villages of China in the context of rural revitalization: Challenges and prospects. J. Nat. Resour. 2024, 39, 1735–1759. [Google Scholar] [CrossRef]
  42. Rui, Y.; Luo, F.; Wang, L.; Sun, W.H.; Liu, X.Q. Classification and revitalization of Chinese traditional villages based on resource transformation: A perspective of “people-industry-location” elements. J. Arid. Land Resour. Environ. 2024, 38, 87–95. [Google Scholar]
  43. Ma, L.B.; Chen, M.M.; Fang, F.; Che, X.L. Research on the spatiotemporal variation of rural-urban transformation and its driving mechanisms in underdeveloped regions: Gansu Province in western China as an example. Sustain. Cities Soc. 2019, 50, 101675. [Google Scholar] [CrossRef]
  44. Ma, D.; Sun, D.; Wang, Z. Exploring the Rural Revitalization Effect under the Interaction of Agro-Tourism Integration and Tourism-Driven Poverty Reduction: Empirical Evidence for China. Land 2024, 13, 60. [Google Scholar] [CrossRef]
  45. Dai, M.L.; Fan, D.X.F.; Wang, R.; Ou, Y.H.; Ma, X.L. Does Rural Tourism Revitalize the Countryside? An Exploration of the Spatial Reconstruction Through the Lens of Cultural Connotations of Rurality. J. Destin. Mark. Manag. 2023, 29, 100801. [Google Scholar] [CrossRef]
Figure 1. Location of Suzhou.
Land 14 01145 g001
Figure 2. The theoretical framework for transformation from the perspective of the rural–urban continuum. (ap) are 16 transformation sub-models that theoretically exist between rurality and urbanality.
Land 14 01145 g002
Figure 3. Change in rurality indices in Suzhou from 1990 to 2020.
Land 14 01145 g003
Figure 4. Change in urbanity indices in Suzhou from 1990 to 2020.
Land 14 01145 g004
Figure 5. (a) Temporal trends of rurality indices from 1990 to 2020. (b) Temporal trends of urbanity indices from 1990 to 2020.
Land 14 01145 g005
Figure 6. (a) Spatio-temporal evolutionary pattern of rurality dominates in Suzhou. (b) Spatio-temporal evolutionary pattern of urbanity dominates in Suzhou.
Land 14 01145 g006
Figure 7. (a) Quadrant distribution of urban–rural dominance. (b) The transformation relationship between urbanity and rurality dominates. (c) The proportion of transformation modes in different periods.
Land 14 01145 g007
Figure 8. (a) Number of township units and modes during the rural transformation of the four different dominant scenarios in Suzhou. (b) Three main transformation paths and their typical townships.
Land 14 01145 g008aLand 14 01145 g008b
Figure 9. Patterns of the spatial distribution of indices driving force.
Land 14 01145 g009
Figure 10. Driving mechanisms of rural transformation in Suzhou.
Land 14 01145 g010
Table 1. System of indices for evaluating urban–rural dominance.
IndicesUnitWeightExplanation
Rurality (R)x11Proportion of primary industry%0.1355Proportion of the primary industry in the gross domestic product
x12Per capita arable land areamu0.0921Average amount of cultivated land area to the year-end population
x13Per capita grain outputkg0.1273Average amount of grain output to the year-end population
x14Per capita output of aquatic productskg0.1879Ratio of the output of aquatic products to the year-end population
x15Power of agricultural machineryKw/ha0.3852Average amount of dynamics of farm machinery for sowing areas
x16Share of non-grain crops sown%0.0720Proportion of non-grain in the sowing area of crops
Urbanity (U)x21Proportion of secondary industry%0.0237Proportion of secondary industry in the gross domestic product
x22Proportion of the tertiary industry%0.0421Proportion of the tertiary industry in the gross domestic product
x23Proportion of non-agricultural employed population%0.0361Ratio of employees in TVEs to year-end population
x24Per capita township enterprise profit tax10,000 CNY0.4000Average amount of profits and taxes of TVEs for the year-end population
x25Per capita investment in fixed assets10,000 CNY0.2225Total fixed assets investment of the year-end population
x26Per capita net income of farmers10,000 CNY0.2756Average amount of income from rural residents
Disclaimer/Publisher’s Note: The statements, opinions and data contained in all publications are solely those of the individual author(s) and contributor(s) and not of MDPI and/or the editor(s). MDPI and/or the editor(s) disclaim responsibility for any injury to people or property resulting from any ideas, methods, instructions or products referred to in the content.

