


Improving Agricultural Efficiency of Dry Farmlands by Integrating Unmanned Aerial Vehicle Monitoring Data and Deep Learning

Abstract
1. Introduction
2. Materials and Methods
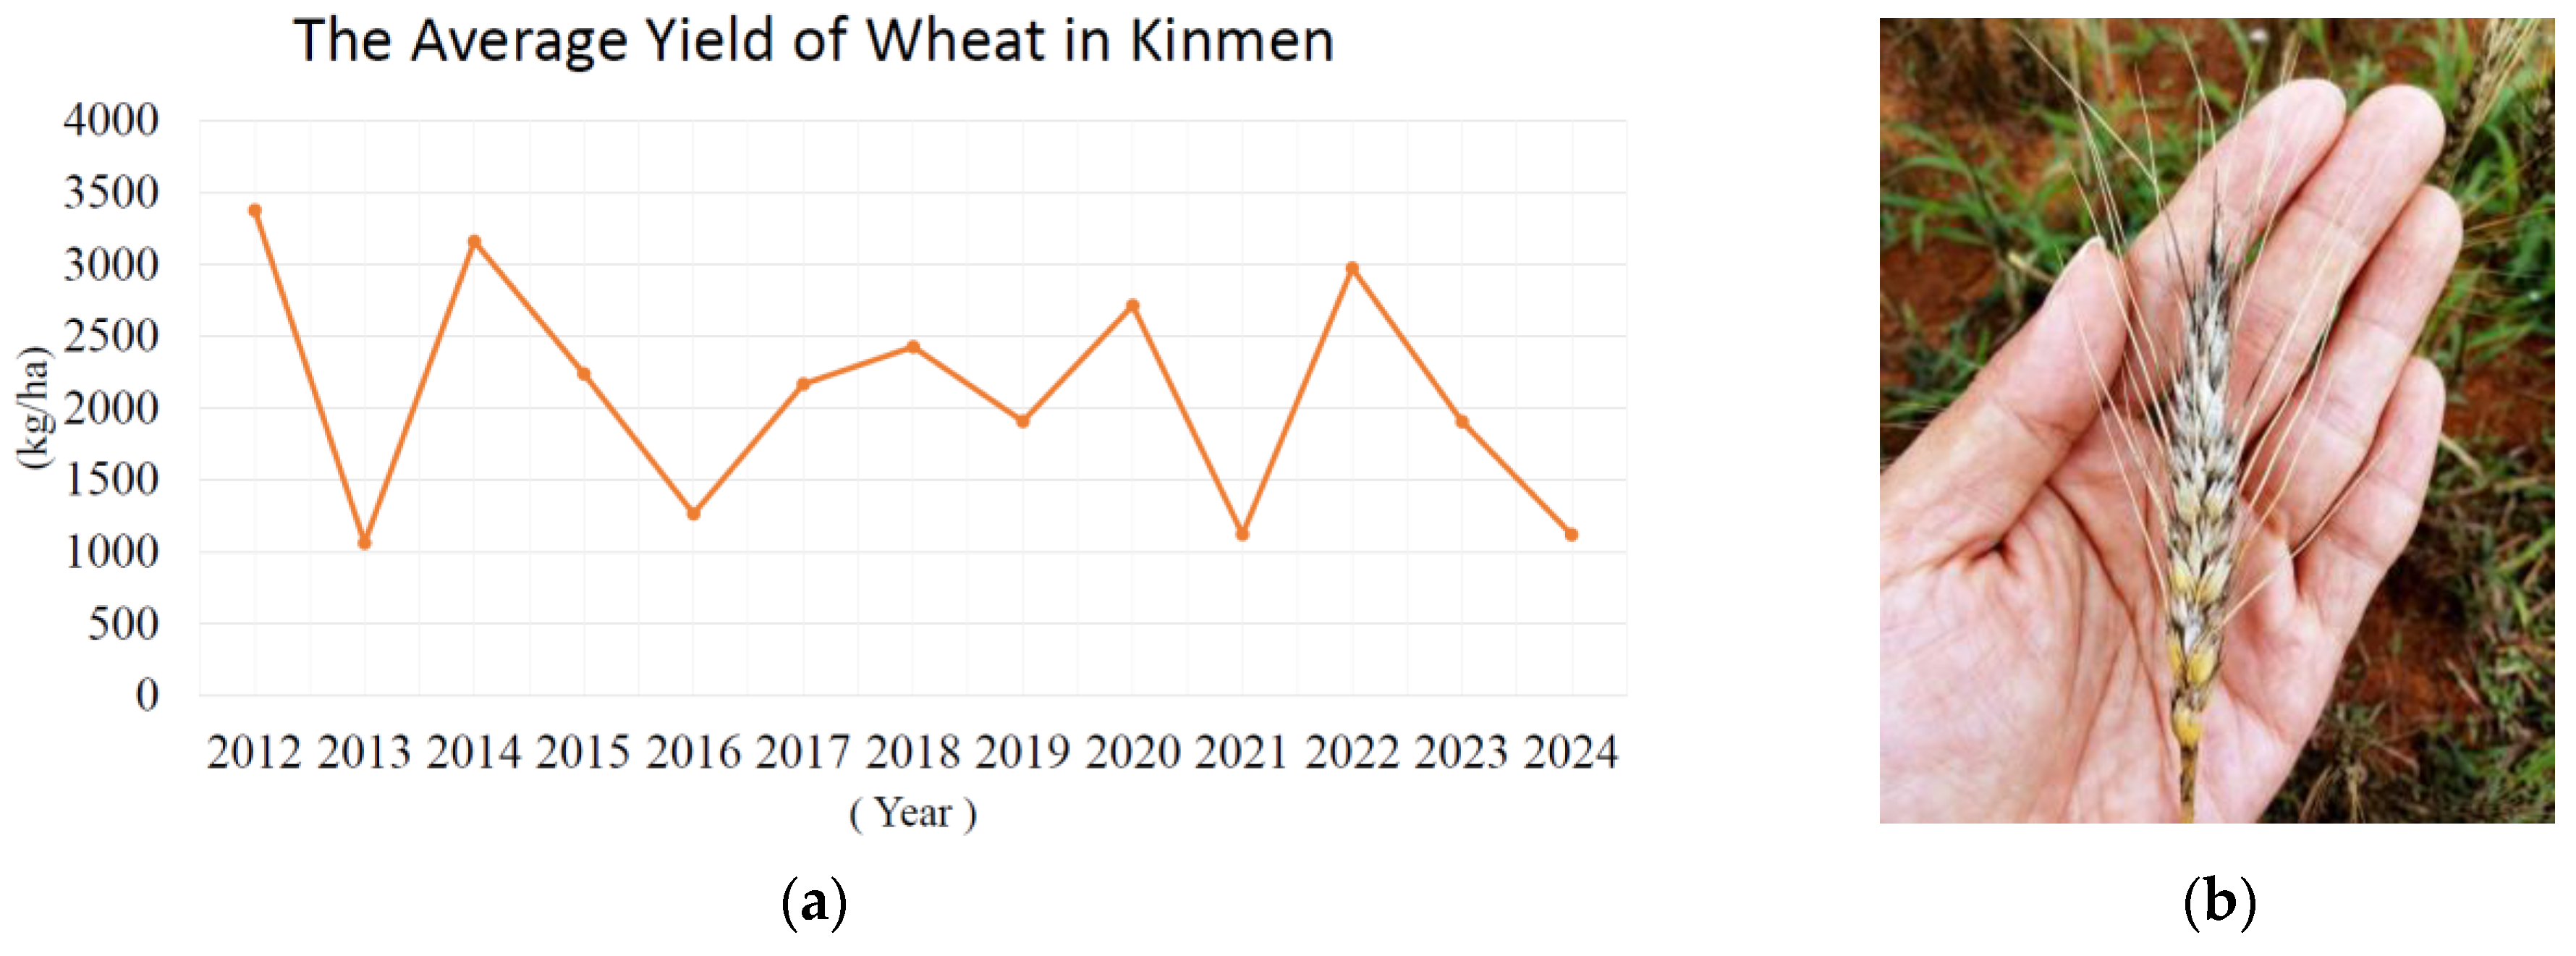
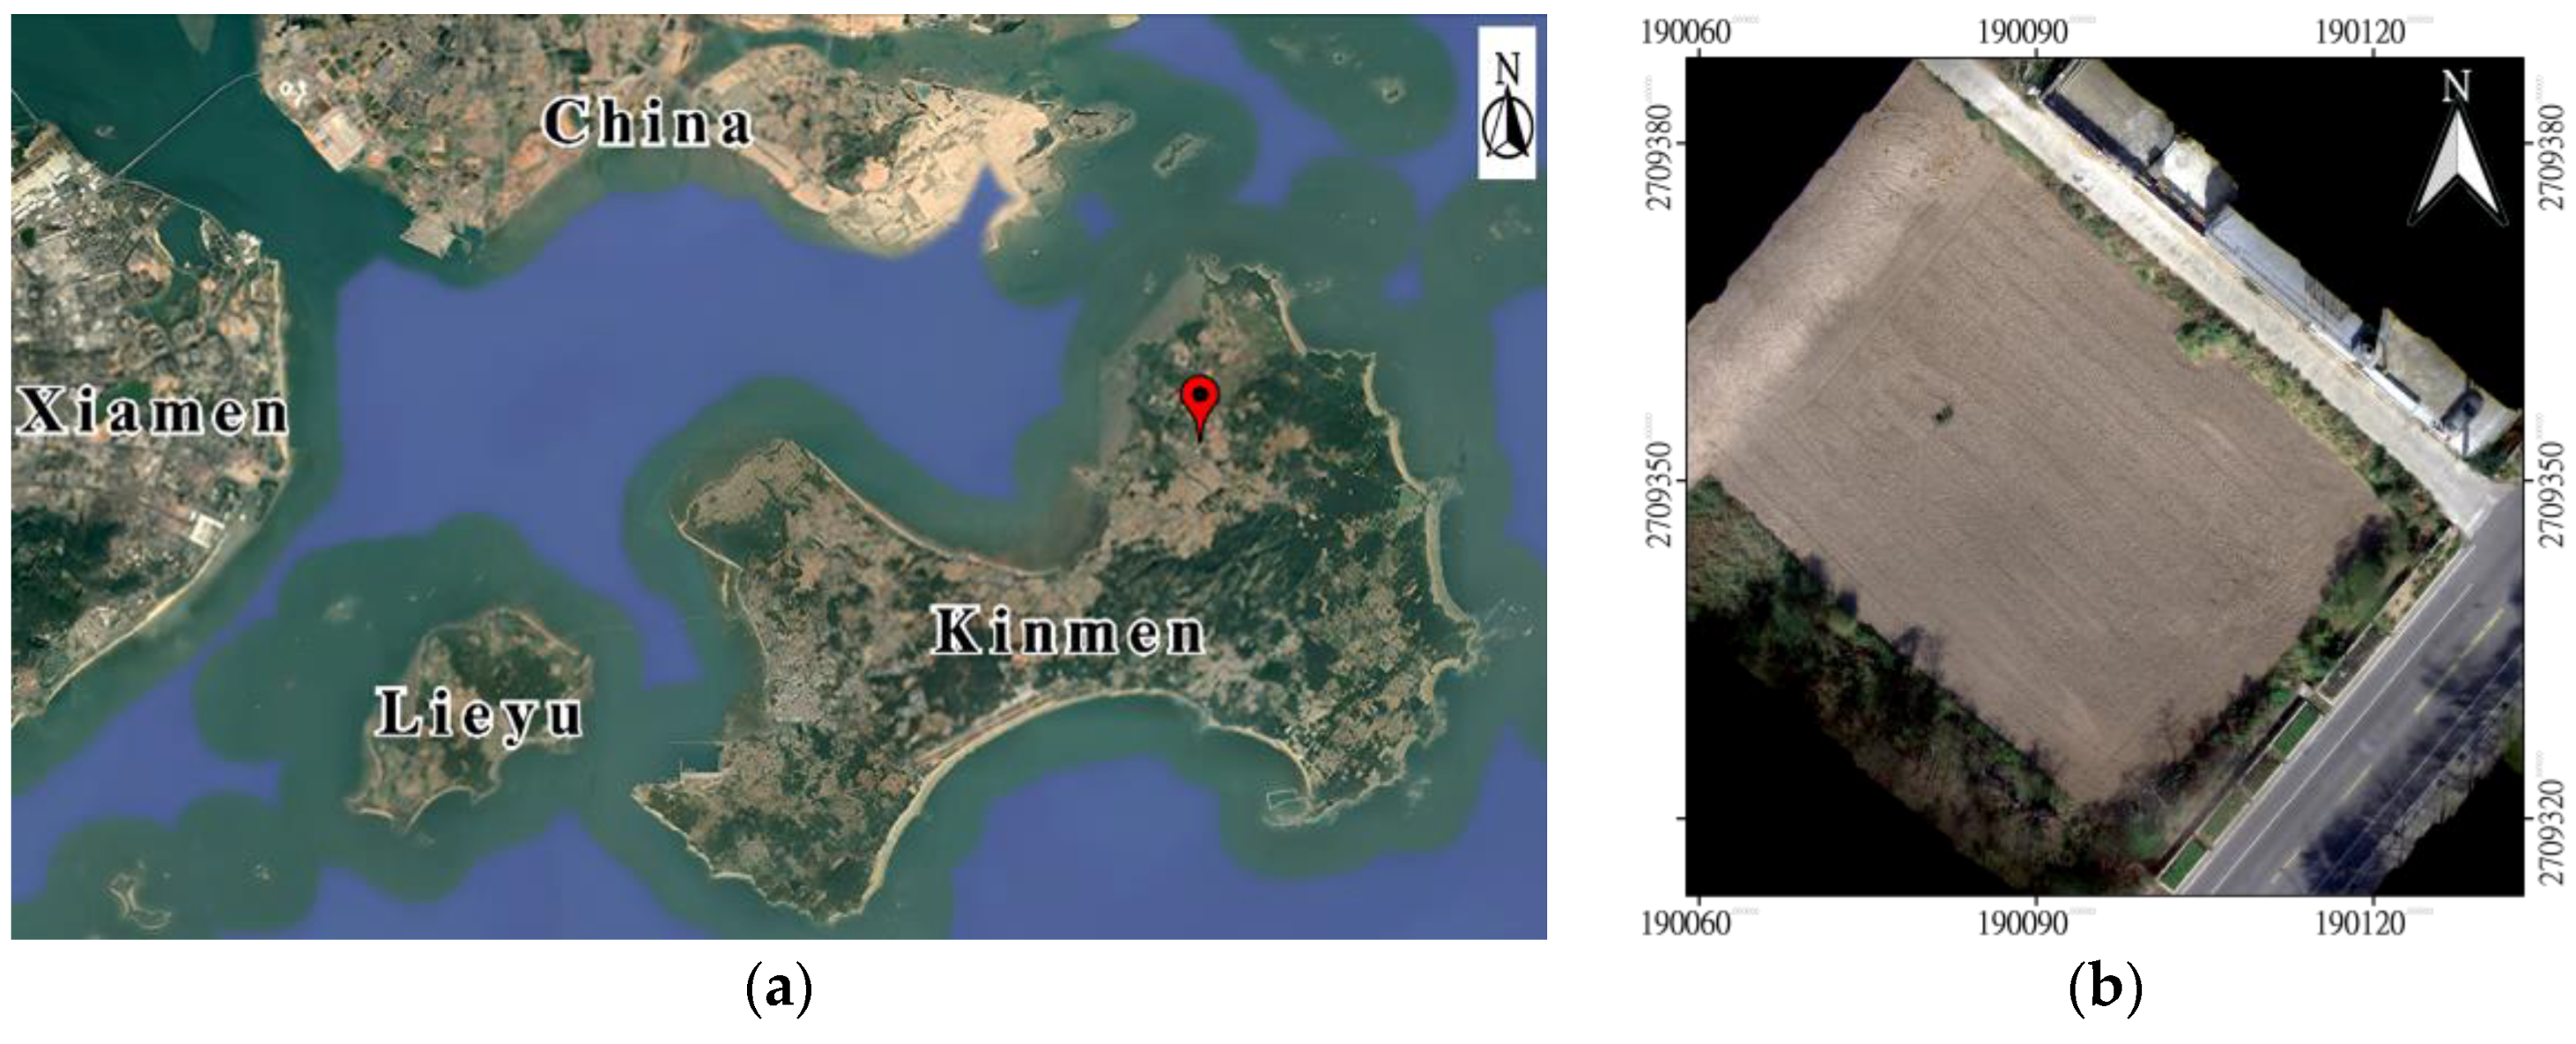
2.1. Research Site
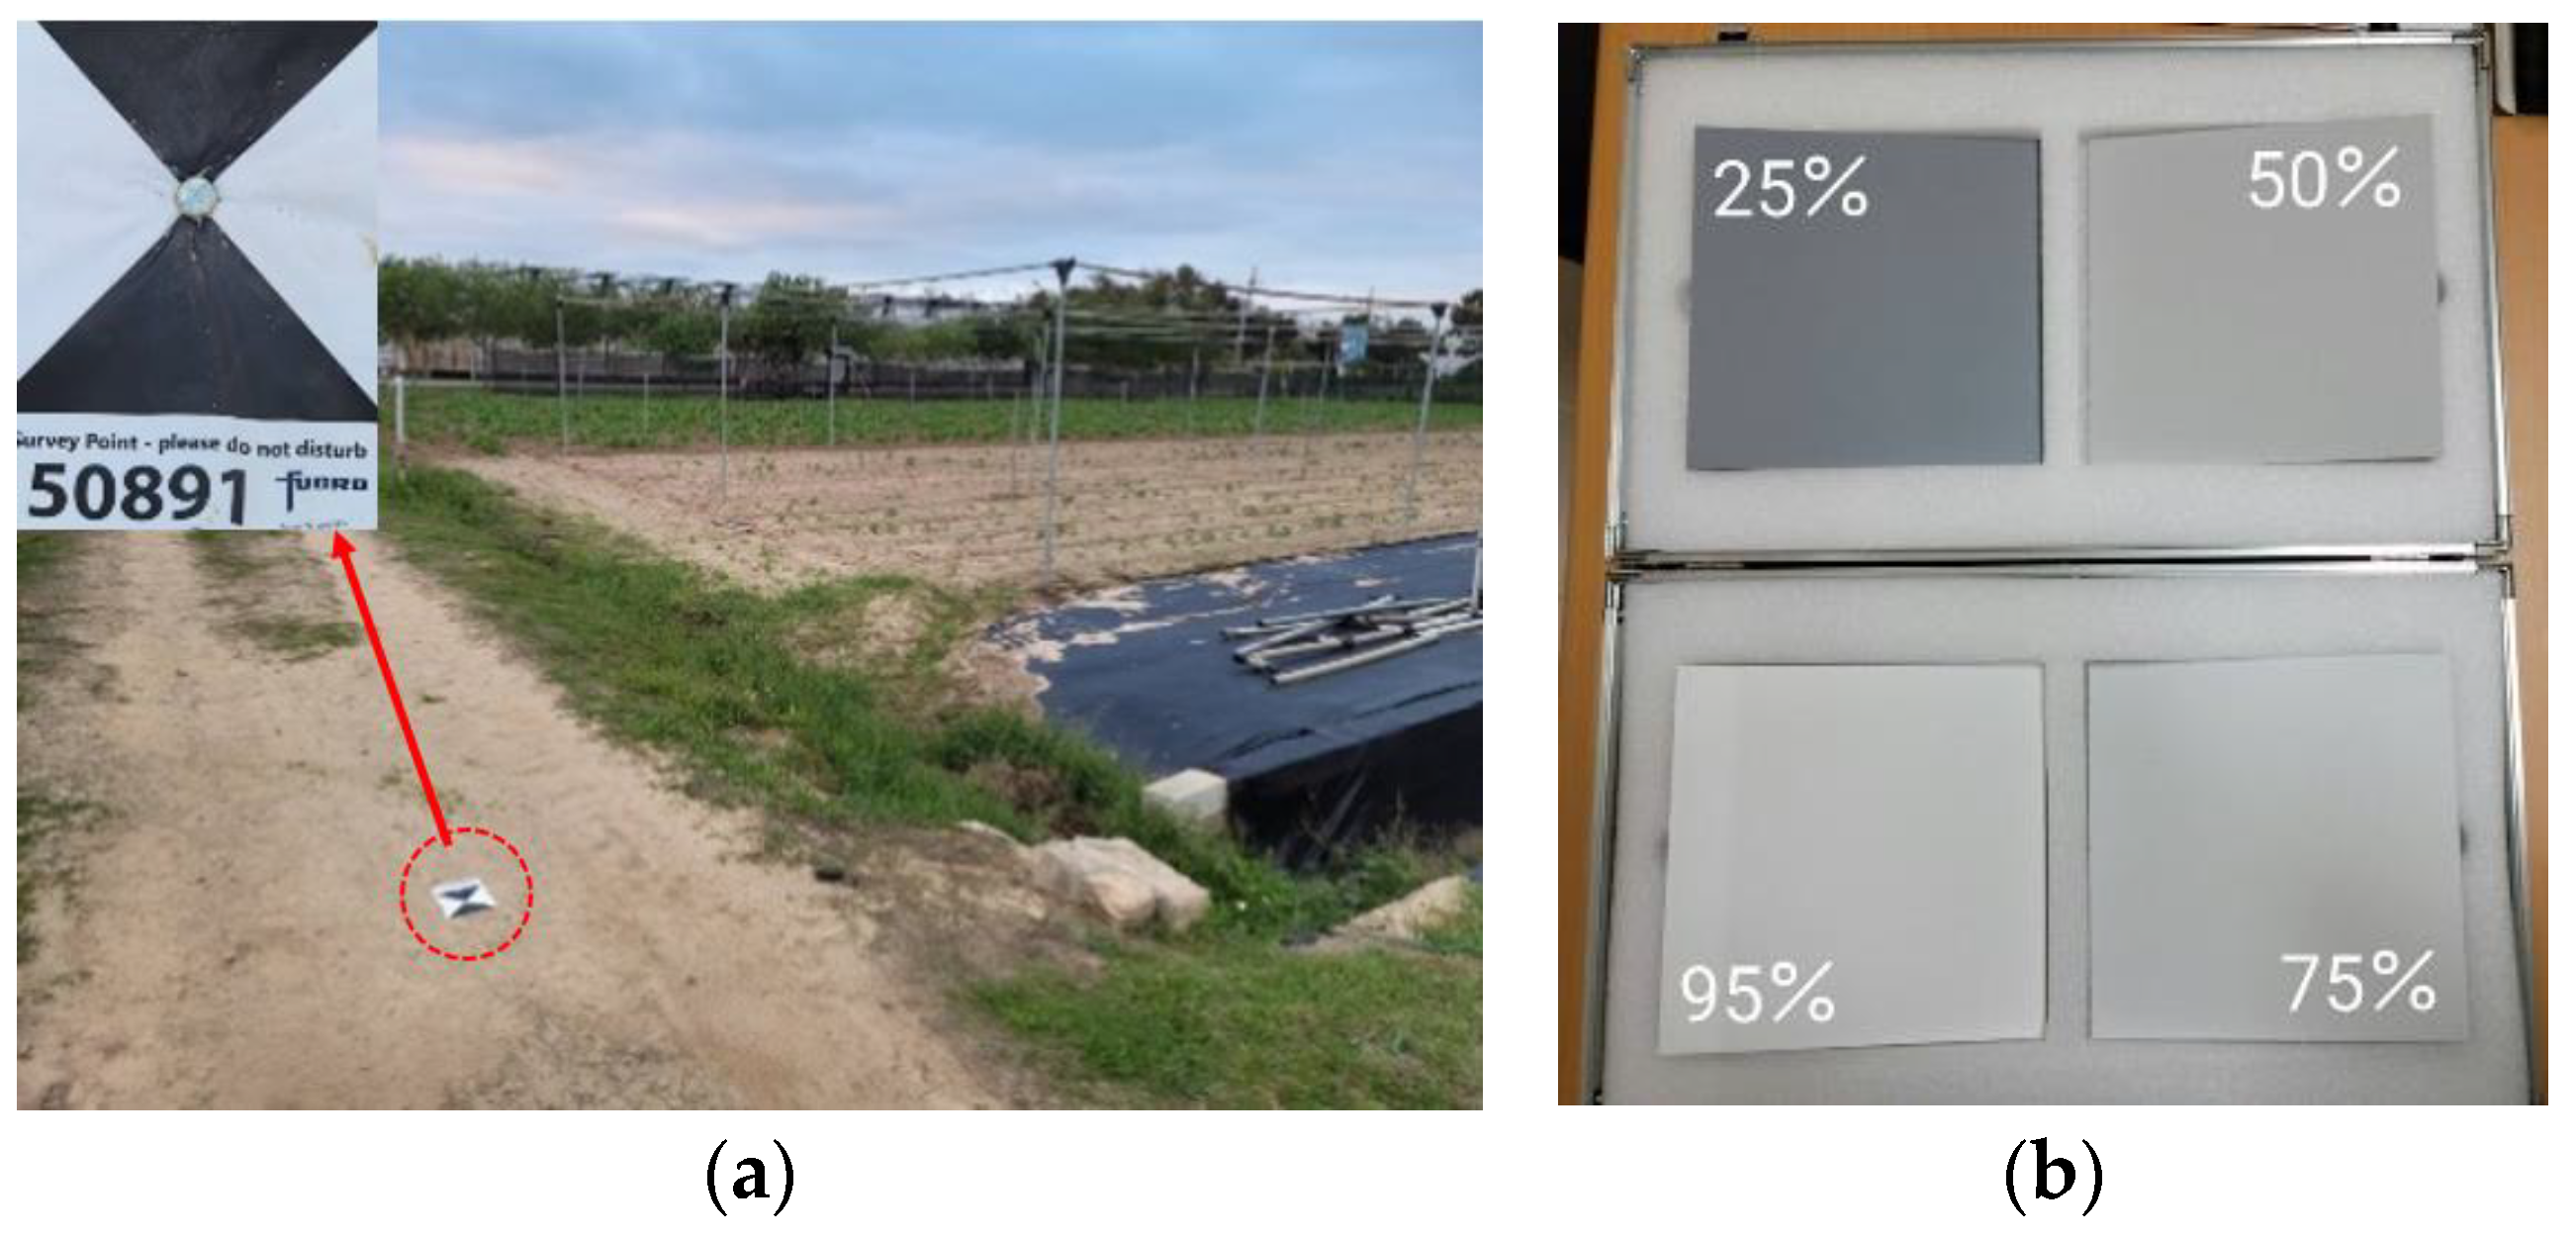
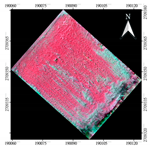
2.2. UAV Remote Sensing Image Data
2.3. Soil Drought Indices (SDIs)
2.4. In Situ Soil Moisture Monitoring Data
2.5. Gradient Boosting Regression, GBR
2.6. Soil Moisture Content and Wheat Yield Estimation and Correlation Assessment
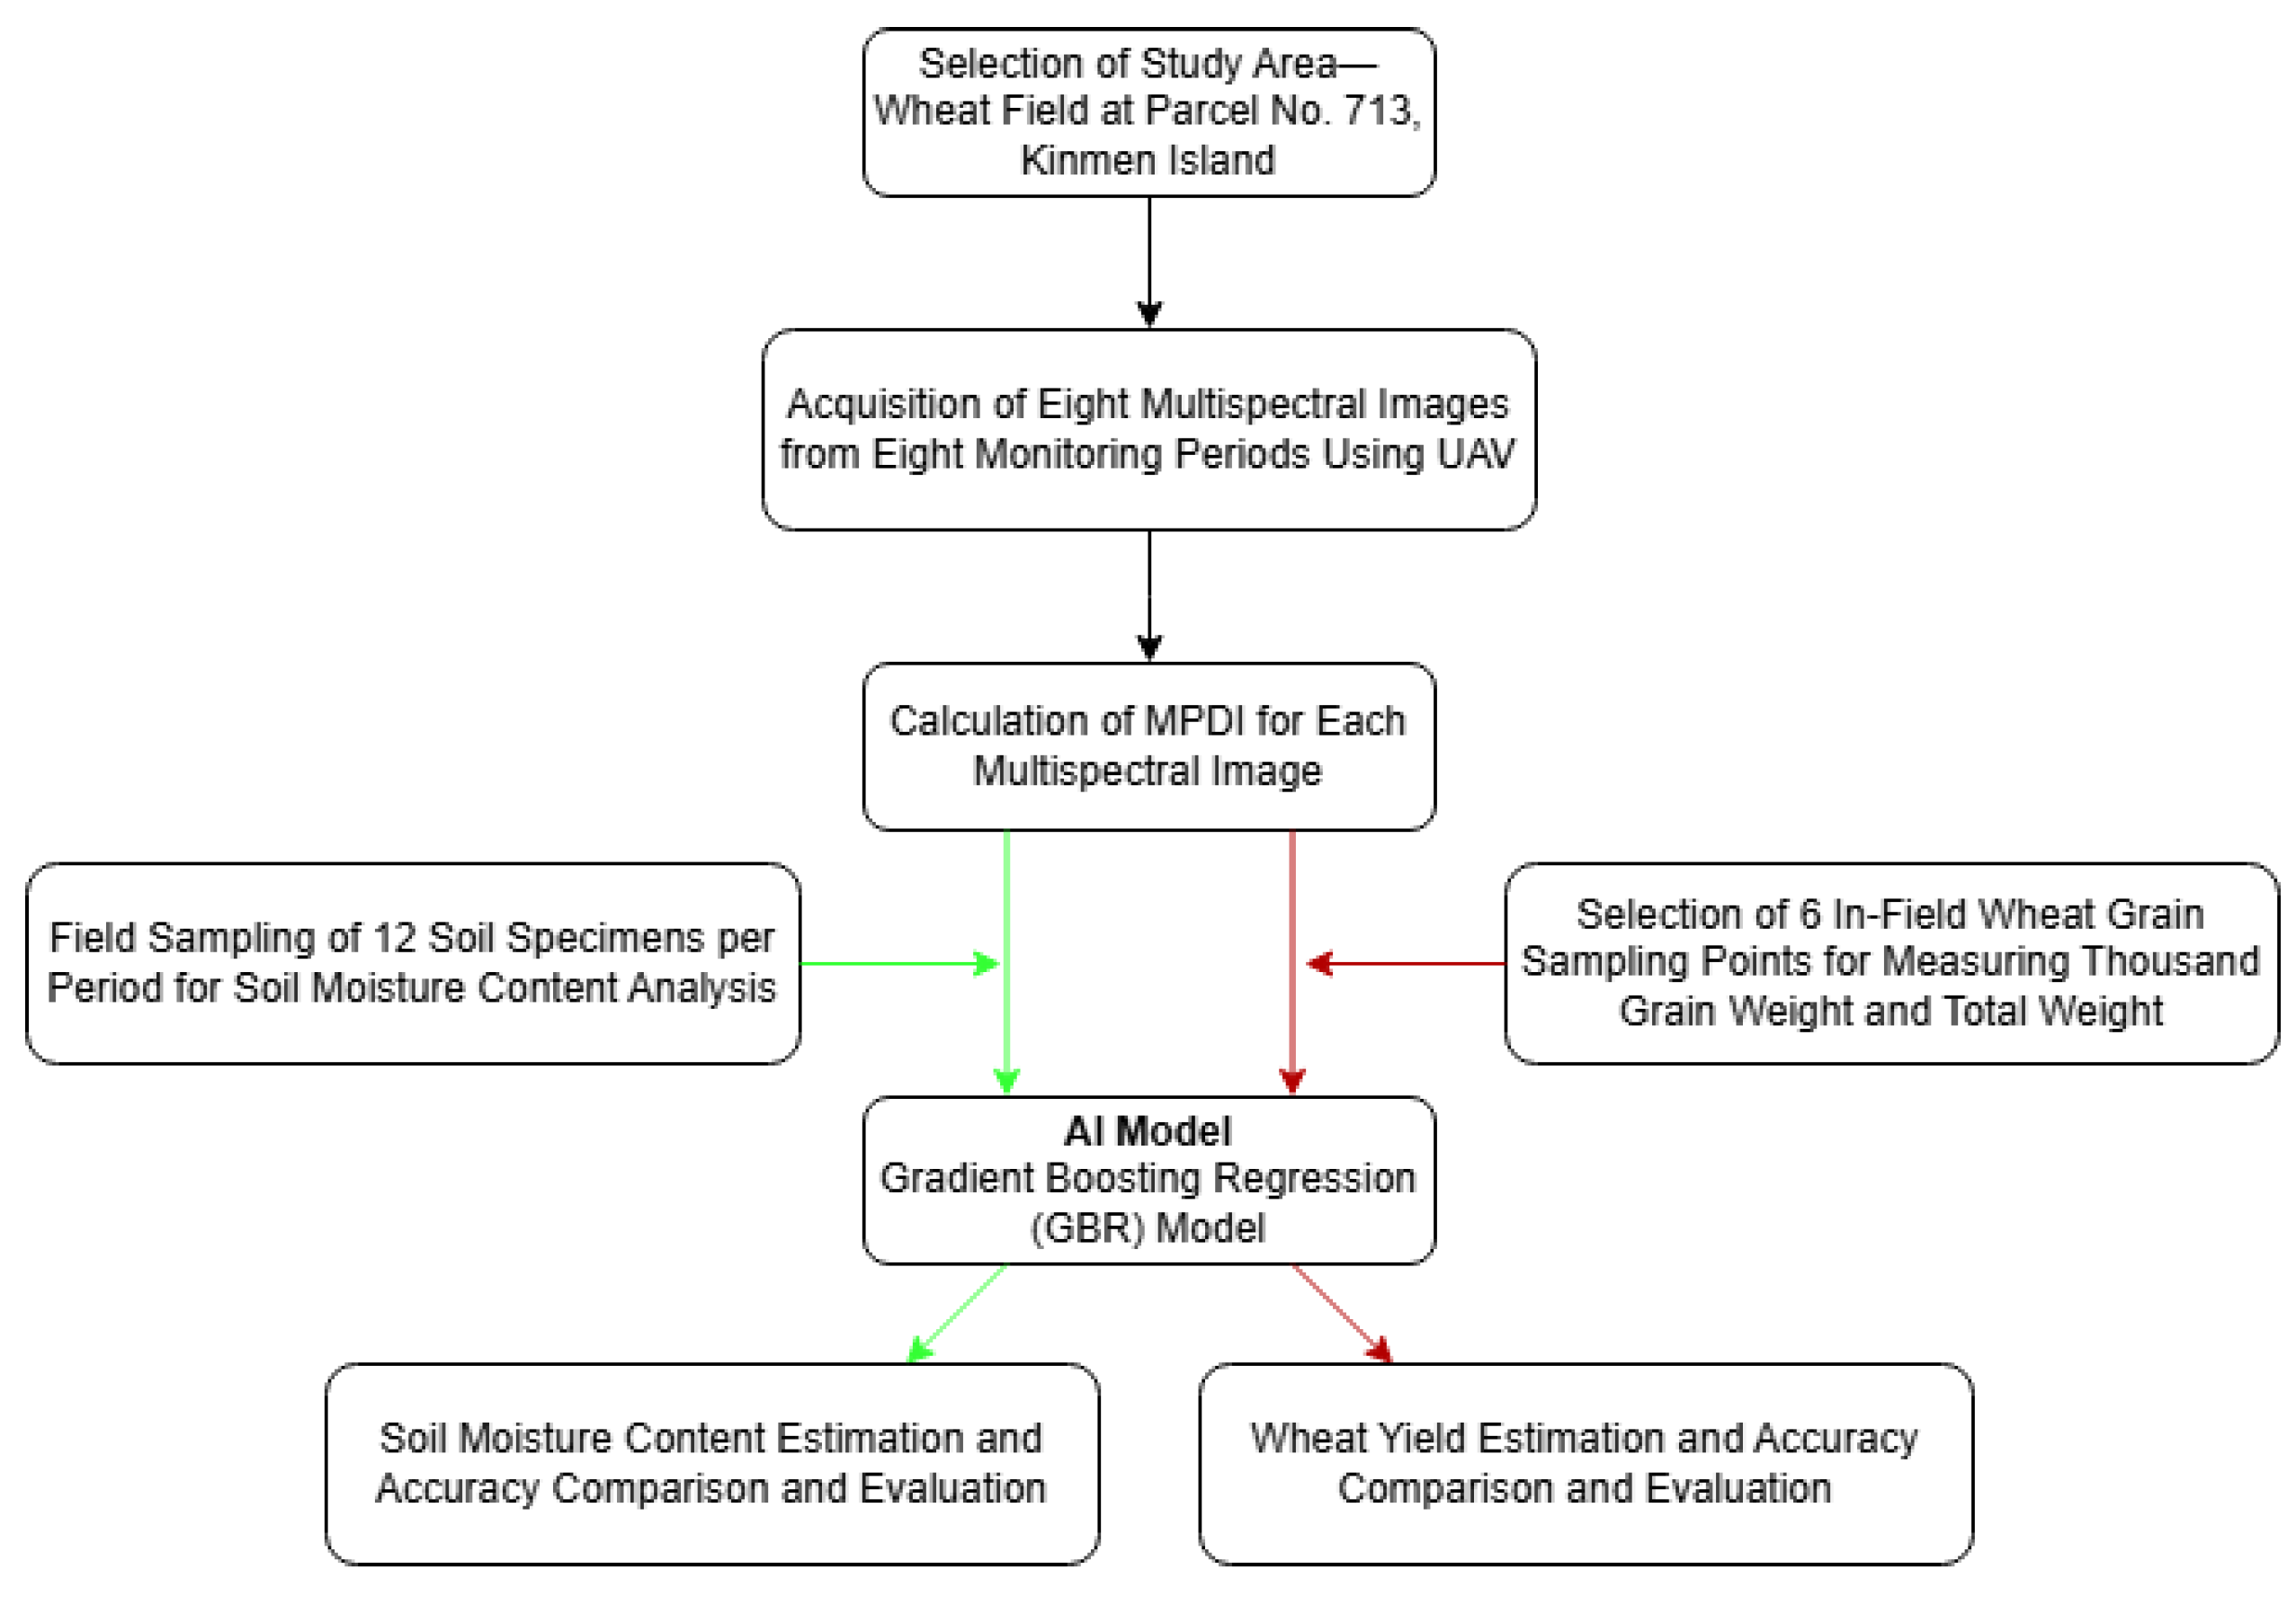
2.7. Research Workflow
3. Results
3.1. Modified Drought Index (MPDI)
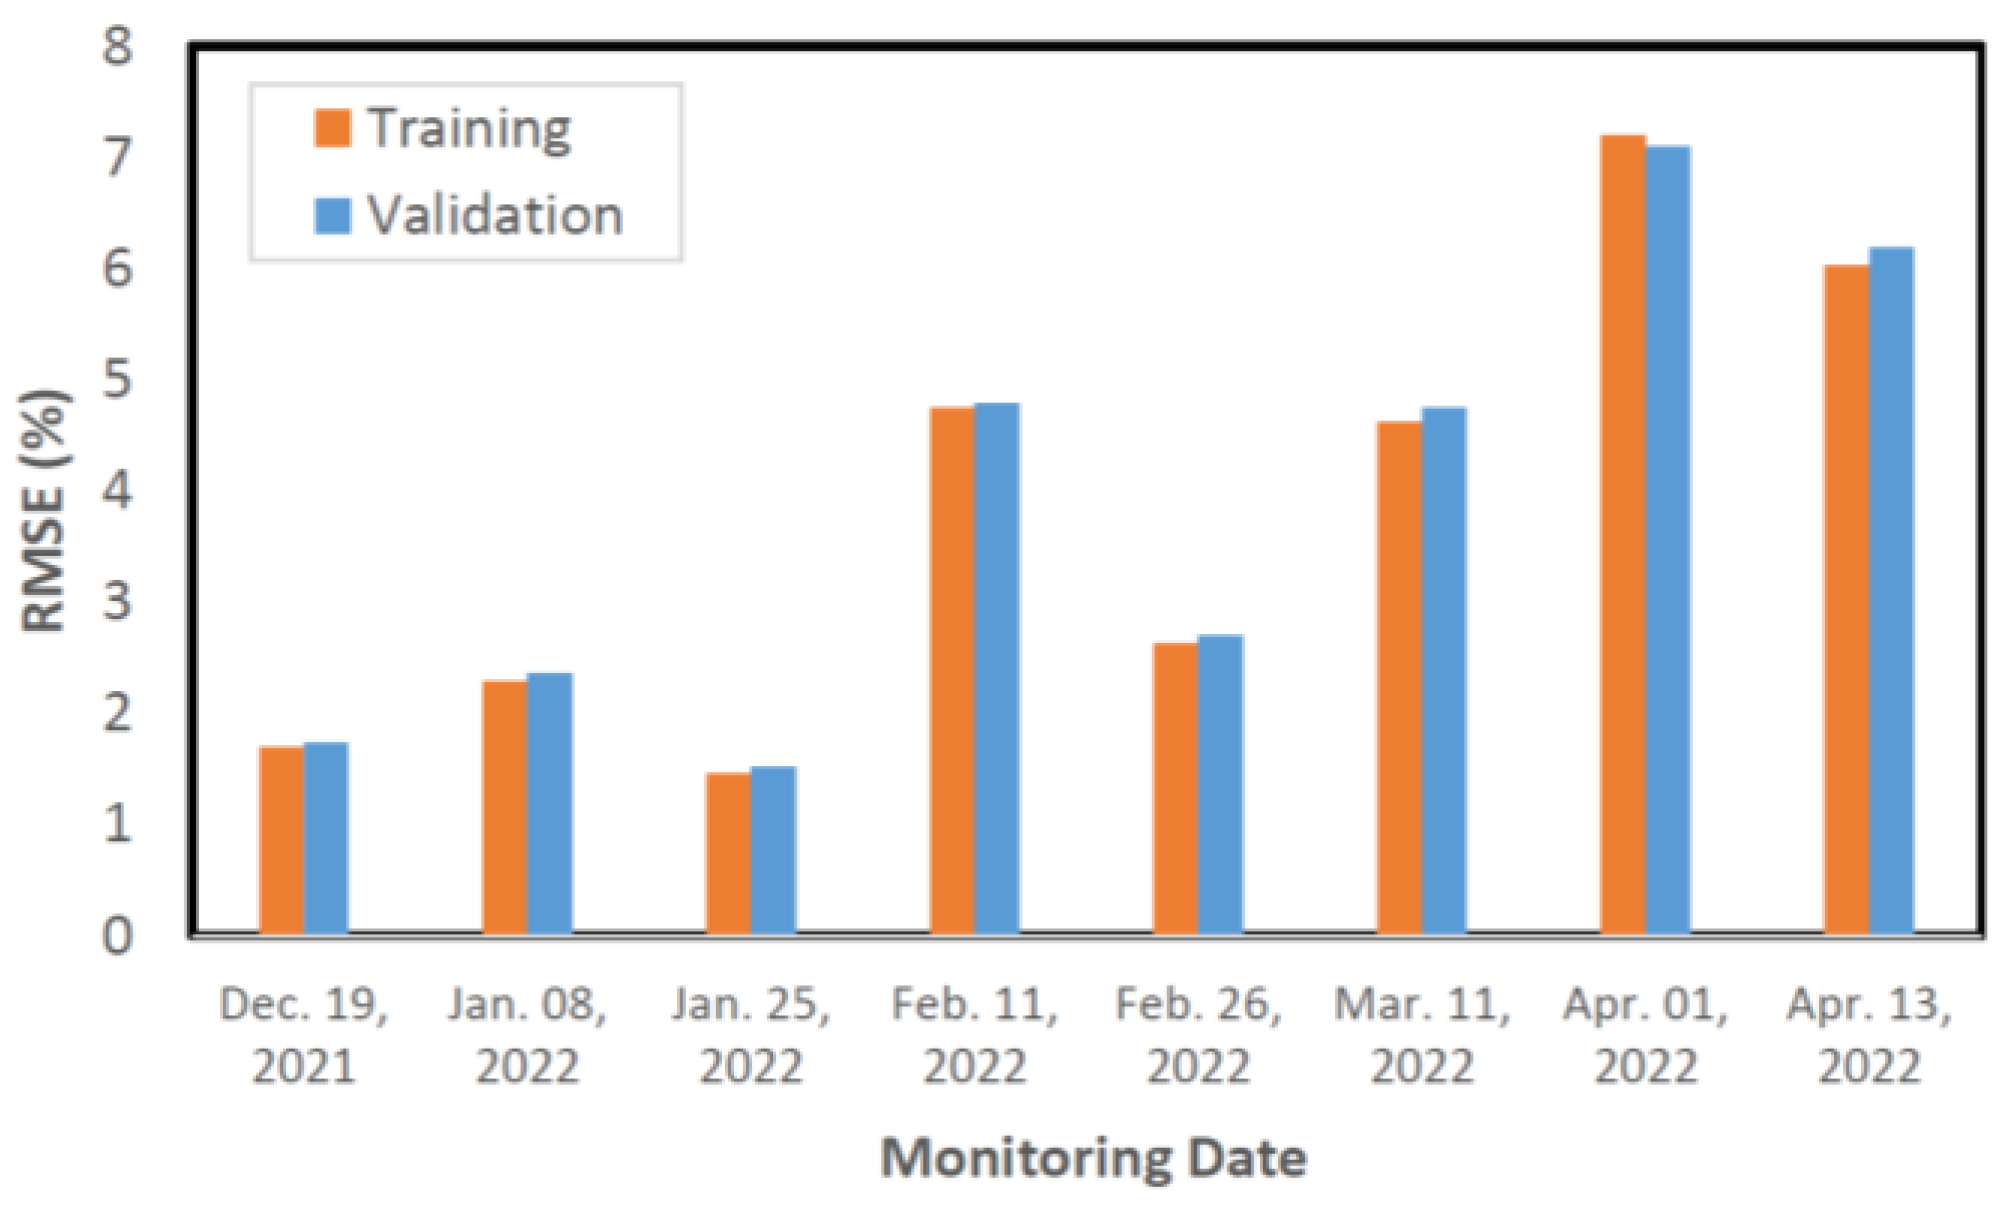
3.2. Soil Moisture Estimation and Accuracy Assessment Using the AI Model
3.3. Soil Moisture Estimation Map
3.4. Wheat Yield Estimation
4. Discussion
4.1. Relationship Between MPDI and Soil Moisture Content
4.2. The Feasibility of Applying the AI Model for Soil Moisture Estimation
4.3. Optimal Timing for Wheat Yield Prediction
4.4. Application Value and Future Development
- Irrigation Decision Support:
- 2.
- Adaptation to Extreme Climate:
- 3.
- Crop Yield Management:
- 4.
- Future Expansion Potential:
5. Conclusions
- The Modified MPDI Demonstrates Validity and Stability
- The AI Model Effectively Predicts Soil Moisture Distribution
- The Optimal Timing for Wheat Yield Prediction Is Between Irrigation and Maturity
Author Contributions
Funding
Data Availability Statement
Conflicts of Interest
References
- Vogel, E.; Donat, M.G.; Alexander, L.V.; Meinshausen, M.; Ray, D.K.; Karoly, D.J.; Meinshausen, N.; Friele, K. The effects of climate extremes on global agricultural yields. Environ. Res. Lett. 2019, 14, 054010. [Google Scholar] [CrossRef]
- D’Odorico, P.; Chiarelli, D.D.; Rosa, L.; Bini, A.; Zilberman, D.; Rulli, M.C. The global value of water in agriculture. Proc. Natl. Acad. Sci. USA 2020, 117, 21985–21993. [Google Scholar] [CrossRef] [PubMed]
- Abdelhaleem, F.S.; Basiouny, M.; Ashour, E.; Mahmoud, A. Application of remote sensing geographic information systems in irrigation water management under water scarcity conditions in Fayoum Egypt. J. Environ. Manag. 2021, 299, 113683. [Google Scholar] [CrossRef] [PubMed]
- Food and Agriculture Organization of the United Nations. World Reference Base for Soil Resources: International Soil Classification System for Naming Soils and Creating Legends for Soil Maps, 4th ed.; FAO: Rome, Italy, 2022. [Google Scholar]
- Huang, Y.-C.; Nguyen, K.A.; Chen, W. Soil erosion on Kinmen (Quemoy) Island. SSRN Electron. J. 2024, 1, 22. [Google Scholar] [CrossRef]
- Chen, L.; Xing, M.; He, B.; Wang, J.; Xu, M.; Song, Y.; Huang, X. Estimating soil moisture over winter wheat fields during growing season using RADARSAT-2 data. Remote Sens. 2022, 14, 2232. [Google Scholar] [CrossRef]
- Shoshany, M.; Spond, H.; Bar, D.E. Overcast versus clear-sky remote sensing: Comparing surface reflectance estimates. Int. J. Remote Sens. 2019, 40, 6610–6630. [Google Scholar] [CrossRef]
- Lu, F.; Sun, Y.; Hou, F. Using UAV visible images to estimate the soil moisture of steppe. Water 2020, 12, 2334. [Google Scholar] [CrossRef]
- Ghulam, A.; Qin, Q.; Zhan, Z. Designing of the perpendicular drought index. Environ. Geol. 2006, 52, 1045–1052. [Google Scholar] [CrossRef]
- Farhan, I.A.; Al-Bakri, J. Detection of a real time remote sensing indices and soil moisture for drought monitoring and assessment in Jordan. Open J. Geol. 2019, 9, 1048–1068. [Google Scholar] [CrossRef]
- Ghulam, A.; Qin, Q.; Teyip, T.; Li, Z.-L. Modified perpendicular drought index (MPDI): Areal-time drought monitoring method, I.S.P.R.S.J. Photogramm. Remote Sens. 2007, 62, 150–164. [Google Scholar] [CrossRef]
- Shahabfar, A.; Ghulam, A.; Eitzinger, J. Drought monitoring in Iran using the perpendicular drought indices. Int. J. Appl. Earth Obs. Geoinf. 2012, 18, 119–127. [Google Scholar] [CrossRef]
- Xu, D.; Guo, X. A study of soil line simulation from Landsat images in mixed grassland. Remote Sens. 2013, 5, 4533–4550. [Google Scholar] [CrossRef]
- Yoshioka, H.; Miura, T.; Demattê, J.A.M.; Batchily, K.; Huete, A.R. Derivation of soil line influence on two-band vegetation indices and vegetation isolines. Remote Sens. 2009, 1, 842–857. [Google Scholar] [CrossRef]
- Fox, G.A.; Sabbagh, G.J.; Searcy, S.W.; Yang, C. An automated soil line identification routine for remotely sensed images. Soil Sci. Soc. Am. J. 2004, 68, 1326–1331. [Google Scholar] [CrossRef]
- Wang, J.; Sha, J.; Liu, R.; Ren, S.; Zhao, X.; Liu, G. The study of various regression models establishment to identify farmland soil moisture content at different depths using unmanned aerial vehicle multispectral data: A case in North China Plain. Water 2024, 16, 807. [Google Scholar] [CrossRef]
- Koenker, R.; Bassett, G. Regression quantiles. Econometrica 1978, 46, 33–50. [Google Scholar] [CrossRef]
- ISO 11465:1993; Soil Quality—Determination of Dry Matter and Water Content on a Mass Basis—Gravimetric Method. International Organization for Standardization: Geneva, Switzerland, 1993.
- USDA NRCS. Soil Survey Manual; United States Department of Agriculture, Natural Resources Conservation Service: Washington, DC, USA, 2017.
- Zhao, J.; Peng, H.; Yang, J.; Huang, R.; Huo, Z.; Ma, Y. Response of winter wheat to different drought levels based on Google Earth Engine in the Huang-Huai-Hai Region, China. Agric. Water Manag. 2024, 292, 108662. [Google Scholar] [CrossRef]
- Yuan, H.; Liang, S.; Gao, Y.; Gao, Y.; Lian, X. Experimental study on estimating bare soil moisture content based on UAV multi-source remote sensing. Geocarto Int. 2025, 40, 2448985. [Google Scholar] [CrossRef]
- Hernandez, A.; Duarte, E.; Porter, P.; Brecht, H. Spatial predictions of soil moisture across a longitudinal gradient in semiarid ecosystems using UAV and RGB sensors. Geocarto Int. 2025, 40, 2461523. [Google Scholar] [CrossRef]
- Natekin, A.; Knoll, A. Gradient boosting machines: A tutorial. Front. Neurorobot. 2013, 7, 21. [Google Scholar] [CrossRef]
- Zhang, J.; Zhang, Q.; Bao, A.; Wang, Y. A new remote sensing dryness index based on the near-infrared and red spectral space. Remote Sens. 2019, 11, 456. [Google Scholar] [CrossRef]
- Li, Z.; Tan, D. The second modified perpendicular drought index (MPDI1): A combined drought monitoring method with soil moisture and vegetation index. J. Indian Soc. Remote Sens. 2013, 41, 873–881. [Google Scholar] [CrossRef]
- Lu, X.; Zhao, H.; Huang, Y.; Liu, S.; Ma, Z.; Jiang, Y.; Zhang, W.; Zhao, C. Generating daily soil moisture at 16 m spatial resolution using a spatiotemporal fusion model and modified perpendicular drought index. Sensors 2022, 22, 5366. [Google Scholar] [CrossRef] [PubMed]
- Tao, L.; Ryu, D.; Western, A.; Boyd, D. A new drought index for soil moisture monitoring based on MPDI-NDVI trapezoid space using MODIS data. Remote Sens. 2021, 13, 122. [Google Scholar] [CrossRef]
- Yao, P.; Fan, H.; Wu, Q. Optimal drought index selection for soil moisture monitoring at multiple depths in China’s agricultural regions. Agriculture 2025, 15, 423. [Google Scholar] [CrossRef]


| 19 December 2021 | 8 January 2022 | 25 January 2022 | 11 February 2022 |
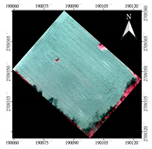 |  | 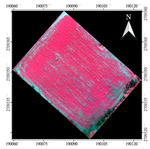 | 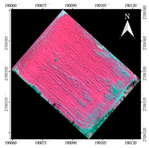 |
| 26 February 2022 | 11 March 2022 | 1 April 2022 | 13 April 2022 |
 |  |  | 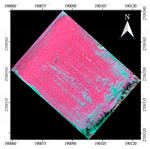 |
| Date | SP1 | SP2 | SP3 | SP4 | SP5 | SP6 | SP7 | SP8 | SP9 | SP10 | SP11 | SP12 |
|---|---|---|---|---|---|---|---|---|---|---|---|---|
| 19 December 2021 | 11.5 | 4.9 | 10.3 | 8.1 | 8.5 | 7.6 | 10.2 | 14.9 | 9.2 | 12.2 | 11.2 | 14.9 |
| 8 January 2022 | 13.0 | 9.5 | 10.6 | 10.0 | 15.7 | 9.8 | 12.2 | 11.3 | 15.5 | 17.7 | 8.1 | 8.7 |
| 25 January 2022 | 12.9 | 15.6 | 19.8 | 18.2 | 11.9 | 11.8 | 9.6 | 12.9 | 13.4 | 12.3 | 13.9 | 10.7 |
| 11 February 2022 | 22.4 | 20.3 | 24.5 | 17.8 | 14.5 | 25.8 | 23.1 | 24.0 | 31.3 | 15.7 | 28.2 | 16.3 |
| 26 February 2022 | 30.2 | 30.1 | 17.0 | 21.8 | 23.5 | 34.0 | 27.3 | 30.3 | 32.4 | 29.4 | 30.7 | 27.5 |
| 11 March 2022 | 17.5 | 21.5 | 21.5 | 24.3 | 22.1 | 20.1 | 7.1 | 12.4 | 4.1 | 5.7 | 4.6 | 12.0 |
| 1 April 2022 | 24.8 | 23.7 | 24.5 | 23.6 | 34.7 | 25.0 | 30.7 | 18.5 | 7.5 | 11.7 | 12.2 | 19.9 |
| 13 April 2022 | 2.6 | 3.4 | 2.7 | 3.2 | 17.2 | 15.2 | 3.6 | 3.2 | 16.9 | 15.1 | 16.0 | 21.4 |
| Sampling Point | Thousand-Grain Weight (g) | Total Weight (g) |
|---|---|---|
| SP1 | 31.2 | 266.4 |
| SP2 | 40.7 | 522.0 |
| SP3 | 41.7 | 251.3 |
| SP4 | 37.8 | 503.4 |
| SP5 | 37.5 | 118.1 |
| SP6 | 36.5 | 180.7 |
| Date | 19 December 2021 | 8 January 2022 |
| Regression Analysis Diagram |  |  |
| Date | 25 January 2022 | 11 February 2022 |
| Regression Analysis Diagram | 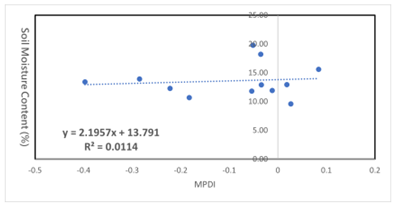 | 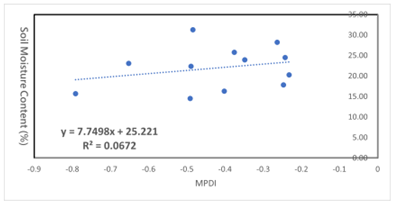 |
| Date | 26 February 2022 | 11 March 2022 |
| Regression Analysis Diagram |  | 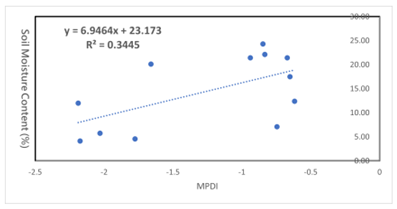 |
| Date | 1 April 2022 | 13 April 2022 |
| Regression Analysis Diagram |  |  |
| Date | 19 December 2021 | 8 January 2022 |
| Regression Analysis Diagram | 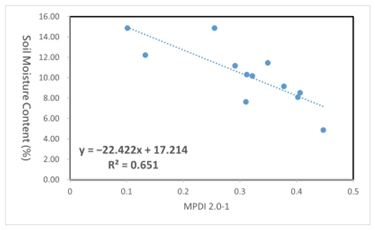 | 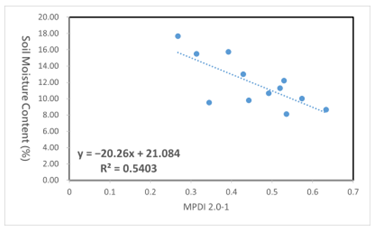 |
| Date | 25 January 2022 | 11 February 2022 |
| Regression Analysis Diagram | 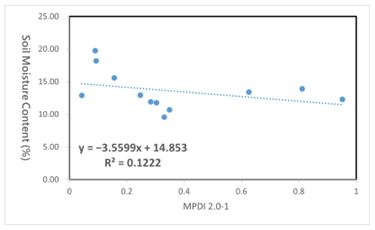 | 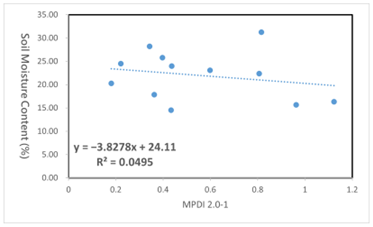 |
| Date | 26 February 2022 | 11 March 2022 |
| Regression Analysis Diagram | 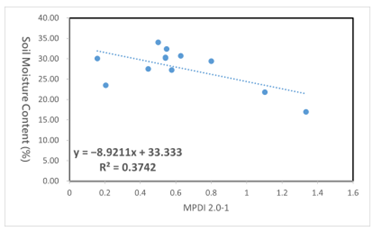 | 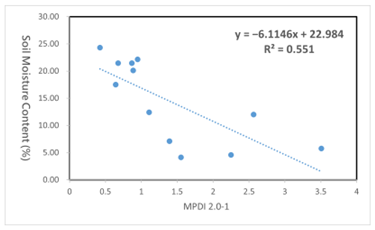 |
| Date | 1 April 2022 | 13 April 2022 |
| Regression Analysis Diagram | 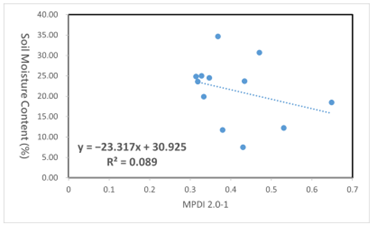 |  |
| Date | 19 December 2021 | 8 January 2022 |
 |  |  |
| Date | 25 January 2022 | 11 February 2022 |
 | 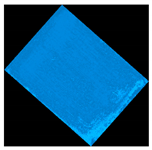 |  |
| Date | 26 February 2022 | 11 March 2022 |
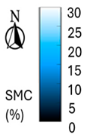 |  |  |
| Date | 1 April 2022 | 13 April 2022 |
 |  |  |
| Date | RMSE (g/m2) | |
|---|---|---|
| 19 December 2021 | 0.6163 | 132.24 |
| 8 January 2022 | 0.8664 | 115.30 |
| 25 January 2022 | NaN | NaN |
| 11 February 2022 | 0.6853 | 100.25 |
| 26 February 2022 | 0.7995 | 82.62 |
| 11 March 2022 | 0.6976 | 96.44 |
| 1 April 2022 | 0.9186 | 90.41 |
| 13 April 2022 | 0.2096 | 159.60 |
| Date for Training | Value | Date for Testing | Yield (kg) | Accuracy (%) |
|---|---|---|---|---|
| 19 December 2021 | 0.6163 | 10 December 2022 | 702.61 | 92.45 |
| 8 January 2022 | 0.8664 | 11 January 2023 | 807.48 | 93.75 |
| 25 January 2022 | 0.6853 | 19 February 2023 | 755.96 | 99.47 |
| 11 February 2022 | 0.7995 | 5 March 2023 | 764.91 | 99.35 |
| 26 February 2022 | 0.6976 | 18 March 2023 | 519.06 | 68.30 |
| 11 March 2022 | 0.9186 | 31 March 2023 | 795.49 | 95.33 |
| 1 April 2022 | 0.2096 | 14 April 2023 | 470.91 | 61.96 |
| 13 April 2022 | 0.6163 | 10 December 2022 | 702.61 | 92.45 |
Disclaimer/Publisher’s Note: The statements, opinions and data contained in all publications are solely those of the individual author(s) and contributor(s) and not of MDPI and/or the editor(s). MDPI and/or the editor(s) disclaim responsibility for any injury to people or property resulting from any ideas, methods, instructions or products referred to in the content. |
© 2025 by the authors. Licensee MDPI, Basel, Switzerland. This article is an open access article distributed under the terms and conditions of the Creative Commons Attribution (CC BY) license (https://creativecommons.org/licenses/by/4.0/).
Share and Cite
Su, T.-C.; Wu, T.-C.; Chen, H.-J. Improving Agricultural Efficiency of Dry Farmlands by Integrating Unmanned Aerial Vehicle Monitoring Data and Deep Learning. Land 2025, 14, 1179. https://doi.org/10.3390/land14061179
Su T-C, Wu T-C, Chen H-J. Improving Agricultural Efficiency of Dry Farmlands by Integrating Unmanned Aerial Vehicle Monitoring Data and Deep Learning. Land. 2025; 14(6):1179. https://doi.org/10.3390/land14061179
Chicago/Turabian StyleSu, Tung-Ching, Tsung-Chiang Wu, and Hsin-Ju Chen. 2025. "Improving Agricultural Efficiency of Dry Farmlands by Integrating Unmanned Aerial Vehicle Monitoring Data and Deep Learning" Land 14, no. 6: 1179. https://doi.org/10.3390/land14061179
APA StyleSu, T.-C., Wu, T.-C., & Chen, H.-J. (2025). Improving Agricultural Efficiency of Dry Farmlands by Integrating Unmanned Aerial Vehicle Monitoring Data and Deep Learning. Land, 14(6), 1179. https://doi.org/10.3390/land14061179