Article

The Impact of Urban Form on Carbon Emission Efficiency Under Public Transit-Oriented Development: Spatial Heterogeneity and Driving Forces

1
Faculty of Innovation and Design, City University of Macau, Macau 999078, China
2
School of Architecture and Design, Beijing Jiaotong University, Beijing 100091, China
3
Department of Networked Intelligence, Peng Cheng Laboratory, Shenzhen 518000, China
*
Author to whom correspondence should be addressed.
Land 2025, 14(6), 1172; https://doi.org/10.3390/land14061172
Submission received: 20 April 2025 / Revised: 23 May 2025 / Accepted: 27 May 2025 / Published: 29 May 2025

Abstract

Urban form optimization is crucial for controlling carbon emissions. Taking Shenzhen as a case study with 2022 data, this research constructs a multidimensional indicator system covering land use, functional mix, transportation structure, and spatial layout. It incorporates both static (inventory-based) and dynamic (transit-based) carbon efficiency metrics to capture complementary urban emission patterns. We employed OLS, GWR, and quantile regression methods to identify key influencing factors, spatial variations, and their impact on carbon emission efficiency. Results show that (1) compact road infrastructure and dense transit systems in the southwestern core contribute to higher efficiency, whereas extensive green coverage in eastern areas facilitates carbon sequestration; (2) elevated population and building densities in central zones are linked with lower efficiency, implying the necessity for balanced spatial redistribution and peripheral infrastructure enhancement; (3) despite comprehensive transit electrification, further improvements in network density and accessibility are essential to enhance urban low-carbon outcomes. These results establish a basis for optimizing urban spatial layout and reducing carbon emissions.

1. Introduction

The sweeping advancement of urbanization has facilitated high-velocity economic advancement, resulting in a surge in carbon emissions. Nearly 70% of global carbon dioxide emissions originate from cities [1]. Climate change exerts profound pressure on human well-being and ecological stability, driving international initiatives aimed at emission reduction. Aligned with China’s carbon neutrality strategy [2,3,4,5], this study targets CO2 emissions specifically, acknowledging that broader assessments often rely on CO2-equivalent metrics. Additionally, warming trends are influenced by factors such as land use patterns, radiative impacts, and natural carbon sequestration through vegetation and soil [6]. Currently, investigation in carbon reduction, emission mitigation, and carbon neutrality has received extensive attention across various fields [7,8,9,10]. After the outbreak of the COVID-19 pandemic in early 2020, Chinese cities faced the dual pressures of urgently needing economic recovery to elevate holistic living conditions while simultaneously reducing emissions to maintain a healthy natural environment. Economic reopening has increased population mobility and stimulated the development of urban transportation, which in turn has led to increased carbon emissions.
According to reports, carbon emissions in China increased by 565 million tons in 2023, reaching 1.26 billion tons. Carbon emissions resulting from fossil fuel combustion for energy combustion increased by 5.2% [11]. Transportation is the industry that ranks as the second-biggest source of global carbon emissions [12]. The periodic recovery of passenger transport contributed approximately 100 million tons to the increased carbon emissions in China. Although urban land use constitutes only 2% of the Earth’s surface, it contributes 80% to global carbon emissions. Therefore, under the premise of economic recovery, it is very important to mitigate the effects of the urban transportation structure and land utilization on carbon emissions and to implement reasonable and effective measures to operationalize low-carbon cityscapes [13].
Urban form is typically conceptualized as the spatial arrangement of a city and its physical components [14]. As a broadly defined and often ambiguous term, it may inadequately reflect the underlying spatial structures of urban patterns. In this study, urban form is more specifically framed as the spatial configuration and built environment features that structure urban functions and morphological layouts. This definition moves beyond generic descriptions by emphasizing measurable spatial characteristics at the intra-urban level. To operationalize this concept, a detailed indicator system is constructed, comprising four core dimensions: land use characteristics, functional diversity, transport infrastructure, and spatial organization. These indicators capture variations in urban development intensity, land allocation, and mobility dynamics. Through this framework, the study provides a more robust basis for evaluating how urban morphology influences carbon emission efficiency. Urban form affects urban development through multiple pathways, influencing land use, infrastructure distribution, and resource efficiency, which ultimately shapes urban carbon emissions [15,16]. Urban form has been studied from various perspectives and using a wide range of methodologies [15,16,17,18,19]. However, inconsistencies remain due to differences in research design, developmental stages of study areas, and analytical purposes. Although many studies suggest that higher population or employment density tends to reduce per capita carbon emissions, excessive concentration in highly centralized monocentric cities may exacerbate congestion and functional overlap, thereby increasing per capita emission levels [20]. Meanwhile, evidence from broader urban contexts shows a significant negative correlation between population density and road traffic-related carbon emissions [21]. These contrasting findings highlight the need to interpret the impacts of urban form on emissions with a consideration of local spatial structure and stages of urban development.
The second emphasis of this study focuses on the spatial determinants of the carbon emission efficiency. The concept of the carbon emission efficiency was first proposed by Kaya and Yokobori [22], who defined it as the ratio of carbon emissions to the gross domestic product (GDP). The introduction of the carbon emission efficiency concept has sparked significant interest among scholars, leading to extensive relevant research [23,24]. Extensive research relevant to the concerns of the present study has shown that carbon emission efficiency is one of the key indicators for assessing low-carbon economic performance, as it essentially accounts for the technical efficiency of carbon emissions in production, reflecting the efficiency of energy utilization during production activities [25]. Scholars have investigated the spatial configuration patterns of carbon emissions at the regional and urban levels by utilizing urban carbon emission rates, which has also helped governments formulate corresponding carbon reduction policies [26,27]. Understanding how to achieve lower carbon emissions while rapidly increasing economic or social value is particularly important for studying spatial carbon emission rates within cities [28,29]. Hence, the current analysis concentrates on the spatial configuration patterns of the carbon emission efficiency within cities, and these characteristics were analyzed via fine-scale calculation units. This study advanced beyond traditional city-scale calculations by dividing Shenzhen into multiple grids to calculate carbon emission efficiency elaborately. This approach not only revealed the spatial configuration patterns of carbon emission efficiency within the city but also allowed for a more specific analysis of how different urban form elements affect efficiency, contributing to a scientific basis for optimizing urban spatial planning.
The third research priority centers on the computational optimization of carbon emission efficiency quantification methodologies. Computational paradigms for carbon efficiency assessment bifurcate into single-factor and multi-factor analytical systems. Within the single-factor framework, efficiency quantification adopts emission-intensity coefficients—defined as the quotient of carbon dioxide emissions divided by key socioeconomic parameters (e.g., GDP, energy use) [30]. In contrast, the multi-factor approach accounts for the combined impact of variables such as capital, labor, and energy on carbon emission efficiency. However, previous investigations predominantly rely on static economic data, such as per capita GDP and annual average housing sales, while often overlooking the dynamic impact of population mobility due to urban transportation on carbon emission efficiency [31,32]. Existing methodologies typically derive carbon emissions from road units frameworks, integrating traffic metrics (e.g., vehicle ownership, vehicle types) and community survey data (e.g., home-workplace spatial distribution) [33,34,35]. However, these methods fail to fully capture the dynamic influence of different transportation modes, travel behaviors, and road usage on carbon emission efficiency. This investigation advances the computational protocol through urban spatial tessellation into fine-scale grids. The static carbon emission efficiency is formulated as the proportional scaling of emissions per unit area relative to per capita GDP, revealing spatial distribution characteristics of carbon mitigation efficiency across intra-urban zones. For the dynamic calculation, big data sources such as mobile signaling data, combined with real-time passenger card transactions and bus station inflow and outflow data, are incorporated to analyze carbon emission differences caused by population mobility in different regions. Furthermore, this study examines the impact of transportation mode choices, travel distances, traffic congestion, and bus occupancy rates on carbon emission efficiency. Synthesizing static and dynamic carbon emission efficiency metrics, this multimodal framework enables a holistic assessment of urban carbon intensity distribution patterns, capitalizing on the complementary strengths of static inventories and dynamic observational datasets to uncover intra-urban decarbonization disparities. This empirically validated framework creates pivotal support for analyzing how urban form influences carbon efficiency dynamics. This method establishes a higher-resolution computational framework, providing novel perspectives and methodological tools to optimize urban spatial patterns and enhance carbon mitigation efficiency.
Shenzhen, a pioneering member of China’s inaugural low-carbon city cohort, has attained metropolitan-leading operational efficiency in both energy utilization and emission metrics through strategic sectoral realignment and energy-mix refinement. The city’s morphology–emission interdependencies present a transferable paradigm for global urban decarbonization strategizing. In urban transportation, although Shenzhen has achieved 100% electrification of its public transit system, further optimizing urban form to enhance the carbon reduction efficiency of the transportation system remains a critical scientific issue worthy of in-depth exploration. Moreover, as a high-density city, Shenzhen’s compact development model differs significantly from urban development patterns in other countries, which may lead to variations in research outcomes. Currently, Shenzhen has reached a 100% urbanization rate. However, there are significant differences in population density and economic development levels across various areas of the city. Notwithstanding Shenzhen’s metropolitan-scale achievements, pronounced intra-urban disparities persist in both demographic concentration gradients and socioeconomic development indices. Accordingly, the study integrates three core themes: understanding how urban form influences emissions, identifying spatial factors affecting efficiency, and refining analytical methods. These aspects are closely connected and together guide the design of the research questions. This analytical imperative emerges from the need to decode urban morphology–carbon efficiency synergies in megacity systems, yielding three pivotal inquiries: (1) How do carbon emission efficiency indicators based on bus travel and inventory data differ spatially? (2) How do urban form factors influence carbon emission efficiency across spatial and efficiency dimensions? To answer these questions, the study implements a tiered analytical design: OLS is used to capture general relationships, GWR highlights spatial variations, and quantile regression identifies differential effects across the carbon efficiency spectrum. This integrated approach offers a multidimensional perspective on how urban form influences carbon emission efficiency at both spatial and performance levels.

2. Literature Review

Urban sustainability initiatives prioritize equilibrium optimization between anthropogenic socioeconomic systems and biophysical systems, advancing the development of carbon-constrained yet habitable societies [36]. Accelerated urban expansion has resulted in changes in land use types, increased populations, and disorderly urban sprawl, leading to diverse functional compositions and driving shifts in urban transportation structures. A rational spatial layout can help mitigate transportation congestion and optimize carbon flux efficiency. The quadripartite dimensions of the urban form—land use type, functional composition, transportation structure, and spatial layout—are complementary, collectively playing a crucial role in advancing carbon efficiency performance. Scholars have selected metrics spanning these four dimensions to holistically examine their relationships with urban carbon emissions.

2.1. Land Use Type

Rapid urbanization has significantly affected carbon emissions, driven primarily by key determinants including demographic magnitude, individual economic output, urban compactness, and urban expansion intensity [37,38,39]. It influences urban land use in various ways, which in turn impacts carbon emissions. Approximately half of urban CO2 discharges are linked to urban configuration, land use patterns, built environment typologies, transportation infrastructure, and vegetative cover [40]. Specifically, three primary mechanisms characterize this relationship. First, alterations in urban land use configurations significantly influence carbon emissions. Accelerated urbanization directly drives the transformation of agricultural lands (forestland, grassland, cropland) into developed zones (industrial, commercial, residential, transportation land) [41]. Forests, grasslands, and other vegetated land covers are displaced by impervious surfaces, precipitating metropolitan sprawl and carbon sequestration capacity degradation, thereby compromising terrestrial CO2 absorption capabilities [42]. Urban land utilization constitutes a pivotal determinant of urban carbon emissions through the bidirectional regulation of carbon sink reservoirs and emission source magnitudes [43]. Second, higher urban compactness is associated with greater carbon efficiency. Scholars have advocated for the development of compact cities. A characteristic of contemporary urbanization is urban sprawl with uncontrolled expansion resulting in homogenized land use structures, increased infrastructure costs, and reduced land use efficiency levels. However, if compactness exceeds a certain threshold, this may lead to various socioenvironmental issues, resulting in reduced urban CO2 social efficiency [44]. While compact development in high-density cities significantly reduces overall carbon emissions, residents in dense areas may face higher air pollution exposure, potentially conflicting with urban sustainability goals [45]. Third, more diverse land use types and the rational allocation of urban land use can reduce carbon emissions. Urban land use changes increasingly occur in diverse forms, including layout, density, and change rate variations. Empirical evidence reveals that spatially integrated, intensive, and multi-nodal urban configurations demonstrate capacity to minimize daily mobility ranges, consequently curtailing mobility-related energy expenditure and associated carbon outputs [46]. A case study in Beijing found that residents living in neighborhoods with higher retail density or mixed land use tend to travel shorter distances and generate lower CO2 emissions from non-work trips [47].

2.2. Functional Composition

The rational integration of functions can create a more efficient and sustainable urban environment. Density is a key indicator of functional integration and one of the central tenets for describing the urban spatial structure, which significantly impacts carbon emissions [48]. Numerous studies have shown that density indicators are related to industrial and household carbon emissions. Increasing the building density promotes the agglomeration of people and functions, with a close integration of residential, commercial, and employment areas, thereby reducing transportation carbon emissions. To increase the energy efficiency, the implementation of a shared infrastructure is essential. However, an increased building density suggests smaller distances between buildings, leading to greater heat accumulation between structures, which in turn boosts the cooling requirements in summer and reduces the heating demand in winter. In contrast, a higher building density reduces the demand for exterior lighting in residential areas, because more rays can be received from neighboring buildings and public roads [49].

2.3. Transportation Structure

Notably, improvement of the transportation structure is a crucial factor in achieving carbon reduction and emission mitigation. Factors including road conditions, transportation connectivity level, and transportation facilities markedly impact transportation-derived carbon emissions [50,51]. Currently, transportation emission reduction policies focus mainly on the introduction of next-generation energy-efficient vehicles and the improvement in public transportation systems. Studies have shown that since Brazil implemented its new energy vehicle policy in 2003, carbon emissions in various states have slightly decreased [52]. The transit-oriented development (TOD) strategy has been adopted in numerous cities in China, as TOD-oriented multimodal transportation systems can significantly reduce transportation carbon footprints by optimizing travel path efficiency and energy utilization structures [53]. While the population scale effect of transportation infrastructure contributes to emission reduction, its economic development and technological progress generally gain carbon emissions [54]. Although transit-oriented development (TOD) promotes public transit usage, its carbon reduction potential may be constrained by operational inefficiencies stemming from mismatches between transit supply and actual demand. For instance, a UK-based study found high empty-load rates for buses during off-peak hours or in oversupplied service areas, which elevate energy consumption per service unit, thereby undermining overall carbon emission efficiency [55]. These findings underscore the necessity of enhancing spatiotemporal precision in transit systems rather than indiscriminate supply expansion. Furthermore, the accessibility and connectivity of public transportation, alongside mixed land-use characteristics in residential areas, significantly influence travel mode choices and urban carbon efficiency. A Beijing-based study demonstrated that residents in neighborhoods with higher employment density and improved subway accessibility tend to adopt shorter-distance travel and sustainable commuting modes, such as cycling and subways [56]. These studies underscore the significance of optimizing the transportation structure to enhance carbon emission efficiency while recognizing the need to address complex local conditions and interrelated dynamic factors.

2.4. Spatial Layout

The spatial configuration focuses on the impact of human activities on urban environments with human activities as the main driver of increased carbon emissions [57]. Specific indicators include the population density and employment density among others [58]. Previous researches have demonstrated that the concentration of people affects carbon emissions [59]. Increasing the population density can promote technological advancement, enhance the efficiency of public facilities, and ultimately result in a decrease in resident-level carbon intensity [60,61]. Via the use of remote sensing data, researchers have reported that in East Asia and developed countries, a rise in the population concentration considerably reduces greenhouse gas emissions [62,63]. However, some studies have pointed out that while increasing population density may contribute to lower carbon emissions, it does not necessarily result in improved air quality. A study focusing on urban areas in the United States found that in high-density environments, vulnerable groups—such as the elderly and children—are more likely to be exposed to poor air conditions. The researchers emphasized that these health risks can be exacerbated by irrational urban spatial planning and highlighted the need for more inclusive and context-sensitive planning strategies to mitigate such challenges [64]. Notably, the impact of population concentration on air quality may differ across countries. In developed nations, private vehicle emissions and average household energy use per person are the main factors influencing air quality. However, these conditions do not fully align with China’s practical realities. China is still undergoing rapid urbanization with considerable variation in urban population density and infrastructure distribution. From the literature discussed above, it appears that there are divergent conclusions regarding how population density affects carbon emissions. These differences may stem from varying urbanization processes and social conditions across regions, necessitating further investigation into their causes.
In analyzing the influence of urban form on carbon emission efficiency, OLS, GWR, and quantile regression provide different analytical perspectives at various levels. OLS is used for overall fitting, offering a preliminary exploration of how urban form indicators (e.g., land use, transportation infrastructure) influence carbon emission efficiency [63]. However, it struggles to capture spatial heterogeneity. GWR addresses this limitation by incorporating geographic weights, revealing spatial variations in how urban form affects carbon emission efficiency across various regions [65]. For example, researchers have applied GWR to examine the spatial–temporal distribution of daily travel-related carbon emissions at the street scale and their response to urban form. Quantile regression further overcomes these limitations by assessing the influence of regressor variables at different quantiles of carbon emission efficiency, providing a deeper insight into their true impact. For instance, scholars have used quantile regression to analyze the heterogeneous effects of energy intensity and urbanization indicators on carbon emissions in the transportation sector [66]. The integrated use of these three methods facilitates a more holistic analysis, uncovering the intricate connection between urban form and carbon emission efficiency from overall, spatial, and dynamic perspectives.
Currently, studies exploring how urban form influences urban carbon emission efficiency exhibit discrepancies due to differences in the selection of control variables, data periods, econometric estimation strategies, and socioeconomic conditions across countries. These discrepancies may introduce biases in the research of urban carbon emission efficiency, making it difficult to both compare studies across contexts and formulate adequate urban planning policy measures that take into account specific local conditions. Neglecting the role of dynamic data may lead to misjudgments regarding travel behavior and the spatially heterogeneous patterns of carbon emissions, resulting in resource misallocation, worsening traffic congestion, and decreased energy efficiency. Therefore, future studies should integrate a comprehensive selection of indicators that capture different aspects of urban form along with appropriate econometric tools, relevant variables, and high-quality datasets.

3. Materials and Methodology
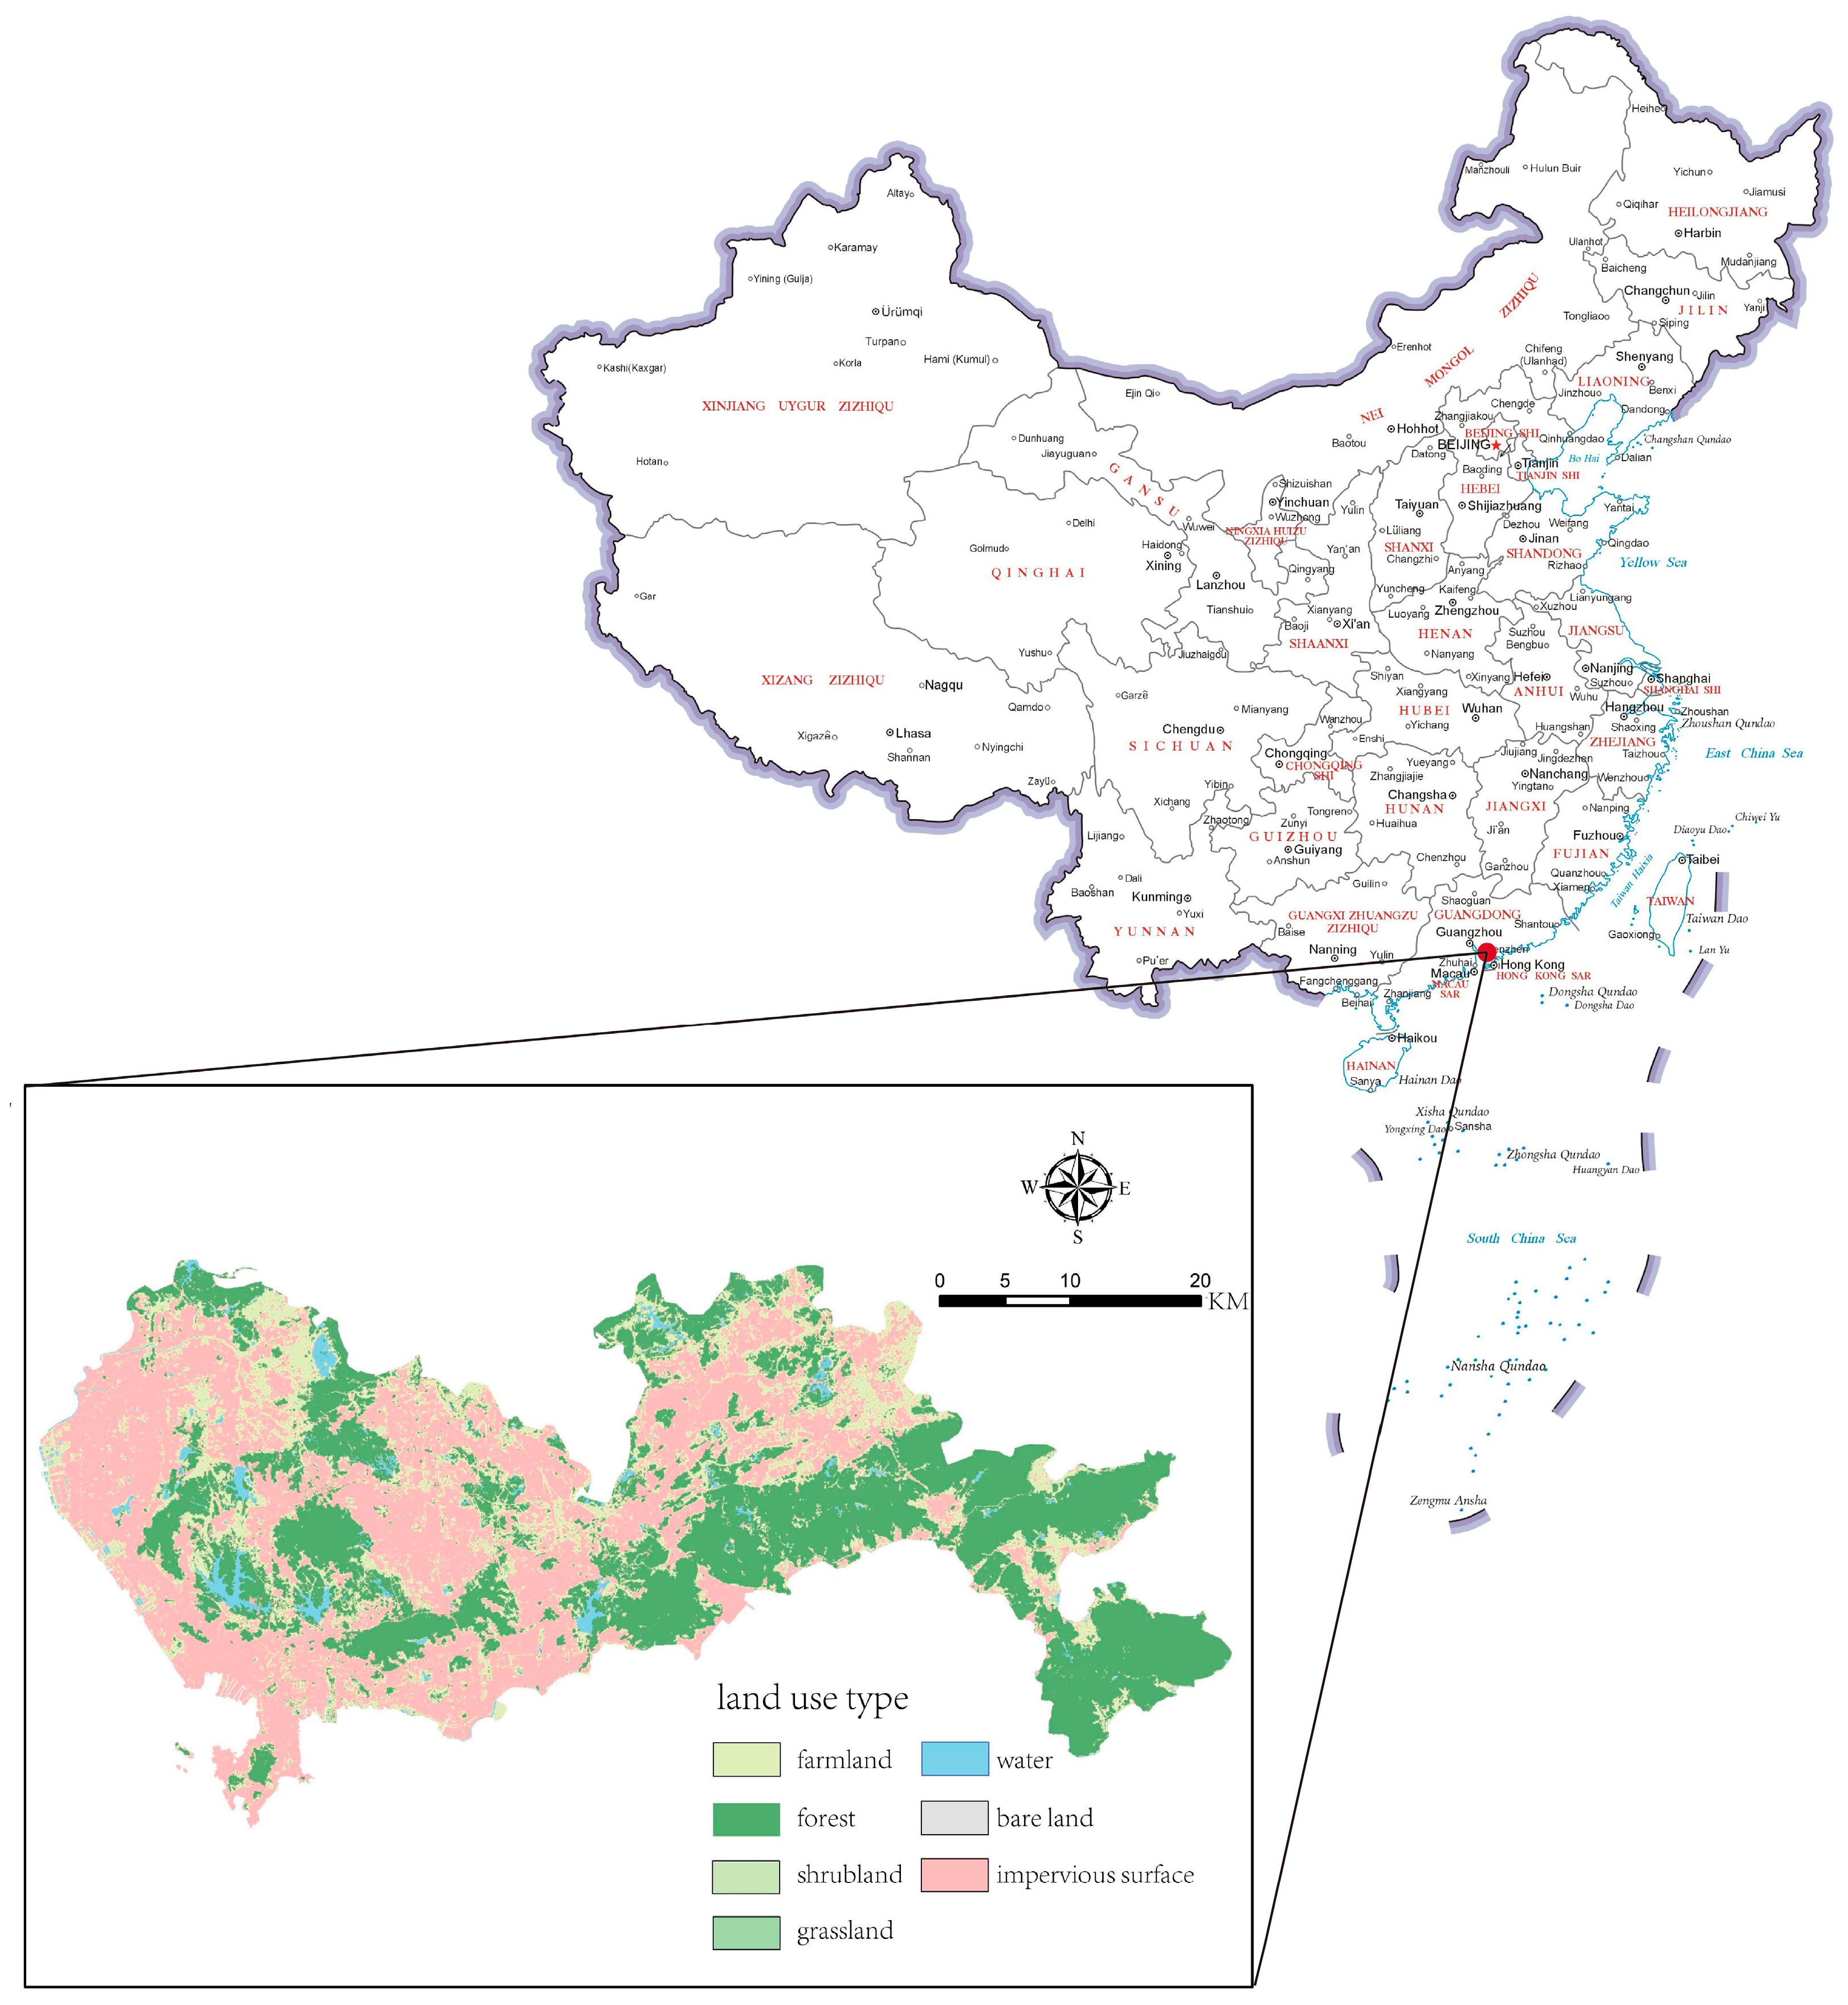
3.1. Study Area

Shenzhen (22°26′–22°52′ N, 113°46′–114°12′ E), Guangdong Province, was included in the pioneering group of national carbon-neutral testbed cities as early as 2010, rendering it one of the earliest regions to initiate carbon-neutral construction testbed projects [67]. As a pioneer in implementing the dual-carbon policy of China, Shenzhen’s practical strategies are of significant reference value. According to the Shenzhen Urban Master Plan 2020, the city has adopted a spatial structure characterized by three axes, two belts, and multiple centers. Over the past decade, since the operation of the first carbon trading market launched by a developing country, the carbon emission intensity in Shenzhen has decreased by 48%. Geographically, Shenzhen is bordered by Daya Bay and Huizhou to the east, faces Zhongshan and Zhuhai across Lingdingyang of the Pearl River Estuary to the west, neighbors Hong Kong along the Shenzhen River to the south, and adjoins Dongguan and Huizhou to the north [68]. Located along the eastern development axis of the Pearl River Delta urban cluster, Shenzhen serves as a key center in the region (Figure 1). The city has a subtropical maritime monsoon climate with annual temperatures typically ranging from 3 °C to 38 °C. Its dominant vegetation type is subtropical evergreen broad-leaved forest. With a total municipal area of 1951 km2 and a permanent population exceeding 15 million people, Shenzhen has evolved into a modern metropolis distinguished by economic prosperity, technological advancement, a high-quality environment, and a well-developed transportation system. Shenzhen’s high level of urbanization and economic efficiency has established itself as a central hub for economic integration with the Guangdong–Hong Kong–Macao Greater Bay Area. Notably, Nanshan District and Bao’an District have made significant breakthroughs in industrial added value and GDP. Previous studies on Shenzhen have mainly examined carbon emissions from land use and transport development, focusing on emission accounting and spatial growth [69,70]. However, under the backdrop of accelerated urbanization, reducing emissions alone is insufficient to achieve low-carbon development goals; enhancing carbon emission efficiency is essential. Compared to emission reduction, efficient economic output optimization enables higher economic benefits at the same emission level. Using grid-based calculations, this research examines how urban form influences carbon emission efficiency, contributing to a scientific foundation for optimizing urban spatial planning.

3.2. Carbon Emission Efficiency Calculation

This research adopted an alternative method due to the unavailability of input factor indicators for a multi-factor approach. The count of the carbon emission efficiency on the basis of weighted nighttime light brightness and residential density data is more suitable for cities and regions with minimal income disparity than for Shenzhen, which exhibits a high urbanization rate and significant wealth inequality. Moreover, existing studies have utilized high-resolution (1000 m) per capita GDP grid data to calculate carbon emission efficiency [71]. In light of data limitations, this study uses average residential housing prices as a proxy for grid-level economic output. While this proxy does not account for income disparity or sectoral structure, prior research has shown that housing prices effectively reflect local economic intensity under data constraints [72,73]. Carbon emissions were sourced from the European Commission’s EDGAR v8.0 database (2022), which estimates emissions based on sectoral activity data (e.g., fuel use, industrial output, transportation flows) and standardized emission factors. These are modeled estimates rather than direct measurements. The original spatial resolution is 0.1° × 0.1° (~11.1 km), using the GCS_WGS_1984 coordinate system. The data were downscaled to 1 km grids using bilinear interpolation to align with the spatial resolution of urban form indicators. Carbon emission efficiency (E) is calculated as follows:
E = C P
where E denotes the carbon emission efficiency, and C denotes the estimated carbon emissions in 2022 for each grid unit, obtained from the EDGAR v8.0 database maintained by the European Commission, with a resolution of 0.1° × 0.1° (approximately 11.1 km × 11.1 km), using the GCS_WGS_1984 coordinate system [74]. P refers to the proxy economic value, derived from the average residential housing prices in Shenzhen as of December 2022.
Human travel behavior is a critical factor influencing carbon emissions. To complement the inventory-based carbon efficiency measure derived from EDGAR data, this study introduces a second indicator based on public bus usage. As Shenzhen’s electric bus system achieves full spatial coverage, it provides a more behavior-sensitive and spatially refined proxy for transit-related emissions than metro or private vehicle data. In this study, we calculated per capita mileage carbon emissions using passenger card-swipe data and bus entry-exit records. Equation (2) computes the total per capita mileage carbon emissions for all buses B within grid g during period T .
C B g , T = E B g , T × f e m i s s i o n L B g , T
where C B g , T denotes the per capita mileage carbon emissions of all buses within grid g during period T , E B g , T denotes the total electricity consumption (kWh) of buses operating within grid g during period T , f e m i s s i o n is the carbon emission factor of power plants (kg CO2/kWh), and L B g , T denotes the total mileage (km) of all passengers travelling by bus within grid g during period T . If the passenger load along a given route is zero, the total mileage is attributed only to the individual mileage of the driver, resulting in the highest per capita mileage carbon emissions and the lowest carbon emission efficiency. A lower C B g , T value indicates greater socioeconomic benefits per unit of public transportation carbon emissions or lower depletion of resources for the same benefits at a given time and location.

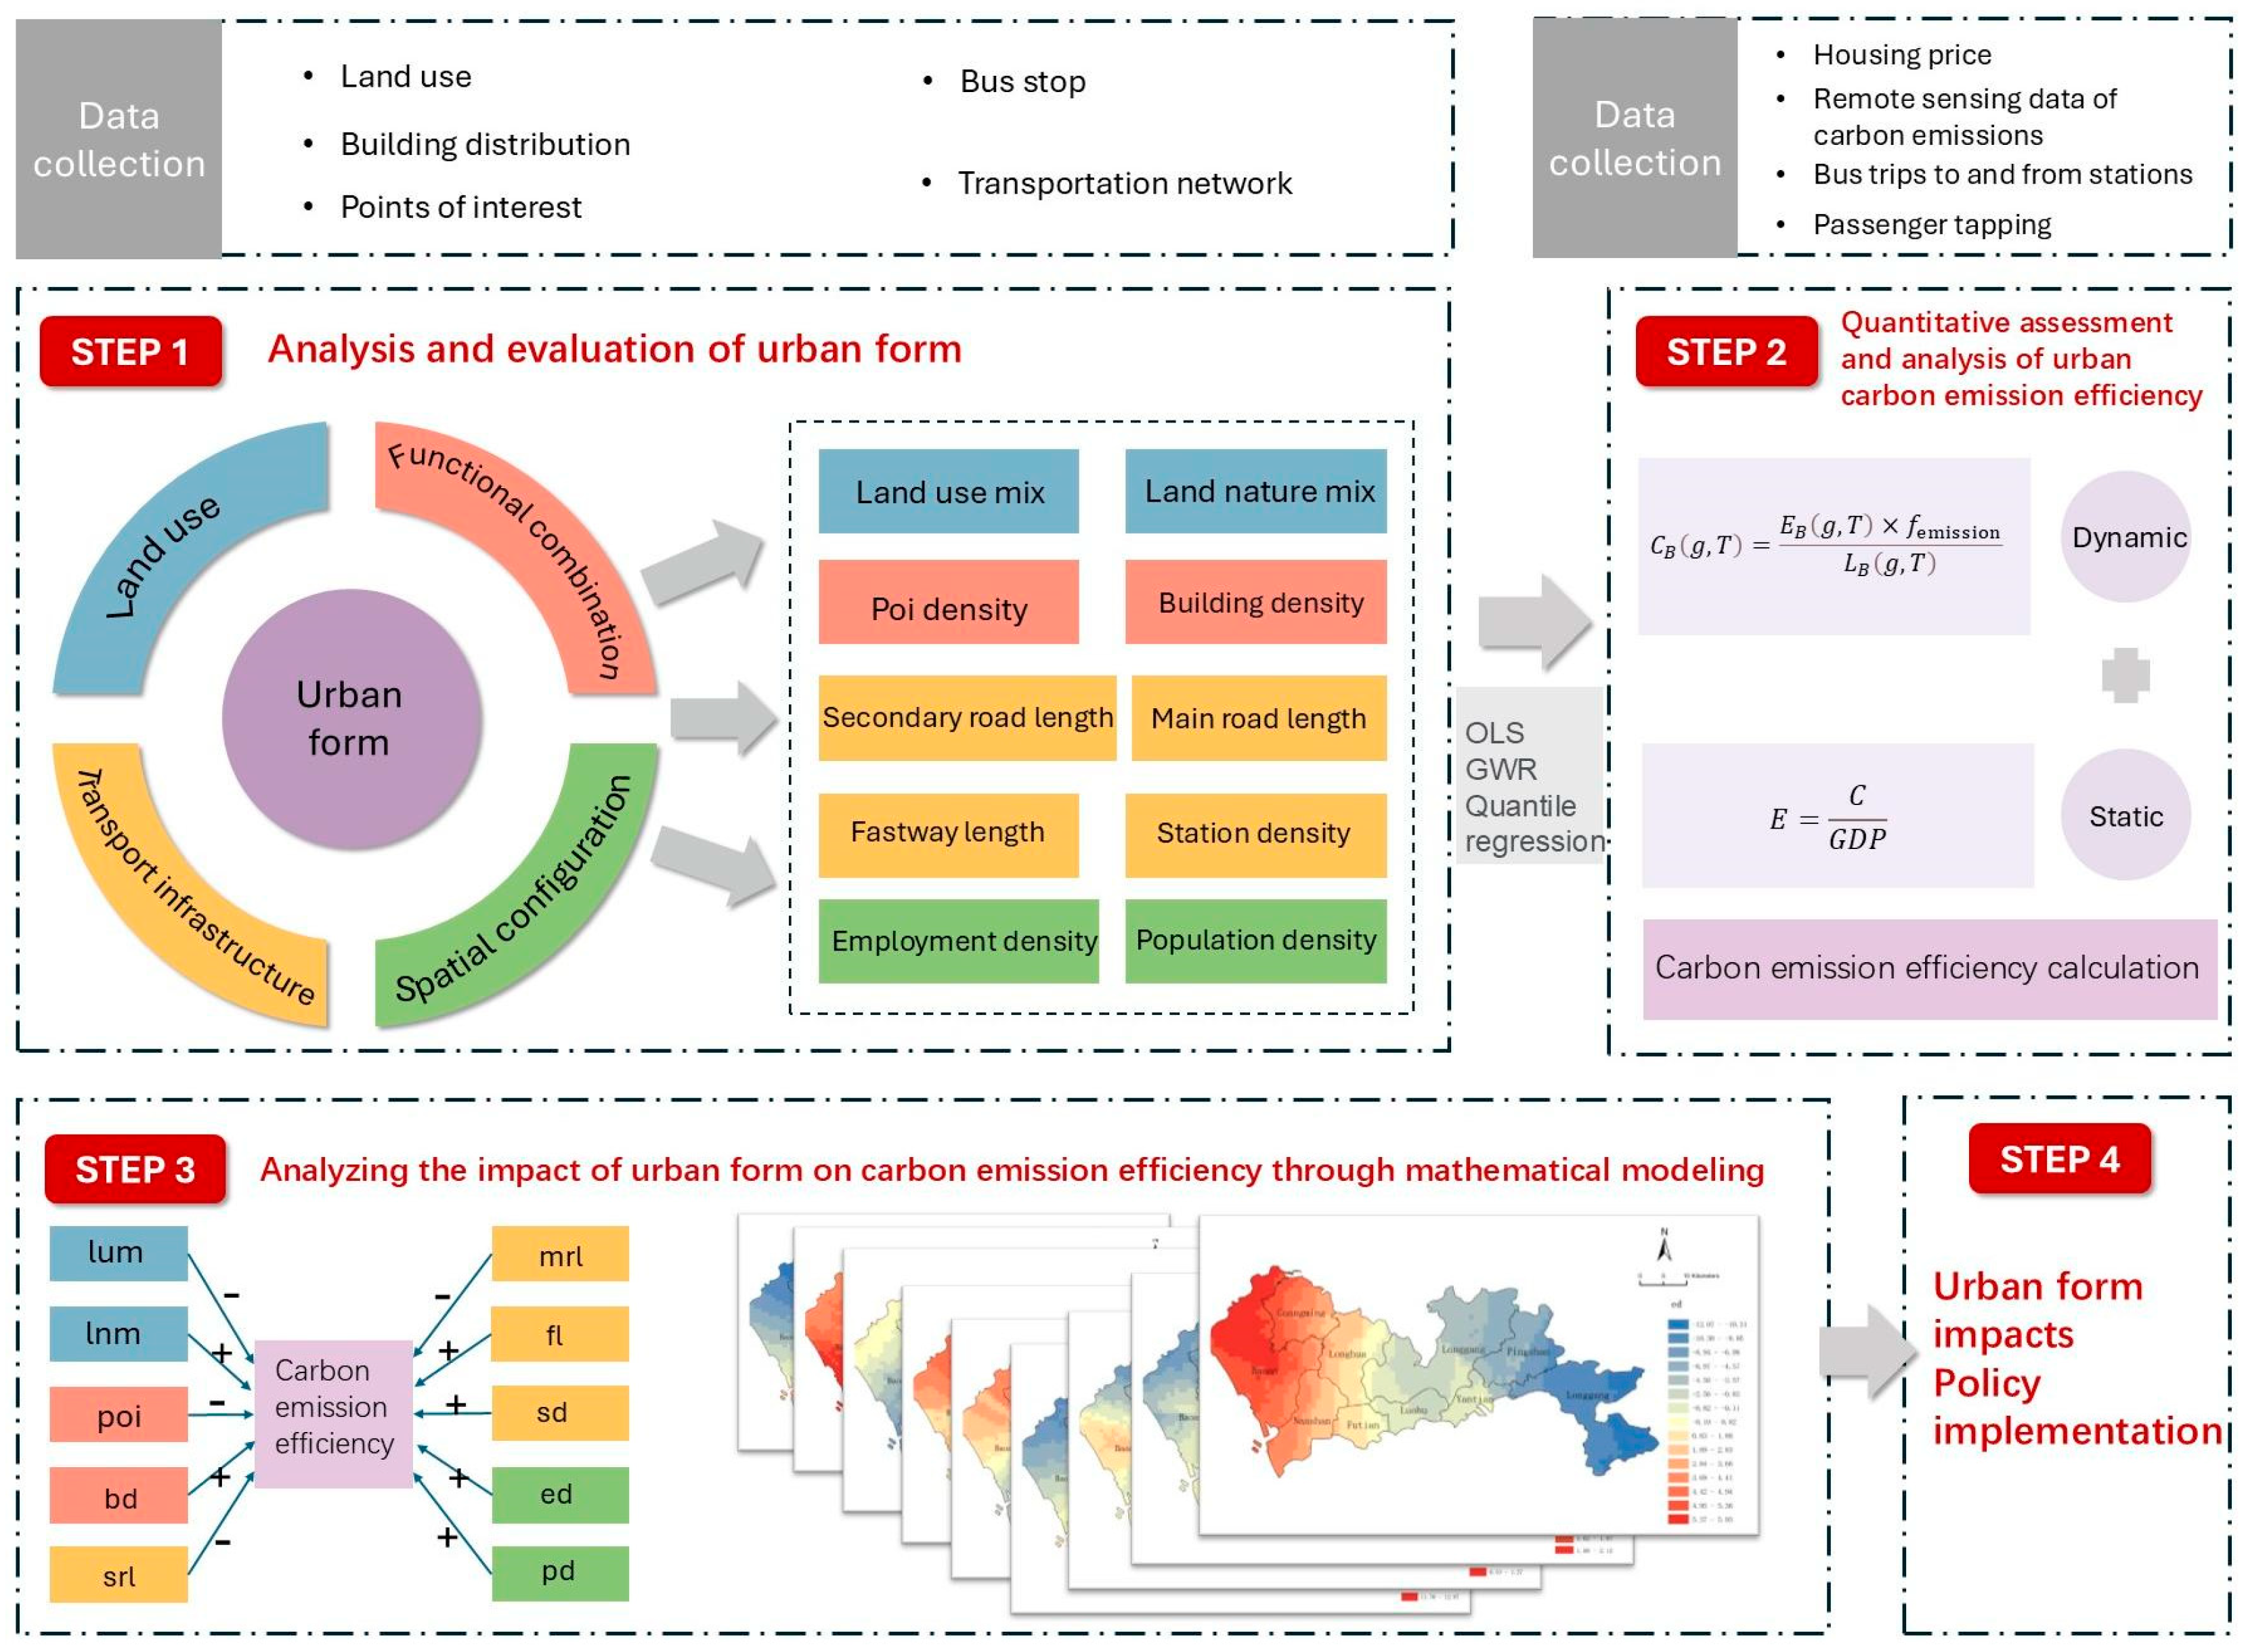
3.3. Research Methodology and Analytical Framework

Based on 2022 data from Shenzhen, this research encompassed four main steps, as shown in Figure 2. (1) Data on population density, land use, carbon emissions, transportation, etc., were collected and processed into a high-resolution 1 km grid. Urban form indicators were selected based on comparisons with international and domestic planning goals, focusing on land use, functional mix, transportation structure, and spatial layout. (2) ArcGIS 10.8 facilitated geospatial visualization through integrated static spatial attributes and dynamic temporal datasets, delineating spatial configuration patterns of carbon efficiency. (3) Multimethod econometric frameworks were systematically implemented to establish regression analytics, elucidating causal governance mechanisms between urban form parameters and carbon efficiency gradients alongside their spatial heterogeneity signatures. (4) Based on the results and regional conditions, governance strategies were formulated to increase the urban carbon emission efficiency via urban form optimization (Figure 2).

3.3.1. Indicator Construction and Data Processing

This study systematically selected specific urban form indicators across four dimensions: land use type, functional composition, transportation structure, and spatial layout (Table 1). All datasets used in the analysis correspond to the year 2022. To facilitate analysis, we developed a 1 km refined grid dataset and utilized mobile phone signal data to assess population and employment densities. Work locations were identified as places where individuals remained for over six hours during the daytime for more than three months, while residential locations followed the same criteria based on nighttime stays. All data were processed in ArcGIS 10.8.1 using default parameter settings to ensure consistency. In addition, we introduced a control variable, Mountainous Area, to account for the potential influence of topographic constraints on land development, accessibility, and carbon emission patterns. A grid cell was classified as mountainous if more than 50% of its area was covered by forest based on the 30 m land use classification data.

3.3.2. Modelling Framework

This study examines the overall effect of urban form on carbon emission efficiency in Shenzhen in conjunction with its spatial heterogeneity and the magnitude of effect at diverse efficiency levels. First, the study employs an ordinary least squares (OLS) regression model to analyze the overall spatially contingent effects of urban form on carbon emission efficiency. Then, we adopt a geographically weighted regression (GWR) model to capture geographical non-stationarity and reveal the localized effects of urban form on carbon emission efficiency. Finally, the analysis applies a quantile regression model to examine threshold effects and uncover the mechanisms driving the spatial variations identified in the GWR results. This approach provides a comprehensive understanding of the role of urban form on carbon emission efficiency through a geographically varying and quantile-adaptive modelling framework.

3.3.3. Ordinary Least Squares (OLS)

The research model employs multiple linear regression (i.e., OLS), which is the most classical statistical method for analyzing the correlation linking urban form to carbon emission efficiency. The model is given by
Y i = β o + K = 1 P β K X i K + ε i
where Y i denotes the carbon emission efficiency within the high-resolution grids of Shenzhen, β o is the intercept,   P is the number of selected morphological indicators, X i K is the value of the k-th morphological indicator of city i, β K is the regression coefficient of the k-th indicator, and ε i is the random error. OLS seeks to identify the optimal global covariant trend through minimum-variance unbiased estimators, thereby determining if there exists a covariant association of urban morphological indicators with urban carbon emission efficiency, as well as calculating correlation coefficients. The variance inflation factor (VIF) among the urban morphological indicators is 2.91 (VIF < 10) in this research, indicating no multicollinearity. Therefore, there is no need to exclude variables.

3.3.4. Geographically Weighted Regression (GWR)

The GWR method is a spatial modeling technique extensively applied to geocomputation and its intersecting fields. This approach produces location-specific parameter estimates to decipher geospatial variability and multiscale causal dynamics while enabling spatial predictions [75]. In contrast to global regression frameworks that compute spatially-invariant coefficient estimates, GWR generates location-specific parameters to capture geographically heterogeneous relationships between variables. This model not only captures previously overlooked local characteristics but also provides advantages over traditional models [76]. GWR captures the local effects of spatial objects and represents them as follows:
y i = β 0 u i , v i + m = 1 p β m u i , v i x i m + ε i
where y i denotes the dependent variable at point I , u i , v i denotes the latitude and longitude coordinates of point i , β m u i , v i denotes the m -th coefficient at point I , x i m denotes the m -th independent variable at point i , and ε i is the error term at point i .

3.3.5. Quantile Regression Model

Classical mean regression via the OLS model is susceptible to the influence of outliers. In contrast, the quantile regression model can be used to analyze the nonlinear implications of the drivers of the urban carbon emission efficiency and more comprehensively describe the differences in influences across percentiles of the dependent variable. This method was first proposed by Koenker and Hallock [77]. Quantile regression fully utilizes sample data to perform regression analysis at multiple quantiles. In contrast to mean and median regression approaches, quantile regression exhibits unique advantages in analyzing the tail characteristics of the conditional distribution [78]. Additionally, it does not require the consideration of outliers, and its estimation process is more robust, rendering it less sensitive to fluctuations due to outliers. The quantile regression model represents the relationship as follows:
P v , β τ = β 0 τ + β 1 τ v + + β n τ v k
where P v , β τ denotes the carbon emission efficiency at the conditional quantile τ , and β τ = β 0 τ , β 1 τ , , β 0 τ denotes the model coefficients to be determined at the conditional quantile τ . The model coefficients can be calculated via Equations (6) and (7):
β ^ τ = a r g m i n i = 1 N ρ τ y i p ( v i , β ( τ ) )
ρ τ u = τ u ,     1 τ u ,   u 0 u < 0 τ ϵ ( 0 , 1 )
where ρ τ u is the pinball loss function, which is also referred to as the asymmetric absolute value function. We employed Stata 18 software to conduct quantile regression analysis. To assess the model’s fit quality, we calculated R2 and used the Akaike information criterion (AIC) and the Bayesian information criterion (BIC). Via the comparison of coefficients at different quantiles, we obtained greater insights into the impact of the urban form at various carbon emission efficiency levels.

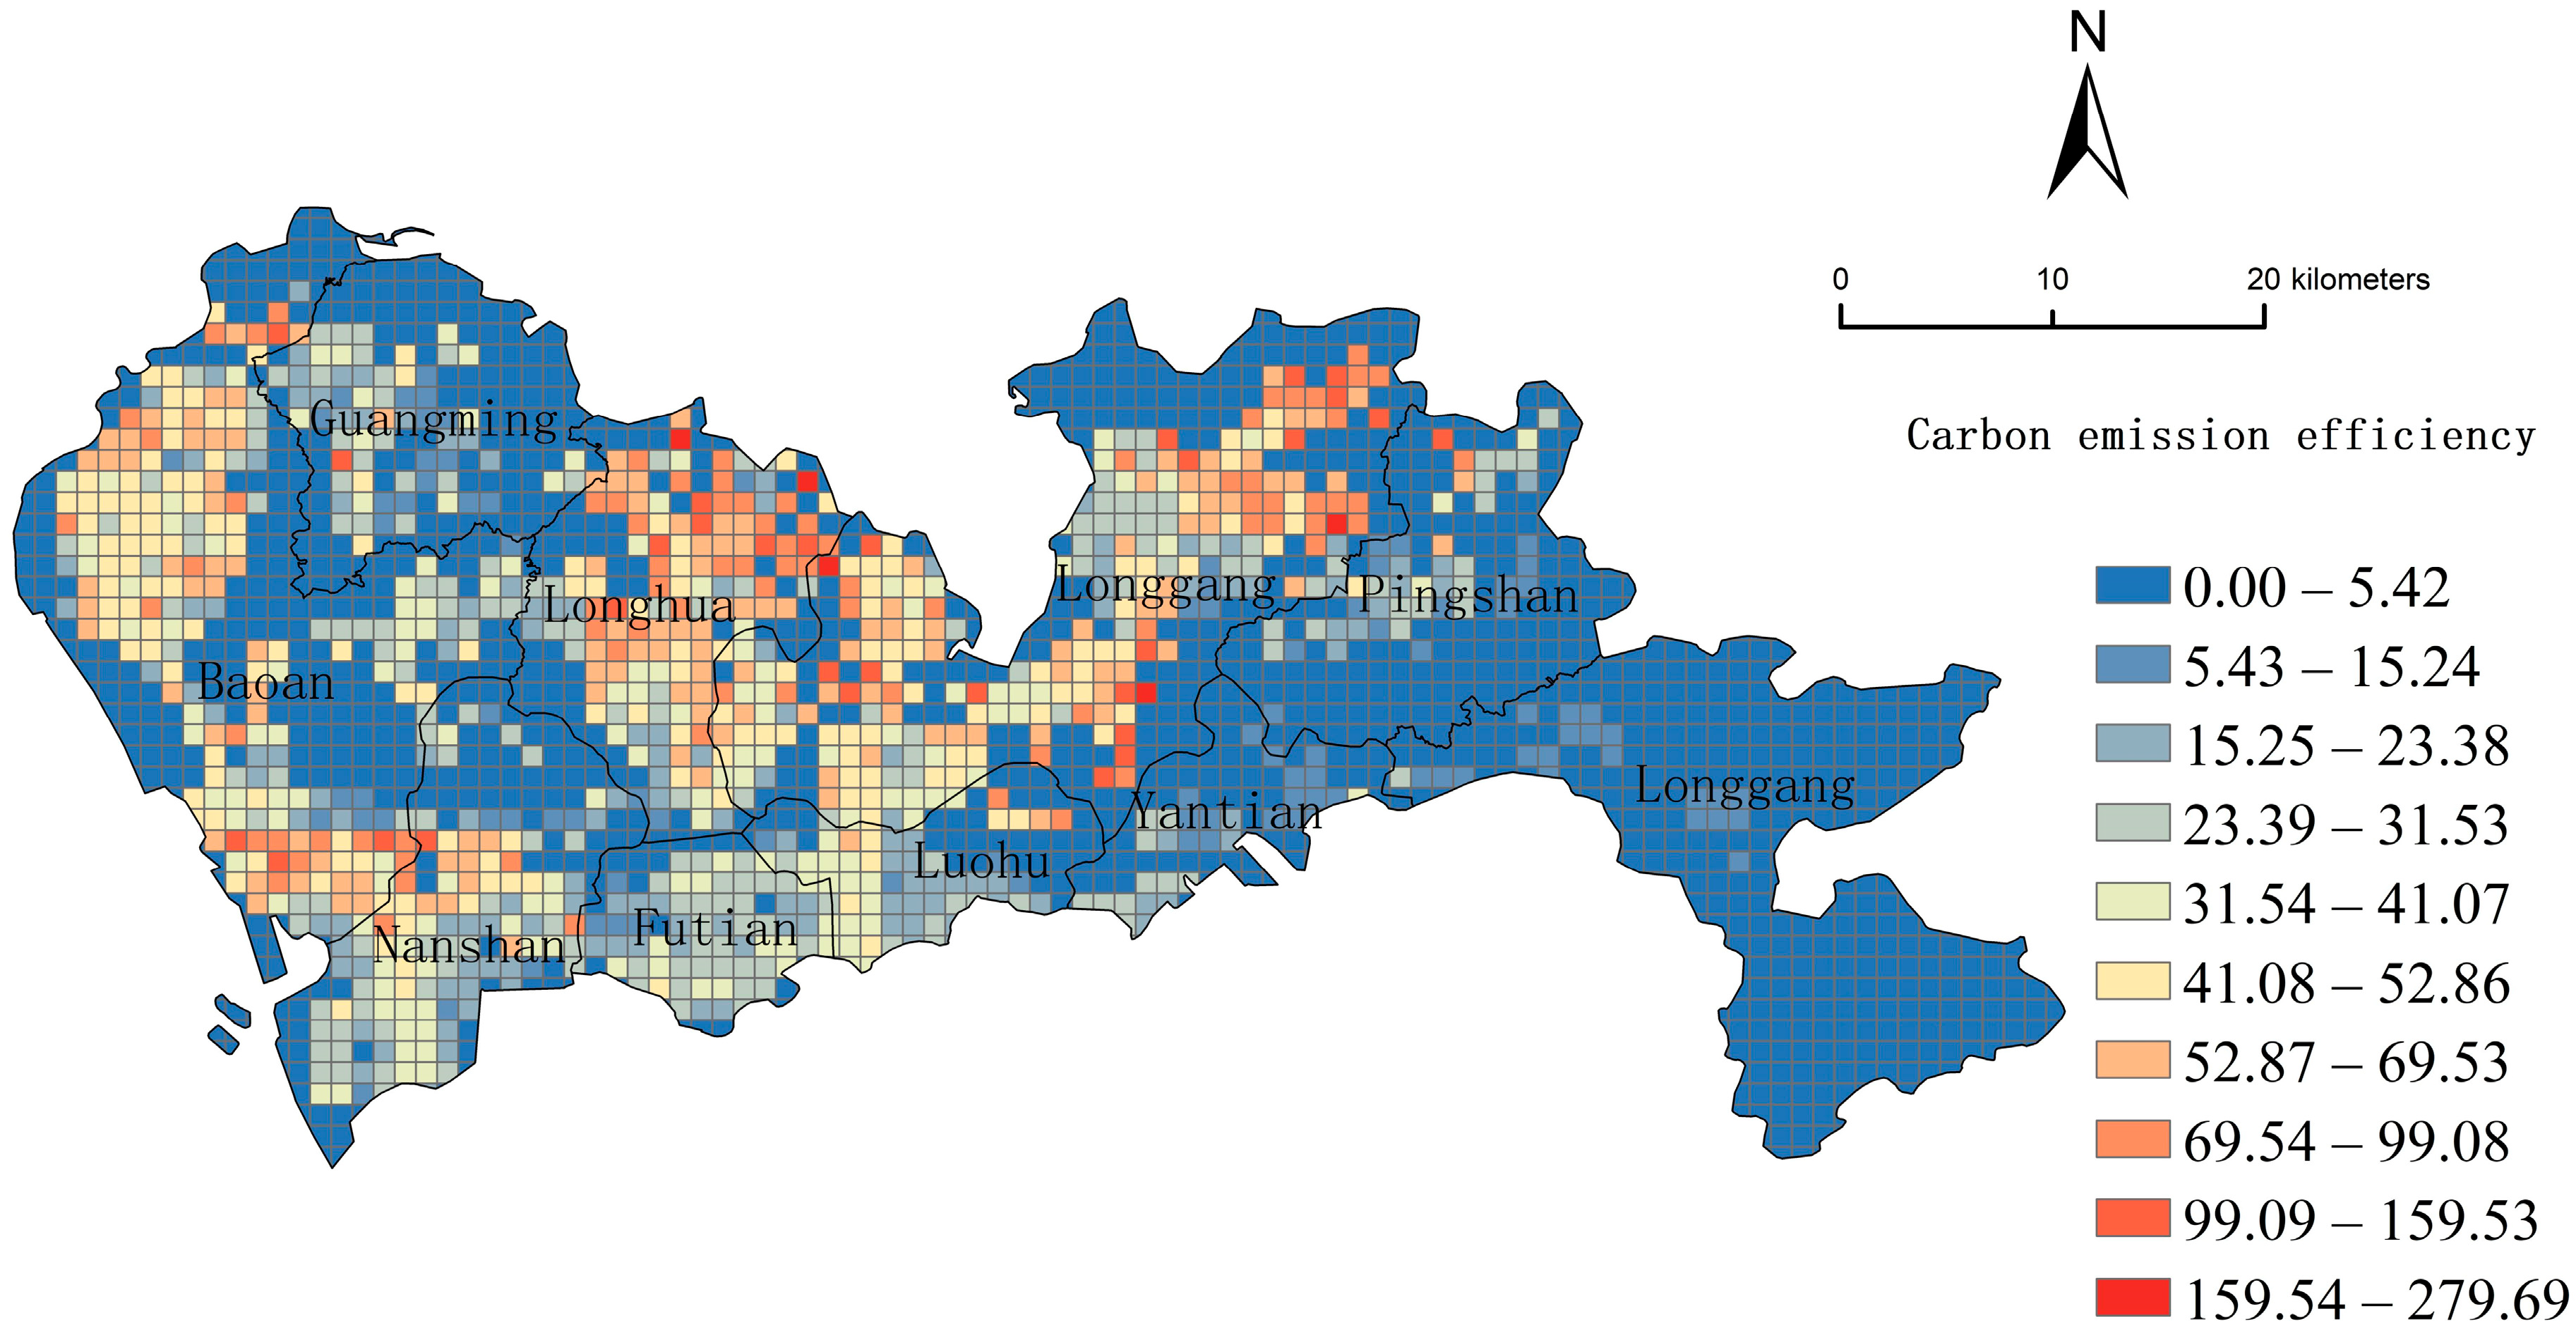
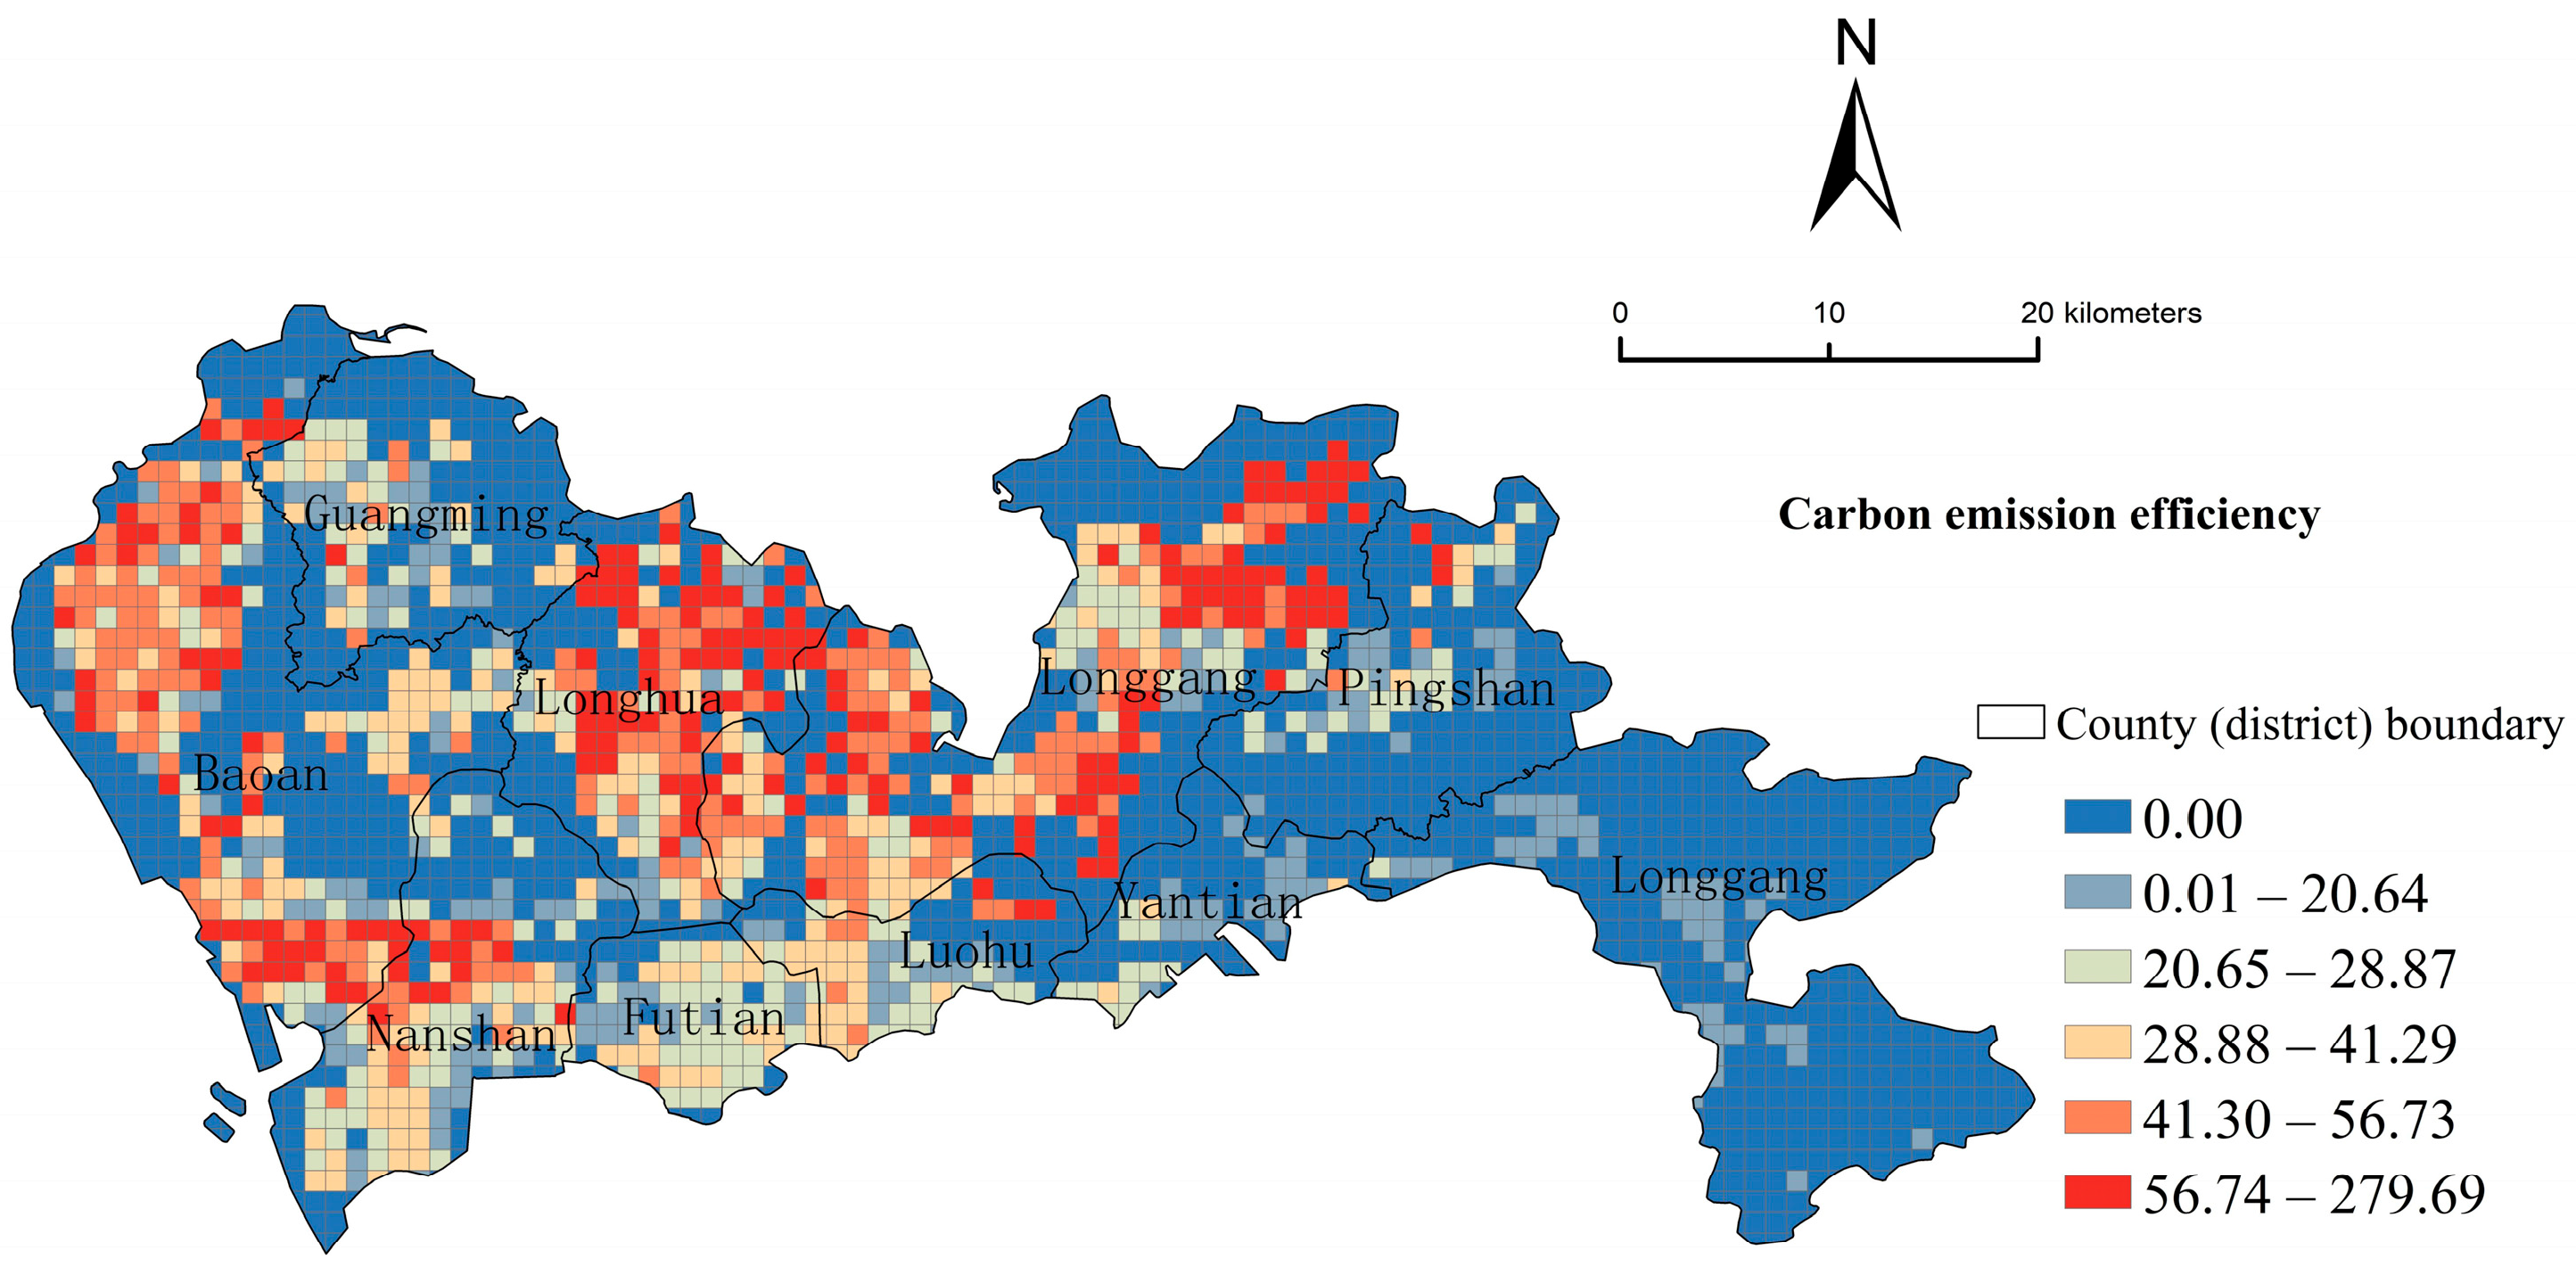
4. Intra-Urban Disparities in Carbon Emission Efficiency Across Shenzhen

To figure out how urban form shapes carbon efficiency in Shenzhen, we first examined the intra-urban disparities in carbon emission efficiency across Shenzhen. Carbon emission efficiency is measured as the ratio of estimated carbon emissions to a proxy of economic activity at the grid level. The latter is derived from a combination of employment density and average housing prices at the grid level. A higher ratio indicates lower efficiency, as it reflects more emissions per unit of estimated economic intensity. It should be noted that in the resulting maps, higher values indicate lower carbon emission efficiency, as they reflect more emissions per unit of estimated economic intensity—approximated by employment density and housing prices. Using the data overlay method, we constructed a high-resolution carbon emission efficiency network for Shenzhen and classified it based on natural breakpoints to derive its spatial distribution (Figure 3). Areas with higher carbon emission efficiency are primarily concentrated in the southern portions of Shenzhen, including Yantian District, Futian District, Luohu District, and southern Nanshan District. Although this region represents the fastest-developing part of Shenzhen, it exhibits a relatively high carbon emission efficiency, highlighting the importance of studying urban form characteristics. Shenzhen has developed through agglomeration, advanced infrastructure, a dense transportation network, and effective public transit planning. The city exhibits a multifunctional land use mix characterized by a balanced distribution of residential, industrial and commercial land uses. Synergistic and integrated blue–green infrastructure networks increase the carbon sequestration capacity of the city. The eastern Longgang District and southeastern Pingshan District exhibit high green space coverage and relatively low population density, resulting in substantial carbon sinks resulting from large forest areas. Due to limited population and economic activity, these areas present relatively low carbon emissions and proxy economic output in this study, resulting in lower levels of calculated carbon emission efficiency. It should be noted that green and blue spaces contribute directly to urban carbon mitigation by absorbing and storing CO2 [79]. However, such ecological functions are not explicitly included in the carbon emission efficiency indicator, which is based on the ratio of emissions to proxy economic output. Longhua District, Bao’an District, and the northern part of Longgang District also demonstrate low carbon emission efficiency levels. These areas are dominated by industrial parks with limited functional diversity and a spatial mismatch between jobs and affordable housing. As a result, many workers commute long distances from residential zones on the urban periphery. Although public transportation such as subways and buses is commonly used, the overall carbon efficiency remains low due to the intensity and length of commuting patterns, potentially combined with multimodal transfers. At the same time, Shenzhen exhibits marked spatial differences in the carbon emission efficiency, necessitating further research into urban form indicators and their impact on the carbon emission efficiency.
To better understand the geospatial distribution of the carbon emission efficiency in Shenzhen, the dynamic per capita mileage carbon emissions calculated via bus card data were compared with the static carbon emission efficiency calculations derived from average housing prices (Figure 4). The calculation results revealed differences, primarily in the central–northern and southern regions of Shenzhen. In the central–northern region, although the public transport network is not dense, certain parts exhibit higher per capita mileage carbon emission efficiency levels, yet the overall carbon emission efficiency remains low. The transportation structure’s bearing on carbon emissions within these areas is relatively minor with industrial production and spatial structure exerting greater influences. In the southern region, particularly in coastal areas, which represent the core development zone of Shenzhen, the overall carbon emission efficiency is high. However, some areas exhibit a low per capita mileage carbon emission efficiency. The high population and employment density in the southern region generate significant transportation demand, but low utilization rates in certain areas warrant further investigation to understand the underlying causes.

5. Analysis of the Factors Affecting the Carbon Emission Efficiency in Shenzhen

5.1. Comprehensive Evaluation of the Effects of the Urban Form on the Carbon Emission Efficiency

The OLS regression analysis results for the effects of the urban form indicators on the carbon emission efficiency are presented in Table 2. The urban form indicators include 10 metrics selected from four aspects, i.e., spatial layout, transportation structure, land use, and functional mix, and their impact on the carbon emission efficiency was assessed. Notably, the higher the per-unit GDP carbon emission, the less efficient the carbon emission. Consequently, the influence of various structural–spatial components on the carbon emission efficiency inversely correlates with their effect on the per unit GDP carbon emissions. The table presents standardized regression coefficients, showing no significant multicollinearity issues. The results indicated that land use characteristics (p < 0.01), point of interest (POI) density (p < 0.01), major road length (p < 0.05), and secondary road length (p < 0.1) were significantly negatively correlated with the carbon emissions per unit of GDP, which empirically corroborates earlier research. Rapid urbanization has continuously increased the land use efficiency, positioning Shenzhen among China’s urban frontrunners in carbon intensity reduction [69]. Furthermore, the continuous advancement of the transportation network has increased route interconnectivity and reduced traffic congestion while also enhancing public transportation accessibility, encouraging residents to use buses, and increasing ridership. The results also indirectly demonstrate the effectiveness of Shenzhen’s policy of promoting electric vehicles to lower carbon emissions with the proportion of electric vehicles in Shenzhen reaching 43% by the end of 2022.
The OLS findings of the current research differ significantly from those of existing regression studies. The land use mix is significantly and positively correlated with the carbon emissions per GDP unit (p < 0.01), indicating an inverse relationship with the carbon emission efficiency. This suggests that the smaller the number of POIs, the higher the carbon emission efficiency. Mixed land use can shorten the residents’ travel distance and duration, hence altering travel modes and achieving emission reduction effects [80]. The building density is statistically significantly inversely related to the carbon emission efficiency (p < 0.01). This may be because compact built environments help improve infrastructure utilization, reduce travel demand, and enhance functional clustering, thereby lowering carbon emissions relative to the estimated economic activity intensity [18]. Some studies have also indicated that mutual shading effects in high-density urban forms can alter cooling and heating loads, thereby influencing end-use energy consumption and associated carbon emissions [81]. However, such micro-scale energy dynamics are not explicitly captured in the EDGAR carbon emission estimation methodology. Previous research has demonstrated that spatial compression and heightened land-use diversity can reduce carbon emission levels [82], while considerable urban scale and extensive urban sprawl can increase carbon emissions.
The current research focused on the effects of the population density, revealing a statistically robust positive correlation between this factor and the carbon emissions per GDP unit (p < 0.01), indicating that a lower population density correlates negatively with a higher carbon emission efficiency. This finding empirically corroborates earlier research [83,84]. Although extensive prior research has statistically confirmed a significant inverse relationship between population density and carbon emissions [85], the interaction between the population density and carbon emissions follows the Kuznets curve. When the urban demographic size is lower than the one million threshold, increasing the population density helps reduce urban carbon emissions. Conversely, when the urban demographic size surpasses the one million threshold, growth in population density leads to higher total carbon emissions as well as elevated sectoral, built-environment, and mobility-related carbon emission [86]. Small cities with high green space accessibility can rely on suburban natural systems to maintain ecological balance, while megacities such as Shenzhen need to balance functions and maintain livability through spatial reconfiguration (e.g., lowering density to embed green space) due to significant differences in green space accessibility. Differences in city size affect carbon efficiency thresholds, and carbon emissions from megacities have greater negative ecological impacts. Shenzhen, which is a megacity with a population exceeding ten million people, faces the challenges of a high population density, including increased pressure on transportation, increased transportation-related carbon emissions, an increased building density, and an altered microclimate, which thereby affects energy use and carbon emissions [87]. While spatial intensification has been empirically validated as a pivotal mechanism for low-carbon urban development [88], it is still necessary to moderately reduce the population density in the urban core area, particularly in the high-density southwestern part of Shenzhen, such as Nanshan and Futian districts.

5.2. Geographically Weighted Evaluation of Urban Form’s Spatially Heterogeneous Effects on Carbon Emission Efficiency

OLS regression analysis aims to investigate the overall influence of the urban form on the urban carbon emission efficiency but cannot describe the spatial non-stationarity of elements. To better understand this spatial heterogeneity, we further applied a GWR model to explore the localized effects of urban form attributes on the carbon emission efficiency.

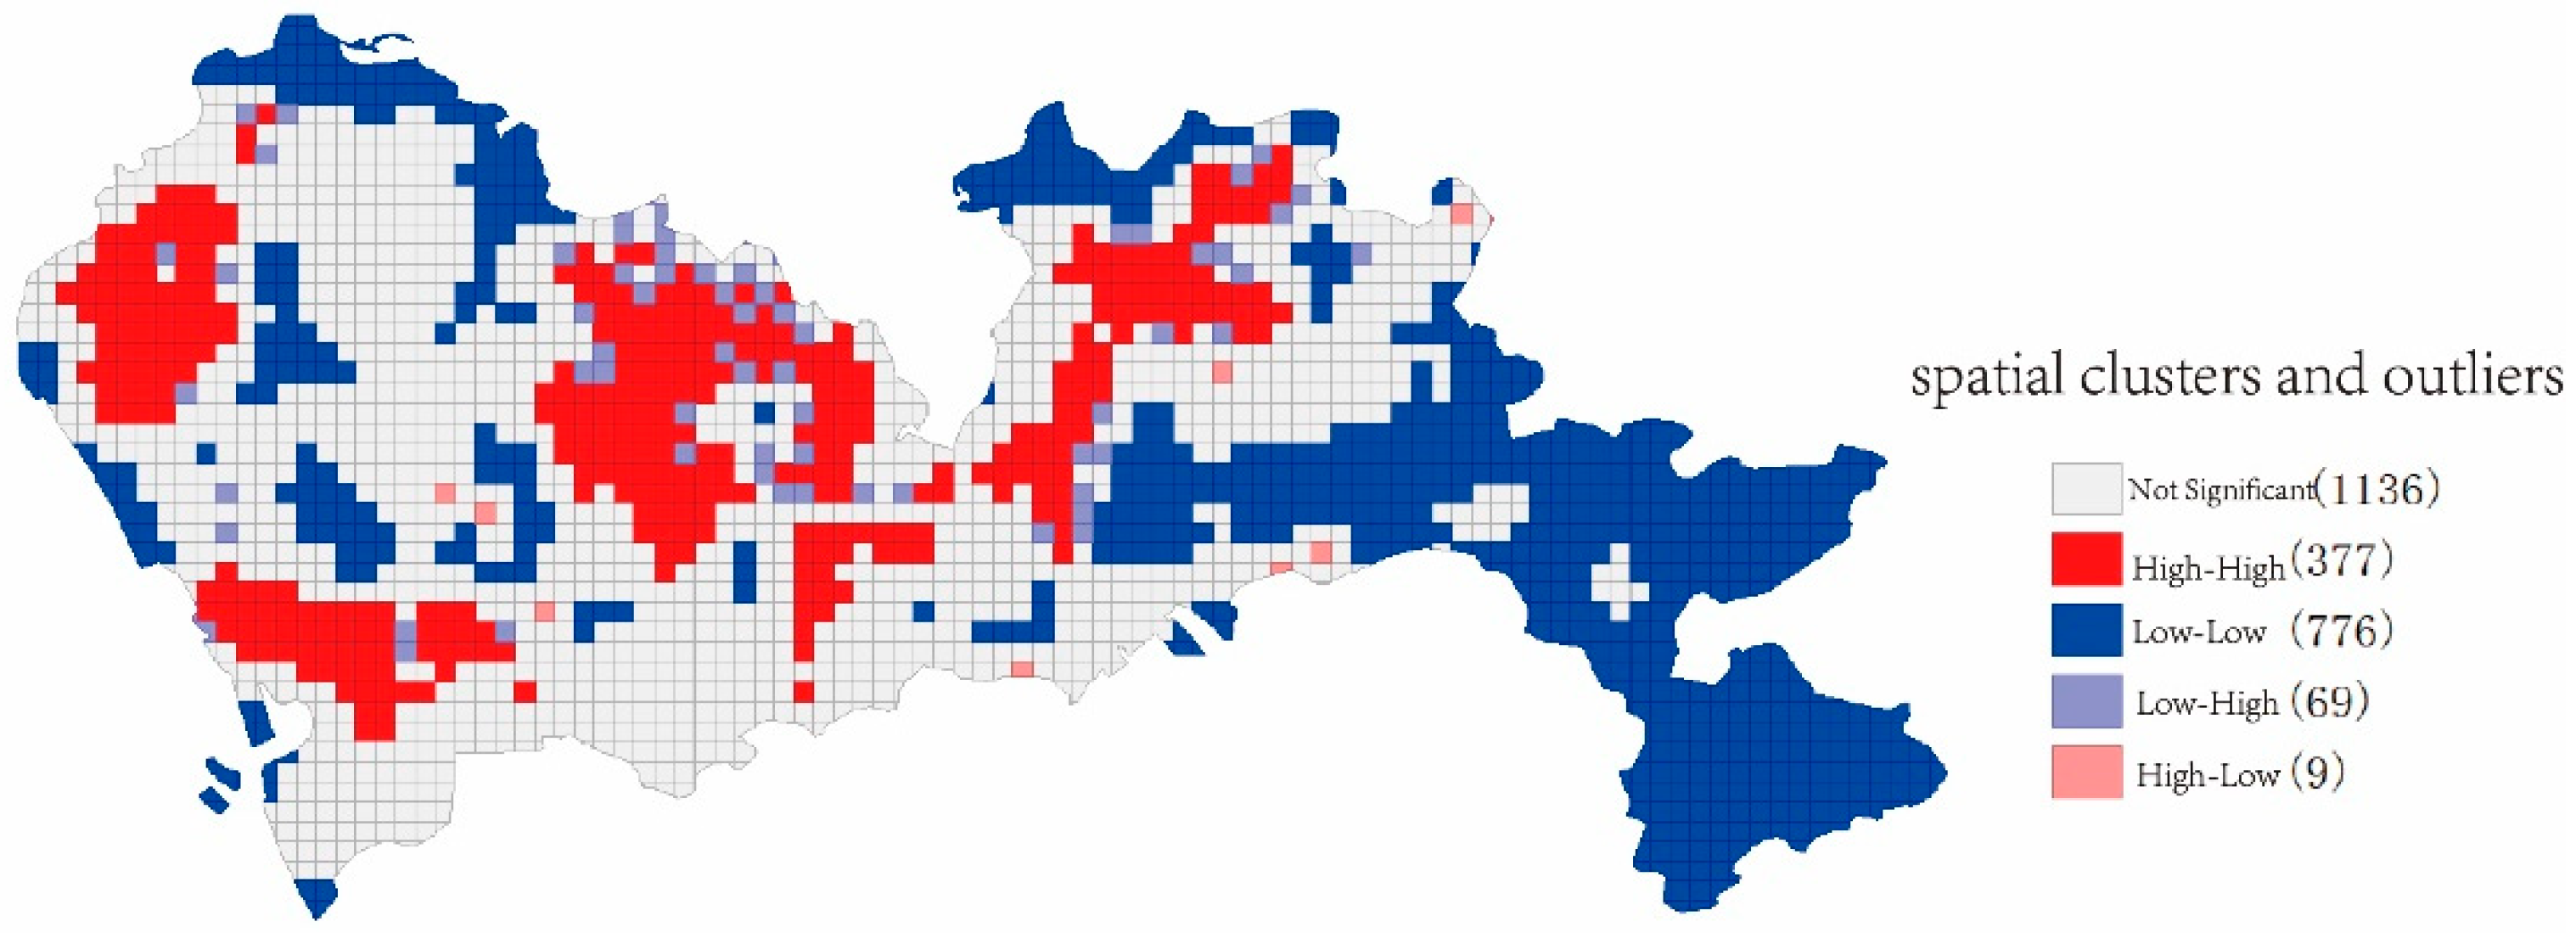
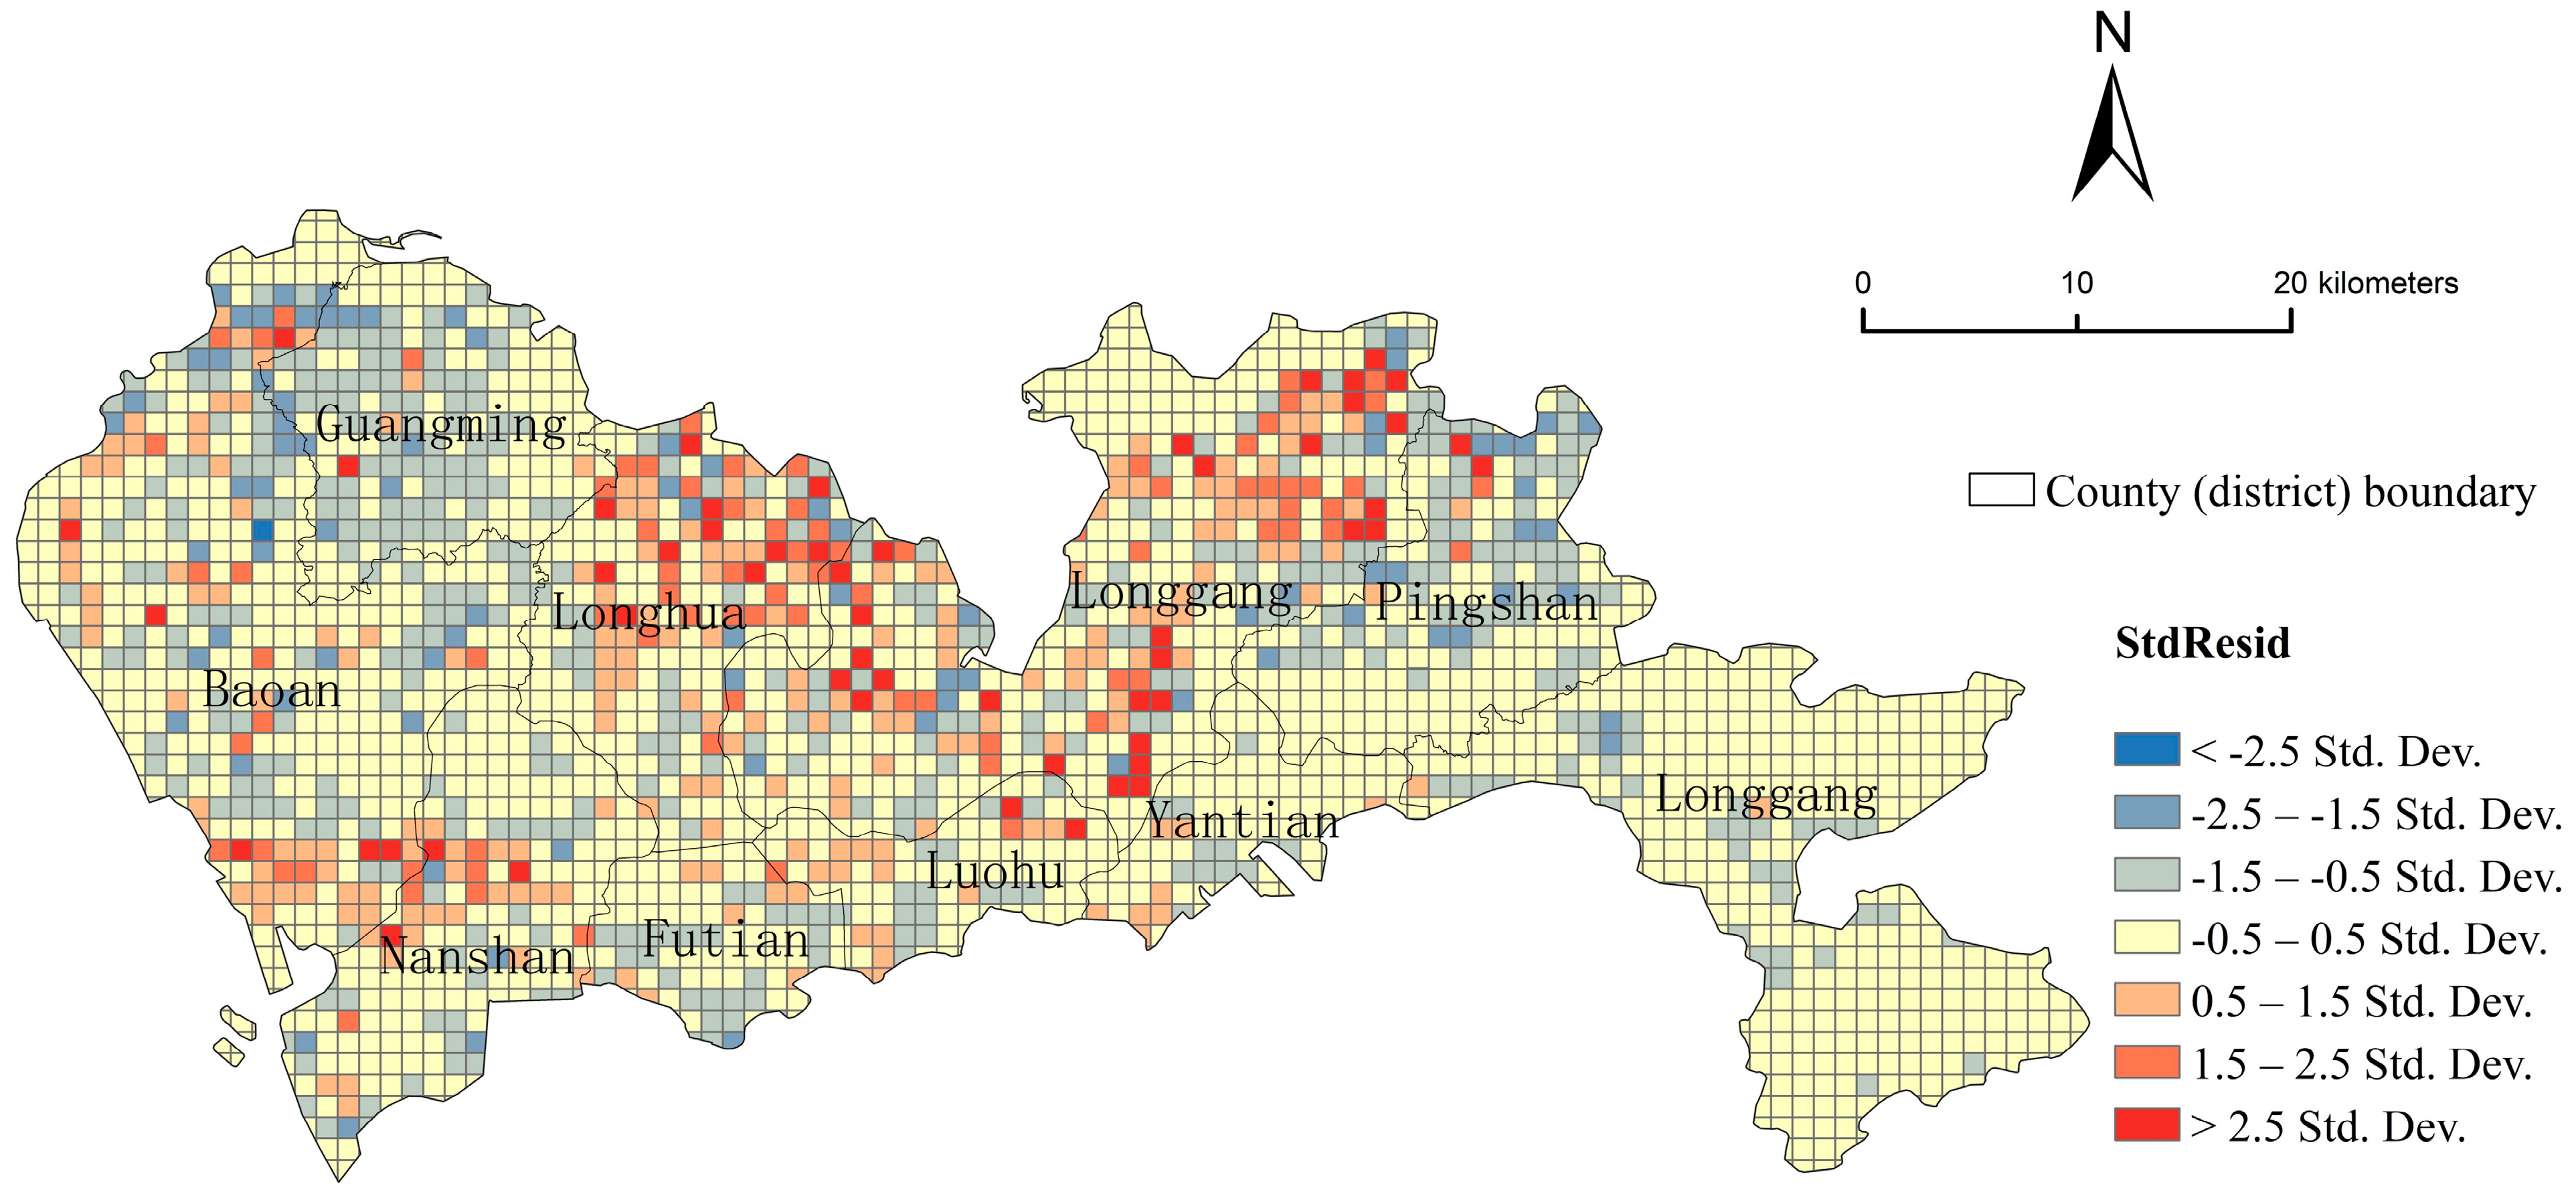
5.2.1. Spatial Autocorrelation

Before applying the GWR model, we conducted a spatial autocorrelation test. The results revealed a significant positive spatial clustering pattern in carbon emission efficiency (Global Moran’s Index, p = 0.00). Additionally, the observed Moran’s I value significantly deviated from the expected value under the spatial randomness assumption (Z = 32.31). To examine the spatial pattern of carbon emission efficiency more comprehensively, the present research calculated local Moran’s I in ArcGIS 10.8 and generated a LISA (local spatial association metrics) cluster map. The local Moran’s I results complement the global Moran’s I results, enabling the identification of clustering within specific spatial regions. The results are shown in Figure 5, where high–high clusters represent spatial clusters with a low carbon emission efficiency. These clusters mainly appeared within the northern and eastern regions of Shenzhen. The high–high cluster area in northeast China overlapped with the main development axis of the region, encompassing cross-city transportation and industrial zones near adjacent cities. Thus, diminished carbon emission efficiency within this area could potentially correlate with transportation and industrial development. The northern part of the central region exhibited patterns mirroring trends in the northeastern area, where the southern part is a business district near the Shenzhen North Railway Station, and the northern part contains industrial parks. The high–high cluster area in the west occurs along the 107 development axis, supporting airport commuting and transportation with neighboring cities. Low–low clusters represent spatial clusters with a high carbon emission efficiency, which are predominantly concentrated within Shenzhen’s eastern and western sectors exhibiting high green coverage.

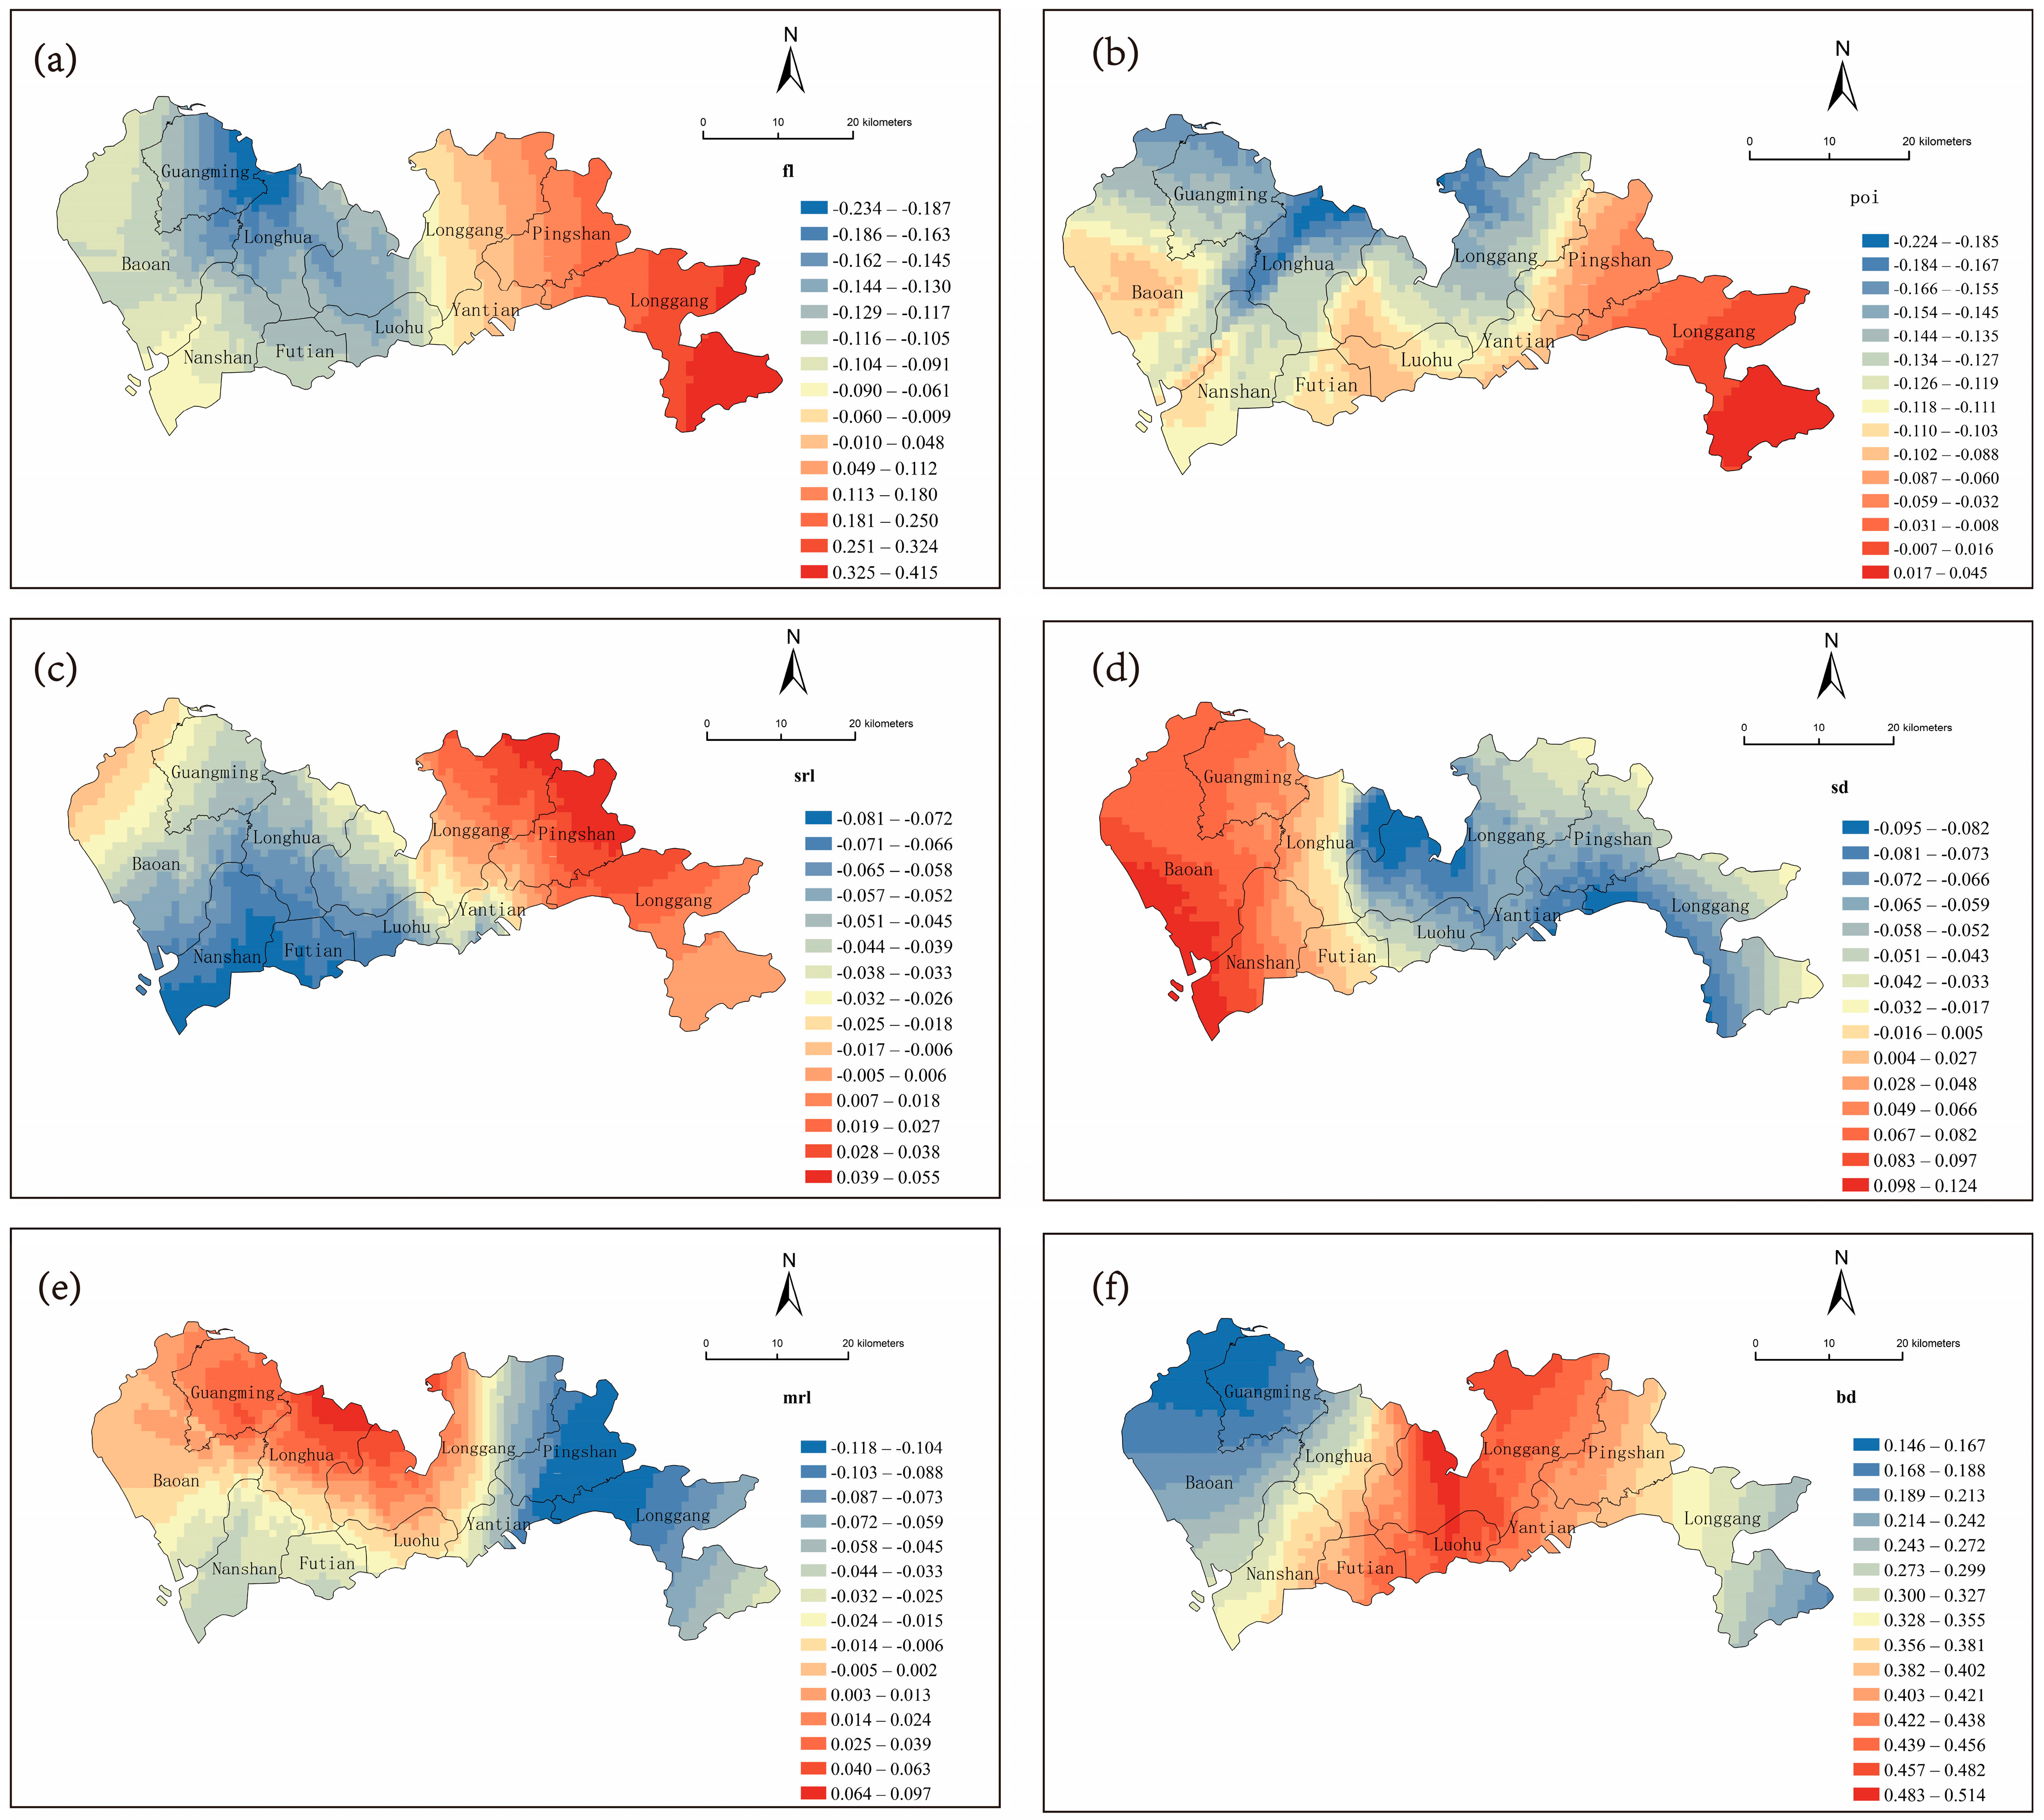
5.2.2. Analysis of the Geographically Weighted Regression Results

We conducted GWR analysis to further investigate the spatial heterogeneity in the effects of urban form on urban carbon emission efficiency. As shown in Table 3, the R-squared value of GWR is greater than that of OLS regression, and the corrected AIC (AICc) value is lower. This indicates that GWR provides a better fit than the OLS method and is more suitable for studying the mechanisms by which the urban form influences carbon emission efficiency. The results suggest that the role of various morphological configuration indicators on the carbon emissions per unit GDP is influenced by the geographical spatial location.
The residual results of GWR are shown in Figure 6. Overall, the fit is better in the littoral zones of Shenzhen’s east and south, which are rapidly developing regions. These findings demonstrate that the urban form indicators selected in this study are effective. These areas feature intensive land use, a well-developed urban transportation network, and established facilities for climate-neutral mobility infrastructure including bike-sharing schemes and mass transit systems, which stimulate a higher adoption of sustainable commuting. In contrast, the high building density has led to congestion and parking difficulties, prompting residents to choose public transit for commuting.
However, the fit is relatively poor in the entirety of Guangming, Longhua, and Longgang administrative areas, as well as the northern sector of Pingshan District, which are all situated within Shenzhen’s northern metropolitan zone. These areas are primarily industrial with a single-function land use structure, insufficient infrastructure, and an underdeveloped transport network. Industrial energy utilization exerts a notably pronounced bearing on carbon emission efficiency. Additionally, with a workforce mainly composed of industrial workers and relatively low per capita GDP, optimizing and upgrading industrial capacity may be key to improving efficiency.
The GWR results indicate that the role of urban form on carbon emission efficiency follows a nonlinear relationship with significant geographic disparity in the effects of different urban form elements. The spatial distributions of the GWR modeling parameters for morphological configuration components are shown in Figure 7. There are considerable spatial differences across the indicators primarily with respect to density and urban transportation. Population density correlates negatively with carbon emission efficiency in the eastern areas but turns positive toward the western regions. The building density (Figure 7f) is positively correlated, and the correlation decreases gradually from the central area toward both sides. The influence of the building density is greater in central Shenzhen. Conversely, the station density (Figure 7d) exhibits a negative gradient in the central and eastern zones, transitioning to a positive gradient in the western zones. Compared with those associated with the other density indicators, the POI density (Figure 7b) results in more complex spatial differences with an overall negative correlation but a greater influence in the southern, eastern, and western zones of Shenzhen. Similarly, transportation indicators also exhibit spatial variation. Specifically, the correlation of the length of secondary roads (Figure 7c) decreases negatively, radiating outward from the central business district. The correlation of the length of major roads (Figure 7e) increases negatively from the northern area to both sides, whereas the length of highways and expressways (Figure 7a) manifests an inverse association within the western zones and a favorable relationship across the eastern sectors.
Notably, research has revealed that divergences in urban development across nations and regions lead to varying influences of urban form indicators on the carbon emission efficiency [89]. The GWR model further confirms that there are differences in impacts across different areas within the city with both positive and negative correlations coexisting. Even when the influence is oriented along the same direction, differences in impact trends can be observed. The urban form indicators are diverse, and their interactions collectively affect the carbon emission efficiency. Consequently, while enhancing the urban form within different urban spaces, attention should also be given to the effects of urban form indicators at different carbon emission efficiency levels.

5.3. Quantile-Varying Effects of Urban Form on Carbon Emission Efficiency Gradient

The GWR results show that many urban form indicators exhibit threshold effects and segmented patterns rather than simple linear relationships, leading to notable differences from Western experiences and previous studies. To further investigate the varying effects of urban form on carbon emission efficiency, this study employs a quantile regression model. Quantile regression is capable of elucidating intricate interdependencies between numerous urban form parameters while also characterizing differential impacts across causal determinants. This approach can more intuitively reveal the marginal effects of explanatory variables on the carbon emission efficiency at varying distributional positions [90]. In this study, quantile regression was performed at the 0.1, 0.25, 0.5, 0.75, and 0.9 quantiles (Figure 8). These quantiles were selected to comprehensively cover the variability spectrum of carbon emission efficiency and to highlight the heterogeneity among different regions. For ease of comparison, the OLS regression findings are presented in the final column of Table 4.
The overall quantile regression results are largely consistent with those of OLS regression and GWR. However, some urban form indicators yield different results across the different quantile points, indicating that the influence exerted by the same urban form indicator upon the urban carbon emission efficiency varies across regions exhibiting varying carbon emission efficiency levels. These differences are closely related to the spatial layout, transportation structure, and other factors. The population density suppresses urban carbon emission efficiency in central urban areas (at the 0.1, 0.25, and 0.5 quantiles), but it generates a limited effect within regions characterized by low carbon emission efficiency. This indicates that central urban areas have reached a saturation point, where the high population density exacerbates traffic congestion and increases the conflict between excessive carbon emissions from industrial and residential activities and the absorptive potential of green spaces to mitigate pollutants, thereby reducing the urban carbon emission efficiency. Thus, urban development is not necessarily better with increased density; once a certain population density threshold is reached, there is an imperative to appropriately disperse demographic distribution and metropolitan functionalities to suburban areas. Similarly, the urban transportation structure inhibits carbon emission efficiency in high-efficiency areas, particularly station density. It shows an inhibitory effect at the 0.1, 0.25, and 0.5 quantiles while exhibiting a pronounced inverse relationship with carbon emission efficiency at the 0.9 quantile. Quantile regression also yields results distinct from those of OLS regression. Employment density exhibits statistically inverse associations with carbon emission efficiency at the 0.1 and 0.25 quantiles, whereas at the 0.75 and 0.9 quantiles, it demonstrates marked favorable correlations. These findings indicate that the effects of the employment density could stem from factors including economic sectors and technological advancement. Concentrated industrial areas may share energy supplies, thus increasing the energy use efficiency and thereby reducing production costs.
OLS regression shows that land use mix and building density are significantly negatively correlated with carbon emission efficiency, while population density, in the context of a megacity like Shenzhen, reduces efficiency. GWR further reveals spatial heterogeneity with high-efficiency areas concentrated in green-rich peripheral regions and low-efficiency areas primarily in industrial zones and transport hubs. Quantile regression identifies threshold effects in population density and transport structure, demonstrating that urban form’s effects differ across different efficiency levels. These results highlight the complexity of urban carbon reduction, suggesting that cities should avoid blindly pursuing high density and instead optimize population distribution, industrial structure, and public transport accessibility based on regional characteristics. Carbon emissions in low-efficiency areas may be driven by industrial structure and energy consumption patterns, requiring integrated strategies to enhance efficiency and achieve balanced low-carbon development.

6. Conclusions and Policy Implications

The investigation centered on urban form’s fine-scale bearing on carbon emission efficiency across intra-urban zones with an emphasis on contested urban form indicators. To support this analysis, multi-source spatial data were harmonized and resampled to a unified 1000 m grid resolution for Shenzhen, including the downscaling of EDGAR’s 0.1° emission data. By summarizing the findings of both domestic and international research into the effects of the urban form on the carbon emission efficiency, urban form indicators were derived from land use, functional mix, transportation structure, and spatial layout. Neglecting the role of dynamic data may lead to misinterpretations of travel behavior and spatial differences in carbon emissions, potentially causing inefficient resource allocation, increased traffic congestion, and reduced energy efficiency. A sequential modeling strategy was employed, beginning with OLS to explore general relationships between urban form and carbon emission efficiency, followed by GWR to reveal spatial heterogeneity, and finally quantile regression to examine variations across different efficiency levels.
The 2022 research on carbon emission efficiency in Shenzhen, combining both dynamic and static approaches, revealed a general pattern of higher efficiency in coastal high-density areas and lower efficiency in industrial zones. The central urban areas located along the southern coast exhibited higher carbon emission efficiency, indicating that the dual carbon policies of Shenzhen have achieved significant success in recent years. In particular, the low-carbon policies issued by urban planning, land use, and transportation management departments in recent years provide important reference data for other cities undergoing rapid urbanization and industrial structure transformation. Additionally, the low-carbon areas in the eastern part benefit from a high level of green coverage, where vegetation absorbs atmospheric carbon dioxide via photosynthesis, contributing to carbon sequestration. Urban green and blue spaces contribute significantly to climate mitigation by capturing atmospheric CO2 and enhancing the carbon sink capacity of cities [91]. Urban decarbonization hinges on the synergistic advancement of production, living, and ecological aspects, and urban construction should emphasize the protection and restoration of urban green spaces.
Exploring the interdependencies between urban form indicators and urban carbon emission efficiency constitutes an intricate and crucial issue. The investigation methodically revealed the multi-level bearing of urban form on carbon emission efficiency using OLS, GWR, and quantile regression models. OLS identified the overall relationship, GWR captured spatial heterogeneity, and quantile regression detected threshold effects across different efficiency levels. Regression analysis revealed that the impacts of the transportation structure and spatial layout on the carbon emission efficiency differed from those in previous studies. Additionally, the influences of all the indicators varied across different areas within the city, particularly the population density and transportation structure. Land use type factors show that heightened land use intensity can reduce carbon emissions, and when combined with functional mix elements such as high density and integrated land functions, they can further help reduce commuting distances, improve the operational efficiency of the public transport system, and reduce the level of carbon emissions per unit of passenger activity. The characteristics of high density and highly mixed land use ultimately decrease trip lengths, thereby stimulating the adoption of non-motorized mobility options including pedestrian and bicycle commuting. Spatial layout factors including high population and building density levels are not always beneficial, especially in megacities. Excessive population and structural concentration may contribute to mismatched road networks, leading to congestion and increased transport-related emissions. In addition, high building density can obstruct natural ventilation paths, potentially generating localized microclimates that affect heating or cooling energy demands. Although this study does not directly assess these physical mechanisms, previous research suggests that their impact varies by local climate and urban design features. In Shenzhen’s subtropical context, such effects may be moderated through urban greening, building retrofits, and improved housing design. Furthermore, well-integrated public and freight transport infrastructure can help alleviate congestion and reduce emissions, emphasizing the importance of functional urban design. Consequently, it is necessary to appropriately disperse the population in central urban areas while promoting economic development and intensive land use in other regions. Transportation structure factors are reflected in the need for continuous improvement in transportation network infrastructure, which is essential. The carbon reduction policy for electric vehicles has achieved initial success, and strategies should prioritize optimizing mass transit systems and metro networks, facilitating connections and encouraging more residents to use public transit. In summary, the bearing exerted by urban form on the carbon emission efficiency constitutes a multifaceted phenomenon encompassing dimensions and scales. This study finds that the land use type, population density, and transportation structure are key factors influencing the carbon emission efficiency. Future research could focus on exploring the interactions among these factors for different types of cities.
This research enhances comprehension of the processes by which urban form influences urban carbon emission efficiency. However, certain limitations remain. First, due to data constraints, future research should employ higher-precision data to measure urban carbon emissions and incorporate temporal data to explore changes in carbon emission efficiency over time and their underlying causes. Second, the mechanism by which transportation affects the carbon emission efficiency is complex. In particular, Shenzhen features highly intensive land use and a large number of electric vehicles, and increasing bus ridership serves as a pivotal driver for reducing carbon emissions. We acknowledge that future studies could benefit from multimodal comparisons to better understand the carbon impacts of different transportation systems. Finally, future research could also aim to represent and measure three-dimensional urban forms to further explore the dynamics via which the urban form affects the carbon emission efficiency. Additionally, future studies may consider the interaction between port functions and urban form, especially in port cities like Shenzhen, to better capture external spatial influences on carbon efficiency.

Author Contributions

Conceptualization, C.Z.; Methodology, T.P.; Data curation, X.D.; Writing—original draft, X.L. All authors have read and agreed to the published version of the manuscript.

Funding

The National Natural Science Foundation of China Project: Optimal resource allocation of on-demand responsive public bus for stochastic and non-clustered traffic demand (62203239); the World Bank Research Program: Consultancy for Summary Reports and Multimedia Dissemination for GEF6 China SCIAP Project (7204890).

Data Availability Statement

The original contributions presented in this study are included in the article. Further inquiries can be directed to the corresponding author.

Conflicts of Interest

Author Tianlu Pan was employed by the company Peng Cheng Laboratory. The remaining authors declare that the research was conducted in the absence of any commercial or financial relationships that could be construed as a potential conflict of interest.

References

  1. Luqman, M.; Rayner, P.J.; Gurney, K.R. On the Impact of Urbanisation on CO2 Emissions. NPJ Urban Sustain. 2023, 3, 6. [Google Scholar] [CrossRef]
  2. Clark, P.U.; Shakun, J.D.; Marcott, S.A.; Mix, A.C.; Eby, M.; Kulp, S.; Levermann, A.; Milne, G.A.; Pfister, P.L.; Santer, B.D.; et al. Consequences of Twenty-First-Century Policy for Multi-Millennial Climate and Sea-Level Change. Nat. Clim. Change 2016, 6, 360–369. [Google Scholar] [CrossRef]
  3. Li, B.; Gasser, T.; Ciais, P.; Piao, S.; Tao, S.; Balkanski, Y.; Hauglustaine, D.; Boisier, J.-P.; Chen, Z.; Huang, M.; et al. The Contribution of China’s Emissions to Global Climate Forcing. Nature 2016, 531, 357–361. [Google Scholar] [CrossRef]
  4. Shi, K.; Chen, Y.; Yu, B.; Xu, T.; Chen, Z.; Liu, R.; Li, L.; Wu, J. Modeling Spatiotemporal CO2 (Carbon Dioxide) Emission Dynamics in China from DMSP-OLS Nighttime Stable Light Data Using Panel Data Analysis. Appl. Energy 2016, 168, 523–533. [Google Scholar] [CrossRef]
  5. Azevedo, V.G.; Sartori, S.; Campos, L.M.S. CO2 Emissions: A Quantitative Analysis among the BRICS Nations. Renew. Sustain. Energy Rev. 2018, 81, 107–115. [Google Scholar] [CrossRef]
  6. Fu, B.; Li, B.; Gasser, T.; Tao, S.; Ciais, P.; Piao, S.; Balkanski, Y.; Li, W.; Yin, T.; Han, L. The Contributions of Individual Countries and Regions to the Global Radiative Forcing. Proc. Natl. Acad. Sci. USA 2021, 118, e2018211118. [Google Scholar] [CrossRef]
  7. Holden, P.B.; Edwards, N.R.; Ridgwell, A.; Wilkinson, R.D.; Fraedrich, K.; Lunkeit, F.; Pollitt, H.; Mercure, J.-F.; Salas, P.; Lam, A. Climate–Carbon Cycle Uncertainties and the Paris Agreement. Nat. Clim. Change 2018, 8, 609–613. [Google Scholar] [CrossRef]
  8. Li, J.; Zhang, D.; Su, B. The Impact of Social Awareness and Lifestyles on Household Carbon Emissions in China. Ecol. Econ. 2019, 160, 145–155. [Google Scholar] [CrossRef]
  9. Duan, H.; Zhou, S.; Jiang, K.; Bertram, C.; Harmsen, M.; Kriegler, E.; van Vuuren, D.P.; Wang, S.; Fujimori, S.; Tavoni, M. Assessing China’s Efforts to Pursue the 1.5 C Warming Limit. Science 2021, 372, 378–385. [Google Scholar] [CrossRef]
  10. Song, Q.; Liu, T.; Qi, Y. Policy Innovation in Low Carbon Pilot Cities: Lessons Learned from China. Urban Clim. 2021, 39, 100936. [Google Scholar] [CrossRef]
  11. CO2 Emissions in 2023—Analysis. Available online: https://www.iea.org/reports/co2-emissions-in-2023 (accessed on 11 May 2025).
  12. Fan, J.; Meng, X.; Tian, J.; Xing, C.; Wang, C.; Wood, J. A Review of Transportation Carbon Emissions Research Using Bibliometric Analyses. J. Traffic Transp. Eng. Engl. Ed. 2023, 10, 878–899. [Google Scholar] [CrossRef]
  13. Yan, H.; Tan, X.; Kong, L.; Cheng, Y. How China’s Transport Sector Responds to Carbon Neutrality Target: A Study from a Multi-Model Comparison Analysis. Energy Sustain. Dev. 2025, 85, 101627. [Google Scholar] [CrossRef]
  14. Anderson, W.P.; Kanaroglou, P.S.; Miller, E.J. Urban Form, Energy and the Environment: A Review of Issues, Evidence and Policy. Urban Stud. 1996, 33, 7–35. [Google Scholar] [CrossRef]
  15. Ou, J.; Liu, X.; Li, X.; Chen, Y. Quantifying the Relationship between Urban Forms and Carbon Emissions Using Panel Data Analysis. Landsc. Ecol. 2013, 28, 1889–1907. [Google Scholar] [CrossRef]
  16. Fang, C.; Wang, S.; Li, G. Changing Urban Forms and Carbon Dioxide Emissions in China: A Case Study of 30 Provincial Capital Cities. Appl. Energy 2015, 158, 519–531. [Google Scholar] [CrossRef]
  17. Ewing, R.; Rong, F. The Impact of Urban Form on US Residential Energy Use. Hous. Policy Debate 2008, 19, 1–30. [Google Scholar] [CrossRef]
  18. Wang, S.; Wang, J.; Fang, C.; Li, S. Estimating the Impacts of Urban Form on CO2 Emission Efficiency in the Pearl River Delta, China. Cities 2019, 85, 117–129. [Google Scholar] [CrossRef]
  19. Bereitschaft, B.; Debbage, K. Urban Form, Air Pollution, and CO2 Emissions in Large US Metropolitan Areas. Prof. Geogr. 2013, 65, 612–635. [Google Scholar] [CrossRef]
  20. Makido, Y.; Dhakal, S.; Yamagata, Y. Relationship between Urban Form and CO2 Emissions: Evidence from Fifty Japanese Cities. Urban Clim. 2012, 2, 55–67. [Google Scholar] [CrossRef]
  21. Zhou, X.; Wang, H.; Huang, Z.; Bao, Y.; Zhou, G.; Liu, Y. Identifying Spatiotemporal Characteristics and Driving Factors for Road Traffic CO2 Emissions. Sci. Total Environ. 2022, 834, 155270. [Google Scholar] [CrossRef]
  22. Kaya, Y.; Yokobori, K. Environment, Energy, and Economy: Strategies for Sustainability; United Nations University Press: Tokyo, Japan, 1997; Volume 4. [Google Scholar]
  23. Xing, P.; Wang, Y.; Ye, T.; Sun, Y.; Li, Q.; Li, X.; Li, M.; Chen, W. Carbon Emission Efficiency of 284 Cities in China Based on Machine Learning Approach: Driving Factors and Regional Heterogeneity. Energy Econ. 2024, 129, 107222. [Google Scholar] [CrossRef]
  24. Ni, G.; Fang, Y.; Niu, M.; Lv, L.; Song, C.; Wang, W. Spatial Differences, Dynamic Evolution and Influencing Factors of China’s Construction Industry Carbon Emission Efficiency. J. Clean. Prod. 2024, 448, 141593. [Google Scholar] [CrossRef]
  25. Xie, Z.; Wu, R.; Wang, S. How Technological Progress Affects the Carbon Emission Efficiency? Evidence from National Panel Quantile Regression. J. Clean. Prod. 2021, 307, 127133. [Google Scholar] [CrossRef]
  26. Zhang, Z.; Yu, X.; Hou, Y.; Chen, T.; Lu, Y.; Sun, H. Carbon Emission Patterns and Carbon Balance Zoning in Urban Territorial Spaces Based on Multisource Data: A Case Study of Suzhou City, China. ISPRS Int. J. Geo-Inf. 2023, 12, 385. [Google Scholar] [CrossRef]
  27. Wan, B.; Sun, Y.; Shen, N.; Sheng, Q.; Yang, T. The Impact of Urban Spatial Configuration on Carbon Emissions: Towards Spatial Planning for Low-Carbon Development. Sustain. Futur. 2025, 9, 100559. [Google Scholar] [CrossRef]
  28. Wang, Y.; Yang, H.; Sun, R. Effectiveness of China’s Provincial Industrial Carbon Emission Reduction and Optimization of Carbon Emission Reduction Paths in “Lagging Regions”: Efficiency-Cost Analysis. J. Environ. Manag. 2020, 275, 111221. [Google Scholar] [CrossRef]
  29. Cheng, Z.; Li, L.; Liu, J.; Zhang, H. Total-Factor Carbon Emission Efficiency of China’s Provincial Industrial Sector and Its Dynamic Evolution. Renew. Sustain. Energy Rev. 2018, 94, 330–339. [Google Scholar] [CrossRef]
  30. Aldy, J.E. Per Capita Carbon Dioxide Emissions: Convergence or Divergence? Environ. Resour. Econ. 2006, 33, 533–555. [Google Scholar] [CrossRef]
  31. Meng, F.; Su, B.; Thomson, E.; Zhou, D.; Zhou, P. Measuring China’s Regional Energy and Carbon Emission Efficiency with DEA Models: A Survey. Appl. Energy 2016, 183, 1–21. [Google Scholar] [CrossRef]
  32. Li, S.; Wang, W.; Diao, H.; Wang, L. Measuring the Efficiency of Energy and Carbon Emissions: A Review of Definitions, Models, and Input-Output Variables. Energies 2022, 15, 962. [Google Scholar] [CrossRef]
  33. Sánchez-Balseca, J.; Pineiros, J.L.; Pérez-Foguet, A. Influence of Travel Time on Carbon Dioxide Emissions from Urban Traffic. Transp. Res. Part Transp. Environ. 2023, 118, 103698. [Google Scholar] [CrossRef]
  34. Wu, D.; Zhang, Y.; Xiang, Q. Could Improving Public Transport Accessibility Reduce Road Traffic Carbon Dioxide Emissions? A Simulation-Based Counterfactual Analysis. J. Transp. Geogr. 2024, 119, 103970. [Google Scholar] [CrossRef]
  35. Czepkiewicz, M.; Schmidt, F.; Krysiński, D.; Brudka, C. Satisfying Transport Needs with Low Carbon Emissions: Exploring Individual, Social, and Built Environmental Factors. Comput. Environ. Urban Syst. 2024, 114, 102196. [Google Scholar] [CrossRef]
  36. Abubakar, I.R.; Alshammari, M.S. Urban Planning Schemes for Developing Low-Carbon Cities in the Gulf Cooperation Council Region. Habitat Int. 2023, 138, 102881. [Google Scholar] [CrossRef]
  37. Cirilli, A.; Veneri, P. Spatial Structure and Carbon Dioxide (CO2) Emissions Due to Commuting: An Analysis of Italian Urban Areas. Reg. Stud. 2014, 48, 1993–2005. [Google Scholar] [CrossRef]
  38. Bai, Y.; Deng, X.; Gibson, J.; Zhao, Z.; Xu, H. How Does Urbanization Affect Residential CO2 Emissions? An Analysis on Urban Agglomerations of China. J. Clean. Prod. 2019, 209, 876–885. [Google Scholar] [CrossRef]
  39. Pu, Y.; Wang, Y.; Wang, P. Driving Effects of Urbanization on City-Level Carbon Dioxide Emissions: From Multiple Perspectives of Urbanization. Int. J. Urban Sci. 2022, 26, 108–128. [Google Scholar] [CrossRef]
  40. Christen, A.; Coops, N.C.; Crawford, B.R.; Kellett, R.; Liss, K.N.; Olchovski, I.; Tooke, T.R.; Van Der Laan, M.; Voogt, J.A. Validation of Modeled Carbon-Dioxide Emissions from an Urban Neighborhood with Direct Eddy-Covariance Measurements. Atmos. Environ. 2011, 45, 6057–6069. [Google Scholar] [CrossRef]
  41. Xu, Q.; Yang, R.; Dong, Y.-X.; Liu, Y.-X.; Qiu, L.-R. The Influence of Rapid Urbanization and Land Use Changes on Terrestrial Carbon Sources/Sinks in Guangzhou, China. Ecol. Indic. 2016, 70, 304–316. [Google Scholar] [CrossRef]
  42. Hong, S.; Hui, E.C.; Lin, Y. Relationship between Urban Spatial Structure and Carbon Emissions: A Literature Review. Ecol. Indic. 2022, 144, 109456. [Google Scholar] [CrossRef]
  43. Arneth, A.; Sitch, S.; Pongratz, J.; Stocker, B.D.; Ciais, P.; Poulter, B.; Bayer, A.D.; Bondeau, A.; Calle, L.; Chini, L.P. Historical Carbon Dioxide Emissions Caused by Land-Use Changes Are Possibly Larger than Assumed. Nat. Geosci. 2017, 10, 79–84. [Google Scholar] [CrossRef]
  44. Liu, Y.; Song, Y.; Song, X. An Empirical Study on the Relationship between Urban Compactness and CO2 Efficiency in China. Habitat Int. 2014, 41, 92–98. [Google Scholar] [CrossRef]
  45. Yuan, M.; Song, Y.; Hong, S.; Huang, Y. Evaluating the Effects of Compact Growth on Air Quality in Already-High-Density Cities with an Integrated Land Use-Transport-Emission Model: A Case Study of Xiamen, China. Habitat Int. 2017, 69, 37–47. [Google Scholar] [CrossRef]
  46. Chen, W.; Wang, G.; Xu, N.; Ji, M.; Zeng, J. Promoting or Inhibiting? New-Type Urbanization and Urban Carbon Emissions Efficiency in China. Cities 2023, 140, 104429. [Google Scholar] [CrossRef]
  47. Ma, J.; Liu, Z.; Chai, Y. The Impact of Urban Form on CO2 Emission from Work and Non-Work Trips: The Case of Beijing, China. Habitat Int. 2015, 47, 1–10. [Google Scholar] [CrossRef]
  48. Chen, T.; Hui, E.C.; Wu, J.; Lang, W.; Li, X. Identifying Urban Spatial Structure and Urban Vibrancy in Highly Dense Cities Using Georeferenced Social Media Data. Habitat Int. 2019, 89, 102005. [Google Scholar] [CrossRef]
  49. Timmons, D.; Zirogiannis, N.; Lutz, M. Location Matters: Population Density and Carbon Emissions from Residential Building Energy Use in the United States. Energy Res. Soc. Sci. 2016, 22, 137–146. [Google Scholar] [CrossRef]
  50. Zahabi, S.A.H.; Miranda-Moreno, L.; Patterson, Z.; Barla, P.; Harding, C. Transportation Greenhouse Gas Emissions and Its Relationship with Urban Form, Transit Accessibility and Emerging Green Technologies: A Montreal Case Study. Procedia-Soc. Behav. Sci. 2012, 54, 966–978. [Google Scholar] [CrossRef]
  51. Wu, X.; Tao, T.; Cao, J.; Fan, Y.; Ramaswami, A. Examining Threshold Effects of Built Environment Elements on Travel-Related Carbon-Dioxide Emissions. Transp. Res. Part Transp. Environ. 2019, 75, 1–12. [Google Scholar] [CrossRef]
  52. Santos, A.S.; Gilio, L.; Halmenschlager, V.; Diniz, T.B.; Almeida, A.N. Flexible-Fuel Automobiles and CO2 Emissions in Brazil: Parametric and Semiparametric Analysis Using Panel Data. Habitat Int. 2018, 71, 147–155. [Google Scholar] [CrossRef]
  53. Dou, Y.; Luo, X.; Dong, L.; Wu, C.; Liang, H.; Ren, J. An Empirical Study on Transit-Oriented Low-Carbon Urban Land Use Planning: Exploratory Spatial Data Analysis (ESDA) on Shanghai, China. Habitat Int. 2016, 53, 379–389. [Google Scholar] [CrossRef]
  54. Xie, R.; Fang, J.; Liu, C. The Effects of Transportation Infrastructure on Urban Carbon Emissions. Appl. Energy 2017, 196, 199–207. [Google Scholar] [CrossRef]
  55. Fedujwar, R.; Agarwal, A. Performance Assessment of Public Transport Routes: A Framework Using Revealed Data. Res. Transp. Bus. Manag. 2025, 59, 101283. [Google Scholar] [CrossRef]
  56. Ashik, F.R.; Rahman, M.H.; Antipova, A.; Zafri, N.M. Analyzing the Impact of the Built Environment on Commuting-Related Carbon Dioxide Emissions. Int. J. Sustain. Transp. 2023, 17, 258–272. [Google Scholar] [CrossRef]
  57. Wang, Q.; Li, L. The Effects of Population Aging, Life Expectancy, Unemployment Rate, Population Density, per Capita GDP, Urbanization on per Capita Carbon Emissions. Sustain. Prod. Consum. 2021, 28, 760–774. [Google Scholar] [CrossRef]
  58. Çalışkan, B.; Atahan, A.O. Cartographic Modelling and Multi-Criteria Analysis (CMCA) for Rail Transit Suitability. Urban Rail Transit 2023, 9, 1–18. [Google Scholar] [CrossRef]
  59. Liu, Y.; Gao, C.; Lu, Y. The Impact of Urbanization on GHG Emissions in China: The Role of Population Density. J. Clean. Prod. 2017, 157, 299–309. [Google Scholar] [CrossRef]
  60. Zhou, C.; Wang, S.; Wang, J. Examining the Influences of Urbanization on Carbon Dioxide Emissions in the Yangtze River Delta, China: Kuznets Curve Relationship. Sci. Total Environ. 2019, 675, 472–482. [Google Scholar] [CrossRef]
  61. Liu, J.; Li, M.; Ding, Y. Econometric Analysis of the Impact of the Urban Population Size on Carbon Dioxide (CO2) Emissions in China. Environ. Dev. Sustain. 2021, 23, 18186–18203. [Google Scholar] [CrossRef]
  62. Larkin, A.; van Donkelaar, A.; Geddes, J.A.; Martin, R.V.; Hystad, P. Relationships between Changes in Urban Characteristics and Air Quality in East Asia from 2000 to 2010. Environ. Sci. Technol. 2016, 50, 9142–9149. [Google Scholar] [CrossRef]
  63. Chen, J.; Wang, B.; Huang, S.; Song, M. The Influence of Increased Population Density in China on Air Pollution. Sci. Total Environ. 2020, 735, 139456. [Google Scholar] [CrossRef] [PubMed]
  64. Schweitzer, L.; Zhou, J. Neighborhood Air Quality, Respiratory Health, and Vulnerable Populations in Compact and Sprawled Regions. J. Am. Plann. Assoc. 2010, 76, 363–371. [Google Scholar] [CrossRef]
  65. Xia, C.; Xiang, M.; Fang, K.; Li, Y.; Ye, Y.; Shi, Z.; Liu, J. Spatial-Temporal Distribution of Carbon Emissions by Daily Travel and Its Response to Urban Form: A Case Study of Hangzhou, China. J. Clean. Prod. 2020, 257, 120797. [Google Scholar] [CrossRef]
  66. Lin, B.; Benjamin, N.I. Influencing Factors on Carbon Emissions in China Transport Industry. A New Evidence from Quantile Regression Analysis. J. Clean. Prod. 2017, 150, 175–187. [Google Scholar] [CrossRef]
  67. Gao, L.; Zhao, Z.-Y.; Li, C.; Wang, C. Factors Facilitating the Development of Low-Carbon Cities: Evidence from China’s Pilot Cities. Heliyon 2022, 8, e11445. [Google Scholar] [CrossRef]
  68. Wu, Z.; Tang, J.; Wang, D. Low Carbon Urban Transitioning in Shenzhen: A Multi-Level Environmental Governance Perspective. Sustainability 2016, 8, 720. [Google Scholar] [CrossRef]
  69. Ke, Y.; Xia, L.; Huang, Y.; Li, S.; Zhang, Y.; Liang, S.; Yang, Z. The Carbon Emissions Related to the Land-Use Changes from 2000 to 2015 in Shenzhen, China: Implication for Exploring Low-Carbon Development in Megacities. J. Environ. Manag. 2022, 319, 115660. [Google Scholar] [CrossRef]
  70. Mao, R.; Duan, H.; Dong, D.; Zuo, J.; Song, Q.; Liu, G.; Hu, M.; Zhu, J.; Dong, B. Quantification of Carbon Footprint of Urban Roads via Life Cycle Assessment: Case Study of a Megacity-Shenzhen, China. J. Clean. Prod. 2017, 166, 40–48. [Google Scholar] [CrossRef]
  71. Feng, T.; Zhou, B. Impact of Urban Spatial Structure Elements on Carbon Emissions Efficiency in Growing Megacities: The Case of Chengdu. Sci. Rep. 2023, 13, 9939. [Google Scholar] [CrossRef]
  72. Cellmer, R.; Cichulska, A.; Bełej, M. Spatial Analysis of Housing Prices and Market Activity with the Geographically Weighted Regression. ISPRS Int. J. Geo-Inf. 2020, 9, 380. [Google Scholar] [CrossRef]
  73. Jin, S.; Zheng, H.; Marantz, N.; Roy, A. Understanding the Effects of Socioeconomic Factors on Housing Price Appreciation Using Explainable AI. Appl. Geogr. 2024, 169, 103339. [Google Scholar] [CrossRef]
  74. European Commission; Joint Research Centre. GHG Emissions of All World Countries: 2023; Publications Office: Luxembourg, 2023. [Google Scholar]
  75. Wei, L.; Liu, Z. Spatial Heterogeneity of Demographic Structure Effects on Urban Carbon Emissions. Environ. Impact Assess. Rev. 2022, 95, 106790. [Google Scholar] [CrossRef]
  76. Wang, S.; Shi, C.; Fang, C.; Feng, K. Examining the Spatial Variations of Determinants of Energy-Related CO2 Emissions in China at the City Level Using Geographically Weighted Regression Model. Appl. Energy 2019, 235, 95–105. [Google Scholar] [CrossRef]
  77. Koenker, R.; Hallock, K.F. Quantile Regression. J. Econ. Perspect. 2001, 15, 143–156. [Google Scholar] [CrossRef]
  78. Xu, B.; Lin, B. A Quantile Regression Analysis of China’s Provincial CO2 Emissions: Where Does the Difference Lie? Energy Policy 2016, 98, 328–342. [Google Scholar] [CrossRef]
  79. Zhao, D.; Cai, J.; Xu, Y.; Liu, Y.; Yao, M. Carbon Sinks in Urban Public Green Spaces under Carbon Neutrality: A Bibliometric Analysis and Systematic Literature Review. Urban For. Urban Green. 2023, 86, 128037. [Google Scholar] [CrossRef]
  80. Zhang, R.; Matsushima, K.; Kobayashi, K. Can Land Use Planning Help Mitigate Transport-Related Carbon Emissions? A Case of Changzhou. Land Use Policy 2018, 74, 32–40. [Google Scholar] [CrossRef]
  81. Liu, H.; Pan, Y.; Yang, Y.; Huang, Z. Evaluating the Impact of Shading from Surrounding Buildings on Heating/Cooling Energy Demands of Different Community Forms. Build. Environ. 2021, 206, 108322. [Google Scholar] [CrossRef]
  82. Wang, K.; Li, X.; Lyu, X.; Dang, D.; Dou, H.; Li, M.; Liu, S.; Cao, W. Optimizing the Land Use and Land Cover Pattern to Increase Its Contribution to Carbon Neutrality. Remote Sens. 2022, 14, 4751. [Google Scholar] [CrossRef]
  83. Shuai, C.; Shen, L.; Jiao, L.; Wu, Y.; Tan, Y. Identifying Key Impact Factors on Carbon Emission: Evidences from Panel and Time-Series Data of 125 Countries from 1990 to 2011. Appl. Energy 2017, 187, 310–325. [Google Scholar] [CrossRef]
  84. Anser, M.K.; Alharthi, M.; Aziz, B.; Wasim, S. Impact of Urbanization, Economic Growth, and Population Size on Residential Carbon Emissions in the SAARC Countries. Clean Technol. Environ. Policy 2020, 22, 923–936. [Google Scholar] [CrossRef]
  85. Liu, Y.; Zhou, Y.; Wu, W. Assessing the Impact of Population, Income and Technology on Energy Consumption and Industrial Pollutant Emissions in China. Appl. Energy 2015, 155, 904–917. [Google Scholar] [CrossRef]
  86. Hong, S.; Hui, E.C.M.; Lin, Y. Relationships between Carbon Emissions and Urban Population Size and Density, Based on Geo-Urban Scaling Analysis: A Multi-carbon Source Empirical Study. Urban Clim. 2022, 46, 101337. [Google Scholar] [CrossRef]
  87. He, P.; Xue, J.; Shen, G.Q.; Ni, M.; Wang, S.; Wang, H.; Huang, L. The Impact of Neighborhood Layout Heterogeneity on Carbon Emissions in High-Density Urban Areas: A Case Study of New Development Areas in Hong Kong. Energy Build. 2023, 287, 113002. [Google Scholar] [CrossRef]
  88. Cucchiella, F.; Rotilio, M. Planning and Prioritizing of Energy Retrofits for the Cities of the Future. Cities 2021, 116, 103272. [Google Scholar] [CrossRef]
  89. Guo, R.; Leng, H.; Yuan, Q.; Song, S. Impact of Urban Form on Carbon Emissions of Residents in Counties: Evidence from Yangtze River Delta, China. Environ. Sci. Pollut. Res. 2024, 31, 56332–56349. [Google Scholar] [CrossRef]
  90. Han, L.; Xu, X.; Han, L. Applying Quantile Regression and Shapley Decomposition to Analyzing the Determinants of Household Embedded Carbon Emissions: Evidence from Urban China. J. Clean. Prod. 2015, 103, 219–230. [Google Scholar] [CrossRef]
  91. Gao, S.; Tao, P.; Zhao, Z.; Dong, X.; Li, J.; Yao, P. Estimation and Differential Analysis of the Carbon Sink Service Radius of Urban Green Spaces in the Beijing Plain Area. Sustainability 2024, 16, 1406. [Google Scholar] [CrossRef]
Figure 1. Geographic location and land use of Shenzhen. (Note: the map on the right side is from the Ministry of Natural Resources of the People’s Republic of China, No.GS(2019)1671, http://bzdt.ch.mnr.gov.cn/browse.html?picId=%224o28b0625501ad13015501ad2bfc0266%22 (accessed on 18 May 2025); the map on left side was drawn by the author with ArcGIS, Version 10.8.1, ESRI).
Land 14 01172 g001
Figure 2. Research design and methodological framework.
Land 14 01172 g002
Figure 3. Territorial disparity patterns of the carbon emission efficiency in Shenzhen.
Land 14 01172 g003
Figure 4. Territorial disparity patterns of the per capita mileage carbon emissions in Shenzhen.
Land 14 01172 g004
Figure 5. Local Moran’s I spatial autocorrelation map of the carbon emission efficiency in Shenzhen.
Land 14 01172 g005
Figure 6. GWR residual map of the role of the urban form on the carbon emission efficiency in Shenzhen.
Land 14 01172 g006
Figure 7. Geospatial arrangement of the impact coefficients of urban form indicators: (a) fastway length (fl), (b) POI density (poi), (c) secondary road length (srl), (d) station density (sd), (e) main road length (mrl), and (f) building density (bd).
Land 14 01172 g007
Figure 8. Quantile distribution of the carbon emission efficiency in Shenzhen.
Land 14 01172 g008
Table 1. Indicators of the urban form and their explanation.
CategoryElementsCalculation InstructionsOriginal DataData Source
Land use typeLand use mix (lum)Measurement of the land use composition using the Shannon diversity index (SHDI)30 m land use dataGlobeLand30, NGCC, China
Land nature mix (lnm)Measurement of the land use composition based on POI categories using the SHDIPOI dataAmap Open API Platform
Functional mixPOI density (poi)Total number of POIs within each unit gridPOI dataAmap Open API Platform
Building density (bd)Total building area within each unit gridUrban building dataOpenStreetMap (OSM)
Transportation structureStation density (sd)Total number of public bus and metro stations within each unit gridUrban bus and station dataAmap Open API Platform
Main road length (mrl)Total length of the main roads within each unit gridUrban road network dataAmap Open API Platform
Secondary road length (srl)Total length of secondary roads within each unit gridUrban road network dataAmap Open API Platform
Fastway length (fl)Total length of expressways and highways within each unit gridUrban road network dataAmap Open API Platform
Spatial layoutEmployment density (ed)Total number of employees within each unit gridMobile signal dataChina Mobile (CMO), PRC mobile operator
Population density (pd)Total number of residents within each unit gridMobile signal dataChina Mobile (CMO), PRC mobile operator
Control variableMountainous areaIf forest > 50% of grid area; 0 otherwise.30 m land use dataGlobeLand30, NGCC, China
Note: The Shannon diversity index (SHDI) is used to assess the variation in indicators. This index accounts for not only the richness of the indicators but also their evenness. A higher value indicates greater diversity. This index can be calculated as S H D I = ( p i × ln p i ) , where p i denotes the proportion of individuals of the i -th species relative to the total number of individuals.
Table 2. OLS regression coefficients for carbon emission efficiency and urban form variables in Shenzhen.
Carbon Emission EfficiencyCoef.p Value
Land use mix−0.0470.003 ***
Station density0.0030.896
Secondary road length−0.0400.029 **
Land nature mix0.3870 ***
Main road length−0.0360.089 *
Building density0.3070 ***
POI density−0.1290 ***
Fastway length0.1220.364
Employment density0.0430.147
Population density0.1350 ***
Constant17.890 ***
Mean dependent var.17.890Standard deviation dependent var.26.962
R-squared value0.4518Number of observations2367
F test199.008Prob. > F0.000
Akaike information crit. (AIC)5320.938Bayesian information crit. (BIC)5364.178
*** p < 0.01, ** p < 0.05, * p < 0.1.
Table 3. Geographically weighted regression analysis of the carbon emission efficiency and urban spatial form in Shenzhen.
VariableOLSGWR
Coef.Min.Med.Max.Avg.
Land use mix−0.047−0.139−0.0300.019−0.049
Station density0.003−0.099−0.0340.086−0.014
Secondary road length−0.040−0.072−0.0300.060−0.017
Land nature mix0.3870.0780.4040.4710.363
Main road length−0.036−0.095−0.0230.085−0.024
Building density0.3070.1090.2670.4880.275
POI density−0.129−0.224−0.1160.045−0.102
Fastway length0.122−0.031−0.0020.0790.013
Employment density0.043−0.0700.0811.1020.283
Population density0.135−0.443−0.0110.217−0.035
R20.4510.502
AICc5320.9385146.571
Table 4. Quantile regression model results for the carbon emission efficiency and urban form in Shenzhen.
VariableQuantileOLS
(0.1)(0.25)(0.5)(0.75)(0.9)
Land use mix−0.0131−0.0233−0.0113−0.0000262−0.00101−0.047 ***
(−1.93)(−1.81)(−0.85)(−0.00)(−0.03)
Station density0.0935 ***0.135 ***0.0465 *−0.0233−0.164 **0.003
(8.06)(6.15)(2.05)(−0.84)(−3.07)
Secondary road length−0.00122−0.000175−0.0187−0.0272−0.00657−0.040 **
(−0.16)(−0.01)(−1.24)(−1.46)(−0.18)
Land nature mix−0.01080.03280.264 ***0.437 ***0.649 ***0.387 ***
(−0.80)(1.28)(10.01)(13.45)(10.43)
Main road length−0.0106−0.0179−0.00742−0.0160−0.00847−0.036 *
(−1.18)(−1.06)(−0.43)(−0.74)(−0.21)
Building density−0.006260.03170.254 ***0.472 ***0.665 ***0.307 ***
(−0.50)(1.35)(10.51)(15.84)(11.65)
POI density0.0356 ***−0.0283−0.0854 ***−0.122 ***−0.0992 *−0.129 ***
(3.47)(−1.46)(−4.27)(−4.95)(−2.10)
Fastway length−0.00639−0.00301−0.003820.003670.0723 *0.122
(−0.98)(−0.24)(−0.30)(0.23)(2.40)
Employment density−0.0953 ***−0.0691 **0.01420.0837**0.208 ***0.043
(−7.49)(−2.87)(0.57)(2.74)(3.56)
Population density0.187 ***0.284 ***0.125 ***0.0357−0.09820.135 ***
(12.93)(10.36)(4.41)(1.03)(−1.47)
Constant−0.572 ***−0.423 ***−0.0918 ***0.231 ***0.620 ***17.89 ***
(−89.80)(−35.15)(−7.40)(15.12)(21.17)
R-squared0.05980.16900.39590.47840.43590.451
*** p < 0.01, ** p < 0.05, * p < 0.1.
Disclaimer/Publisher’s Note: The statements, opinions and data contained in all publications are solely those of the individual author(s) and contributor(s) and not of MDPI and/or the editor(s). MDPI and/or the editor(s) disclaim responsibility for any injury to people or property resulting from any ideas, methods, instructions or products referred to in the content.

