Review

A Novel Framework to Represent Hypoxia in Coastal Systems

by
Aavudai Anandhi
1,*,
Ruth Book
2,† and
Gulnihal Ozbay
3
1
Biological Systems Engineering, Florida Agricultural and Mechanical University, Tallahassee, FL 32307, USA
2
Agricultural and Biological Engineering, University of Illinois, Urbana, IL 61801, USA
3
Department of Agriculture and Natural Resources, College of Agriculture, Science and Technology, Delaware State University, Dover, DE 19901, USA
*
Author to whom correspondence should be addressed.
Retired State Conservation Engineer USDA-Natural Resources Conservation Service.
Land 2025, 14(6), 1169; https://doi.org/10.3390/land14061169
Submission received: 1 April 2025 / Revised: 8 May 2025 / Accepted: 21 May 2025 / Published: 29 May 2025
(This article belongs to the Section Water, Energy, Land and Food (WELF) Nexus)

Abstract

:
Policymakers face the challenge of increasing food and energy production while reducing nutrient pollution. Coastal hypoxic zones, often caused by human activity, are a key indicator of sustainability. The purpose of this study is to develop a novel framework that can be used by policymakers to assess strategies to reduce or eliminate hypoxic zones in coastal waters. The developed framework includes socioecological conditions by integrating the Driver–Pressure–State–Impact–Response (DPSIR) framework and multiple thinking approaches (nexus, systems, and goal-oriented) with sustainable development goals (SDGs) and their targets, the food–energy–water (FEW) nexus, agricultural conservation practices (ACPs), and the collective knowledge from the published literature and experts, all applied to hypoxia in oceans. Four categories of ACPs with potential positive effects on hypoxia were identified: conservation cropping systems, conservation drainage systems, riparian buffer systems, and wetland systems. The Gulf of Mexico, a large hypoxic zone, served as a case study. The methods from the development of this framework may be tailored to some 500 global coastal hypoxic zones, covering 245,000 km2 of oceans.

1. Introduction

The world’s land and oceans provide humanity with both animate and inanimate natural resources, including food, energy, and water (FEW) [1,2], as well as other ecosystem services. It is estimated there will be a huge demand for FEW to sustain 9.7 billion people on the planet by 2050, and this has prompted researchers to investigate more sustainable and novel FEW sources in both land and oceans [3,4,5]. However, the land and oceans are under pressure from unsustainable practices, pollution, tourism, and population growth, causing degradation, and even the disappearance of the resources in some extreme cases [6]. One such example since 1960 is the recurrence of more than 500 hypoxic zones (dead zones) in coastal waters that lie downstream of major population centers and agricultural areas across the globe, collectively occupying over 240,000 km2 [7]. In addition, hypoxic regions (often associated with coral reefs) are generally underreported by an order of magnitude for tropical regions when compared to temperate regions [8]. Hypoxic zones are formed when nutrient-overloaded waters are deprived of oxygen (O2), typically caused by decaying organic matter from phytoplankton growth stimulated by the nutrients [9]. This phenomenon exposes aquatic organisms to reduced concentrations—typically ≤2 mg O2/L—that elicits an aerobic metabolic crisis, i.e., hypoxia. Hypoxia potentially threatens global ecosystem services (both ecologically and economically) as well as coastal sustainability in billions of U.S. dollars annually [10].
The challenge is to produce more food and energy while decreasing nutrient water pollution sustainably. There is concern that increased agricultural production may further hinder the achievement of hypoxic zone reduction [11]. The excessive use of resources in the agriculture sector impacts food, freshwater, and energy security and is one of the key sources in moving nutrients into aquatic systems. The production of crops for bioenergy not only contributes to the nutrients from the agriculture sector but also produces wastewater at various points in the supply chain, which can also lead to hypoxia [12]. Over the years, several goals have been set. For example, the U.S. Environmental Protection Agency (USEPA) has proposed that a 45% reduction in both total nitrogen and total phosphorus loads to the Gulf of Mexico (GOM) are needed to decrease the size of the hypoxic zone to an average size of 5000 km2 [13]. The five-year average hypoxic zone size is still more than twice the management goal of 5000 square kilometers by 2035 [14]. The cost of reducing annual nitrate (NO3-N) loadings by 30% is estimated to be US$1.4 billion/year, with a concomitant 36% reduction in P, and the cost of reducing annual P loadings by 30% is estimated to be US$370 million/year, with a concomitant 9% reduction in NO3-N [15]. More recently, a 45% to 60% reduction in N loading may be necessary in order to meet the USEPA’s goal to reduce hypoxia in the GOM [14,16].
To address the sustainability issues associated with hypoxia and FEW, researchers and policymakers rely on frameworks to structure their work and increase their understanding. One such is the Driver–Pressure–State–Impact–Response (DPSIR) framework, which shows promise for coastal systems [17]. The DPSIR framework provides a structure for examining and analyzing the complex and interconnected relationships between social and environmental factors. Several frameworks exist in the literature to individually represent the FEW nexus as well as hypoxia [1,9]. A framework that integrates both could potentially be useful while exploring more sustainable and novel FEW sources. Even more powerful would be to include consideration of the United Nations’ sustainable development goals (SDGs) [18], which seek to address, among many other things, issues that drive the FEW nexus and hypoxia.
Existing frameworks offer either a highly integrated approach or a prioritization approach to the 17 SDGs and 169 targets [19]. While integration aims to address the complexity of sustainable development holistically, implementation remains uncertain. Prioritization is often viewed as a best practice in management, but determining what to prioritize is challenging due to the deeply interconnected nature of sustainability issues.
The SDGs aim to eliminate poverty, ensure sustainable lifestyles, and protect planetary systems. Griggs et al. [20] proposed an evidence-based framework linking food, energy, water, and ecosystems, highlighting the need for integrated targets to address sectoral interactions, maximize synergies, and manage trade-offs in sustainable development implementation.
An example of the integrated approach is the role of water quality as a connector among the SDGs [12]. While only a few explicit interlinkages were identified, many more implicit connections exist between water quality and various targets, highlighting the importance of recognizing cross-cutting issues in sustainable development planning.
Another study innovatively integrated the DPSIR model and water quality indices to support sustainable groundwater management in intensively cultivated areas and to propose targeted responses aligned with SDG outcomes [21].
SDG 14 (conserve and sustainably use the oceans, seas, and marine resources for sustainable development) is particularly relevant to this effort, along with SDG 6 (ensure the availability and sustainable management of water and sanitation for all) [12,22]. Several land management actions (interventions and practices) aim to protect soil and water resources against degradation [23], and enhance ecosystem services, as well as to reduce nutrient pollution. These actions reduce hypoxia in the oceans. These actions are often referred to as alternative management practices [24], best management practices (BMPs), and/or ‘nature-based solution’ practices [25]. In urban areas, these are also referred to as low-impact development practices or green infrastructure practices [26]. They are referred to as agricultural conservation practices (ACPs) in agroecosystem-dominated regions [27] and this terminology is used in this study. “SDG 14 and its targets” and “hypoxia and management practices” are studied [28,29]. However, studies that combine the developed framework which includes socioecological conditions by integrating the Driver–Pressure–State–Impact–Response (DPSIR) framework and multiple thinking approaches (nexus, systems, and goal-oriented) with sustainable development goals (SDGs) and their targets, the food–energy–water (FEW) nexus, agricultural conservation practices (ACPs), and the collective knowledge from the published literature and experts, all applied to hypoxia in oceans, are lacking.
The objective of this study is to develop a novel framework that addresses the identified needs of combining both the FEW nexus and hypoxia. Specifically, this study includes the following features:
(1)
To develop a novel theoretical base by integrating the DPSIR framework and multiple thinking approaches (nexus, systems, and goal-oriented) with components related to hypoxia including the FEW nexus, SDGs, and ACPs;
(2)
To apply the theoretical base as a conceptual framework to represent hypoxia using the evidence and collective knowledge about the recurring hypoxia in oceans in the context of the identified components.
Recurring hypoxia in the Gulf of Mexico (GOM) is chosen in this study to demonstrate the framework because it is one of the largest human-caused coastal hypoxic zones: the largest in the United States of America (USA), and second largest in the world. The affected area of GOM hypoxia has been increasing, from 14,500 km2 in the summers of 2004 to 20,720 km2 through 2013 and around 23,000 km2 in 2019 [9,30,31]. In the USA, the other well-known hypoxic zones (dead zones) are in the Chesapeake Bay and in Lake Erie [30].
It is hypothesized that the developed framework for hypoxia in the GOM can be applied to some 500 coastal hypoxic zones and over 240,000 km2 of coastal oceans in the world (an area larger than the United Kingdom).

2. Methods

Figure 1 presents a flowchart outlining the sequential steps of data collection, analysis, and interpretation in this study. It also illustrates the integration of key elements—including the DPSIR model, FEW nexus, ACPs, collective knowledge, and systems thinking approaches—used in the development and application of the theoretical framework. This integrated approach is specifically designed to assess and address hypoxia in a water body (the GOM, in this case), providing a structured overview of the research process and highlighting the logical progression toward achieving SDG-aligned outcomes.

2.1. Theoretical Base

The theoretical base diagram shown in Figure 2 outlines the relationships between the DPSIR framework, collective knowledge, and thinking types used in the development of the novel framework. The DPSIR framework consists of the following components. Interpretations of these components vary among studies [17]; the definitions used in this study are given below:
(1)
Drivers are the ultimate cause of change in the ecosystem and can be any combination of biophysical, human, and institutional actions, processes, factors (at various scales—global/regional/local; or social/demographic/economic), needs, or activities perturbing the environment.
(2)
Pressures are the environmental stressors created by the drivers.
(3)
States refer to the conditions of the system attributes (physical, chemical, and/or biological characteristics) that can be objectively measured and used to assess the status of the system. The state refers to a baseline condition from which impacts are measured.
(4)
Impacts are the results of the pressures causing changes in the states that influence the quality and functioning of the environment and have consequences for social welfare.
(5)
Responses are the actions taken by groups (private/state/federal/non-governmental agencies) or individuals in society through rules, laws, shifts in behavior, prevention, mitigation, or regulation to protect the ecosystem, and control and/or eradicate negative impacts.
More information on the types and variations of DPSIR can be obtained from Pagan et al. [19]; Sharma et al. [20]; and Sharma and Anandhi [21].
In this study, collective knowledge was gathered through a comprehensive literature review and enriched by local knowledge, drawing on three experts (the authors in this study). The experts used selection criteria based on their subject-matter expertise, experience they possess, familiarity with the socioecological dynamics of the study region, representation from both academia and government, prior research, fieldwork, engagement with local institutions, and long-term observation of ecological and socio-political changes in the area. Such embedded knowledge was instrumental in contextualizing the broader findings from the literature within the local realities.
The literature review entailed an analysis of peer-reviewed journal articles, technical reports, policy documents, and relevant case studies collected using search words (e.g., Gulf of Mexico, conservation practice, DPSIR, FEW nexus, SDG, targets, and hypoxia). Sources covered a range of interdisciplinary topics including coastal hypoxia, nutrient cycling, land–sea interactions, the DPSIR framework, the FEW nexus, and global sustainable development strategies. The review aimed to identify not only the biophysical drivers of hypoxia but also governance challenges, socioeconomic linkages, and examples of effective intervention strategies from comparable regions. This process yielded insights into global patterns and allowed the study to draw on well-established theoretical models, such as systems thinking and integrated environmental assessment, while adapting them to the local context.
In parallel, local knowledge—grounded in lived experience, community practices, and historical memory—offered invaluable information about the specific ecological trends, land use changes, and cultural dimensions that influence how hypoxia manifests and is managed in the region. This kind of knowledge often fills critical data gaps, especially in data-scarce environments, and plays a vital role in designing interventions that are both socially acceptable and ecologically effective.
By synthesizing these two knowledge streams—global scientific evidence and local experiential insights—the study was able to identify and map the most relevant components, linkages, and feedback mechanisms for inclusion in the conceptual framework. This integrative approach ensured that the resulting model was both scientifically grounded and contextually tailored, increasing its potential for guiding adaptive, inclusive, and sustainable responses to coastal hypoxia.
Several overlapping thinking approaches (systems, nexus, and goal-oriented) were used to understand and represent the knowledge gained on hypoxia in the GOM, ACPs, SDGs, and the FEW nexus.
  • Systems thinking focuses on the relationships between the parts or components forming a purposeful whole [32,33]. This method has been used for more than half a century to study and manage complex feedback systems and provides an effective tool for understanding large-scale problems [34]. Exposure, vulnerability, and adaptation of agroecosystems to stressors such as a changing environment are some examples of application of systems thinking [35,36].
  • Nexus thinking seeks to understand the totality of the parts or components by looking at the nexus where they overlap, reflecting areas of common interest [1].
  • Goal-oriented thinking is a purposeful mental process used when solving a problem or working on a task and generally occurs when an individual is reasoning, problem solving, and decision making. In this type of thinking, the current situation and the desired state are determined; then, the two are connected through a series of actions to transform the former to the latter [37].
One or more of these approaches are often used in specific applications. For example, combining the systems thinking approach and nexus thinking can be used to study the FEW nexus. For understanding linkages between the SDGs, all three may be needed.
In this study, the knowledge obtained from collective memory was categorized into components. Relationships using the thinking approaches were integrated using the DPSIR framework.

2.2. ACP Components

Many ACPs have been developed as tools to protect soil and water resources against degradation as well as reduce nutrient inflow into GOM [23]. When implemented, ACPs represent responses in the DPSIR framework. Many of the ACPs listed in the Natural Resources Conservation Service (NRCS) National Handbook of Conservation Practices [38] are implemented each year in the Mississippi and Atchafalaya River Basin (MARB), which drains to the GOM. Selected ACPs from the Handbook were grouped into general categories for consideration in this study. The following list presents the categories, along with the selected NRCS conservation practice standards and a brief description:
  • Conservation cropping systems that address water quality include practices that minimize disturbance of the soil, protect the soil from erosion, and reduce the magnitude of nutrient loss from the crop field. Conservation tillage has been defined as any mechanical manipulation of the soil for the purpose of crop production that leaves more than 30% of plant residues at the soil surface after seeding and is broadly classified into three types (no-till, ridge-till, and mulch-till) [39]. No-till involves planting into unprepared soil, ridge-till is defined as planting on ridges formed during cultivation the previous year without disturbing the inter-row area, and mulch-till is defined as a full-width tillage that leaves the requisite residue on the soil surface [40]. Conservation crop rotation involves planting a series of crops in a given location over a number of years and can reduce nutrient loss when legumes are included in the cycle [41]. Cover crops provide growing ground cover when the primary crop is not active [42] and are known by many different names [43], namely, green manures (fix N), catch crops (take up nutrients during fallow period), or living mulch (grown during and after the cash crop) [44]. Nutrient management is the practice of applying the “right nutrient source with the right rate at the right time in the right place” [26] and minimizes nutrient loss. Selected NRCS conservation practices in this category include Conservation Crop Rotation (328); Cover Crop (340); Nutrient Management (590); Residue and Tillage Management, No-Till (329); and Residue and Tillage Management, Reduced Till (345).
  • Conservation drainage systems include a suite of practices intended to reduce, capture, and/or treat nutrient-laden drainage water from agricultural land. Controlled drainage (also known as drainage water management) is the process of seasonally controlling the outlet elevation of a drainage system to manage drainage volume and water table elevation [45]. Structural practices such as denitrifying bioreactors and saturated buffers route drainage water through a carbon source (typically wood chips in the bioreactor, or soil organic matter in the case of the saturated buffer) to allow naturally occurring denitrifying bacteria to remove NO3-N [46,47]. Drainage water recycling (also known as tailwater recovery) is used to capture and reuse water from drainage systems and can reduce nutrient loading to downstream waters as well as benefit crops via supplemental irrigation [48]. Selected NRCS conservation practices in this category include Denitrifying Bioreactor (605), Drainage Water Management (554), Irrigation and Drainage Tailwater Recovery (447), and Saturated Buffer (604).
  • Riparian buffer systems consist of vegetation placed between an agricultural field and a water body, intended to trap or remove nutrients and contaminants from surface runoff [49]. Selected NRCS conservation practices in this category include Filter Strip (393), Riparian Forest Buffer (391), and Riparian Herbaceous Cover (390).
  • Wetland systems are land areas inundated or saturated by surface or groundwater at a frequency and duration that is enough to support vegetation adapted to live in saturated soil conditions, and, under normal circumstances, support vegetation [50]. Wetlands provide essential functions such as water purification [41], flood control, groundwater recharge, and nutrient cycling [51]. Constructed wetlands are engineered treatment systems that use natural processes involving wetland vegetation, soils, and microbial communities to enhance water quality [52]. Selected NRCS conservation practices in this category include Constructed Wetland (656), Wetland Creation (658), Wetland Enhancement (659), and Wetland Restoration (657).

2.3. FEW Nexus Component

The FEW nexus component of the framework can be defined broadly as the totality of the food, energy, and water sectors, narrowed down to the common interest (overlap) among the three sectors, or something in between. For the narrow option, the selected nexus definition is developed by (a) deciding whether to describe things as ideas, processes, or objects; (b) choosing whether to describe framework connections based on their properties, perspectives, consequences, or approaches; and (c) the specifics of the connection [1]. Broader definitions incorporate more than one type of description for things and connections. A narrow FEW nexus definition simplifies the description, while a broad definition is complex.
In this study, we incorporated a definition which is something in between narrow and broad. We included things as processes (water quality, and food and energy production) and ideas (types of thinking and collective knowledge). The framework connection was described using perspectives (analytical and boundary concept), consequences (hypoxia), properties (impacts), and approaches (systems of systems). We chose a moderate path of definition to develop and demonstrate the framework to multiple potential stakeholders (e.g., researchers, scientists, producers, planners, managers, industries in food, water, energy, government policymakers, and administration). More explanation of how this was developed can be obtained from Table 1 in Anandhi, Srivastava, Mohtar, Lawford, Sen, and Lamba [1]. This component of the framework integrates several DPSIR components (e.g., Driver, Pressure, and Impact).

2.4. SDG and Targets Component

In the framework developed for this study, goal-oriented thinking links SDG and its targets with GOM hypoxia for problem solving and decision making. The SDGs include 17 goals divided into 169 targets for 2030 to achieve a better and sustainable future for the world [53]. Among the 17 goals, two goals are obvious for water quality (SDG 6—“clean water and sanitation” and SDG 14—“life below water”). The study brings out the linkages between SDGs and targets in the context of GOM hypoxia using collective knowledge. Achieving SDG 14 will impact several targets across most of the 17 SDGs that are relevant to the sustainable development of coastal zones [54]. This component of the framework integrates most DPSIR components.
Using collective knowledge (literature review and local knowledge) and discussions among experts, the SDG targets that are relevant to GOM hypoxia criteria were classified as “high”, “moderate”, and “low” with respect to hypoxia, FEW nexus, and ACPs in GOM. The details of this analysis are presented in the Supplementary Materials:
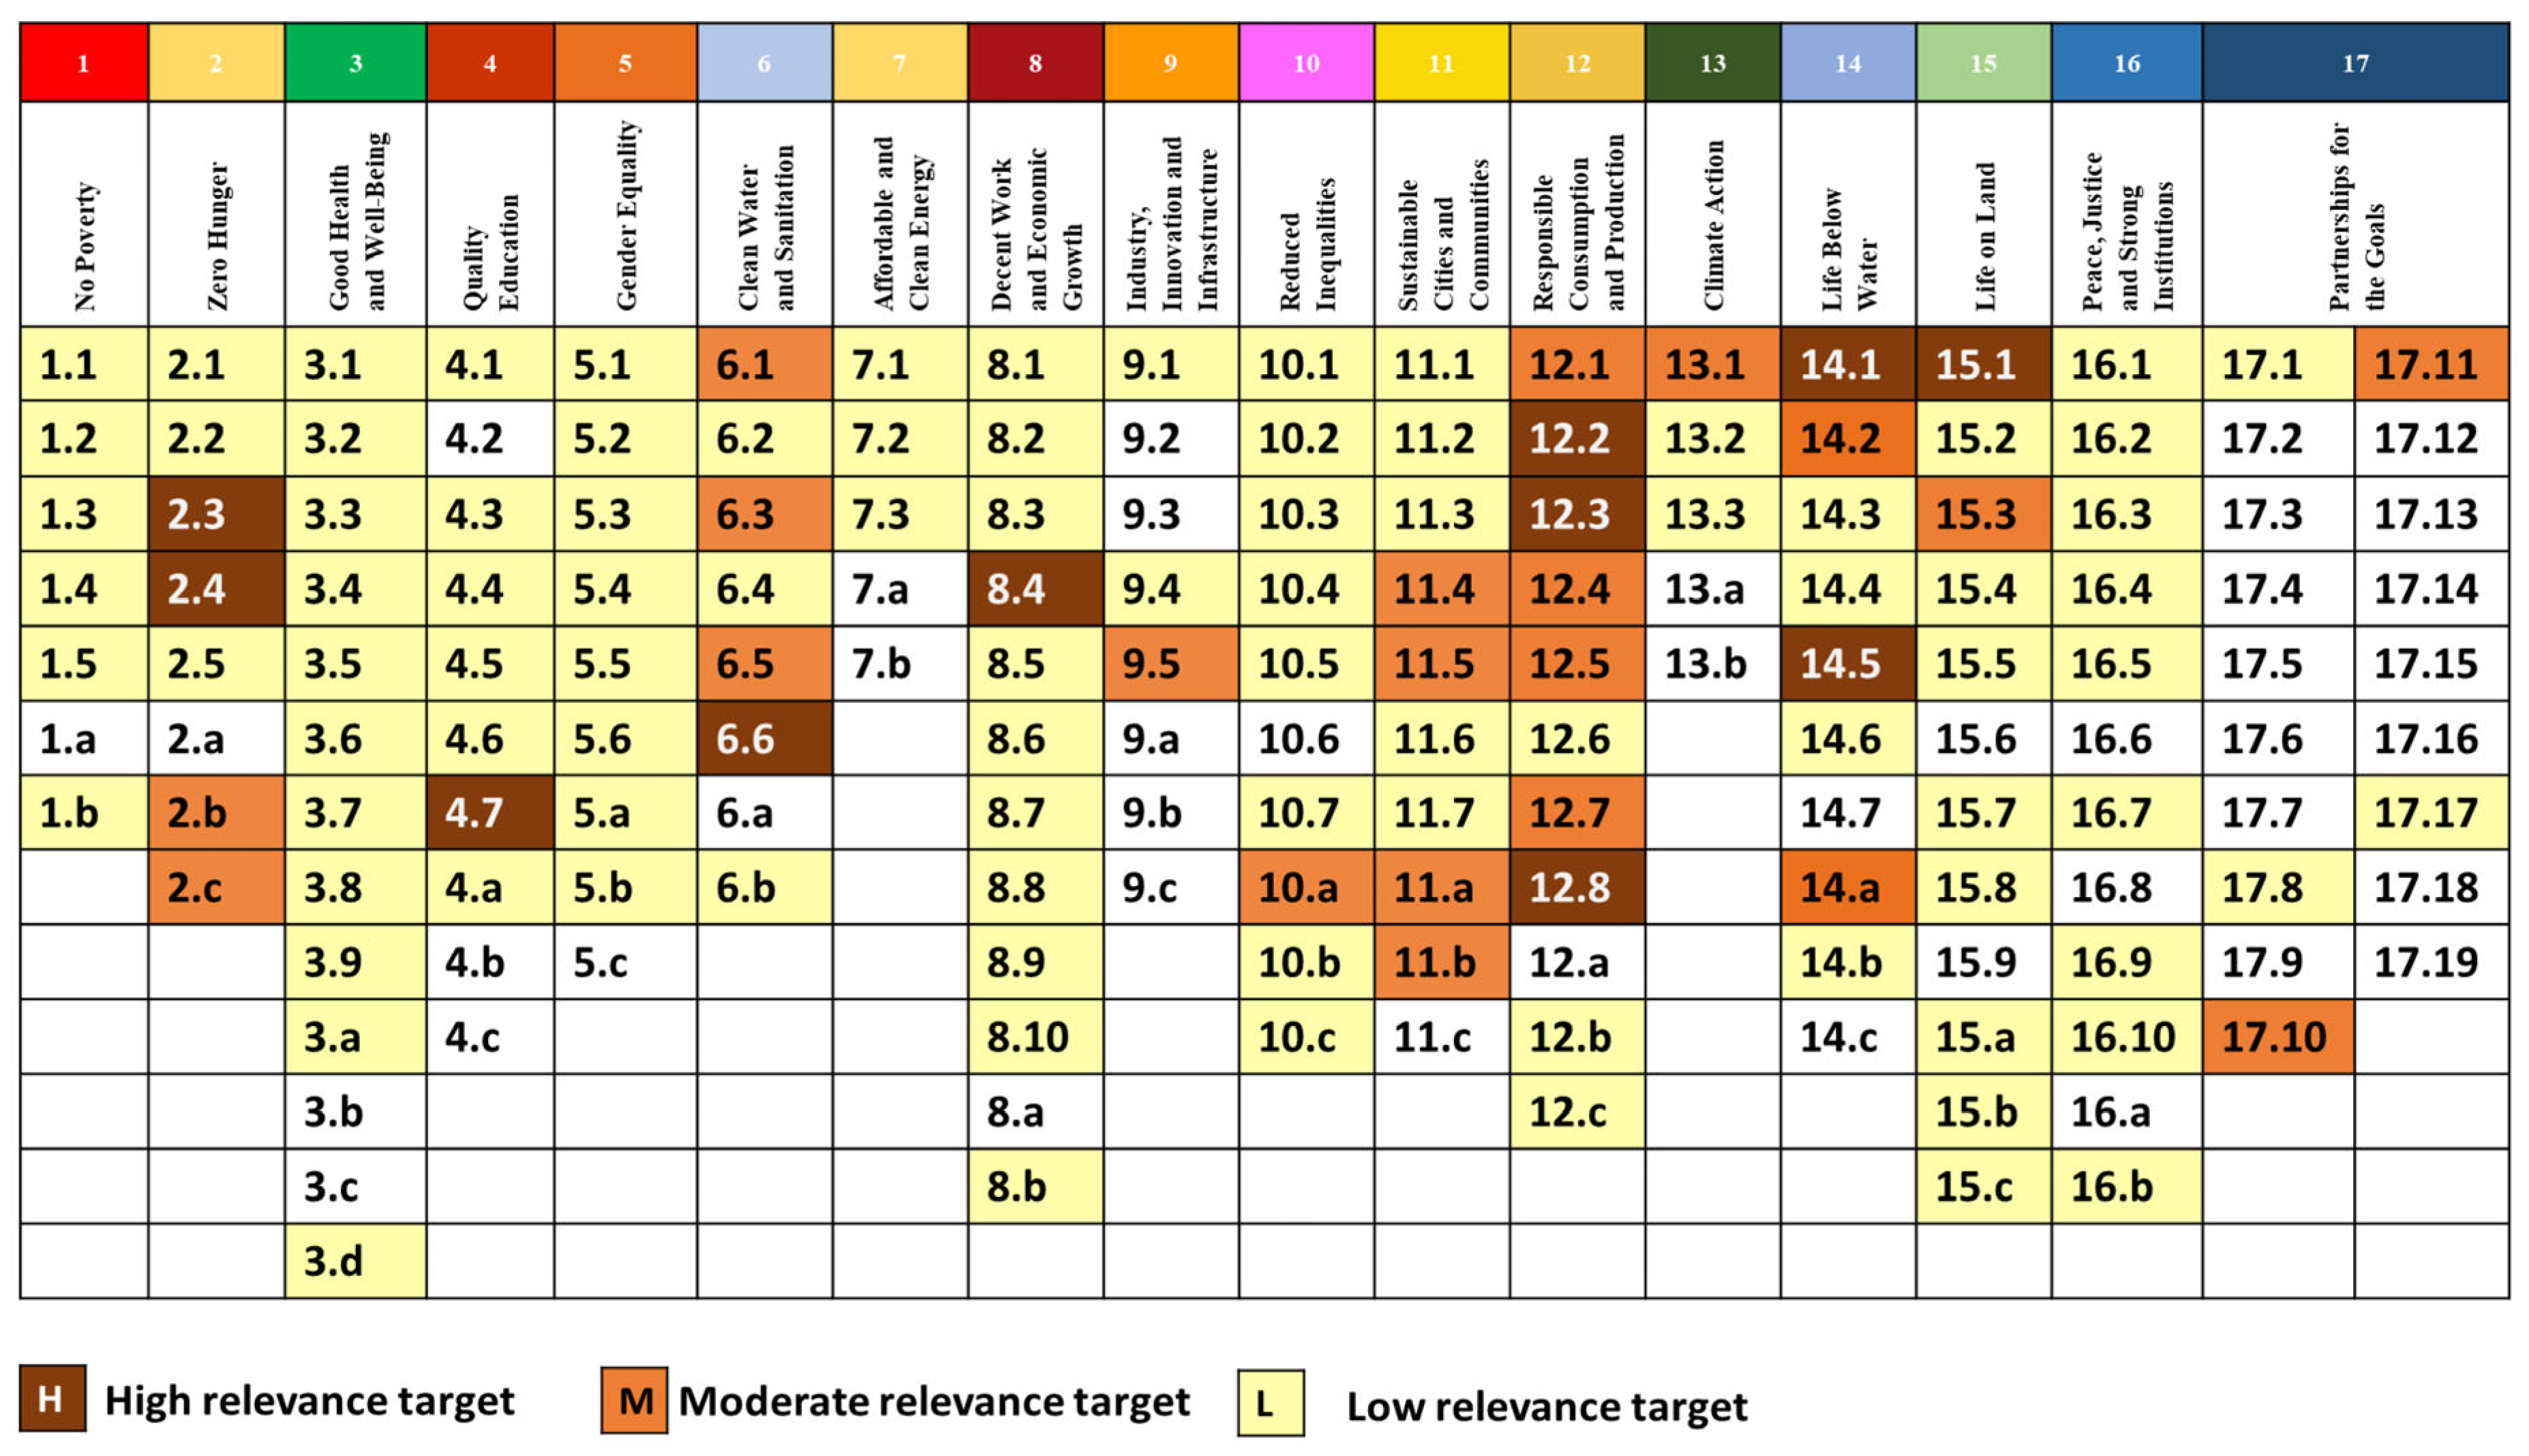
  • Targets classified as having “high” relevance are highly likely to happen in the study region and directly impact hypoxia through interventions (e.g., technological, social, administrative, or economic).
  • Targets classified as having “moderate” relevance are moderately likely to happen in the study region and affect hypoxia through interventions (e.g., technological, social, administrative, or economic).
  • Targets are classified as having “low” relevance if they are unlikely to happen very often in the study region or only indirectly impact hypoxia through interventions (e.g., technological, social, administrative, or economic).
Finally, the following criteria were used to determine whether an SDG is “particularly important”:
(1)
If it has any target labeled “high”;
(2)
If it has at least three targets labeled “medium”.
Where discrepancies arose, experts engaged in discussions and re-evaluated their responses. This iterative feedback process facilitated consensus-building and helped refine the relevance and weighting of criteria.

3. Linkages and Discussion

The components developed for the framework are assembled and linkages explored. Figure 3 presents a graphic image of the concept for the framework developed in this study. From this framework, causal chains (loops) may be developed for use by researchers and policymakers.

3.1. GOM Hypoxia and DPSIR Framework

In the developed framework, the components of the DPSIR framework are linked to hypoxia in the GOM using systems-, goal- and nexus-thinking approaches using local knowledge (experts), as well as the collective knowledge from the literature review.
Driver (D): Drivers for this framework are the combination of climate change, land- and water-based human activities (e.g., land use change, unsustainable practices, urbanization, stream modification, pollution, tourism, and growth), and factors such as demand for more food, water, and energy. The D component is linked to hypoxia using nexus thinking. The need for more food, and limited land resources at multiple scales drive the application of increased fertilizers and unsustainable practices in the MARB. Physical forces in the GOM (e.g., onshore winds and salinity) cause MARB plume waters containing nutrients, sediments, and organic matter to be transported westward alongshore and eastward to a ~200 m depth where the continental shelf ends [55]. Further, water column stratification and the abundance of decomposing organic matter, increased NO3-N loading due to deforestation, navigation channelization, wetland draining for cropland, the loss of riparian zones, and large increases in fertilizer application, particularly N, are considered causes for the increase in the GOM hypoxic zone [11].
Pressure (P): The effects of these drivers are linked to the pressures on the GOM system causing environmental change and can be objectively measured using changes in temperature, precipitation, wind speed, and human and species population. The P component is connected to hypoxia using nexus thinking. The MARB drains the largest agricultural region in the nation, which is roughly 41% of the contiguous USA [56] and is the main source of hypoxia in the GOM. The Mississippi River contributes about 95% of all sediment entering the northern GOM (average ~436,000 tons/day) and, during a major flood year, up to 550 million tons of sediment [57].
In the past two centuries, these pressures have modified landscapes and water flows [55]. For example, the transparent (e.g., Yazoo River) or tannin-rich (e.g., lower Mississippi River) flowing rivers are now slow turbid flows or stagnant seasonally due to land fragmentation (e.g., extensive agriculture and deforestation), groundwater exploitation, and the construction of water management structures (e.g., weirs and levees) [58].
Growing evidence indicates that climate-related extreme events are intensifying hypoxia in coastal ecosystems through multiple mechanisms: (1) altering the magnitude and timing of runoff, nutrient inputs, and terrestrial organic matter delivery; (2) promoting the formation of harmful algal blooms; (3) reducing oxygen solubility and enhancing water column stratification and microbial metabolism, leading to an earlier onset, increased frequency, and greater severity of hypoxic events; (4) partially offsetting the changes in nutrient loading and stratification due to rising sea levels and stronger storms, particularly in low- and mid-latitudes; and (5) interacting with large-scale oceanic and climate variability patterns such as El Niño, the Pacific Decadal Oscillation, and the North Atlantic Oscillation [59,60,61].
Many of these drivers and pressures originate outside the GOM, within the MARB (far-field), while some originate within the GOM hypoxic zone (near-field). More details on near- and far-field can be obtained from Pagan, Pryor, Deepa, Grace III, Mbuya, Taylor, Dickson, Ibeanusi, Chauhan, and Chen [19].
State (S): The information collected from the literature review is used to describe the S component. The state in the DPSIR framework developed in this study is the measured GOM conditions prior to hypoxia. The O2 content can be used to assess/represent the physical, chemical, and/or biological characteristics in ocean waters. The water in the GOM before 1900 did not show evidence of hypoxia [11]. For example, in the 1800s, the lower Mississippi River was a tannin-stained, blackwater stream with sandy/gravel substrates and perennial flows, bordered with forest. In 1820, the mouth of the Yazoo River (one of largest tributaries in lower Mississippi River) was a stream with transparent water, and thousands of geese, ducks, and fish [58]. The Mississippi Delta in the MARB was once a floodplain to the Mississippi River covered with hardwoods and marshland [62].
Impact (I): The reduced O2 content in ocean waters (≤2 mg O2/L) causing hypoxia represents the change in the state that influences the quality and functioning of the environment and has consequences for social welfare. The I component is connected to hypoxia using nexus thinking. Hypoxia in the GOM is caused significantly by the transport of nutrients, Nitrogen (N) and Phosphorus (P), from the MARB. The nutrients originate in large part from fertilizers typically used on agricultural fields to stimulate crop yield (drivers). When excess amounts of fertilizer are used, the nutrients can leave the crop fields through runoff or drainage, eventually reaching the watershed’s discharge point, usually a stream or river. In the MARB, all discharges flow to the GOM, causing excess biomass production stimulated by nutrient and allochthonous organic matter inputs. The nutrients contained in the runoff fuel phytoplankton growth and deplete oxygen, creating a hypoxic zone.
Response (R): ACPs are the actions taken by individuals or groups (agricultural producers, state/federal agencies, and non-governmental organizations) to regulate the nutrient flow into the GOM through avoidance, control, and trapping to protect the ocean waters, and control and eradicate the negative impacts of reduced O2. The ACPs are considered as response components in the DPSIR framework and connected to the MARB using nexus-and goal-thinking approaches. As an example of a large-scale response, the Mississippi River Delta region faces one of the highest coastal wetland loss rates globally, reaching up to 100 km2/year (impact). In response, several expensive and ambitious coastal restoration initiatives are underway (~$50 billion investment spread over 50 years to build and maintain ~2000 km2 of land) [10].

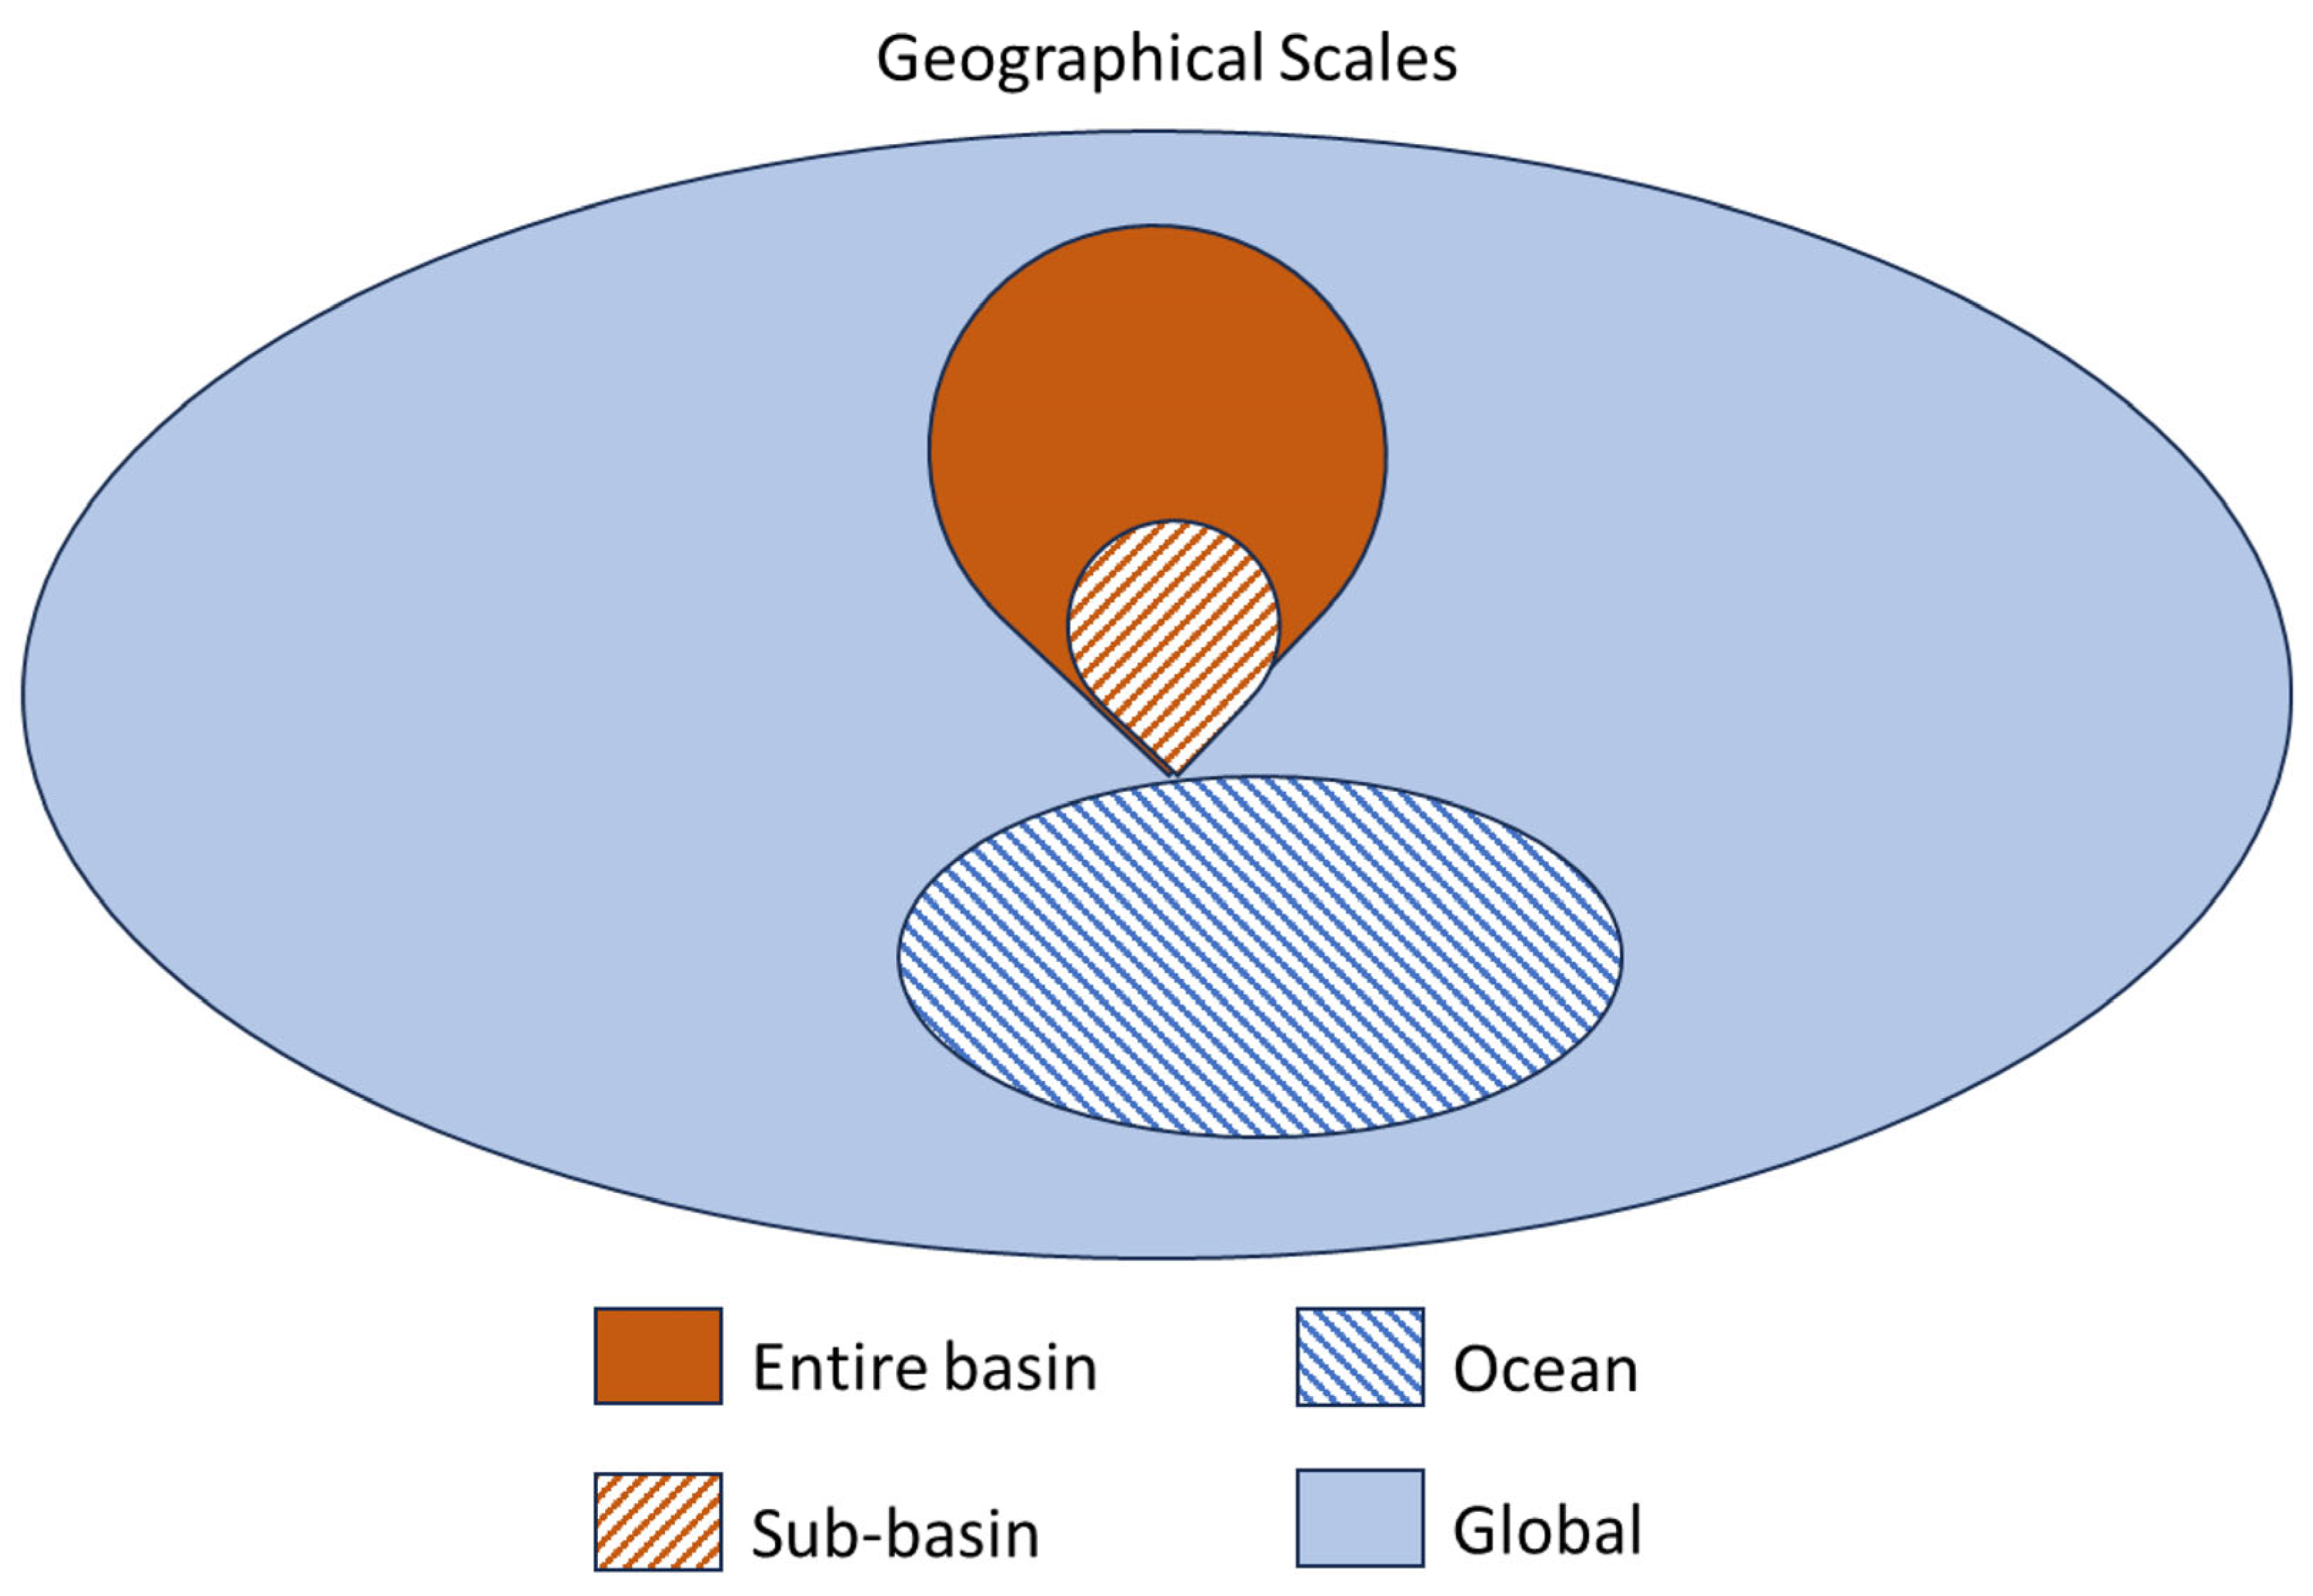
3.2. GOM Hypoxia and FEW Nexus

Conflicts between food, energy, and water in the MARB are growing with the increased demand [63]. The MARB is divided into five major basins and approximately 818 sub-watersheds (HUC-8), 557 of which contain significant agricultural cropland [31,56]. N (e.g., in amino acids) and P (e.g., in DNA) are the nutrients of life, critical for ecosystem productivity and biomass, and the primary reason for using fertilizers to enhance soil quality for agricultural activities [64]. In this study, the collective knowledge from the literature and experts were used to link the FEW nexus and hypoxia using systems and nexus thinking in four ways (Figure 4):
  • Entire basin—in the entire MARB;
  • Sub-basin—in a smaller region within the MARB such as the upper river basin (UMARB), lower river basin or alluvial valley, or the Big Sunflower River Watershed;
  • Ocean—in the GOM;
  • Global—in the entire globe, continent, or nation as presented in SDGs and discussed in the next section.
In this section, we explore linkages using nexus thinking and DPSIR components. The way the FEW nexus was incorporated in this study was to consider that food, energy, and water are necessary for human survival—yet, the production and usage of FEW contribute to hypoxia. Thus, activities that affect the availability of food, energy, and water directly or indirectly affect the hypoxia issue. The hypoxia issue is the main focus of the study, with the FEW nexus as a way to visualize why it is happening.
Entire basin: Systems- and nexus-thinking approaches, as well as the collective knowledge obtained from the literature review, were used to bring out the linkages between the FEW nexus and hypoxia in the entire MARB. Information from the reviewed literature indicate the following:
(1)
The region drains the largest watershed of all other rivers in the nation [57]. The significant food and energy production in this large region (see below) leads to a correspondingly large contribution of nutrients to the GOM.
(2)
The region has 58% cropland with a $100 billion annual economy from agriculture [63].
(3)
The region has experienced an increase in fertilizer application. In the previous half-century, a 3-fold increase in corn yield and a 20-fold increase in nitrogen fertilizer use has been experienced in the USA [63]. The MARB region has, in general, increased the fertilizer application 4-fold since 1961, from 50 to 200 kg nitrogen (N) ha −1 year−1, allowing for a doubling in crop yield [65].
(4)
The region is the main source of hypoxia in the GOM. The nutrients in the river impact water quality and lead to eutrophication. Agricultural land use is an important non-point source of nutrients that contributed more than 70% N and P loads to the GOM via the Mississippi River from 1975 to 2000 [65]. Another study revealed that agricultural sources in the MARB contribute 80% of the delivered N and more than 60% of the delivered P [31].
(5)
The region contributes nutrients from animal manure in the amounts of 5% and 37% of the total N and P (respectively) delivered to the GOM [63].
(6)
The region produces corn ethanol in large quantities. Changes in energy-producing crops could decrease water quality. An increase of corn-based ethanol production has been shown to worsen N leaching in the MARB and contribute to GOM hypoxia [66]. If the region were to produce 15 billion gallons of corn ethanol, a 10–18% increase in land-to-aquatic N export would result [63].
(7)
The region has a runoff of N fertilizer applied to row crops that contributes to >50% of N entering the GOM [67]. Each year, the MARB delivers ~953,000 Mg of NO3-N into the northern GOM, and the Atchafalaya River discharges, ~18% of this or about 174,600 Mg of NO3-N [56].
Sub-basin: Systems- and nexus-thinking approaches, as well as the collective knowledge obtained from the literature review, were used to bring out the linkages between the FEW nexus and hypoxia in selected basins (the upper and lower MARB, and a watershed) are presented from literature review. Information from the reviewed literature for the upper MARB indicate the following linkages between water quality, agricultural production, and energy production:
(1)
The UMARB is one of the five major river basins in the MARB and comprises 15% of the MARB by area. The region covers some 190,000 square miles (121.5 million acres; ~492,000 km2) between Lake Itasca in northern Minnesota and the confluence of the Mississippi and Ohio Rivers [68].
(2)
The UMARB includes large portions of several Corn Belt states delivering 45% of the annual nitrate/nitrite nitrogen (NOx-N) load in the MARB from 2000–2015 [69].
(3)
About half the area of the basin is in crops. Most of the cropland is in corn (32 million acres, or 130,000 km2) or soybeans (19 million acres or 77,000 km2); the region accounts for more than 40 percent of the national corn grain harvest and more than a third of the soybean harvest [68].
(4)
Agricultural drainage water emanating from these upper midwestern states is a NO3-N source [70]. The UMARB contributes more than half of the NO3-N reaching the Gulf of Mexico [23] and contains some of the highest concentrations of nonpoint-source NO3-N in the United States [71].
(5)
Iowa and Illinois, which account for 9% of the MARB by area, are estimated to contribute 35% of the total nitrogen flux in the MARB; this amount is doubled in flood years [69]. The UMARB contributes 43% of the N and 27% of the P flux to the GOM [15]. This region had 76 ethanol plants with a production capacity of 20 hm3 (~48% of USA biofuel production in 2009) and is also known to produce a major portion of grain-based biofuel [72].
Information from the collective knowledge and the reviewed literature for the Lower MARB indicate the following linkages between water quality, agricultural production, and energy production:
(1)
The Lower MARB (105,000 square miles, or 272,000 km2) is the smallest of the five major basins that make up the Mississippi River drainage and receives water from the Upper Mississippi, Ohio-Tennessee, Missouri, and Arkansas-White-Red River Basins [73].
(2)
Before the 1800s, this region was covered by bottomland hardwood forests and represented the second largest forested valley in the world. The Lower MARB is now transformed (change in state and food production process) into a landscape with 75% cropland and fragmented forest (50% of the forest clearing happened between the early 1800s and 1935) [58]. The main cultivated crops are corn, soybeans, cotton, and rice; in 2007, the region produced 65 percent of the U.S. rice crop and 26 percent of the national cotton crop [73]. With the shift to agriculture comes a significant increase in potential nutrient loss.
(3)
The lower Mississippi alluvial valley lies between Cape Girardeau, Missouri and Baton Rouge, Louisiana and is ~800 km long and ~150 km wide [58]. In the past two centuries, the river channel has been modified (change in state and water quality) by clearing trees and snags along the riverbanks, enlarging cross-sections with draglines or dredges, channelization, bendway cutoffs, diversions, and the construction of weirs [58]. The MARB’s deltaic plain has exceedingly high land loss rates (~25% of the original land area has been converted to open water since 1932) [74]. The loss of the delta wetlands removes the filtering service that had been provided, leading to increased hypoxia in the GOM.
(4)
Globally, about 70% of the blue water (fresh water in freshwater lakes, rivers, and aquifers) is used for agriculture. The Mississippi River Alluvial Plain contains the second most used aquifer in the USA, and, in the lower Mississippi alluvial valley, about 90% of the blue water is used for agriculture, withdrawn from groundwater (4.58 × 10⁷ m3 per day of water) and surface water [62]. The increase in irrigated area and unsustainable groundwater declines are projected to cause a groundwater supply gap of 27 × 106 m3 per day by 2050. The depletion of groundwater often leads to an increased reliance on surface water sources which can increase the runoff containing fertilizers. The nutrient-rich runoff will enter waterways, thus promoting algal blooms and consuming oxygen levels [60].
(5)
Wetland losses in the lower Mississippi alluvial valley exceed 74% (2.8 of an original 10 million ha remaining) [56]. Louisiana contains ∼40% of the wetlands in the contiguous USA and exhibits rapid declines of ~80% of the total wetland losses in the lower 48 states [56]. Despite these environmental changes (e.g., deforestation, the accretion of sediment in the stream, channel impairment, and landscape and riverscape engineering), the region has a diversity of birds (e.g., 60% of all bird species in the contiguous USA) and aquatic life (e.g., ~40 species of mussels, 45 species of reptiles and amphibians, 50 species of mammals, and ~200 fish species have been documented in the streams, lakes, and associated backwaters) [58]. These changes in state affect the processes in the FEW systems.
Information from the collective knowledge and reviewed literature for the Big Sunflower River Watershed indicate the following linkages between water quality, agricultural production, and energy production:
(1)
The Big Sunflower River Watershed is a major sub-watershed of the Yazoo River Basin in Mississippi (>7660 km2 area) which encompasses most of the land area in the Mississippi River alluvial floodplain (Mississippi Delta) and drains into the Mississippi River near Vicksburg via the Sunflower and Yazoo Rivers [57].
(2)
The groundwater level decline (>7 m since 1970) is one of the fastest groundwater depletion regions in USA and will continuously decline if conservation agricultural practices to promote reductions in groundwater withdrawals are not employed [62].
(3)
Agriculture (majority soybean and corn) is the main land use (>80%) in this sub-watershed [57]. Corn is a raw material for ethanol production, a renewable energy source. As of 2018, there were 14,684 irrigation wells in the watershed requiring high energy consumption [62]. Widespread agricultural land use can lead to excessive nutrient loss.
Ocean: The third way to link FEW and hypoxia (using systems and nexus thinking) is in the GOM itself. The GOM is home to a total of 15,419 species (out of which 1541 are fish, 2579 are crustaceans, and 2455 are mollusks), and, in 2019, 22% of the USA-produced $430 million worth of marine aquaculture seafood came from the GOM [75]. The northern Gulf of Mexico receives 1.82 billion kg N year−1 and an estimated 565 kg N km−1year−1 (25% of the MARB net anthropogenic input) travels through the MARB [76].
The GOM hypoxic zone occurs annually in early spring/summer due to anthropogenic activities that disrupt the natural ecosystem functioning and impact the FEW nexus. The decreasing water quality in the GOM affects food production, reducing the catches (fish, crab, and shrimp) within the zone [11]. The problem persists despite efforts to reduce the recurring hypoxia in the region [67]. Further, the intensification of hypoxia causes a dramatic reduction in the ecosystem’s ability to transfer energy to higher trophic levels and renders the ecosystem potentially less resilient to other stressors. The shifts in nutrient ratios may also shift the composition of the phytoplankton base and thus affect trophic interactions, the transfer of energy through marine food webs, and the flux of carbon that causes the development of hypoxia [55,77]. Dissolved oxygen and temperature have important effects on the energy budgets of aquatic organisms. For example, with a low level of dissolved oxygen (hypoxia), metabolic pathways associated with the production or use of energy are suppressed, leading to a reduction in the metabolic scope and energy available for growth and other activities of many organisms [78].
The growing demands for bioenergy and livestock feed, the increasing water and energy demand for agriculture, water pollution due to the nutrient runoff, and the consequent eutrophication and hypoxia affect aquaculture and coastal ocean fisheries, and are a growing problem in the MARB and the GOM [63]. Practices such as implementing large scale energy cover crops (e.g., rye) in the basin could address the goals of more crop yields through agricultural intensification, increase cellulosic bioenergy production, improve farm profits, provide carbon benefits, and reduce the negative environmental impacts of agriculture [79]. Changing 40% of the land use in the MARB from corn to switchgrass or miscanthus is predicted to reduce dissolved inorganic N by 15% and 20%, respectively [66]. Various environmental, economic, and social factors impact the feasibility of such changes.

3.3. GOM Hypoxia and SDGs/Targets

In this study, the collective knowledge was used to link SDGs/targets and hypoxia using systems and goal thinking. Coastal hypoxic zones directly affect 10–12% of the global population who depend on coastal systems for their livelihoods [7]. Hypoxia in the GOM has a global presence, because the MARB is the watershed for the world’s third largest river [63] and the GOM contains the second largest hypoxic zone in the world. The MARB represents roughly 41% of the contiguous USA [56], with a watershed area of 3 million km2, and is responsible for approximately 90% of the freshwater inflow into the GOM [76]. The region contributes 31% of the total river N flux entering the Atlantic Ocean [76]. Applying goal-oriented thinking, the current and desired states of GOM hypoxia are connected through a series of actions: linking those states with SDGs.
This study identified 126 targets among the 169 targets in the 17 SDGs as being of low, moderate, or high relevance to GOM hypoxia (Figure 5 and the Supplementary Materials). Of these, 11 targets are considered of high relevance that are highly likely to happen in the study region and directly impact hypoxia through interventions (e.g., technological, social, administrative, or economic). We consider 22 targets to be of moderate relevance, and 93 targets are considered to be of low relevance, as defined above (Section 2.4). This leaves just 43 targets that are not relevant to hypoxia, with most of them being in SDG 17 (“Partnerships for the goals”) and SDG 9 (“Industry, innovation and infrastructure”). The rest of the 15 SDGs are important to hypoxia, with each having just one to three targets that are not relevant.
The analysis of the targets within the SDGs required qualitatively classifying the level of relevance. During this process, it was observed that ACPs represent technological interventions (responses), so they are not included with the factors affected. The intent of the work is to explore how or whether the SDGs affect or impact the issues identified (hypoxia in the GOM, in this case). The classification was both qualitative and subjective, based on expert knowledge. For example, consider Target 1.4. Target 1.4 states that, by 2030, we must ensure that all men and women, in particular the poor and the vulnerable, have equal rights to economic resources, as well as access to basic services, and ownership and control over land and other forms of property, inheritance, natural resources, and appropriate new technology and financial services, including microfinance. While classifying Target 1.4, there was a debate about classifying this as a “moderate-relevance target” since the daily activities of folks who lack basic services would contribute to the pollutants entering surface waters that would eventually affect GOM hypoxia. However, the resulting assessment was as a “low-relevance target” because the conditions do not happen very often, percentage-wise, in the MARB.
This assessment provides a big-picture view of the hypoxia problem and can be useful in achieving the SDGs as well as USEPA’s goal of reduced nutrient loads to the GOM. The cost of reducing annual NO3-N loadings by 30% is estimated to be US$1.4 billion/year, with a concomitant 36% reduction in P. The cost of reducing annual P loadings by 30% is estimated to be US$370 million/year, with a concomitant 9% reduction in NO3-N [15].
The 17 SDGs and targets have multiple reinforcing and constraining linkages among them that provide both challenges and a substantial scope for solutions to reinforce positive and mitigate counteracting interactions [80]. Eight SDGs were found to be particularly important: those with any target labeled “high relevance” or at least three targets labeled “medium relevance” are SDG 2 (“Zero Hunger”), SDG 4 (“Quality education”), SDG 6 (“Clean water and sanitation activities”), SDG 8 (“Decent work and economic growth”), SDG 11 (“Sustainable cities and communities), SDG 12 (“Responsible consumption and production”), SDG 14 (“Life below water”), and SDG 15 (“Life on land”).
SDG 2 (“Zero Hunger”): The target to double agricultural productivity (2.3) could exacerbate hypoxia in the GOM due to the increased nutrient runoff. Target 2.4 promotes sustainable conservation practices, which could alleviate hypoxia by reducing nutrient pollution. Targets 2b and 2c address trade and market issues, crucial for economic stability but potentially influencing hypoxia through increased production.
SDG 4 (“Quality Education”): Target 4.7 focuses on equipping learners with the knowledge and skills for sustainable development, including environmental awareness. This education is vital for addressing hypoxia in the GOM through a better understanding and application of conservation practices.
SDG 6 (“Clean Water and Sanitation”): Target 6.6 aims to protect and restore water-related ecosystems. This is a high-relevance target because increasing the extent of wetlands can directly benefit water quality, and many opportunities exist in the MARB. Target 6.5 promotes the integration of water management; in the MARB, states cooperate but do not integrate management as well as they might, leading to somewhat uncoordinated efforts. Targets 6.3 and 6.1 focus on improving water quality and access to safe drinking water. Nutrient pollution in the MARB is moderately likely to happen to the level that it would affect drinking water and surface water safety, making these moderate-relevance targets.
SDG 8 (“Decent Work and Economic Growth”): Target 8.4 emphasizes decoupling economic growth from environmental degradation, which could help reduce hypoxia by limiting harmful agricultural practices.
SDG 11 (“Sustainable Cities and Communities”): Target 11.4 focuses on protecting natural heritage. Preserving natural sites from groundbreaking activities can help reduce N/P pollution and its impact on hypoxia. Targets 11.5 and 11.b address the resilience to disaster events. Disasters such as flooding can introduce many contaminants to surface water, and, thus, affect hypoxia. Such events happen moderately often in the MARB. Target 11a addresses the regional development planning and coordination between urban and rural areas, which can also help reduce the impacts on hypoxia.
SDG 12 (“Responsible Consumption and Production”): Targets 12.2, 12.3, and 12.8 have been identified as having a high relevance: achieving the sustainable management of natural resources, reducing food waste, and ensuring that people have the relevant information and awareness for sustainable development. Sustainable management through education and actions can significantly impact hypoxia by reducing the nutrient runoff and pollution. Biodegrading food waste can produce leachate that would contaminate surface water, leading to hypoxia. Four moderate-relevance targets have also been identified in this SDG: Targets 12.1 (policy changes), 12.4 (hazardous waste management), 12.5 (recycling), and 12.7 (sustainable public procurement). See Supplementary Materials for more discussion on these targets.
SDG 14 (“Life Below Water”): Targets 14.1 and 14.5 focus on reducing marine pollution and conserving marine areas. Effective implementation can directly combat hypoxia in the GOM. Target 14.2 aims for the sustainable management of marine areas, which is also essential for reducing hypoxia. Target 14.a addresses the increased research towards enhancing the scientific knowledge in marine technology; such knowledge can then be used to inform policies and processes for improved sustainability and minimized hypoxia.
SDG 15 (“Life on Land”): Target 15.1 aims to conserve terrestrial ecosystems, a high-relevance target, increasing the forested area as a proportion of the total land area and creating more protected areas which can reduce the nutrient runoff into water bodies by minimizing agricultural and urban use of excess nutrients. Target 15.3 focuses on restoring degraded lands, which can help mitigate hypoxia by reducing runoff.

3.4. ACPs and GOM Hypoxia

In the developed framework, ACPs are considered as responses in the DPSIR sense. ACPs are the land management actions or interventions that aim to protect soil and water resources against degradation [23]. In the MARB, these interventions are actions taken to reduce hypoxia in the GOM, and are used to work towards achieving many of the SDGs identified in the previous section. Generally, conservation practices for reducing nutrients are divided into three categories, avoiding, controlling, and trapping, with most ACPs focused on controlling and trapping nutrients [81]. Fertilizer management alone does not solve the problem of nutrient losses to drainage water or deep percolation that often occurs between the maturity and canopy development of the corn and soybean crops [44]. Field studies, opinion survey instruments, and computer models are developed and used to evaluate ACP effects to reduce hypoxia in the GOM [82]. The use of effective agricultural conservation practices can reduce N and P loss from fields. In the MARB, twelve states have each developed nutrient loss reduction strategies based on science-based assessments of watershed-scale outcomes [83].
In this section, we explore linkages using the response component of DPSIR, nexus thinking, and goal-oriented thinking. The four categories of ACPs outlined in Section 2.2 are discussed below.

3.4.1. Conservation Cropping Systems

Cover cropping (response in DPSIR) is among some of the most recognizable ‘nature-based solution’ practices that enhance the provisioning of various ecosystem services in agro-ecosystems [25]. Cover crops (legume and non-legume) generally do not produce a marketable product, but ecosystem services of cover crops include increasing the organic matter content, providing a residue cover, preventing or reducing soil erosion, cycling nutrients, reducing NO3-N leaching, suppressing weeds, and adding diversity to crop sequences [84]. Establishing winter cover crops during the fallow was found to improve soil N fertility and protect surface and/or ground water quality [85]. The other services of cover crops include their ability to improve nutrient retention, increase arbuscular mycorrhizal fungi inoculation, and reduce the incidence of certain soil pathogens and early-season weeds (particularly those that require light for germination), and the N fixation potential (of legume cover crops) that can reduce fertilizer needs [25]. Using our goal-oriented thinking and nexus thinking, a low fertilizer application means a lower energy usage. By lowering the energy use, agriculture can reduce the nutrient runoff and pollutant emissions produced through machinery and fuel consumption. In addition, a lower energy can promote alternative and low-impact farming practices such as drip irrigation to reduce runoff or cover cropping to improve nutrient uptake by crops. These methods can contribute to lower nutrient loads entering waterways, thus reducing the potential for hypoxia [86]. On the other hand, the energy usage could also be increased with cover crops, as the farmer needs to make extra passes over the field to plant the cover crops and to kill them off in preparation for the next crop.
Most of the NO3-N losses (impact in DPSIR) from cropland occur when the land is left fallow; for corn and soybean crops, this would be during the fall, winter, and spring when the crops are not taking up water and nutrients [44]. In an annual cropping system, such as corn and soybeans, the soil is left bare without living plants for about half of the year [87]. Replacing the fallow period between two cash crops with cover crops is one of the techniques that is advocated for reducing NO3-N leaching in both dry and humid regions [88].
The cover crop’s effectiveness depends on several response characteristics. The type of cover crop (legume and non-legume), species, and time of incorporation or termination of cover crops are factors that influence the N lost from the cropping system [89]. Overwintering grasses tend to be the most beneficial for reducing nutrient losses from agricultural landscapes [42]. Cover crops can also be effective in reducing the loss of P, particularly when applied to erosion-prone areas [42]. The time of termination of the cover crop plays an important role in avoiding competition with the main crop for water and nutrients [88,90]. While cover crops have the potential to decrease NO3-N inputs (reduce the impact) to streams and ditches, this practice remains untested at the watershed scale in intensively managed systems [67]. Thus, it is unclear if the field-scale effects of cover crops will translate to the watershed-scale reductions in N losses.
Despite the advantages, only 3.9% of all USA cropland is under cover crops and the low adoption has been attributed to the perception that these practices have a negligible or even a negative impact on crop yields [91]. Alonso-Ayuso, Quemada, Vanclooster, Ruiz-Ramos, Rodriguez, and Gabriel [88] observed that, in arid and semiarid regions, cover crops are not very popular because the cover crop is suspected of competing for water and nutrients with the cash crop. Cover crop management is crucial in order to avoid such competition. Incentivizing the adoption of this conservation practice is suggested, to counteract the perceived drawbacks to adoption. Plastina et al. [92] suggest that cost-share programs are likely to be very important for incentivizing farmers inexperienced with cover crops. Based on their study in the middle and lower sections of the main stem Mississippi River, Cameron-Harp et al. [93] suggest a greater cost-efficiency can be expected in programs that aim to reduce net greenhouse gas emissions by incentivizing cover cropping.
About 36.6% of total farmland (44.1 million ha) in the U.S. practice conservation tillage such as no-till, ridge-till, or mulch-till (response in DPSIR) [40]. No-till with residue has been shown to be highly cost-effective for N loss reduction (impact in DPSIR) (nearly $10 net benefit per kg N reduced); total P cost-effectiveness can also be a net benefit to the producer, although no-till with residue exhibited a negative performance for dissolved P (i.e., no-till increased P loss, particularly if P fertilizer is broadcast on the soil surface) [94]. Several incentives (e.g., tied to commodity prices, and yield penalties) have been provided to increase conservation practice adoption [95]. Based on their study in the upper Mississippi and lower Missouri sub-basins in the MARB, Cameron-Harp, Hendricks, and Potter [93] suggest reduced tillage programs can be cost-effective when high adoption rates are combined with large reductions in net emissions and the spatial targeting of voluntary agricultural conservation programs. In another study in two agricultural watersheds in central Illinois, a survey of landowners and producers on the use of conservation tillage (strip-till/no-till) for corn and soybean production during 2000 and 2003 revealed that the changes in the adoption of conservation tillage would be negligible for corn production and that no-till farming was more acceptable for soybean production, with ~50% of farmers surveyed using conservation tillage [96]. The Inflation Reduction Act has appropriated $8.45 billion for the USDA Environmental Quality Incentives Program to incentivize adopting conservation agriculture practices [93].
Extended crop rotations (response in DPSIR) have been shown in several studies to be more effective than more conventional systems at preventing NO3-N losses [41]. The driving factor for this ACP is the use of legumes in the rotation, which allows biological N2 fixation to provide a significant portion of the N nutrient needs of the crops, minimizing environmental pollution [82]. Even the simple and widely practiced corn–soybean rotation is very effective at reducing the losses of NO3-N in drainage water as compared to continuous corn, showing an annualized net revenue of $5 kg−1N [41].
Nutrient management (fertilizer management; a response in DPSIR) is a key part of the conservation cropping system, when considering downstream water quality and hypoxia. Nutrient management plans generally follow the guidance from land grant universities, which focus on the economics of the cropping system (crop nutrient requirements and cost of those nutrients) [97] rather than on nutrient loss reduction. However, the economics are directly related to nutrient loss reduction, since the process involves applying less fertilizer without sacrificing too much crop yield. Studies on the effectiveness of nutrient management for N demonstrated a “sweet spot” for corn (in a corn–soybean rotation) in which the revenue from corn yields exceeded the cost of a moderate fertilization rate [98]. The improved timing and rates of N application based on weather conditions and crop demand can reduce NO3-N loss to tile drainage, but the variation is high with different climate and soil conditions [99]. Studies have shown that the subsurface placement of P essentially renders nutrient losses the same as those for an unfertilized plot [97]. It is evident that revenue increases can be expected when implementing nutrient management for P, but the predominance of plot-scale rather than field-scale data in the literature precluded a more specific analysis [97]. Using our goal-oriented thinking and nexus thinking, a reduction in energy consumption may be expected due to the improved nutrient management, both by reducing the number of land application passes for applying nutrients, and by reducing the overall production of fertilizers by reducing the demand. This reduction in energy consumption is indirectly linked to the reduced hypoxia when considering bioenergy, which (as mentioned above) can contribute nutrients from the agriculture sector and also wastewater at various points in the supply chain.

3.4.2. Conservation Drainage Systems

The ACPs included in conservation drainage systems represent responses in DPSIR to the drainage-related impacts and linkages described above. Controlled drainage has been identified as a potentially beneficial management method in humid areas to reduce NO3-N loading to surface water [82]. While the amounts of P and organic N tend to be greater in surface runoff than in subsurface drainage, NO3-N has been found to be greater in subsurface drainage [100]. Controlled drainage may be implemented both on subsurface drainage and surface drainage systems, generally by installing weir structures to manage the elevation at which drainage water can leave the agricultural field via pipe or ditch [45]. This type of system offers the agricultural producer the opportunity to decide when or when not to drain the crop field. Retaining drainage water in the field reduces the loss of nutrients by reducing the outflow. Controlled drainage may reduce total outflow by approximately 30% when managed all year during an average year compared with uncontrolled (conventional) systems [99,101]. Because structures are typically needed for every 30 to 60 cm change in elevation, controlled drainage is suitable for sites where the topography is relatively flat [45]. On the other hand, to accomplish controlled drainage, the farmer must travel out to each of the control structures multiple times per year, using fuel, unless high-priced automated systems are used. This indirectly can offset the energy savings the ACP offers.
The reduction in NO3-N load when implementing controlled drainage varies widely (46% mean but ranging from −13% to 100%); reduction depends largely on changes in discharge volume, which is affected by climate, field management practices, soil characteristics, and differences in the outlet elevation within the control structure [45]. Another mechanism for the reduction in nitrogen loss is achieved by the complex mechanism of mineralization and denitrification, the latter promoted by the presence of a shallow water table that produces anaerobic conditions and the faster development of denitrifying micro-organisms in the presence of high organic matter [102]. In some cases, controlled drainage can potentially result in unsuitable conditions such as the poor trafficability, yield reduction, and biological clogging of subsurface drains [102]. However, this ACP also has the potential to provide a net benefit to the producer (up to $3 per kg N reduced) when the increases in crop yields are enough to outweigh the associated costs [45].
For sites with a more sloping topography, the denitrifying bioreactor presents an alternative to accomplishing conservation drainage. Typically located at the edge of a crop field [103], the bioreactor chamber receives water from a drainage system and passes it through carbonaceous media (typically wood chips) using a system of water control structures. Denitrifying bacteria fueled by carbon convert NO3-N in the drainage water to dinitrogen gas [46]. Although wood chips are commonly used, their availability is limited in some areas, and costs are increasing [104]. In addition, N removal rates when using wood chips decrease significantly with colder temperatures, reducing the effectiveness of the bioreactor. Alternative media for the carbon source have been studied, including corn cobs, corn stalks, wheat straw, green waste, and barley straw; corn cobs are showing promise as a locally available substrate in the cropland areas with a high prevalence of subsurface drainage, and with greater N removal rates [104]. Although the main purpose of the denitrifying bioreactor is to address nitrates, the ACP can also be effective in removing dissolved P [105].
Most denitrifying bioreactors in the U.S. are designed to treat drainage from 10–50 ha (25–124 acres); larger areas would require larger bioreactors, risking stagnant zones within the treatment chamber that can experience unwanted sulfate reduction and mercury methylation [103]. Reductions in NO3-N load for the denitrifying bioreactor range from 9–99%, with a mean of 40% [46].
The saturated buffer ACP offers an alternative that is like the denitrifying bioreactor in concept, but simpler in structure. A water control structure diverts subsurface drainage water into a subsurface distribution pipe placed parallel to a receiving stream; the organic-rich soil forms the media for the denitrifying bacteria to work [47]. This configuration serves to reconnect the drained water to the riparian buffer hydrology [71]. Both the saturated buffer and the denitrifying bioreactor are designed to treat a percentage of the average annual subsurface drain flow, allowing the excess flow above the design capacity to bypass treatment [106]. While the characteristics of flow through wood chips are relatively well-known, an analysis of the saturated buffer is much more complex, involving the physical characteristics of the in situ soil through which the water must pass, and dynamic factors such as the antecedent moisture condition of the soil, the flashiness of the drainage flow from the field, and the hydraulic gradient across the buffer [107]. Although the proportion of drainage flow treated is typically 5% or less, NO3-N removal from the flow that is treated by the saturated buffer can be expected to be greater than 90% [107]. Thus, the overall NO3-N load reduction achieved by the saturated buffer is very similar to that of the denitrifying bioreactor: 7–92%, with a mean of 46% [47].
Another conservation drainage concept is drainage water recycling (also known as tailwater recovery), which collects and stores drainage water in a reservoir, to be reapplied to the crop field during dry periods of the growing season [48]. Beneficial environmental effects (impacts due to the DPSIR response) such as the reduction in pesticide and salt losses, an increase in nonconventional water sources, and a wildlife increase have been observed when controlled drainage is combined with the reuse of outflows [102]. Drainage water recycling has the potential for improving the grain yield and benefiting the environment by reducing the tile flow and nitrogen loss [99]. This ACP can achieve reductions in the loads of N and P, and the sediment to downstream waters. Limited studies have reported a range of 43–68% for NO3-N and 21–39% for soluble reactive P [48].
Using nexus and goal thinking, there can be a reduction in energy consumption due to the reduced irrigation and pumping through improved water management. However, there can be an increase in energy consumption if the person who manages the control structures in a conservation drainage system uses a vehicle to access the structures in the field. Automated structures are becoming commercially available, which could limit the energy usage to that used in the water control structures. Energy usage is indirectly linked to reduced hypoxia when considering bioenergy.

3.4.3. Riparian Buffer Systems

Establishing riparian buffers (vegetation placed between an agricultural field and a water body, increasing infiltration and subsurface flow, trapping nutrients and sediment from surface runoff, and plant uptake of nutrients) represents an ACP (response in DPSIR) for maintaining water quality [108]. A meta-analysis of 74 studies revealed that filter strips with perennial grasses were able to reduce N and P, and sediment from surface flow, with means of 57%, 63%, and 78%, respectively [49]. These buffers are a proven practice for removing NO3-N from overland flow and shallow groundwater [71]. However, some negative efficiency values were found for buffer strips in reducing the dissolved reactive P [109].
The efficiency of the buffer system for N reduction is generally correlated with the width, and the sediment reduction is related to the ratio of the buffer area to the width [49]. Mayer, Reynolds Jr, McCutchen, and Canfield [108] suggested that the effect of the buffer width on N removal occurs only after the width exceeds a certain threshold, and that the overall nitrogen removal effectiveness is not affected by vegetation type. The vegetation is intended to absorb/remove nutrients, and contaminants can be a grass planting (grass filter strip), or trees and shrubs (riparian forest buffer). Barden et al. [110] explain that the ACP effectiveness is dependent on maintaining the sheet flow across the buffer, increasing the infiltration and subsurface flow.
The hydrogeomorphic characteristics of a site affect the ability of a riparian buffer to intercept and attenuate the nitrogen traveling along the surface or subsurface pathways. The study results suggest that the buffers are most effective along low-order streams (i.e., less than third order), where the riparian zones tend to contain more fine-textured sediment and a higher organic content, enhancing the denitrification and assimilation of nitrates [30]. The soil-saturated hydraulic conductivity is significantly related to both the N and P reduction [49]. Subsurface N removal is more efficient than removal through the surface flow [108]. Rainfall is important for this vegetative practice.
Riparian buffer systems have multiple positive impacts when tied to ecosystem services and ecosystem functions in the landscape that help restore the state of the system. They provide wildlife habitat and separation between agricultural activities and streams [111]. They improve water quality by removing sediment and floating debris, nutrients, and chemical pollutants from the upland surface runoff. They reduce both wind and water erosion. The increased moisture content of the soil contributes to fire suppression and a modified microclimate with cooler air and a higher humidity. They regulate the groundwater table. Riparian vegetation (especially tall and/or mature trees) provide visual (attractive water views) and auditory (increased bird songs, and the dampening of boat engine noise) aesthetic benefits. These socioecological functions benefit both ecosystems and people and are an inextricable part of MARB ecosystems. More details are discussed in County [112].

3.4.4. Wetland Systems

Wetlands (response in DPSIR) contribute to about 40% of the total value of ecosystem services (e.g., food supply, biodiversity conservation, flood regulation, and nitrate removal) [113]. The coastal wetlands are highly productive, support many plant/animal species, and provide key ecosystem services for human populations (e.g., suppression and shelter against storms and tsunamis, and food provision), and the losses are concerning [10]. The land loss crisis in Louisiana (25% of land converted to open water since 1932) leads to the Coastal Wetlands Planning, Protection, and Restoration Act where the USA funds the restoration and protection of the nation’s valuable wetland natural resource [114].
Several studies have brought out the advantage of both natural and constructed wetlands as an effective ACP. For example, a review of 200 studies across wetland basins found the nitrate and phosphate removal rate to be 53% and 68%, respectively [16]. Another study estimates that about 10 million additional ha of wetland and riparian areas throughout the MARB could eliminate hypoxia in the GOM by removing NO3-N from the river, primarily through denitrification [56]. This may not be feasible. Another modeling study estimates that a 22% increase in wetland area could decrease N loading by 54% in the GOM [56].
The processes of nutrient transformation and fate in constructed wetlands designed to treat nutrient-laden water can be complex. N cycling involves nitrification, denitrification, plant uptake, microbial assimilation, mineralization, and more [52]. Unlike N, P is cycled in the wetland via plant uptake, microbial assimilation, and sedimentation, and can be released and regenerated back into the water [52]. In agricultural landscapes, constructed wetlands are used to improve the quality of water delivered from cropland, livestock systems, greenhouses, aquaculture, and hydroponic systems; in the MARB, studies have focused primarily on cropland (both surface runoff and subsurface drainage) and livestock systems [52]. The constructed wetland is very effective in reducing nutrient losses, but at a significant expense. This ACP had, by far, the highest annual cost among nine ACPs in a comparative review, with means of $16 kg−1N and $810 kg−1P, respectively [106].

3.4.5. Combinations of ACPs

ACPs are critical for reducing nutrient runoff, a significant contributor to hypoxia in the GOM. By implementing combinations of ACPs such as conservation cropping systems, drainage management, and riparian buffer zones, farmers can effectively reduce nitrogen (N) and phosphorus (P) losses from agricultural fields into waterways. For instance, cover crops prevent NO3-N leaching during fallow periods, while conservation tillage retains soil nutrients, reducing the nutrient runoff. Controlled drainage systems further limit the outflow of nutrient-laden water by managing subsurface drainage. Riparian buffer zones, placed between crop fields and water bodies, filter out excess nutrients from the surface runoff, reducing the total nutrient load reaching rivers and, ultimately, the GOM. A growing consensus suggests a variety of ACPs should be used to abate nutrient loading since no single practice is sufficient to meet the water-quality goals [33,115]. Controlled drainage–sub-irrigation and conservation tillage practices, in combination with other treatments such as intercropping, may have the potential to decrease the runoff losses of NO3-N (Drury et al., 1996 [100]). Filter strips pair well with conservation tillage; yet, the cost per unit of sediment loss reduced by the filter strip is significantly higher with no-till in the upslope field than with conventional tillage (Douglas-Mankin et al., 2021 [49]). Where there is less sediment to be trapped, the same filter strip will be less cost-effective. There are many possible combinations of ACPs that could fulfill this recommendation; yet, not all potential combinations would necessarily create the desired synergies [106].
The Conservation Effects Assessment Project for Cropland in the Upper Mississippi River Basin [68] recommends suites of practices that, together, achieve full environmental benefits: avoiding or limiting the potential for losses from the crop field, controlling overland flow, and trapping materials leaving the field. When integrated at the river basin level, these ACPs create synergistic effects that go beyond field-scale nutrient reductions. Conservation drainage techniques like bioreactors and drainage water recycling combined with riparian buffers and improved nutrient management collectively help mitigate nutrient transport. These practices reduce nutrient concentrations before they reach major waterways, slowing down the process that leads to oxygen depletion in the GOM. By targeting multiple pathways of nutrient loss—such as surface runoff, subsurface drainage, and leaching—ACP combinations work to significantly curb the hypoxic conditions that endanger marine ecosystems and fisheries in the GOM.

3.5. Causal Loops

Approximately 30% of hypoxic systems documented since 1980 have unidentified or poorly understood causal mechanisms [116]. Causal loops illustrate the complex feedback interactions among environmental, human, and ecological drivers that intensify low-oxygen conditions. Below are several basic qualitative causal loops illustrating hypoxia in the GOM:
(1)
Nutrient Loading → Eutrophication → Hypoxia (Positive Feedback Loop). Excess nutrient loading from runoff fuels algal blooms, which decompose, consuming oxygen and creating hypoxia. This worsens eutrophication, perpetuating the cycle.
(2)
Extreme Events → Increased Storm Runoff → Nutrient Flux → Hypoxia (Positive Feedback Loop). Climate change intensifies storms and runoff, increasing the nutrient flux into the Gulf, which fuels eutrophication and harmful algal blooms, amplifying and prolonging hypoxic conditions.
(3)
Hypoxia → Loss of Marine Life → Altered Ecosystem Functions (Negative Feedback Loop). Hypoxia causes marine life loss, disrupting ecosystems and reducing biodiversity. This alters nutrient cycling, weakening ecosystem resilience and reinforcing persistent hypoxic conditions through negative feedback.
(4)
Nutrient Loading → Reduced Oxygen Solubility → More Stratification → Hypoxia (Positive Feedback). Nutrient loading and warmer temperatures reduce oxygen solubility, increasing stratification and trapping low-oxygen water, which intensifies hypoxia, creating a persistent positive feedback loop.
(5)
Human Adaptation and Policy Interventions → Reduced Nutrient Runoff → Restoration of Ecosystem Services (Positive Feedback Loop). Effective policy interventions reduce the nutrient runoff, slowing eutrophication, restoring ecosystem services, and enhancing resilience, creating a positive feedback loop that improves ecosystem health and socioeconomic outcomes.
These loops underscore the interconnected nature of hypoxia in the Gulf. Addressing the issue requires integrated policy interventions, improved management practices, and a deeper understanding of these interrelated systems.
While qualitative links between drivers and hypoxic outcomes are well-established, quantitative attribution—especially involving socioeconomic drivers—remains difficult due to the complex, non-linear nature of ecosystem interactions [60]. Climate change compounds this complexity by accelerating environmental change. Persistent knowledge gaps limit our mechanistic understanding of the human–coastal ocean interface, constraining science-based policymaking. One clear manifestation of these pressures is coastal hypoxia, which has expanded markedly—from about 20 documented sites before 1950 to over 400 by the early 2000s—primarily due to the increased discharges of nutrients and organic matter from human activities [116].

3.6. Hypoxia, Socioecological Contexts, and the Role of Data Disparities

The developed framework may be adapted to over 500 coastal hypoxic zones worldwide, using processes similar to what has been performed for the GOM in this study. The FEW nexus and DPSIR components must be researched for the specific study zone, and the relative importance of each SDG target must be assessed based on the collective knowledge of that zone. The dynamics of coastal hypoxia vary significantly across socioecological contexts, with notable differences between developed and developing countries [60]. Between 1980 and 2000, hypoxia and coastal eutrophication became increasingly severe in many developing and economically emerging nations, driven by rapid urbanization, population growth, and insufficient infrastructure [116]. In such regions, untreated sewage, industrial waste, and unregulated agricultural practices are the predominant causes, and hypoxic zones often persist or worsen due to the limited monitoring and institutional capacity. In contrast, hypoxia in developed countries, such as the United States and parts of Europe, is typically seasonal and results from well-documented sources like agricultural runoff and urban wastewater. These regions benefit from robust data systems, stronger governance, and effective interventions, including ACPs, nutrient reduction strategies, and substantial investments in wastewater treatment.
These disparities are further illustrated by differing national capacities to interpret and implement global environmental targets [117]. For example, while rapidly developing regions such as Asia may experience the fastest improvements in energy intensity due to a high capital turnover, developed nations often advance through cleaner energy technologies. These differences underscore the importance of interpreting global sustainability goals within national contexts and ensuring adaptive governance that accommodates varying capacities, vulnerabilities, and ecological conditions [117].
The critical role of data availability becomes especially apparent in disaster response and impact evaluation. The aftermath of Hurricane Sandy in 2012 exemplifies a “data-rich” scenario, where publicly available health outcome data enabled evidence-based assessments of human health impacts, hospital admissions, and emergency response [118]. Conversely, research on Hurricane Ian in Florida highlights the challenges of “data-poor” conditions. Despite the use of advanced econometric techniques—such as difference-in-differences and synthetic control methods—data limitations, particularly, coarse geographic detail, for privacy reasons, hindered the accurate measurement of housing price impacts [119]. These methodological constraints make the findings more presumptive and highlight the urgent need for improved data systems.
The contrast between data-rich and data-poor regions not only affects the research quality but also influences the equity of the disaster response. The underestimation of the impacts in data-poor contexts can lead to the inadequate delivery of essential goods and services, compounding social and ecological vulnerabilities. In data-rich regions, detailed monitoring and modeling enable the precise identification of hypoxia drivers, more complex quantitative causal loops, and targeted interventions. However, in data-poor areas, the limited access to consistent, high-resolution data demands adaptive strategies that leverage the available information, local knowledge, and participatory approaches with more qualitative causal loops. Tailoring the framework to these contexts involves balancing scientific rigor with practical feasibility, ensuring that the solutions are equitable, context-sensitive, and informed by the best available evidence.
Therefore, improving data collection and transparency—particularly in developing nations—is essential in order to better understand, manage, and mitigate the effects of hypoxia, climate change, and extreme events in a globally coordinated, yet locally responsive, manner.

4. Summary and Conclusions

Policymakers and researchers addressing sustainability issues are faced with a challenge: producing more food and energy for a growing global population while decreasing nutrient water pollution. Frameworks are often developed and used to structure their work and increase understanding. The size of human-caused coastal hypoxic zones is one potential indicator of sustainability.
This study focused on the need to develop a framework that combines SDGs and their targets, the FEW nexus, and ACPs to hypoxia in oceans. A novel theoretical base for the framework was developed by integrating the DPSIR framework and multiple thinking approaches (nexus, systems, and goal-oriented) to represent hypoxia. Four categories of ACPs with potential positive effects on hypoxia were identified: conservation cropping systems, conservation drainage systems, riparian buffer systems, and wetland systems. The theoretical base was then applied as a conceptual framework using evidence and knowledge from the published literature as well as from experts about the recurring hypoxia in oceans (collective knowledge) to explore linkages of ACPs, the FEW nexus (nexus thinking), and SDGs (goal-oriented thinking).
Recurring hypoxia in the GOM was chosen in this study to demonstrate the framework because it is one of the largest human-caused coastal hypoxic zones worldwide, and is widely studied. Furthermore, Gulf hypoxia reflects significant physical, ecological, economic, and social changes throughout the Mississippi River Basin. This broad reach complicates efforts to establish sociological and emotional connections with communities far from the Gulf, and the developed framework aims to bridge that gap.
The process illustrated in this study for developing the theoretical framework to represent hypoxia in the GOM can be applied to some 500 coastal hypoxic zones and ~245,000 km2 of coastal oceans in the world. Because each hypoxic zone is associated with different geographical and socioecological conditions, and because the data availability varies significantly, each assessment must be tailored.
Selected future research directions and next steps include the following:
  • Developing quantitative performance measures for ACPs, which may be among the most important challenges currently confronting the conservation science community [120];
  • Expanding the literature review conducted for this study to ensure all relevant information has been incorporated into the framework;
  • Developing a complete set of qualitative causal loops;
  • Adding quantitative assessments to the conceptual framework using models and quantitative causal loops;
  • Constructing a unique stock and flow diagram and a system dynamics model.
Building on past lessons, we advocate for a more effective system for dealing with coastal eutrophication and the development of advanced regional Earth system models that incorporate human dimensions. Such tools are essential for designing and evaluating targeted, impactful policy, and restoration strategies.

Supplementary Materials

The following supporting information can be downloaded at: https://www.mdpi.com/article/10.3390/land14061169/s1.

Author Contributions

A.A.: conceptualization, visualization, methodology, resources, project administration, funding acquisition, and writing—original draft preparation. A.A. and R.B.: data curation, and writing—review and editing. G.O.: partial funding, and writing—review and editing. All authors have read and agreed to the published version of the manuscript.

Funding

This research is funded by the National Institute of Food and Agriculture of the United States Department of Agriculture (USDA-NIFA) to Florida A&M University through Non-Assistance Cooperative Agreement grant no. 58-6066-1-044. It is also based upon work partially supported by the USDANIFA capacity building grant 2017-38821-26405 and 2022-38821-37522; USDA-NIFA Evans-Allen Project, Grant 11979180/2016-01711; USDA NIFA Centers Of Excellence Award 2022-38427-37379; and National Science Foundation under Grant No. 1735235 awarded as part of the National Science Foundation Research Traineeship.

Data Availability Statement

The data supporting the framework development can be found online.

Acknowledgments

The authors would like to acknowledge Ojo I, Brickler C, Wu Y, Muhammed K, Deepa R, Afroz M, and Sharma A for the initial literature review on the Best Management Practices for SWS 5621: Principles of Applied Watershed Hydrology class project in Spring 2019. The authors would like to thank the two anonymous reviewers for their valuable and constructive feedback on an earlier draft of this paper.

Conflicts of Interest

The authors declare that they have no known competing financial interests or personal relationships that could have appeared to influence the work reported in this paper.

Abbreviations

The following abbreviations are used in this manuscript:
ACPAgricultural Conservation Practice
BMPBest Management Practice
DPSIRDriver–Pressure–State–Impact–Response
FEWFood–Energy–Water
GOMGulf of Mexico
MARBMississippi and Atchafalaya River Basin
NRCSNatural Resources Conservation Service
SDGSustainable Development Goal
UMARBUpper Mississippi River Basin
USAUnited States of America
USEPAU.S. Environmental Protection Agency

References

  1. Anandhi, A.; Srivastava, P.; Mohtar, R.H.; Lawford, R.G.; Sen, S.; Lamba, J. Methodologies and Principles for Developing Nexus Definitions and Conceptualizations: Lessons From FEW Nexus Studies. J. ASABE 2023, 66, 205–230. [Google Scholar] [CrossRef]
  2. Visbeck, M.; Kronfeld-Goharani, U.; Neumann, B.; Rickels, W.; Schmidt, J.; Van Doorn, E.; Matz-Lück, N.; Ott, K.; Quaas, M.F. Securing blue wealth: The need for a special sustainable development goal for the ocean and coasts. Mar. Policy 2014, 48, 184–191. [Google Scholar] [CrossRef]
  3. Chauhan, J.; Reshi, M.; Bandral, J.D.; Gupta, N.; Sharma, N.; Sambyal, B.; Singh, M.P.; Jankawat, G.S.; Sharma, B. From ocean to plate: Embracing algae as a healthy and sustainable food source: A review. Plant Arch. 2024, 24, 856–860. [Google Scholar] [CrossRef]
  4. Ohlund, R.J.; Dahdah, B.H.; Guillen, G.R.; Childress, A.E. Augmenting ocean water desalination with potable reuse: Concept feasibility in terms of cost and environmental impacts. Desalination 2024, 569, 116941. [Google Scholar] [CrossRef]
  5. Shadmani, A.; Nikoo, M.R.; Gandomi, A.H. Adaptive systematic optimization of a multi-axis ocean wave energy converter. Renew. Sustain. Energy Rev. 2024, 189, 113920. [Google Scholar] [CrossRef]
  6. Ferreira, J.C.; Vasconcelos, L.; Monteiro, R.; Silva, F.Z.; Duarte, C.M.; Ferreira, F. Ocean Literacy to Promote Sustainable Development Goals and Agenda 2030 in Coastal Communities. Educ. Sci. 2021, 11, 62. [Google Scholar] [CrossRef]
  7. Li, Y.; Robinson, S.V.; Nguyen, L.H.; Liu, J. Satellite prediction of coastal hypoxia in the northern Gulf of Mexico. Remote Sens. Environ. 2023, 284, 113346. [Google Scholar] [CrossRef]
  8. Alderdice, R.; Hume, B.C.C.; Kuhl, M.; Pernice, M.; Suggett, D.J.; Voolstra, C.R. Disparate Inventories of Hypoxia Gene Sets Across Corals Align With Inferred Environmental Resilience. Front. Mar. Sci. 2022, 9, 834332. [Google Scholar] [CrossRef]
  9. Rabalais, N.N.; Turner, R.E. Gulf of Mexico hypoxia: Past, present, and future. Limnol. Oceanogr. Bull. 2019, 28, 117–124. [Google Scholar] [CrossRef]
  10. Keppeler, F.W.; Engel, A.S.; Hooper-Bùi, L.M.; López-Duarte, P.C.; Martin, C.W.; Olin, J.A.; Lamb, K.J.; Polito, M.J.; Rabalais, N.N.; Roberts, B.J. Coastal wetland restoration through the lens of Odum’s theory of ecosystem development. Restor. Ecol. 2024, 32, e14072. [Google Scholar] [CrossRef]
  11. Costello, C.; Griffin, W.M.; Landis, A.E.; Matthews, H.S. Impact of biofuel crop production on the formation of hypoxia in the Gulf of Mexico. Environ. Sci. Technol. 2009, 43, 7985–7991. [Google Scholar] [CrossRef]
  12. Alcamo, J. Water quality and its interlinkages with the Sustainable Development Goals. Curr. Opin. Environ. Sustain. 2019, 36, 126–140. [Google Scholar] [CrossRef]
  13. USEPA. Mississippi River/Gulf of Mexico Watershed Nutrient Task Force 2023 Report to Congress. 2023. Available online: https://www.epa.gov/system/files/documents/2023-11/10305_2023-htf-report-to-congress_508.pdf (accessed on 16 May 2024).
  14. Zuidema, S.; Liu, J.; Chepeliev, M.G.; Johnson, D.R.; Baldos, U.L.C.; Frolking, S.; Kucharik, C.J.; Wollheim, W.M.; Hertel, T.W. US climate policy yields water quality cobenefits in the Mississippi Basin and Gulf of Mexico. Proc. Natl. Acad. Sci. USA 2023, 120, e2302087120. [Google Scholar] [CrossRef] [PubMed]
  15. Rabotyagov, S.; Campbell, T.; Jha, M.; Gassman, P.W.; Arnold, J.; Kurkalova, L.; Secchi, S.; Feng, H.; Kling, C.L. Least-cost control of agricultural nutrient contributions to the Gulf of Mexico hypoxic zone. Ecol. Appl. 2010, 20, 1542–1555. [Google Scholar] [CrossRef]
  16. Ross, C.D.; McKenna, O.P. The Potential of Prairie Pothole Wetlands as an Agricultural Conservation Practice: A Synthesis of Empirical Data. Wetlands 2023, 43, 5. [Google Scholar] [CrossRef]
  17. Lewison, R.L.; Rudd, M.A.; Al-Hayek, W.; Baldwin, C.; Beger, M.; Lieske, S.N.; Jones, C.; Satumanatpan, S.; Junchompoo, C.; Hines, E. How the DPSIR framework can be used for structuring problems and facilitating empirical research in coastal systems. Environ. Sci. Policy 2016, 56, 110–119. [Google Scholar] [CrossRef]
  18. United Nations (UN). Transforming Our World: The 2030 Agenda for Sustainable Development. Resolution 70/1 Adopted by the General Assembly on 25 September 2015. Available online: https://sdgs.un.org/2030agenda (accessed on 6 December 2024).
  19. Pagan, J.; Pryor, M.; Deepa, R.; Grace III, J.; Mbuya, O.; Taylor, R.; Dickson, J.O.; Ibeanusi, V.; Chauhan, A.; Chen, G. Sustainable Development Tool Using Meta-Analysis and DPSIR Framework—Application to Savannah River Basin, US. JAWRA J. Am. Water Resour. Assoc. 2020, 56, 1059–1082. [Google Scholar] [CrossRef]
  20. Sharma, A.; Deepa, R.; Sankar, S.; Pryor, M.; Stewart, B.; Johnson, E.; Anandhi, A. Use of growing degree indicator for developing adaptive responses: A case study of cotton in Florida. Ecol. Indic. 2021, 124, 107383. [Google Scholar] [CrossRef]
  21. Sharma, A.; Anandhi, A. Temperature based indicators to develop adaptive responses for crop production in Florida, USA. Ecol. Indic. 2021, 121, 107064. [Google Scholar] [CrossRef]
  22. Claudet, J. The seven domains of action for a sustainable ocean. Cell 2021, 184, 1426–1429. [Google Scholar] [CrossRef]
  23. Lemke, A.; Kirkham, K.; Lindenbaum, T.; Herbert, M.; Tear, T.; Perry, W.; Herkert, J. Evaluating agricultural best management practices in tile-drained subwatersheds of the Mackinaw River, Illinois. J. Environ. Qual. 2011, 40, 1215–1228. [Google Scholar] [CrossRef] [PubMed]
  24. Li, L.; Malone, R.; Ma, L.; Kaspar, T.; Jaynes, D.; Saseendran, S.; Thorp, K.; Yu, Q.; Ahuja, L. Winter cover crop effects on nitrate leaching in subsurface drainage as simulated by RZWQM-DSSAT. Trans. ASABE 2008, 51, 1575–1583. [Google Scholar] [CrossRef]
  25. Daryanto, S.; Fu, B.; Wang, L.; Jacinthe, P.-A.; Zhao, W. Quantitative synthesis on the ecosystem services of cover crops. Earth-Sci. Rev. 2018, 185, 357–373. [Google Scholar] [CrossRef]
  26. Liu, E.S.; Das, L.; Zhao, B.Y.; Crocker, M.; Shi, J. Impact of Dilute Sulfuric Acid, Ammonium Hydroxide, and Ionic Liquid Pretreatments on the Fractionation and Characterization of Engineered Switchgrass. BioEnergy Res. 2017, 10, 1079–1093. [Google Scholar] [CrossRef]
  27. Yuan, Y.; Book, R.S.; Mankin, K.R.; Koropeckyj-Cox, L.; Christianson, L.; Messer, T.; Christianson, R. An overview of the effectiveness of agricultural conservation practices for water quality improvement. J. ASABE 2022, 65, 419–426. [Google Scholar] [CrossRef] [PubMed]
  28. Eldridge, E.E.; Schoonover, J.E.; Williard, K.W.; Sadeghpour, A.; Gillespie, J.C. Saturated Buffers: Improvements and Issues; Wiley Online Library: Hoboken, NJ, USA, 2024; Volume 53, pp. 232–240. [Google Scholar]
  29. Sturesson, A.; Weitz, N.; Persson, Å. SDG 14: Life Below Water, A Review of Research Needs. Technical Annex to the Formas Report Forskning för Agenda 2030: Översikt av Forskningsbehov och Vägar Framåt; Stockholm Environment Institute: Stockholm, Sweden, 2018; Available online: https://www.sei.org/wp-content/uploads/2018/11/sdg-14-life-below-water-a-review-of-research-needs-1.pdf (accessed on 2 May 2025).
  30. McLellan, E.; Robertson, D.; Schilling, K.; Tomer, M.; Kostel, J.; Smith, D.; King, K. Reducing nitrogen export from the Corn Belt to the Gulf of Mexico: Agricultural strategies for remediating hypoxia. JAWRA J. Am. Water Resour. Assoc. 2015, 51, 263–289. [Google Scholar] [CrossRef]
  31. Rabotyagov, S.S.; Campbell, T.D.; White, M.; Arnold, J.G.; Atwood, J.; Norfleet, M.L.; Kling, C.L.; Gassman, P.W.; Valcu, A.; Richardson, J. Cost-effective targeting of conservation investments to reduce the northern Gulf of Mexico hypoxic zone. Proc. Natl. Acad. Sci. USA 2014, 111, 18530–18535. [Google Scholar] [CrossRef]
  32. Anandhi, A. CISTA-A: Conceptual model using indicators selected by systems thinking for adaptation strategies in a changing climate: Case study in agro-ecosystems. Ecol. Model. 2017, 345, 41–55. [Google Scholar] [CrossRef]
  33. Nedd, R.; Light, K.; Owens, M.; James, N.; Johnson, E.; Anandhi, A. A synthesis of land use/land cover studies: Definitions, classification systems, meta-studies, challenges and knowledge gaps on a global landscape. Land 2021, 10, 994. [Google Scholar] [CrossRef]
  34. Marimon, Z.A.; Xuan, Z.; Chang, N.-B. System dynamics modeling with sensitivity analysis for floating treatment wetlands in a stormwater wet pond. Ecol. Model. 2013, 267, 66–79. [Google Scholar] [CrossRef]
  35. Anandhi, A.; Kannan, N. Vulnerability assessment of water resources–translating a theoretical concept to an operational framework using systems thinking approach in a changing climate: Case study in Ogallala Aquifer. J. Hydrol. 2018, 557, 460–474. [Google Scholar] [CrossRef]
  36. Bentley, C.; Anandhi, A. Representing driver-response complexity in ecosystems using an improved conceptual model. Ecol. Model. 2020, 437, 109320. [Google Scholar] [CrossRef]
  37. Avsec, S. Design Thinking to Envision More Sustainable Technology-Enhanced Teaching for Effective Knowledge Transfer. Sustainability 2023, 15, 1163. [Google Scholar] [CrossRef]
  38. USDA-NRCS. Title 450, Part 620. National Handbook of Conservation Practices. 2023. Available online: https://directives.nrcs.usda.gov//sites/default/files2/1712932259/Part%20620%20-%20Conservation%20Practices.pdf (accessed on 14 May 2024).
  39. Hatfield, J.; Allmaras, R.; Rehm, G.; Lowery, B. Ridge tillage for corn and soybean production: Environmental quality impacts. Soil Tillage Res. 1998, 48, 145–154. [Google Scholar] [CrossRef]
  40. Derpsch, R. Conservation tillage, no-tillage and related technologies. In Conservation Agriculture: Environment, Farmers Experiences, Innovations, Socio-Economy, Policy; Springer: Berlin/Heidelberg, Germany, 2003; pp. 181–190. [Google Scholar]
  41. Koropeckyj-Cox, L.; Christianson, R.D.; Yuan, Y. Effectiveness of conservation crop rotation for water pollutant reduction from agricultural areas. Trans. ASABE 2021, 64, 691–704. [Google Scholar] [CrossRef]
  42. Christianson, R.; Fox, J.; Law, N.; Wong, C. Effectiveness of cover crops for water pollutant reduction from agricultural areas. Trans. ASABE 2021, 64, 1007–1017. [Google Scholar] [CrossRef]
  43. Kaspar, T.; Singer, J. The Use of Cover Crops to Manage Soil; USDAARS/UNL Faculty: Lincoln, NE, USA, 2011; Available online: https://digitalcommons.unl.edu/usdaarsfacpub/1382 (accessed on 2 May 2025).
  44. Kaspar, T.; Jaynes, D.; Parkin, T.; Moorman, T. Rye cover crop and gamagrass strip effects on NO3 concentration and load in tile drainage. J. Environ. Qual. 2007, 36, 1503–1511. [Google Scholar] [CrossRef]
  45. Frankenberger, J.; McMillan, S.K.; Williams, M.; Mazer, K.; Ross, J.; Sohngen, B. Drainage water management: A review of nutrient load reductions and cost effectiveness. J. ASABE 2023, 67, 1077–1092. [Google Scholar] [CrossRef]
  46. Christianson, L.E.; Cooke, R.A.; Hay, C.H.; Helmers, M.J.; Feyereisen, G.W.; Ranaivoson, A.Z.; McMaine, J.T.; McDaniel, R.; Rosen, T.R.; Pluer, W.T. Effectiveness of denitrifying bioreactors on water pollutant reduction from agricultural areas. Trans. ASABE 2021, 64, 641–658. [Google Scholar] [CrossRef]
  47. Johnson, G.; Christianson, L.; Christianson, R.; Davis, M.; Díaz-García, C.; Groh, T.; Isenhart, T.; Kjaersgaard, J.; Malone, R.; Pease, L.A. Effectiveness of saturated buffers on water pollutant reduction from agricultural drainage. J. ASABE 2023, 1, 49–62. [Google Scholar] [CrossRef]
  48. Moursi, H.; Youssef, M.A.; Poole, C.A.; Castro-Bolinaga, C.F.; Chescheir, G.M.; Richardson, R.J. Drainage water recycling reduced nitrogen, phosphorus, and sediment losses from a drained agricultural field in eastern North Carolina, USA. Agric. Water Manag. 2023, 279, 108179. [Google Scholar] [CrossRef]
  49. Douglas-Mankin, K.R.; Helmers, M.J.; Harmel, R.D. Review of filter strip performance and function for improving water quality from agricultural lands. Trans. ASABE 2021, 64, 659–674. [Google Scholar] [CrossRef]
  50. Tiner, R.W. Wetland Indicators: A Guide to Wetland Formation, Identification, Delineation, Classification, and Mapping; CRC Press: Boca Raton, FL, USA, 2016. [Google Scholar]
  51. Jisha, K.; Puthur, J.T. Ecological importance of wetland systems. Wetl. Conserv. Curr. Chall. Future Strateg. 2021, 40–54. [Google Scholar] [CrossRef]
  52. Messer, T.L.; Trisha, L.; Nelson, N.; Ahiablame, L.; Bean, E.Z.; Boles, C.; Cook, S.L.; Hall, S.G.; McMaine, J.; Schlea, D. Constructed wetlands for water quality improvement: A synthesis on nutrient reduction from agricultural effluents. Trans. ASABE 2021, 64, 625–639. [Google Scholar] [CrossRef]
  53. Wang, J.R.; Liu, G.M.; Zhu, C. Evaluating precipitation products for hydrologic modeling over a large river basin in the Midwestern USA. Hydrol. Sci. J.-J. Sci. Hydrol. 2020, 65, 1221–1238. [Google Scholar] [CrossRef]
  54. Lu, Y.; Yuan, J.; Lu, X.; Su, C.; Zhang, Y.; Wang, C.; Cao, X.; Li, Q.; Su, J.; Ittekkot, V. Major threats of pollution and climate change to global coastal ecosystems and enhanced management for sustainability. Environ. Pollut. 2018, 239, 670–680. [Google Scholar] [CrossRef] [PubMed]
  55. Acosta, K.G.; Juhl, A.R.; Subramaniam, A.; Duhamel, S. Spatial and temporal variation in surface nitrate and phosphate in the Northern Gulf of Mexico over 35 years. Sci. Rep. 2024, 14, 7305. [Google Scholar] [CrossRef]
  56. Berkowitz, J.F.; Green, L.; VanZomeren, C.M.; White, J.R. Evaluating soil properties and potential nitrate removal in wetlands created using an Engineering With Nature based dredged material placement technique. Ecol. Eng. 2016, 97, 381–388. [Google Scholar] [CrossRef]
  57. Parajuli, P.; Jayakody, P.; Sassenrath, G.; Ouyang, Y. Assessing the impacts of climate change and tillage practices on stream flow, crop and sediment yields from the Mississippi River Basin. Agric. Water Manag. 2016, 168, 112–124. [Google Scholar] [CrossRef]
  58. Killgore, K.J.; Hoover, J.J.; Miranda, L.; Slack, W.; Johnson, D.R.; Douglas, N.H. Fish conservation in streams of the agrarian Mississippi Alluvial Valley: Conceptual model, management actions, and field verification. Front. Freshw. Sci. 2024, 2, 1365691. [Google Scholar] [CrossRef]
  59. Rabalais, N.N.; Turner, R.E.; Díaz, R.J.; Justić, D. Global change and eutrophication of coastal waters. ICES J. Mar. Sci. 2009, 66, 1528–1537. [Google Scholar] [CrossRef]
  60. Dai, M.; Zhao, Y.; Chai, F.; Chen, M.; Chen, N.; Chen, Y.; Cheng, D.; Gan, J.; Guan, D.; Hong, Y. Persistent eutrophication and hypoxia in the coastal ocean. Camb. Prism. Coast. Futures 2023, 1, e19. [Google Scholar] [CrossRef]
  61. Seymour, J.R.; McLellan, S.L. Climate change will amplify the impacts of harmful microorganisms in aquatic ecosystems. Nat. Microbiol. 2025, 10, 615–626. [Google Scholar] [CrossRef] [PubMed]
  62. Feng, G.; Jin, W.; Ouyang, Y.; Huang, Y. The role of changing land use and irrigation scheduling in groundwater depletion mitigation in a humid region. Agric. Water Manag. 2024, 291, 108606. [Google Scholar] [CrossRef]
  63. Tian, H.; Lu, C.; Pan, S.; Yang, J.; Miao, R.; Ren, W.; Yu, Q.; Fu, B.; Jin, F.-F.; Lu, Y. Optimizing resource use efficiencies in the food–energy–water nexus for sustainable agriculture: From conceptual model to decision support system. Curr. Opin. Environ. Sustain. 2018, 33, 104–113. [Google Scholar] [CrossRef]
  64. Weber, G. Agricultural Nutrient Pollution in the Mississippi River Basin. 2023. Available online: https://dc.cod.edu/cgi/viewcontent.cgi?article=1087&context=srs (accessed on 19 September 2023).
  65. Faust, D.R.; Kröger, R.; Moore, M.T.; Rush, S.A. Management Practices Used in Agricultural Drainage Ditches to Reduce Gulf of Mexico Hypoxia. Bull. Environ. Contam. Toxicol. 2018, 100, 32–40. [Google Scholar] [CrossRef]
  66. Fan, X.; Khanna, M.; Hartman, T.; VanLoocke, A. Designing Payments for Multiple Ecosystem Services with Advanced Biofuels in the Mississippi River Basin. In Proceedings of the 2023 Agricultural & Applied Economics Association Annual Meeting, Washington, DC, USA, 23–25 July 2023. [Google Scholar]
  67. Hanrahan, B.R.; Tank, J.L.; Christopher, S.F.; Mahl, U.H.; Trentman, M.T.; Royer, T.V. Winter cover crops reduce nitrate loss in an agricultural watershed in the central US. Agric. Ecosyst. Environ. 2018, 265, 513–523. [Google Scholar] [CrossRef]
  68. USDA-NRCS. Assessment of the Effects of Conservation Conservation Effects, Assessment Project Practices on Cultivated Cropland in the Upper Mississippi River Basin. 2012; pp. 1–11. Available online: https://www.nrcs.usda.gov/publications/ceap-crop-2010-Upper-MRB-full.pdf (accessed on 13 January 2023).
  69. Drake, C.; Jones, C.; Schilling, K.; Amado, A.A.; Weber, L. Estimating nitrate-nitrogen retention in a large constructed wetland using high-frequency, continuous monitoring and hydrologic modeling. Ecol. Eng. 2018, 117, 69–83. [Google Scholar] [CrossRef]
  70. Ayars, J.E.; Christen, E.W.; Hornbuckle, J. Controlled drainage for improved water management in arid regions irrigated agriculture. Agric. Water Manag. 2006, 86, 128–139. [Google Scholar] [CrossRef]
  71. Jaynes, D.B.; Isenhart, T.M. Reconnecting tile drainage to riparian buffer hydrology for enhanced nitrate removal. J. Environ. Qual. 2014, 43, 631–638. [Google Scholar] [CrossRef]
  72. Wu, M.; Demissie, Y.; Yan, E. Simulated impact of future biofuel production on water quality and water cycle dynamics in the Upper Mississippi river basin. Biomass Bioenergy 2012, 41, 44–56. [Google Scholar] [CrossRef]
  73. Lund, D.; Atwood, J.D.; Bagdon, J.K.; Benson, J.; Goebel, J.; Ingram, K.; Johnson, M.-V.V.; Kellogg, R.L.; Lemunyon, J.; Norfleet, L.; et al. Assessment of the Effects of Conservation Practices on Cultivated Cropland in the Lower Mississippi River Basin. Conservation Effects Assessment Project (CEAP); USDA NRCS: Washington, DC, USA, 2013.
  74. Skaggs, R.W.; Fausey, N.R.; Evans, R.O. Drainage water management. J. Soil Water Conserv. 2012, 67, 167A–172A. [Google Scholar] [CrossRef]
  75. Moragoda, N.; Jones, C.; Stanley, L.; Liu, Y.; Keellings, D. Assessing Climate Change Impacts on Gulf of Mexico’s Water Quality: A Review. Southeast. Geogr. 2024, 64, 220–240. [Google Scholar] [CrossRef]
  76. Moore, M.; Kröger, R. Evaluating plant species-specific contributions to nutrient mitigation in drainage ditch mesocosms. Water Air Soil Pollut. 2011, 217, 445–454. [Google Scholar] [CrossRef]
  77. Rabalais, N.N.; Turner, R.E.; Wiseman, W.J., Jr. Gulf of Mexico hypoxia, aka “The dead zone”. Annu. Rev. Ecol. Syst. 2002, 33, 235–263. [Google Scholar] [CrossRef]
  78. Craig, J.K.; Crowder, L.B. Hypoxia-induced habitat shifts and energetic consequences in Atlantic croaker and brown shrimp on the Gulf of Mexico shelf. Mar. Ecol. Prog. Ser. 2005, 294, 79–94. [Google Scholar] [CrossRef]
  79. Malone, R.W.; Radke, A.; Herbstritt, S.; Wu, H.; Qi, Z.; Emmett, B.D.; Helmers, M.J.; Schulte, L.A.; Feyereisen, G.W.; O’Brien, P.L. Harvested winter rye energy cover crop: Multiple benefits for North Central US. Environ. Res. Lett. 2023, 18, 074009. [Google Scholar] [CrossRef]
  80. ICSU. A Guide to SDG Interactions: From Science to Implementation; Griggs, D.J., Nilsson, M., Stevance, A., McCollum, D., Eds.; International Council for Science: Paris, France, 2017; p. 72. Available online: https://pure.iiasa.ac.at/id/eprint/14591/1/SDGs-Guide-to-Interactions.pdf#page=72 (accessed on 7 May 2024).
  81. Littlejohn, K.; Poganski, B.; Kröger, R.; Ramirez-Avila, J. Effectiveness of low-grade weirs for nutrient removal in an agricultural landscape in the Lower Mississippi Alluvial Valley. Agric. Water Manag. 2014, 131, 79–86. [Google Scholar] [CrossRef]
  82. Ma, L.; Malone, R.W.; Heilman, P.; Jaynes, D.B.; Ahuja, L.R.; Saseendran, S.; Kanwar, R.; Ascough Ii, J. RZWQM simulated effects of crop rotation, tillage, and controlled drainage on crop yield and nitrate-N loss in drain flow. Geoderma 2007, 140, 260–271. [Google Scholar] [CrossRef]
  83. Christensen, L.M.; Sule, P.; Strain, M.; Cirillo, J.D. Legionella pneumophila p45 element influences host cell entry and sensitivity to sodium. PLoS ONE 2019, 14, e0218941. [Google Scholar] [CrossRef]
  84. Kaufman, R.; Wilson, J.; Bean, S.; Presley, D.; Blanco-Canqui, H.; Mikha, M. Effect of nitrogen fertilization and cover cropping systems on sorghum grain characteristics. J. Agric. Food Chem. 2013, 61, 5715–5719. [Google Scholar] [CrossRef]
  85. Kuo, S.; Jellum, E.J. Influence of winter cover crop and residue management on soil nitrogen availability and corn. Agron. J. 2002, 94, 501–508. [Google Scholar] [CrossRef]
  86. Boesch, D.F.; Brinsfield, R.B.; Magnien, R.E. Chesapeake Bay eutrophication: Scientific understanding, ecosystem restoration, and challenges for agriculture. J. Environ. Qual. 2001, 30, 303–320. [Google Scholar] [CrossRef] [PubMed]
  87. Basche, A.D.; Archontoulis, S.V.; Kaspar, T.C.; Jaynes, D.B.; Parkin, T.B.; Miguez, F.E. Simulating long-term impacts of cover crops and climate change on crop production and environmental outcomes in the Midwestern United States. Agric. Ecosyst. Environ. 2016, 218, 95–106. [Google Scholar] [CrossRef]
  88. Alonso-Ayuso, M.; Quemada, M.; Vanclooster, M.; Ruiz-Ramos, M.; Rodriguez, A.; Gabriel, J.L. Assessing cover crop management under actual and climate change conditions. Sci. Total Environ. 2018, 621, 1330–1341. [Google Scholar] [CrossRef] [PubMed]
  89. Bergkvist, G.; Stenberg, M.; Wetterlind, J.; Båth, B.; Elfstrand, S. Clover cover crops under-sown in winter wheat increase yield of subsequent spring barley—Effect of N dose and companion grass. Field Crops Res. 2011, 120, 292–298. [Google Scholar] [CrossRef]
  90. Bell, G. Crop Rotation Diversity and Climate Change Impacts on Water Use Efficiency in two Contrasting Soil Textures. Master’s Thesis, University of Guelph, Guelph, ON, Canada, 2022. [Google Scholar]
  91. Obembe, O.S.; Wang, T.; Shew, A.M. Effect of Conservation Practice Adoption on Perceived Changes in Production Cost and Yield in South Dakota. J. Agric. Resour. Econ. 2023, 48, 325–341. [Google Scholar]
  92. Plastina, A.; Liu, F.; Miguez, F.; Carlson, S. Cover crops use in Midwestern US agriculture: Perceived benefits and net returns. Renew. Agric. Food Syst. 2020, 35, 38–48. [Google Scholar] [CrossRef]
  93. Cameron-Harp, M.V.; Hendricks, N.P.; Potter, N.A. Predicting the spatial variation in cost-efficiency for agricultural greenhouse gas mitigation programs in the US. Carbon Balance Manag. 2024, 19, 6. [Google Scholar] [CrossRef]
  94. Prasad, L.R.; Thompson, A.M.; Arriaga, F.J.; Koropeckyj-Cox, L.; Yuan, Y. Effectiveness of Residue and Tillage Management on Runoff Pollutant Reduction from Agricultural Areas. J. ASABE 2023, 66, 1341–1354. [Google Scholar] [CrossRef]
  95. Osei, E.; Jafri, S.H.; Gassman, P.W.; Saleh, A. Simulated ecosystem and farm-level economic impacts of conservation tillage in a Northeastern Iowa County. Agriculture 2023, 13, 891. [Google Scholar] [CrossRef]
  96. Lemke, A.; Lindenbaum, T.; Perry, W.; Herbert, M.; Tear, T.; Herkert, J. Effects of outreach on the awareness and adoption of conservation practices by farmers in two agricultural watersheds of the Mackinaw River, Illinois. J. Soil Water Conserv. 2010, 65, 304–315. [Google Scholar] [CrossRef]
  97. Kamrath, B.; Yuan, Y. Effectiveness of nutrient management for reducing phosphorus losses from agricultural areas. J. Nat. Resour. Agric. Ecosyst. 2023, 1, 77–88. [Google Scholar] [CrossRef] [PubMed]
  98. Liu, W.; Yuan, Y.; Koropeckyj-Cox, L. Effectiveness of nutrient management on water quality improvement: A synthesis on nitrate-nitrogen loss from subsurface drainage. Trans. ASABE 2021, 64, 675–689. [Google Scholar] [CrossRef]
  99. Fang, Q.; Malone, R.; Ma, L.; Jaynes, D.; Thorp, K.; Green, T.; Ahuja, L. Modeling the effects of controlled drainage, N rate and weather on nitrate loss to subsurface drainage. Agric. Water Manag. 2012, 103, 150–161. [Google Scholar] [CrossRef]
  100. Drury, C.; Tan, C.; Gaynor, J.; Oloya, T.; Welacky, T. Influence of controlled drainage-subirrigation on surface and tile drainage nitrate loss. J. Environ. Qual. 1996, 25, 317–324. [Google Scholar] [CrossRef]
  101. Evans, R.O.; Wayne Skaggs, R.; Wendell Gilliam, J. Controlled versus conventional drainage effects on water quality. J. Irrig. Drain. Eng. 1995, 121, 271–276. [Google Scholar] [CrossRef]
  102. Bonaiti, G.; Borin, M. Efficiency of controlled drainage and subirrigation in reducing nitrogen losses from agricultural fields. Agric. Water Manag. 2010, 98, 343–352. [Google Scholar] [CrossRef]
  103. Maxwell, B.M.; Christianson, R.D.; Arch, R.; Johnson, S.; Book, R.; Christianson, L.E. Applied denitrifying bioreactor cost efficiencies based on empirical construction costs and nitrate removal. J. Environ. Manag. 2024, 352, 120054. [Google Scholar] [CrossRef]
  104. Law, J.Y.; Slade, A.; Hoover, N.; Feyereisen, G.; Soupir, M. Amending woodchip bioreactors with corncobs reduces nitrogen removal cost. J. Environ. Manag. 2023, 330, 117135. [Google Scholar] [CrossRef]
  105. Bailon, A.S.B.; Margenot, A.; Cooke, R.A.; Christianson, L.E. Denitrifying Bioreactors and Dissolved Phosphorus: Net Source or Sink? Wiley Online Library: Hoboken, NJ, USA, 2024. [Google Scholar]
  106. Book, R.S.; Frankenberger, J.; Christianson, L.E.; Prasad, L.R.; Yuan, Y. Effectiveness Overview of Agricultural Conservation Practices for Water Quality Improvement Part II. J. Nat. Resour. Agric. Ecosyst. 2024, 2, 129–137. [Google Scholar] [CrossRef]
  107. Chandrasoma, J.; Christianson, R.; Cooke, R.A.; Davidson, P.C.; Lee, D.; Christianson, L. Saturated Buffer Design Flow and Performance in Illinois; Wiley Online Library: Hoboken, NJ, USA, 2022; Volume 51. [Google Scholar]
  108. Mayer, P.M.; Reynolds, S.K., Jr.; McCutchen, M.D.; Canfield, T.J. Meta-analysis of nitrogen removal in riparian buffers. J. Environ. Qual. 2007, 36, 1172–1180. [Google Scholar] [CrossRef] [PubMed]
  109. Liu, Y.; Engel, B.A.; Flanagan, D.C.; Gitau, M.W.; McMillan, S.K.; Chaubey, I. A review on effectiveness of best management practices in improving hydrology and water quality: Needs and opportunities. Sci. Total Environ. 2017, 601, 580–593. [Google Scholar] [CrossRef] [PubMed]
  110. Barden, C.; Mankin, K.; Ngangu, D.; Geyer, W.; Devlin, D.; McVay, K. Assessing the Effectiveness of Various Riparian Buffer Vegetation Types. Kansas State University Agricultural Experiment Station and Cooperative Extension Service Manhattan, Kansas 66506. SRL 137, March 2003. 2014. Available online: https://www.academia.edu/56605295/Assessing_the_Effectiveness_of_Various_Riparian_Buffer_Vegetation_Types (accessed on 2 May 2025).
  111. Mankin, K.R.; Ngandu, D.M.; Barden, C.J.; Hutchinson, S.L.; Geyer, W.A. Grass-Shrub Riparian Buffer Removal of Sediment, Phosphorus, and Nitrogen From Simulated Runoff 1. JAWRA J. Am. Water Resour. Assoc. 2007, 43, 1108–1116. [Google Scholar] [CrossRef]
  112. County, G. Final Draft Semi-Arid Riparian Functions and Associated Regulatory Protections to Support Shoreline Master Program Updates. 2013. Available online: https://citeseerx.ist.psu.edu/document?repid=rep1&type=pdf&doi=b38f409a2eba2325757409883f50f6ba4c6478e2 (accessed on 20 May 2025).
  113. Rapinel, S.; Panhelleux, L.; Gayet, G.; Vanacker, R.; Lemercier, B.; Laroche, B.; Chambaud, F.; Guelmami, A.; Hubert-Moy, L. National wetland mapping using remote-sensing-derived environmental variables, archive field data, and artificial intelligence. Heliyon 2023, 9, e13482. [Google Scholar] [CrossRef]
  114. Stagg, C.L.; Sharp, L.A.; Fromenthal, E.; Couvillion, B.; Woltz, V.; Piazza, S. Accelerating Elevation Gain Indicates Land Loss Associated with Erosion in Mississippi River Deltaic Plain Tidal Wetlands. Estuaries Coasts 2024, 47, 2106–2118. [Google Scholar] [CrossRef]
  115. Liu, J.; Hertel, T.W.; Bowling, L.; Jame, S.; Kucharik, C.; Ramankutty, N. Evaluating alternative options for managing nitrogen losses from corn production. Purdue Policy Res. Inst. (PPRI) Policy Briefs 2018, 4, 9. [Google Scholar]
  116. Zhang, J.; Gilbert, D.; Gooday, A.; Levin, L.; Naqvi, S.W.A.; Middelburg, J.; Scranton, M.; Ekau, W.; Pena, A.; Dewitte, B. Natural and human-induced hypoxia and consequences for coastal areas: Synthesis and future development. Biogeosciences 2010, 7, 1443–1467. [Google Scholar] [CrossRef]
  117. Griggs, D.; Smith, M.S.; Rockström, J.; Öhman, M.C.; Gaffney, O.; Glaser, G.; Kanie, N.; Noble, I.; Steffen, W.; Shyamsundar, P. An integrated framework for sustainable development goals. Ecol. Soc. 2014, 19, 49. [Google Scholar] [CrossRef]
  118. Mongin, S.J.; Baron, S.L.; Schwartz, R.M.; Liu, B.; Taioli, E.; Kim, H. Measuring the impact of disasters using publicly available data: Application to Hurricane Sandy (2012). Am. J. Epidemiol. 2017, 186, 1290–1299. [Google Scholar] [CrossRef]
  119. Contat, J.C.; Doerner, W.M.; Renner, R.N.; Rogers, M.J. Measuring Price Effects from Disasters Using Public Data: A Case Study of Hurricane Ian. J. Real Estate Res. 2024, 1–48. [Google Scholar] [CrossRef]
  120. Malone, R.W.; Huth, N.; Carberry, P.; Ma, L.; Kaspar, T.C.; Karlen, D.L.; Meade, T.; Kanwar, R.S.; Heilman, P. Evaluating and predicting agricultural management effects under tile drainage using modified APSIM. Geoderma 2007, 140, 310–322. [Google Scholar] [CrossRef]
Figure 1. Flowchart overview of methods.
Land 14 01169 g001
Figure 2. The theoretical base used in framework development.
Land 14 01169 g002
Figure 3. Framework developed using the theoretical base. ACPs refer to agricultural conservation practices.
Land 14 01169 g003
Figure 4. Geographic scales for linkages of FEW nexus and hypoxia.
Land 14 01169 g004
Figure 5. SDGs and their targets [18] that affect and/or impact GOM hypoxia (see the Supplementary Materials for more details).
Land 14 01169 g005
Disclaimer/Publisher’s Note: The statements, opinions and data contained in all publications are solely those of the individual author(s) and contributor(s) and not of MDPI and/or the editor(s). MDPI and/or the editor(s) disclaim responsibility for any injury to people or property resulting from any ideas, methods, instructions or products referred to in the content.

