Article

Multidimensional Bird Habitat Network Resilience Assessment and Ecological Strategic Space Identification in International Wetland City

1
Department of Urban Planning, School of Urban Design, Wuhan University, Wuhan 430072, China
2
Department of Architecture and Urban Studies, School of Architecture Urban Planning Construction Engineering, Politecnico di Milano, 20133 Milan, Italy
*
Author to whom correspondence should be addressed.
These authors are co-first authors.
Land 2025, 14(6), 1166; https://doi.org/10.3390/land14061166
Submission received: 24 April 2025 / Revised: 22 May 2025 / Accepted: 26 May 2025 / Published: 28 May 2025

Abstract

:
Establishing a resilient bird habitat network (BHN) and identifying ecological strategic areas for protection are critical for conserving biodiversity and maintaining ecosystem stability in wetland cities. However, existing ecological network studies often overlook dynamic resilience that incorporates explicit species information, and their scenario-based assessments lack systematic evaluation metrics. This study, using Wuhan—an international wetland city—as a case study, integrates Maximum Entropy (MaxEnt), remote sensing ecological index (RSEI) and circuit theory to identify a high-quality BHN. A comprehensive resilience assessment and optimization framework is developed, grounded in structure–function–quality indicators and informed by resilience and complex network theory. Key findings include: (1) The network comprises 147 habitat patches and 284 ecological corridors, demonstrating marked spatial heterogeneity. Habitats are predominantly located in the southern and southwestern regions of Wuhan, concentrated in contiguous green spaces. In contrast, habitats in the urban core are fragmented and small. Corridors are mainly distributed in the southwestern and central metropolitan areas. (2) Under deliberate attack, considering resilience centrality, the network’s resilience declined more slowly than in scenarios based on traditional centrality measures. Across combined node and corridor attack simulations, two critical resilience thresholds were identified at 30% and 50%. (3) The ecological strategic space is primarily composed of key habitat patches (58, 108, 117, and 27) and corridors (119–128, 9–12, 122–147, 128–138, 76–85, and 20–29), mainly located in the southern region of Wuhan, particularly around Liangzi Lake and Anshan National Wetland Park. This study advances a dynamic framework for BHN resilience assessment, planning, and restoration, providing scientific guidance for enhancing ecological security and biodiversity conservation in urban wetland environments.

1. Introduction

Wetlands, one of the most vital ecosystems for biodiversity conservation, provide numerous ecosystem services such as flood mitigation, water purification, and climate regulation [1]. However, due to accelerating urbanization and intensifying climate change, wetland ecosystems face unprecedented challenges [2]. Studies show that since the 20th century, global wetland areas have declined by approximately 50% [3], resulting in landscape fragmentation and a weakening of ecological services [4], posing severe threats to the survival of many species including birds. As the highest global honor for wetland conservation and a key initiative under the framework of the Convention on Wetlands, the concept of “International Wetland City” plays a strategic and exemplary role in global ecological protection [5]. Therefore, scientific research and effective policy actions are urgently needed to safeguard biodiversity and habitats, and to promote the vision of harmonious coexistence advocated by this designation.
Bird communities are essential in maintaining ecosystem functions, making them an ideal subject for studying urban biodiversity [6]. Birds possess acute habitat perception capabilities, and their selection of high-quality, low-risk ecological patches makes them excellent indicators for assessing ecological space and wetland environmental quality [7]. Moreover, they have been shown to have higher representativeness for biodiversity than reptiles in certain landscapes [8]. Ecological spaces degradation, such as wetlands, can decrease bird abundance and vice versa [9]. Rapid urbanization has led to significant ecological deterioration. Consequently, to protect species diversity, reconnect fragmented habitat patches, and enhance system resilience, studies on bird habitat networks have emerged [10].
Regarding ecological spatial patterns and ecological networks (EN), early conceptual foundations were established by Forman and colleagues through landscape pattern models [11]. These models were later refined by Yu et al., who introduced the concept of security patterns within landscape ecological planning [12]. Over time, this work has evolved into a mature construction paradigm that follows the sequence of source identification–resistance surface construction–corridor extraction [13], applicable to goals such as ecological security planning, biodiversity conservation, ecosystem service provision, and resilience enhancement [14]. Ecological network, consisting of ecological sources and corridors, forms an interconnected spatial network [15] that not only provides quality habitats for species but also facilitates the flow of ecosystem services. The quality and resilience of such networks directly influence the performance of the ecosystem [16]. Ecological sources are typically key patches essential for maintaining ecosystem health and stability. These are often identified from either structural or functional perspectives. Common methods for identifying ecological sources include ecosystem services assessment [17], morphological spatial pattern analysis (MSPA) [18], and species distribution models (SDMs), which predict species habitat requirements [6]. In recent years, RSEI has also emerged as a valuable supplementary indicator for accurately identifying ecological sources [19]. However, most existing studies lack species-specific data, making it difficult to target the protection of specific biodiversity components [20], or rely solely on single species rather than multiple surrogate species, thereby compromising the reliability of biodiversity representation and potentially biasing abundance estimations [21]. Ecological corridors, as essential network components that connect sources and ensure the effective operation of ecological processes, are typically extracted using approaches such as minimum cumulative resistance (MCR) [22] or circuit theory [23]. However, many studies have failed to incorporate the three-dimensional movement characteristics of birds and other species [24], leading to inaccuracies in corridor identification [19]. For research scales, two primary methodological perspectives have emerged: “bottom-up” approaches at provincial, watershed, or municipal levels, and “top-down” approaches typically applied at the national scale [25]. In terms of study areas, EN research has largely focused on high-density urban centers [26], river basins [27], semi-arid regions [28], mining areas [29], and mountainous cities [30]. However, case studies focusing on wetland cities remain relatively scarce.
Unlike traditional studies focusing on static networks, emerging BHN research adopts a more dynamic perspective, emphasizing how structure, function, and quality respond and adapt to external disturbances [31]. In recent years, complex network theory has increasingly been introduced into dynamic EN modeling, particularly for assessing network robustness and resilience under disturbance scenarios involving attacks on nodes or edges. For instance, Xiang et al. incorporated network dynamics and used a cascading failure model to evaluate the resilience of ENs to node disruptions [32]. Xu et al. integrated the complex network theory with targeted and random attack scenarios in their analysis of BHN resilience [6]. Shi et al., focusing on corridor vulnerability, explored EN-based pathways for enhancing ecosystem health and stability through edge-based attack simulations [33]. For EN stability and resilience metrics, most studies center on structural and functional indicators. Over time, a resilience assessment framework has emerged that combines complex network theory with resilience theory [10]. For example, Wang et al. assessed EN resilience through structural indicators such as agglomeration and connectivity, and functional indicators such as transmissibility and diversity [34]. Zhou et al. employed composite metrics including centrality, connectivity, and transmissibility to evaluate network resilience [35]. Additionally, Wang et al. analyzed network robustness based on topological indicators such as degree centrality, betweenness centrality, and clustering coefficient [36].
Consequently, BHN exhibits inherent conceptual synergies with resilience thinking frameworks [10], and spatial resilience provides a theoretical basis for evaluating resistance and robustness of these systems [37]. Previous resilience studies, however, often rely on oversimplified models that assume rare species or abstract spatial structures (e.g., grid-based landscapes), neglecting the characteristics of real biological systems [38] and the influence of landscape entities on resilience [39]. These limitations result in biased resilience assessments and hinder effective BHN management. Recent research suggests that bird diversity is a strong proxy for regional resilience [40], and the resilience of bird communities can serve as a key indicator of ecosystem stability [41]. Moreover, given limited conservation resources, identifying strategic conservation areas is critical for maximizing the protection of bird diversity and wetland ecological quality in urban areas [42]. Existing resilience evaluations tend to rely on static network metrics (e.g., degree, betweenness centrality) to determine resilience thresholds, while overlooking the complex dynamic attributes of networks. Research on dynamic resilience thresholds remains scarce [43], and there is a lack of precise and reliable tools for resilience-oriented spatial management. Therefore, under the constraints of limited resources, maintaining connectivity among habitat patches and exploring new approaches to sustain the dynamic resilience of habitat networks represent a new frontier for biodiversity conservation in wetland cities.
As a critical hub along the East Asian–Australasian Flyway (EAAF) [44], Wuhan boasts rich wetland resources and high avian diversity, serving as a vital wintering and stopover site for migratory birds. A total of 467 bird species have been recorded in the city, with over 1.53 million individual bird observations in 2023 alone [45]. However, as the only megacity globally with over 10 million residents and a leading international wetland city in China, Wuhan’s rapid urbanization poses serious challenges to wetland and avian habitats [44], constraining regional resilience enhancement. Consequently, the scientific construction of Wuhan’s bird habitat network and its resilience assessment are of paramount urgency. This study aims to construct a bird habitat network for an international wetland city and evaluate its resilience under a “structure–function–quality” framework in dynamic disturbance scenarios, identifying strategic areas critical for resilience enhancement. The results will contribute to a deeper understanding of BHN construction and resilience assessment in international wetland cities and provide a scientific foundation for biodiversity conservation and ecological governance in urban areas.

2. Materials and Methods

2.1. Study Area

Wuhan is located in the eastern Hubei Province, at the confluence of the Yangtze River and the Han River in central China (Figure 1). The city experiences a typical subtropical humid monsoon climate. Wuhan is among the world’s most resource-rich inland wetland cities, characterized by an extensive network of rivers and lakes. It is home to 165 rivers, 166 lakes, and 277 reservoirs. The total wetland area in Wuhan exceeds 160,000 hectares, accounting for approximately 19% of the city’s total land area. Additionally, there are 63,500 hectares of micro-wetlands, representing 7.41% of the city’s land area [46].
As an internationally recognized wetland city, Wuhan’s abundant wetland resources serve as a vital foundation for its pursuit of sustainable development. Since the early 21st century, Wuhan has undergone rapid urbanization. Urban expansion, infrastructure development, and changes in land use patterns have exerted significant pressure on the city’s wetland ecosystems. Over the past two decades, the built-up area of Wuhan has tripled, accompanied by substantial reductions in cultivated land, water bodies, forested areas, and grasslands [47]. Anthropogenic disturbances have been identified as the primary drivers of habitat alteration and landscape transformation in Wuhan [48]. These ecological disruptions pose serious challenges to the city’s long-term sustainability, highlighting the urgent need for ecological research to inform adaptive spatial management policies.

2.2. Data Sources and Preprocessing
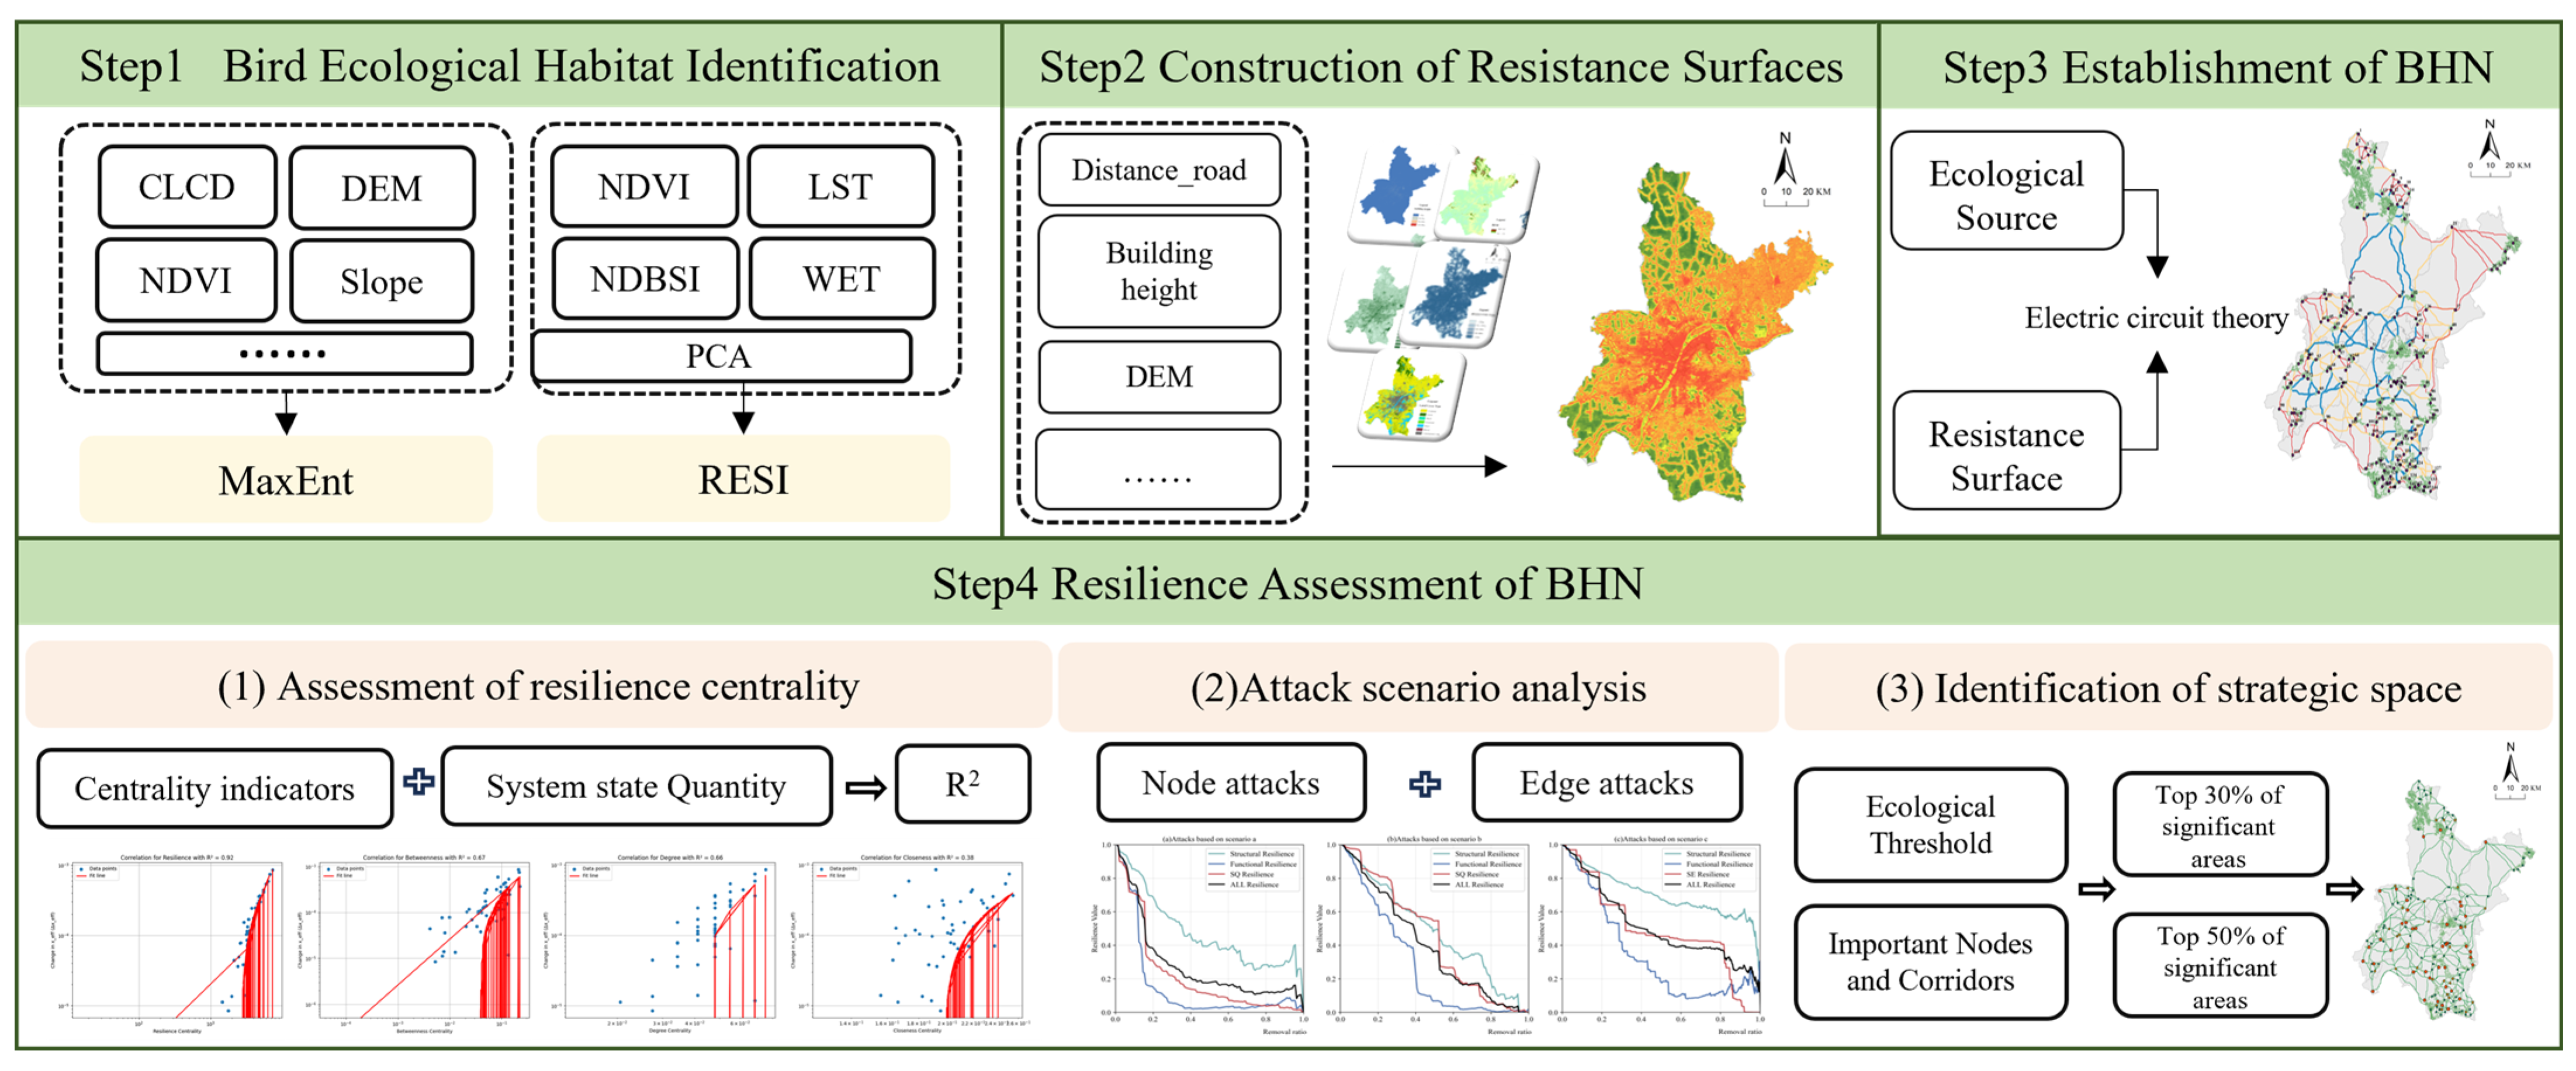
This study primarily utilized 2021 data, including land use, elevation, and other relevant datasets (Table 1). All raster datasets were resampled to a spatial resolution of 30 × 30 m using ArcGIS Pro 3.0. Additionally, we incorporated bird observation data from two representative citizen science platforms: the open-source eBird website (https://www.eBird.org) and the Global Biodiversity Information Facility (GBIF) platform (https://www.gbif.org). Previous studies have confirmed the reliability and effectiveness of citizen science data, which have been widely applied in ecological and biodiversity research [49]. To address potential biases inherent in citizen science methods, we conducted several preprocessing steps on the bird data: (1) records outside the study area were removed; (2) only one occurrence record per bird species per point was retained; (3) species were further filtered based on conservation status using the IUCN Red List, China’s national protection categories, and the CITES appendices to identify important species; and (4) to mitigate spatial autocorrelation and its associated modeling bias, redundant occurrence points were eliminated using the SDM Toolbox v0.9.1. Following these steps, a final dataset comprising 134 occurrence points was obtained, representing 29 bird species from 14 orders and 23 families (Figure 2). Among these 29 species of birds, there are 4 species of songbirds, 14 species of land birds and 11 species of wading birds. They represent three size classes and broadly encompass both migratory and migratory/resident species. In addition, 10 species belong to the endangered bird species in Wuhan, namely: Green-headed Diving Duck, Black-faced Spoonbill, Little Swan, Gray Crane, Black Stork, Curlew Pelican, Oriental White Stork, Oriental White Crane, White-bellied Eagle, and Reed Bunting. They accounted for about 34.5% of the total number of birds observed. Seventeen of the species combinations were migratory birds, accounting for the highest proportion of 58.6%, with seven species of year-round resident birds and five species of migratory/resident hybrids (Table S1).

2.3. Methodology

The methodological framework of this study is outlined in Figure 3 and comprises the following key steps: (1) Habitat Identification: Using citizen science data, the distribution of 29 target bird species was determined. Habitat suitability was assessed using MaxEnt v3.4.4. The results were then integrated with the RSEI to delineate core ecological areas and extract final bird habitat patches. (2) Resistance Surface and Network Construction: A comprehensive resistance surface reflecting factors affecting bird movement was developed using the analytic hierarchy process (AHP). This surface was integrated with circuit theory to construct the bird habitat network, enabling the identification of critical ecological corridors. (3) Resilience Assessment under Attack Scenarios: The concept of resilience centrality was explored to evaluate node importance, highlighting its advantages over traditional static metrics. By applying complex network theory, deliberate attack scenarios were simulated to assess the structural, functional, and quality resilience of the constructed BHN. Changes in resilience were observed and analyzed to identify resilience thresholds specific to Wuhan’s BHN. (4) Strategic Recommendations: Based on the evaluation results, strategic suggestions were proposed to enhance the bird habitat network in Wuhan and guide future biodiversity conservation and ecological planning.

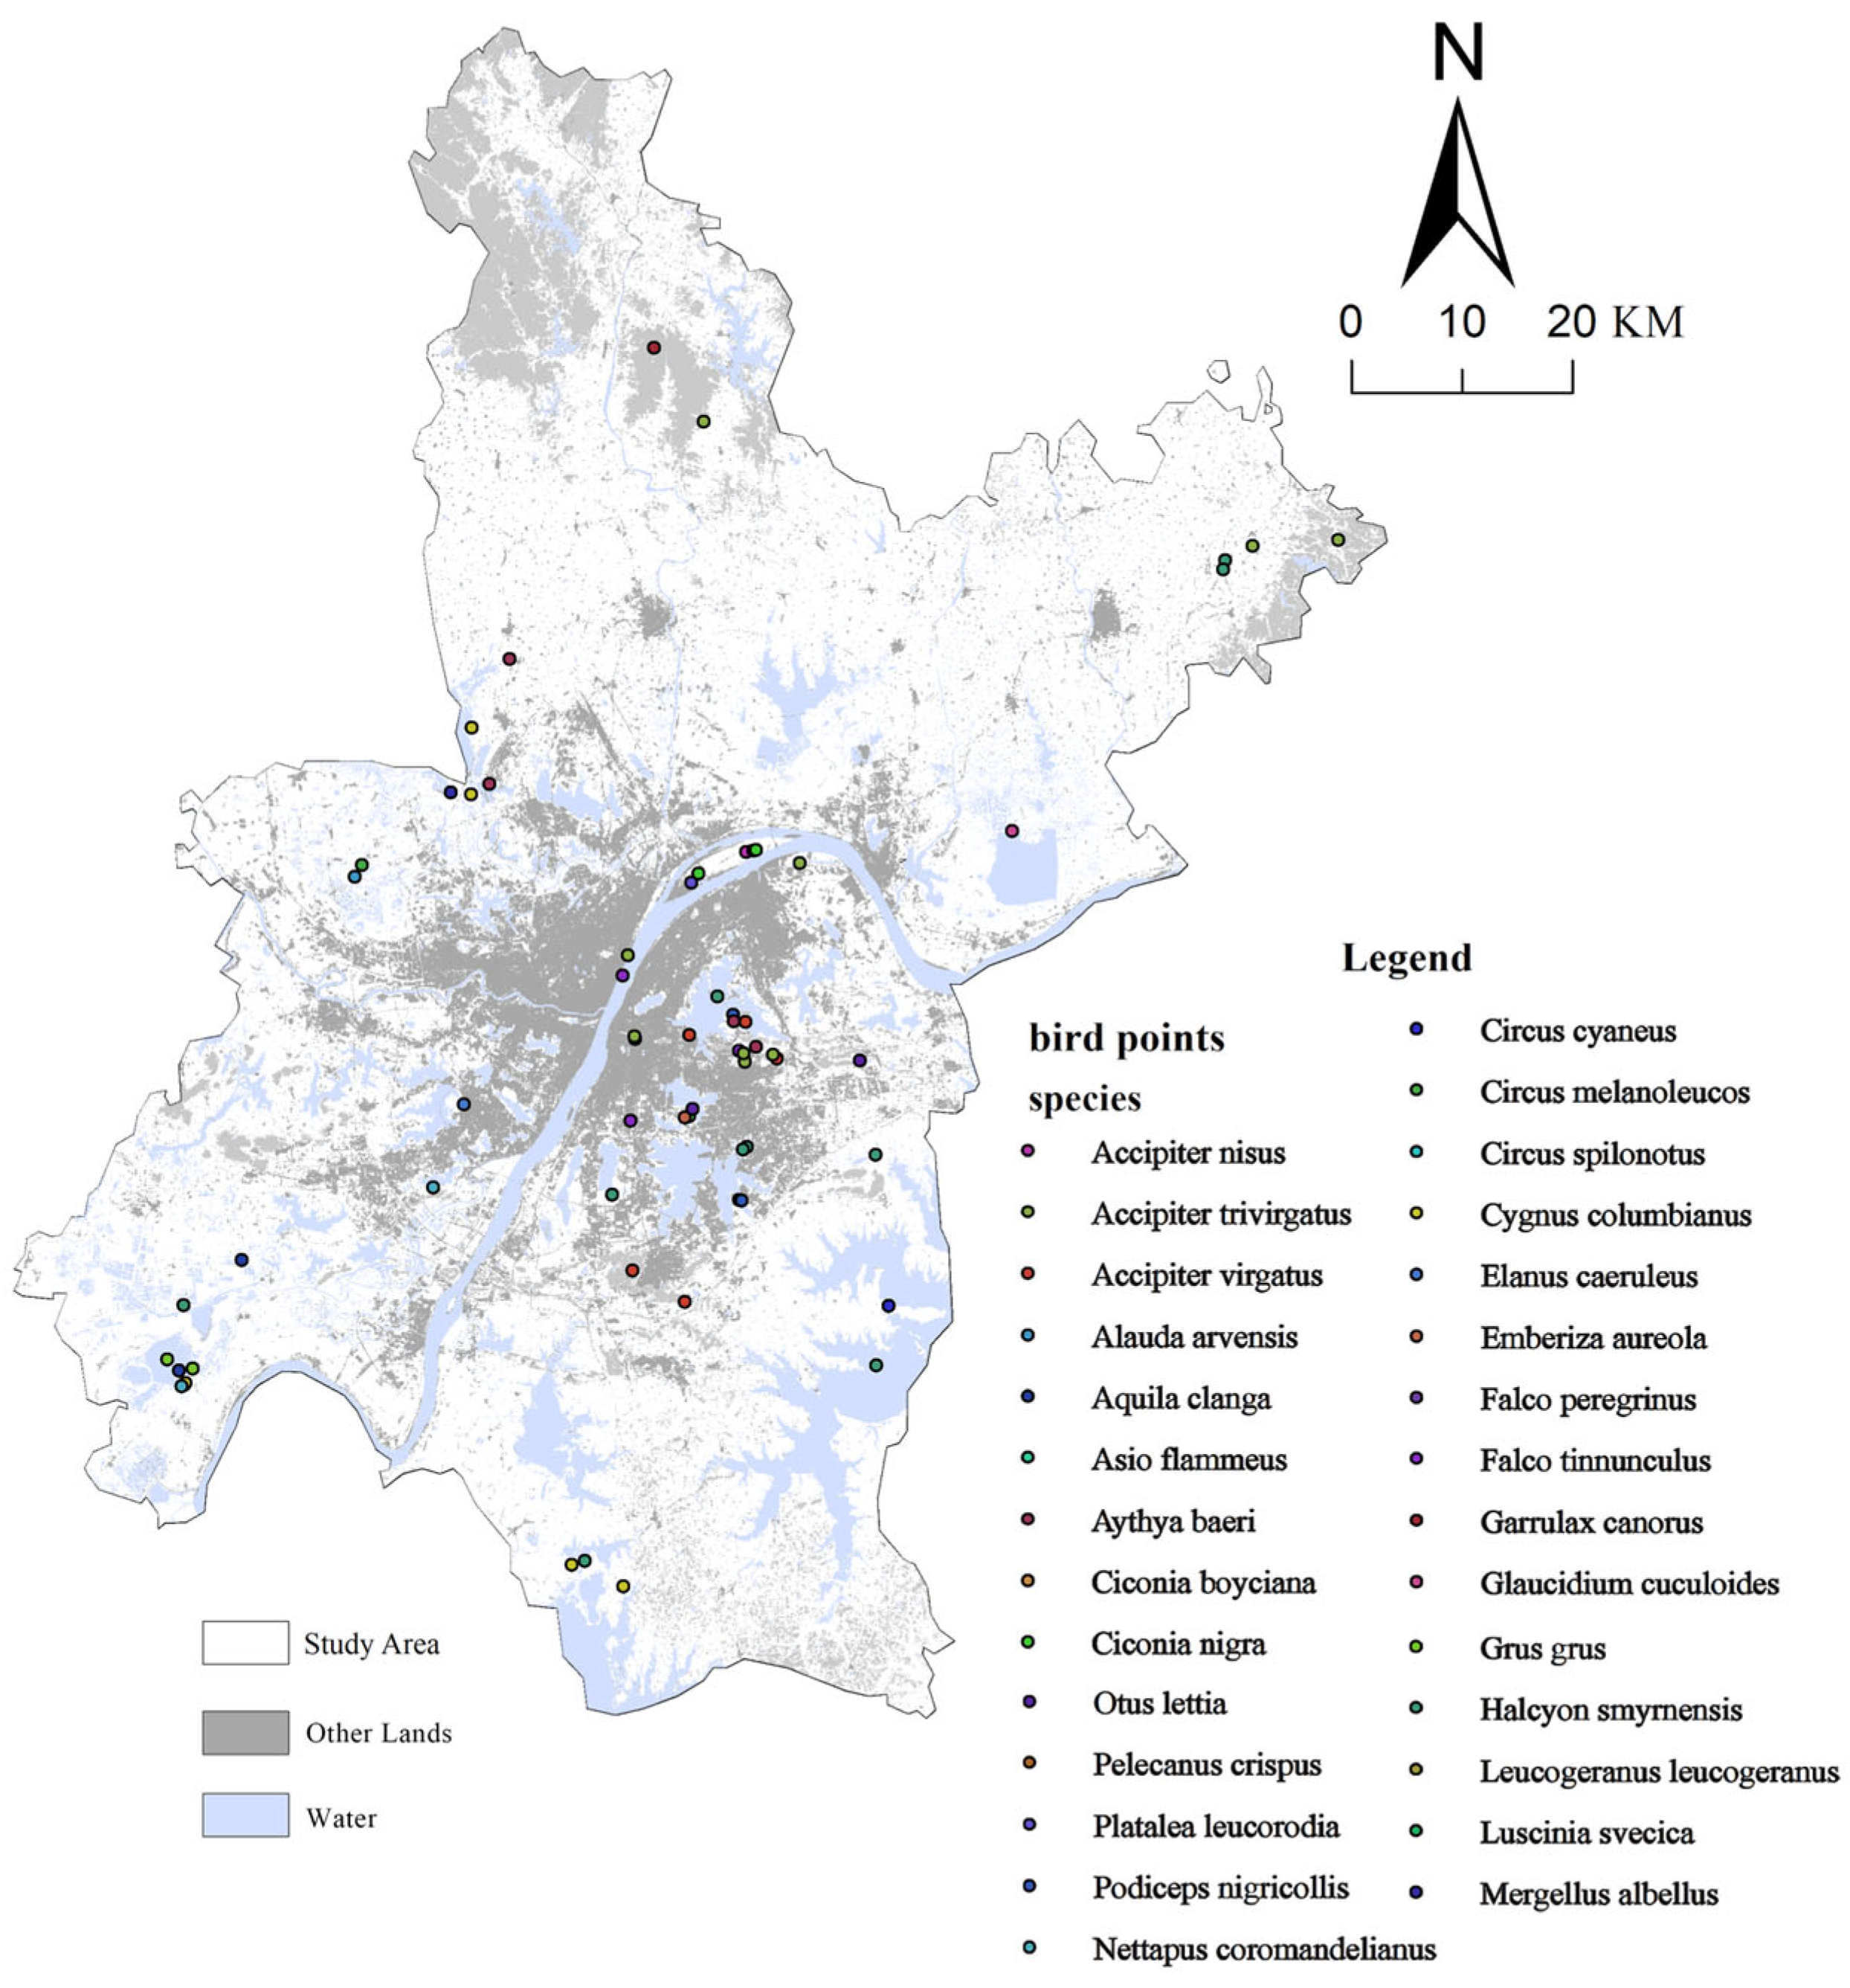
2.3.1. Identification of Bird Habitat Patches

Habitat Suitability Assessment Based on MaxEnt

MaxEnt v3.4.4 was used to model the habitat suitability of various bird ecological types across the study area [50]. Based on the principle of maximum entropy, the MaxEnt model predicts species distributions by inferring the most likely probability distribution of habitat suitability from incomplete presence-only data. Owing to its high predictive accuracy, computational efficiency, and ease of use, MaxEnt is widely applied in biodiversity modeling and forecasting [51]. Following existing literature [6], 12 environmental variables were selected, including land use, DEM, slope, aspect, NDVI, FVC, and distances to water, grassland, construction land, forest, farmland, and roads. Considering that the habitat needs of various bird species may share environmental drivers at the landscape scale, this study modeled all bird species as a whole [19,52], selecting 75% of the occurrence data as the training set and the remaining 25% as the validation set. The model was run with 10 replicates, and average results were used to ensure an area under the curve (AUC) greater than 0.75. Jackknife tests were applied to evaluate the relative contribution of each variable and the probability of species presence across the region. The final average prediction output was converted to a raster format in ArcGIS Pro and a Natural Breaks classification method [53] was used to divide habitat suitability into four categories.

Habitat Patch Extraction Based on RSEI

High-quality ecological source areas play a vital role in maintaining habitat integrity by mitigating human disturbances and providing key habitat nodes for urban bird communities. These areas are critical for enhancing ecosystem services and ecological connectivity [19]. Regions with high ecological quality are less affected by human activities and can thus serve as potential bird habitats in urban areas. To this end, the RSEI was employed to comprehensively evaluate the ecological conditions in Wuhan and identify high-quality ecological source areas. RSEI integrates four core indicators—greenness (NDVI), wetness (WET), heat (LST), and dryness (NDBSI)—using Principal Component Analysis (PCA), resulting in a composite index ranging from 0 to 1, with higher values indicating better ecological conditions. To determine the final set of bird habitat patches, we applied equal-weight overlay analysis combining the high-suitability areas derived from MaxEnt and the high-quality ecological areas identified by RSEI. Recognizing that small patches contribute less to biodiversity and are highly vulnerable to fragmentation [54], we followed previous studies [6,55] and excluded patches smaller than 0.5 km2. The remaining contiguous areas were retained as the final set of bird habitat patches.

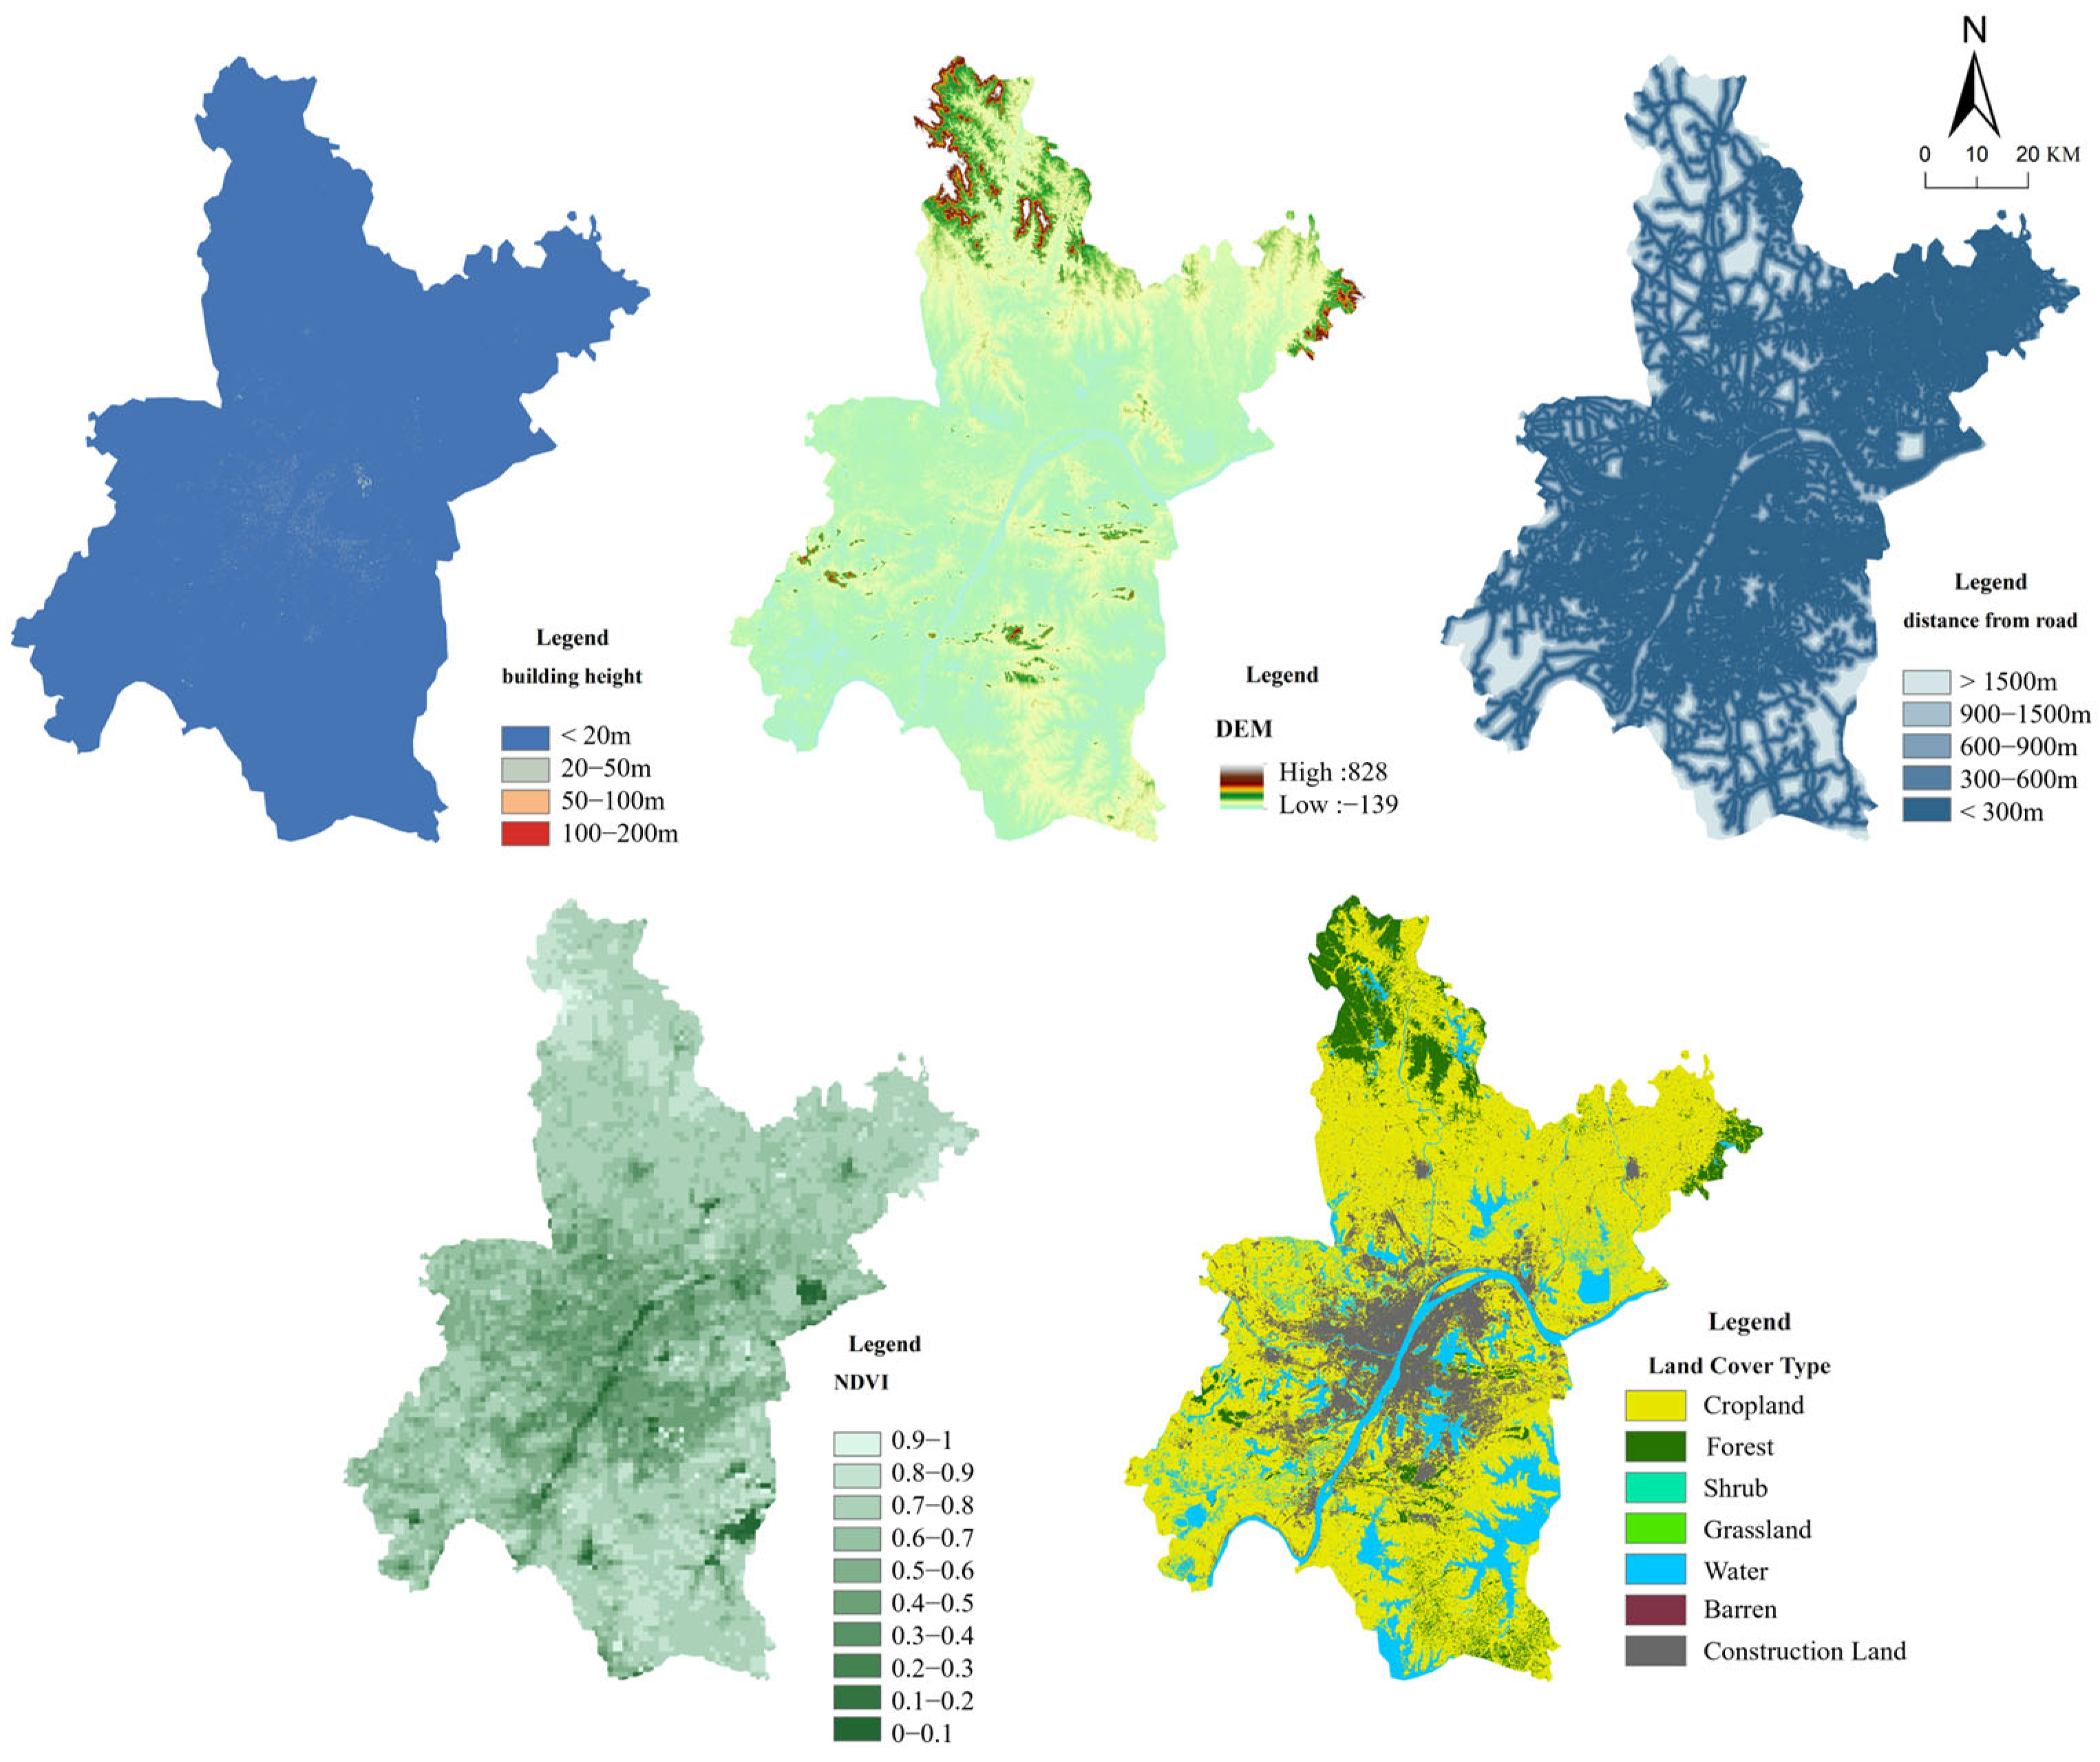
2.3.2. Resistance Surface Construction

Ecological resistance surfaces are used to quantify the cost of species and energy movement between ecological sources [56]. Resistance surface affecting bird migration typically involves factors such as land cover, slope, and elevation [19]. Due to the impact of intensive human activities, construction land is assigned the highest resistance, while natural areas are given the lowest resistance. Vegetation coverage, which significantly influences bird movement [57], is assessed using NDVI, with resistance levels commonly classified at equal intervals—higher values represent lower resistance. Studies have shown that transportation infrastructure can significantly disrupt bird migration [58], and areas around urban highways are characterized by high noise and crossing difficulty [59,60]. Resistance levels were classified based on previous studies [19].
In high-density urban areas, building height is a crucial barrier for birds. Most birds fly between 25 and 115 m [61]; buildings over 100 m pose substantial barriers, while those under 20 m have minimal impact [62]. Buildings over 200 m represent the highest resistance [63]. Elevation also affects flight due to oxygen availability. Most small passerines typically fly below 300 m [24]. Based on previous studies [19], we classified areas under 100 m as low resistance, with resistance increasing across three elevation bands (Table 2). In Wuhan, most areas, including built-up zones, lie below 100 m, while regions above 100 m are forested hills with high vegetation and low human disturbance. Therefore, aside from oxygen limitations, elevation has a relatively minor effect on bird movement in Wuhan compared to anthropogenic factors [64]. Based on these considerations, five factors—NDVI, CLCD, building height, DEM, and distance to roads—were selected for resistance surface construction (Figure 4). Each factor was classified into resistance levels and assigned weights using AHP [6]. The final resistance surface was generated through weighted overlay analysis in ArcGIS Pro.

2.3.3. Identification of Ecological Corridors on Circuit Theory

In constructing bird habitat corridors in Wuhan, we employed circuit theory using the Linkage Mapper (LM) 3.0 toolbox to extract ecological corridors and identify potential connections between habitat patches [65]. Previous studies have consistently affirmed the effectiveness of circuit theory in modeling ecological connectivity [66,67]. In this framework, individual species or gene flows are analogous to electric currents, while the landscape is conceptualized as a conductive surface. Target bird species are modeled as random walkers (electrons) moving across this landscape, where resistance values vary depending on land cover types and other environmental factors that influence bird mobility. The circuit-based approach captures multiple movement pathways and allows for a more realistic representation of potential corridors, especially in fragmented urban environments.

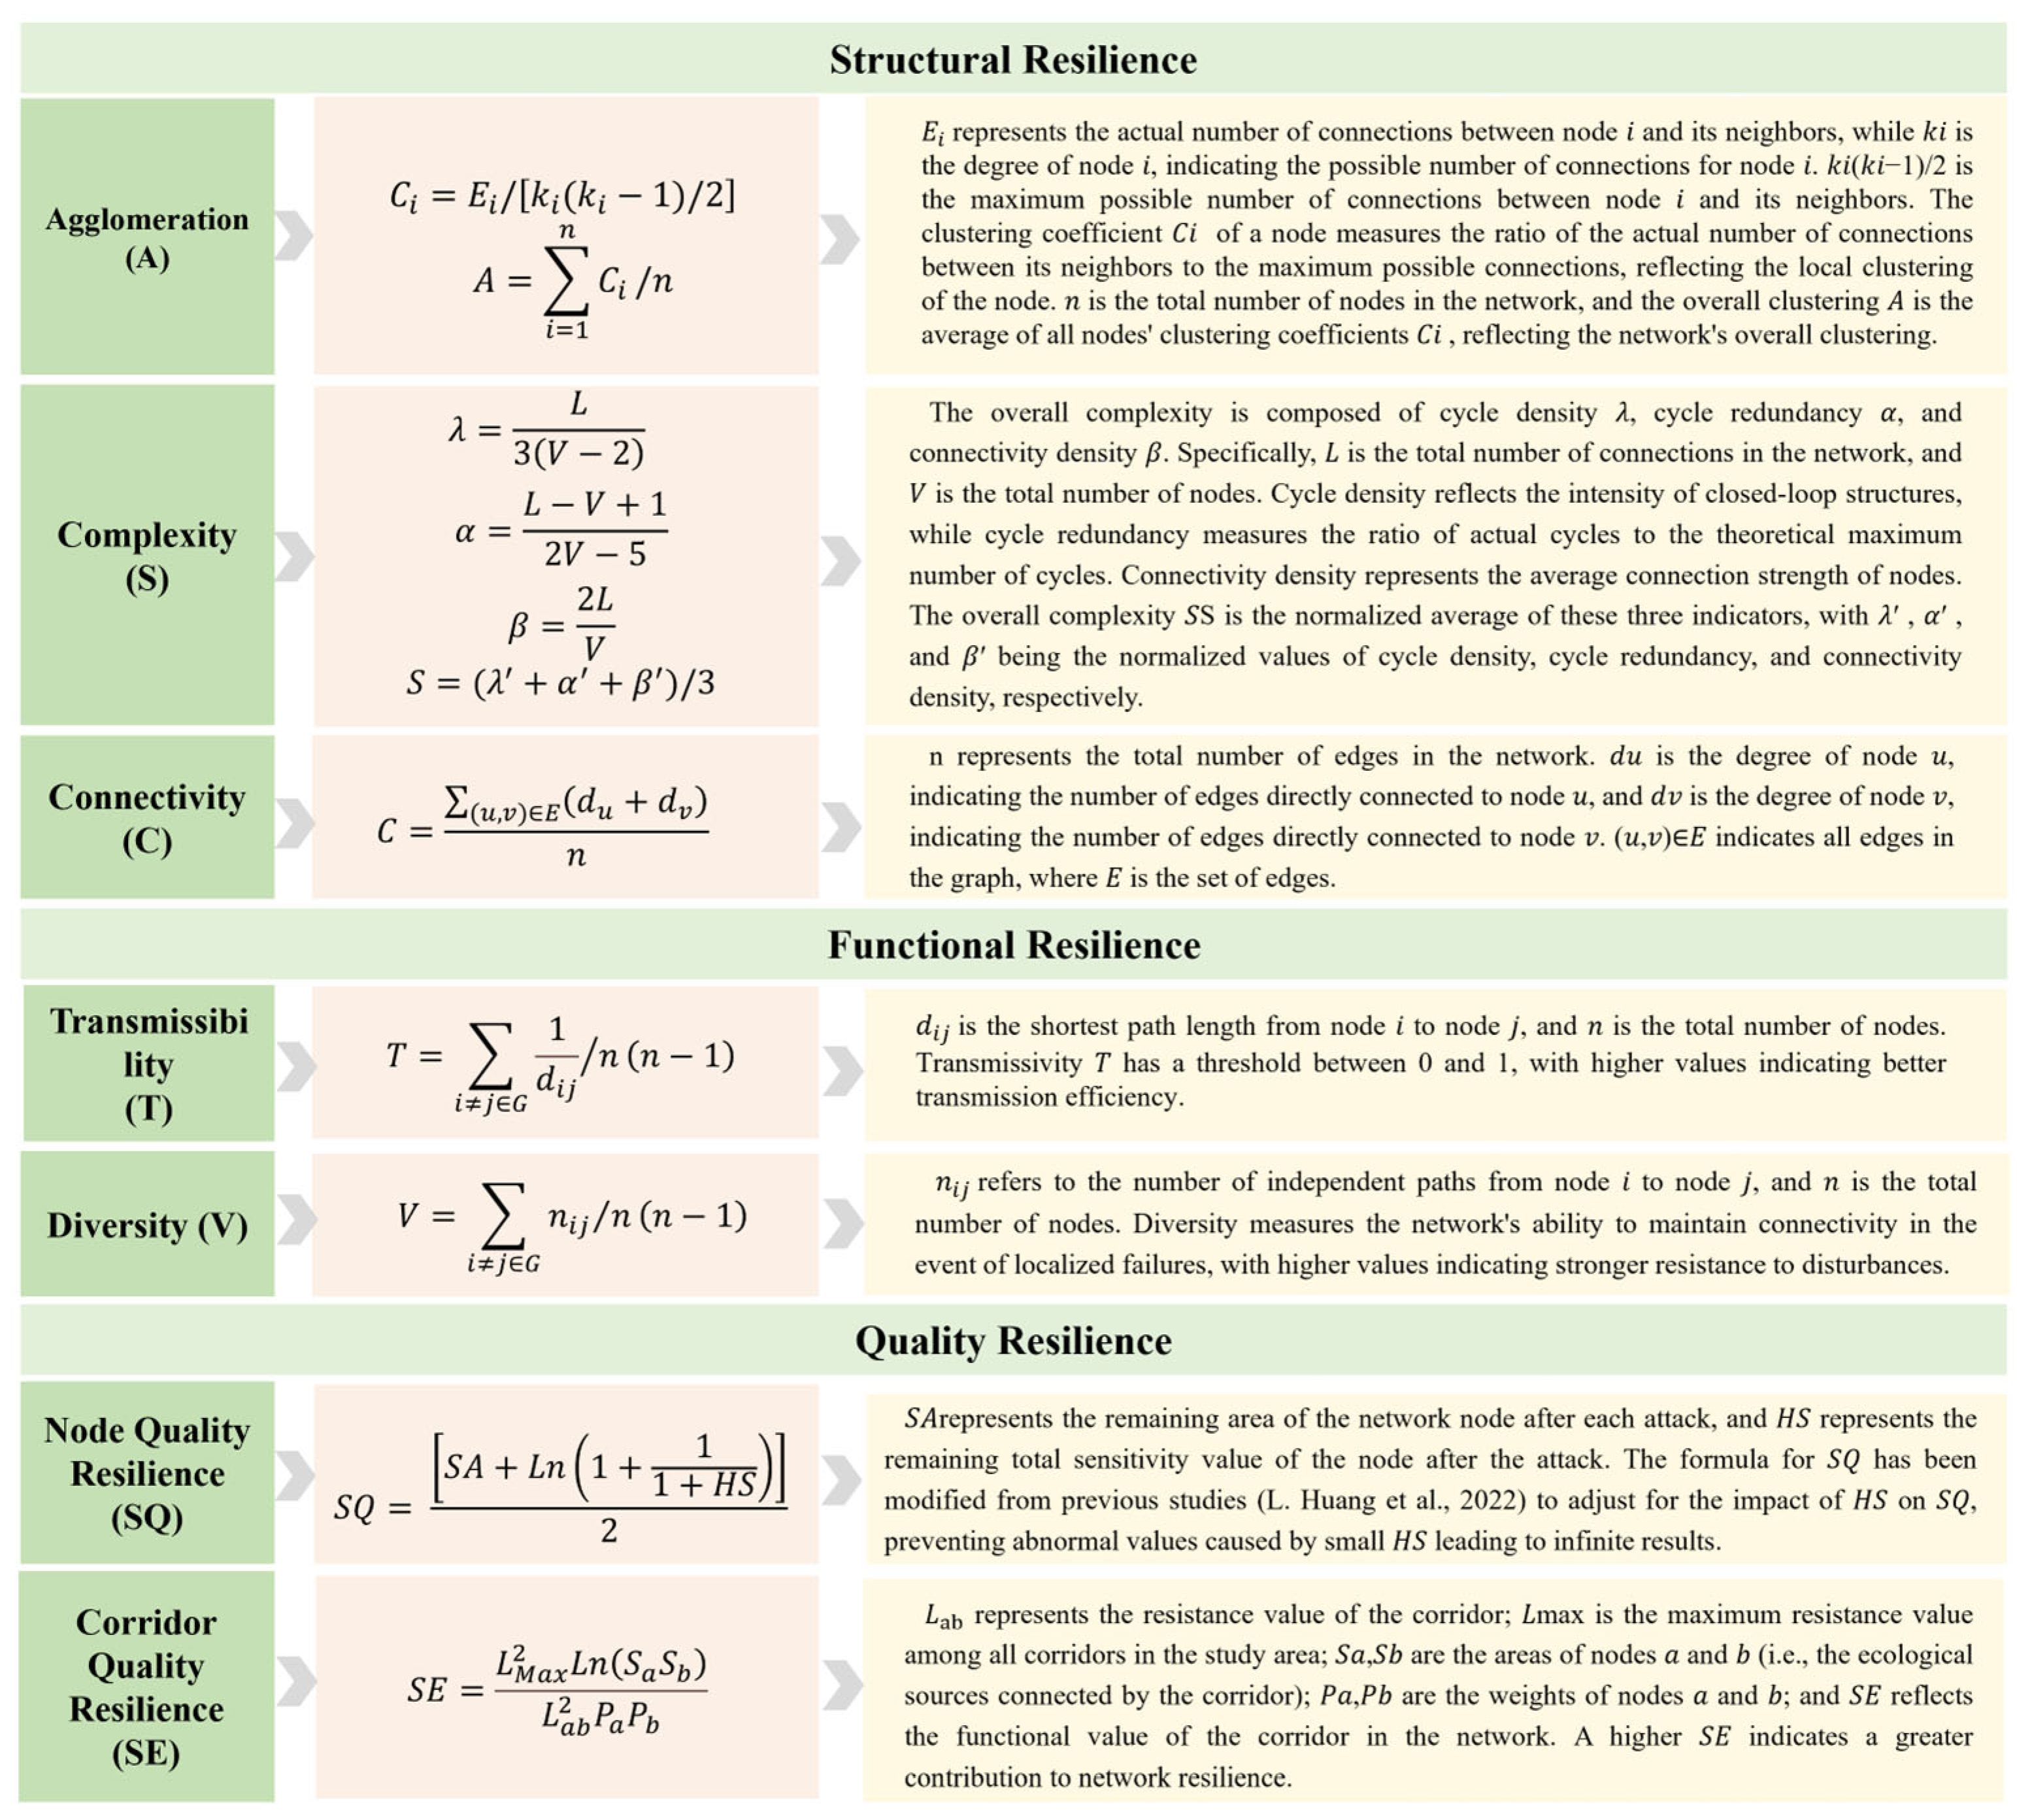
2.3.4. Resilience Assessment of the Bird Habitat Network

Evaluating Resilience Centrality in the BHN

Resilience centrality [68] is a novel metric designed to quantify the influence of individual nodes on the overall resilience of a complex network. It achieves this by reducing high-dimensional dynamic equations to a single control parameter ( β e f f ), allowing for the assessment of each node’s contribution to the network’s structural and functional stability. The resilience centrality formula integrates node degree, the importance of neighboring nodes, and system stability parameters, offering a theoretical basis for the protection and optimization of complex systems. Directly reflecting the impact of the removal of important nodes on the stability of ecological networks, i.e., the loss of important ecological source sites has undermined the strength of the connections between the source sites and thus led to a decrease in resilience.
In this study, we applied the concept of system state variable ( X e f f ) to examine the effectiveness of resilience centrality within the constructed ecological network. X e f f reflects the weighted average state of all nodes in the network in terms of structure and attributes, reflecting the overall level of the ecological network. The contribution of each node depends on its connection strength with other nodes and its attribute. In this study, the node’s attribute is the degree of the node itself, reflecting the ecological connectivity between nodes; the connection strength reflects the species migration and resource replenishment capacity between habitats. When the network suffers from external attacks, the destruction of certain important patches will lead to a decrease in X e f f , corresponding to the loss of the overall network resilience (Figure 5).
Furthermore, we conducted a correlation analysis between changes in system state and four types of centrality metrics (resilience, degree, closeness, and betweenness). The coefficient of determination (R2) was used to evaluate the fitting performance of each centrality measure, aiming to highlight the advantage of resilience centrality in ecological network analysis.

Ecological Network Disturbance Scenarios

To assess changes in the resilience of Wuhan’s bird ecological network under disturbances, we used a network attack simulation method via NetworkX library in Python [69]. This method models resilience responses to node and edge removal, revealing the network’s vulnerability and helping identify critical ecological spaces under cost constraints. This study identifies critical ecological spaces under cost constraints by determining resilience index thresholds. We defined resilience thresholds by identifying the removal rate at which the resilience index drops sharply, indicating fragmentation and loss of connectivity [43]. To simulate real-world human disturbances, we designed two deliberate node attack scenarios. Scenario a: nodes removed by the combined ranking of degree centrality, betweenness centrality, and closeness centrality. Scenario b: Nodes removed by the combined ranking of resilience centrality, degree centrality, and betweenness centrality. We compared the node importance under two attack scenarios. Using the natural breaks method, node importance was classified into five categories. Corridor (edge) attacks were also simulated in scenario c, based on a combined ranking of edge degree centrality, betweenness centrality, and closeness centrality. Edges were removed in order of importance, and nodes with no remaining edges became inactive. Through the simulation process, we tracked changes in structural, functional, and quality resilience under varying removal ratios to determine resilience thresholds and identify key nodes and corridors [43]. This method helps identify key nodes and edges in the ecological network, supporting network robustness and protection priorities.

Ecological Network Resilience Indicator Calculation

We integrate structural, functional, and quality resilience dimensions to construct an ecological network resilience assessment framework (Figure 6), providing theoretical support for risk analysis in complex systems [10]. Structural resilience is quantified through network agglomeration, complexity, and connectivity to evaluate the topological stability of the EN and the smoothness of ecological flows [70]. Agglomeration is measured by the average clustering coefficient of nodes, reflecting the local tightness of EN; complexity is described using three sub-indices—α, β, and λ—representing path richness, accessibility, and overall connectivity, respectively [71]; connectivity is assessed based on the number of ecological corridors between nodes, directly reflecting the strength and intensity of ecological interactions. Functional resilience is characterized by transmissibility and diversity. Transmissibility captures the efficiency of material flow and species migration within the network—higher values enhance the EN’s resistance to disturbance. Diversity quantifies the availability of alternative pathways between nodes and the structural richness of the network [34]. Node quality resilience considers node area and habitat risks [39]. Sensitivity is used as a proxy for habitat risk, and a logarithmic smoothing term (Ln) is applied to ensure numerical stability, with the calculation method referenced from the literature formulas [72,73]. Corridors have their resistance values, with higher resistance indicating lower corridor quality [10]. Corridor quality resilience (SE) is calculated using the corridor’s resistance value and a gravity matrix model, typically used to determine the interaction forces between nodes [74].

3. Results

3.1. Habitat Identification

According to the MaxEnt modeling results, the average AUC value for the training data were 0.978 (AUC > 0.75). In modeling the species distribution, we found that FVC, distance to roads, and distance to forests played dominant roles. The output from the MaxEnt model was subsequently classified into four categories using the Natural Breaks method: extremely low (0–0.067), low (0.067–0.17), high (0.17–0.32), and extremely high (0.32–1). This classification facilitated the creation of a habitat suitability map for bird communities in Wuhan. The mapping results indicated that bird populations in Wuhan were mainly concentrated in various riparian zones, wetland parks, and nature reserves within the city. In ten iterations, the test AUC exceeded 0.75 in nine cases and 0.708 in one case, and this fluctuation may have originated from the difference in the training-testing set distribution due to random data partitioning (Table S2). Nonetheless, the test AUCs of all iterations were significantly higher than 0.5, and the average test AUC was 0.830, indicating that the model has a more reliable prediction ability overall.
Based on PCA, the first principal component (PC1) accounted for 73.63% of the total variance, indicating its effectiveness in capturing the core variation in regional ecological quality. The study applied a 0.2 interval grading method to categorize the RSEI into five levels: Poor, Fair, Moderate, Good, and Excellent. Results showed that 61.5% of Wuhan’s land area was at or above a moderate ecological quality level (RSEI ≥ 0.4), mainly distributed in the northern and southeastern parts of the city, as well as around the green belts along water systems in urbanized areas (Figure 7).
Finally, by overlaying the high-quality areas from the two datasets above, we identified 147 ecological source patches, covering a total area of 783.07 km2, accounting for 9.14% of the total study area (Figure 8). Spatially, these bird habitats were mainly located in the peripheral areas of the urban built-up zones, particularly in the southern and southwestern forested regions. Some habitats were also found within the urban core, though they were more fragmented and smaller in size—examples include East Lake in Wuhan and the confluence area of the Yangtze and Han Rivers in Hanyang District. Habitats within the built-up areas were more severely affected by human activities and land development. On the western side of the city, habitat patches were fragmented by scattered built-up land, resulting in relatively weak spatial connectivity compared to the more contiguous habitat areas in the southern part of the city.

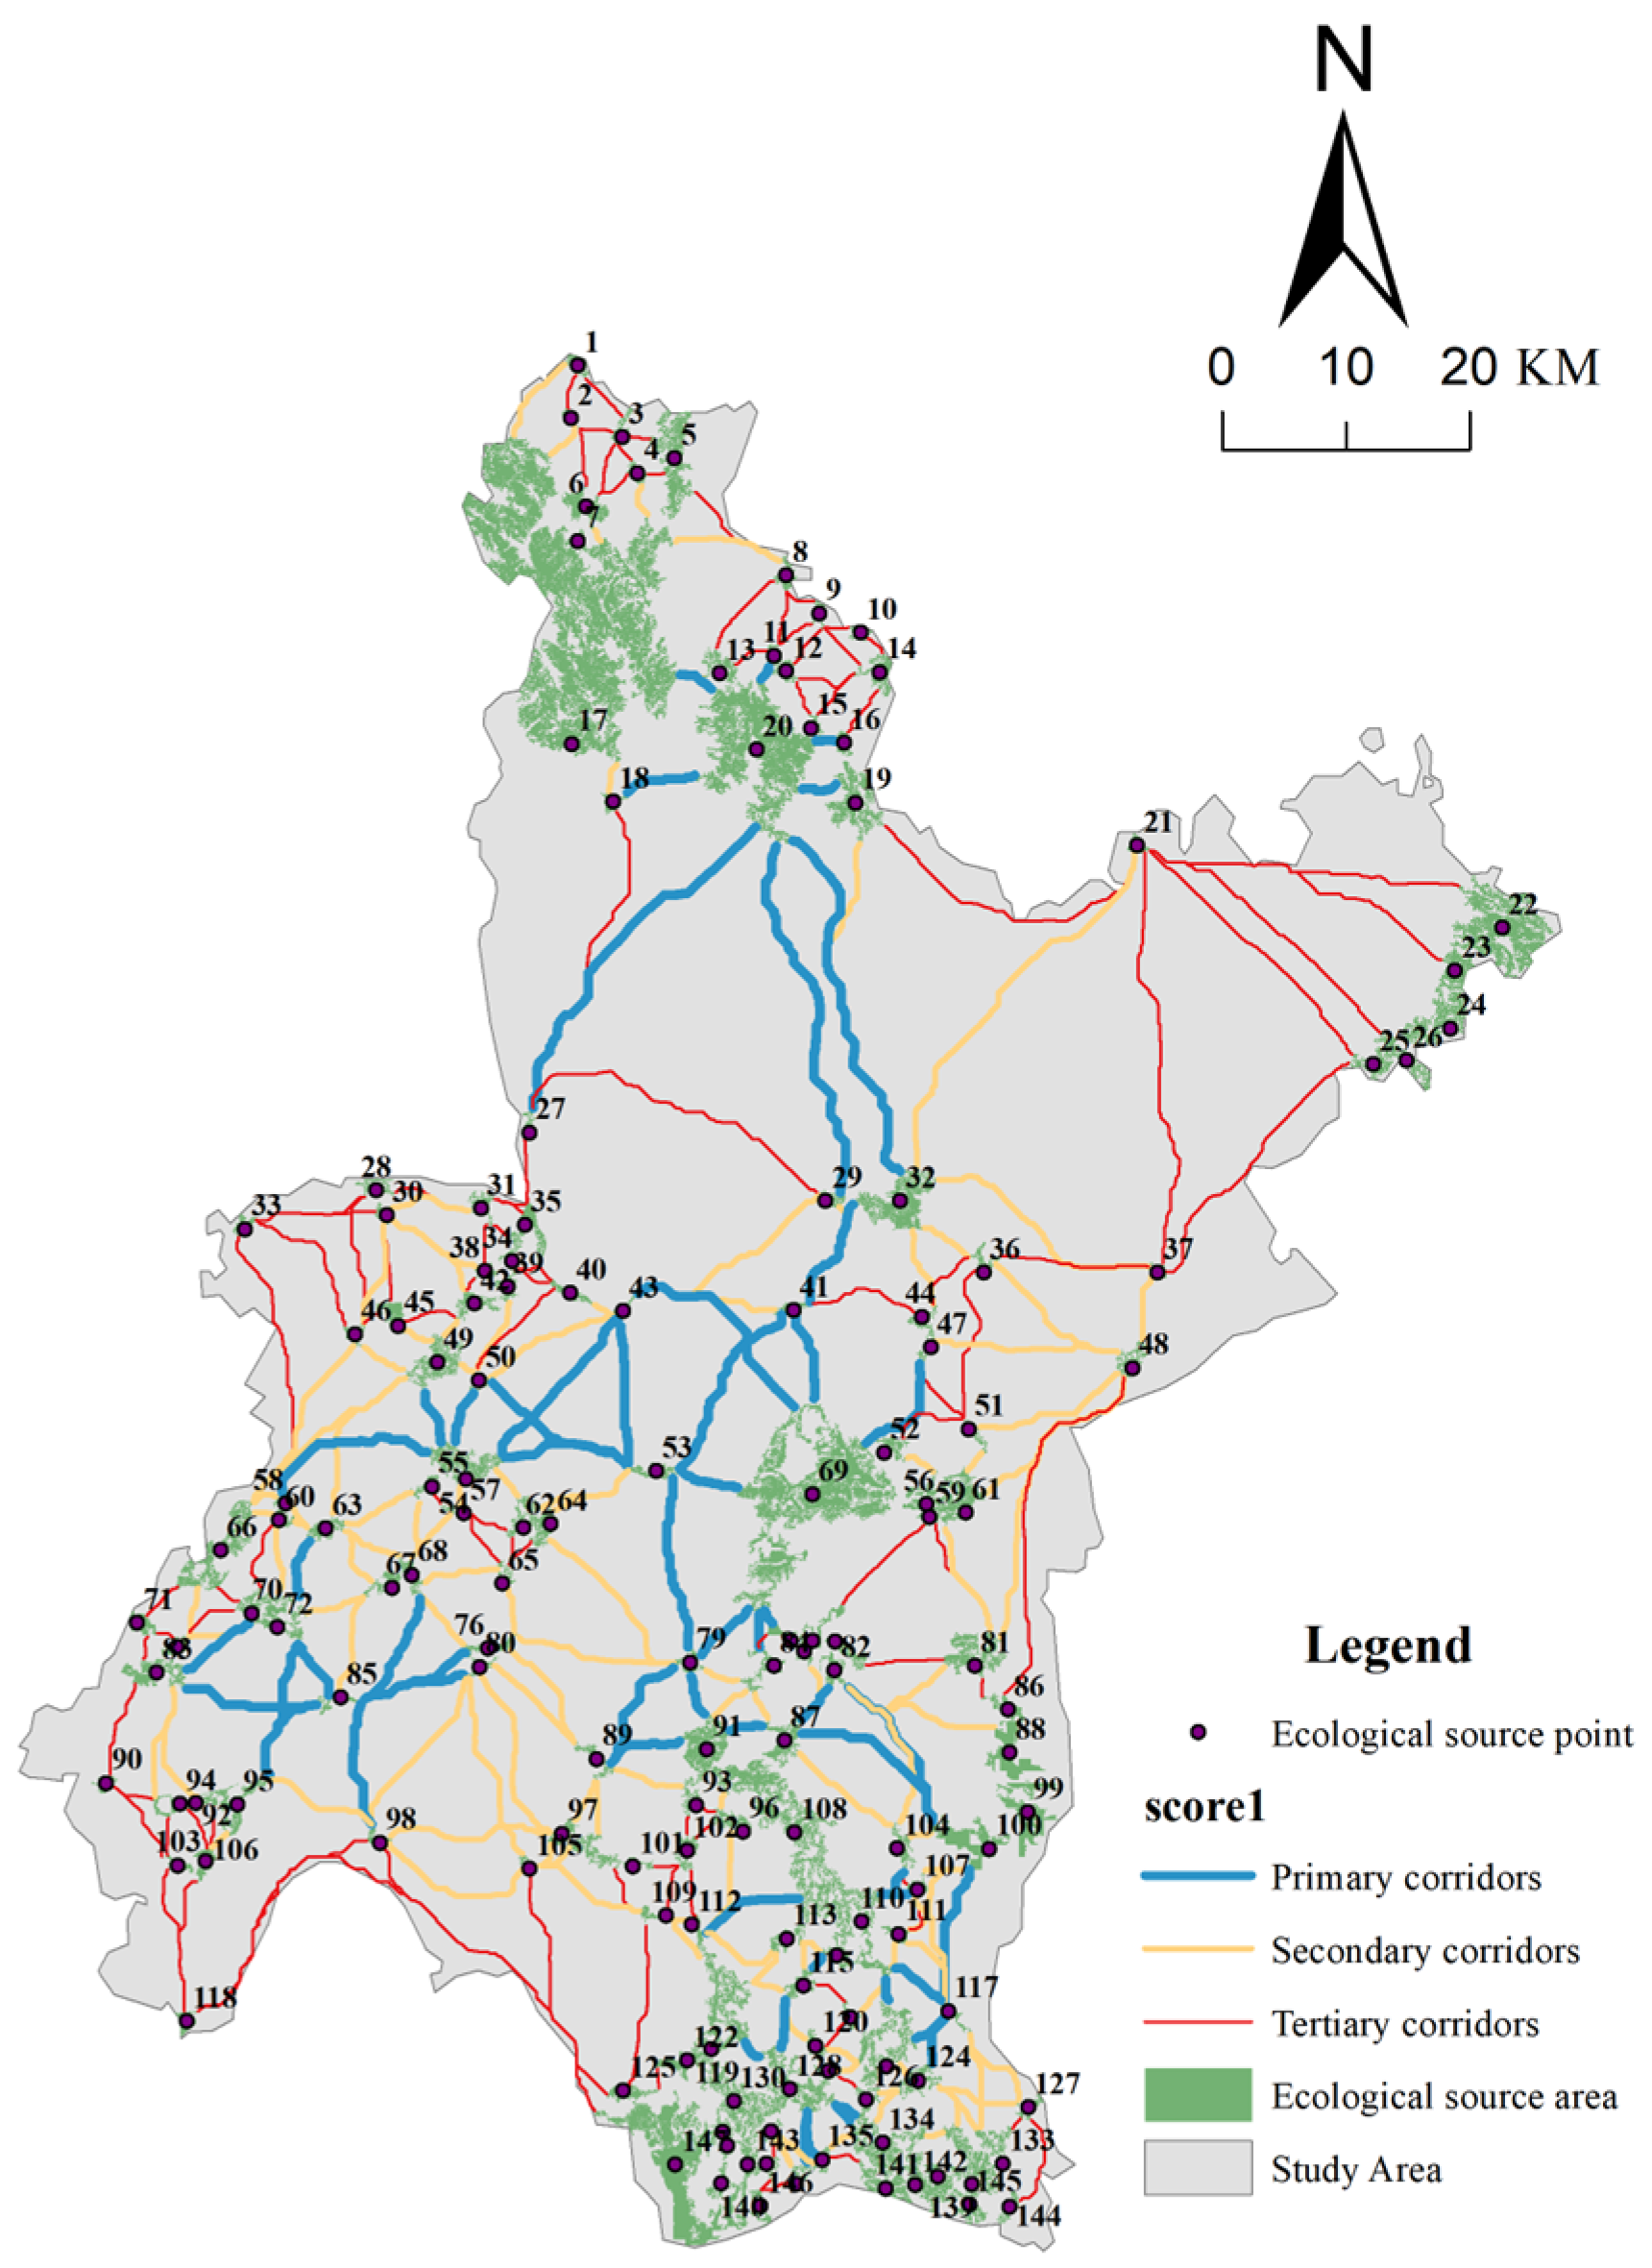
3.2. Ecological Network Construction

A total of 147 ecological nodes and 284 ecological corridors were simulated within the study area (Figure 9). The corridors were primarily concentrated in the southern and western parts of Wuhan, with a total length of 2209.56 km. The average corridor length was approximately 7.78 km, with the longest corridor measuring 52.19 km and the shortest 1.5 km. Additionally, these corridors were categorized based on the integrated centrality scores calculated from degree centrality, betweenness centrality, and closeness centrality: 45 primary corridors (integrated centrality: 294.01–523.51), 191 secondary corridors (integrated centrality: 175.01–294.01), and 41 tertiary corridors (integrated centrality: 33.34–175.01).
The results revealed significant spatial heterogeneity in Wuhan’s bird habitat network. Key ecological corridors were mainly distributed in the southwestern part of the study area and the central urban area, while the eastern and southern parts were relatively sparse. Secondary corridors were the most numerous, predominantly located in the southwestern and southern regions, with the fewest found in the northern and northeastern areas. Meanwhile, secondary corridors were sparsely distributed and fewer in number within the central urban zone.
Overall, bird habitats in the study area were primarily located in the southern and southwestern regions of the city, where patches were larger, more continuous, and supported by a dense and well-connected network of ecological corridors. In contrast, other areas featured smaller, more fragmented ecological sources, resulting in a lower density and sparser distribution of ecological corridors.

3.3. Network Resilience Analysis

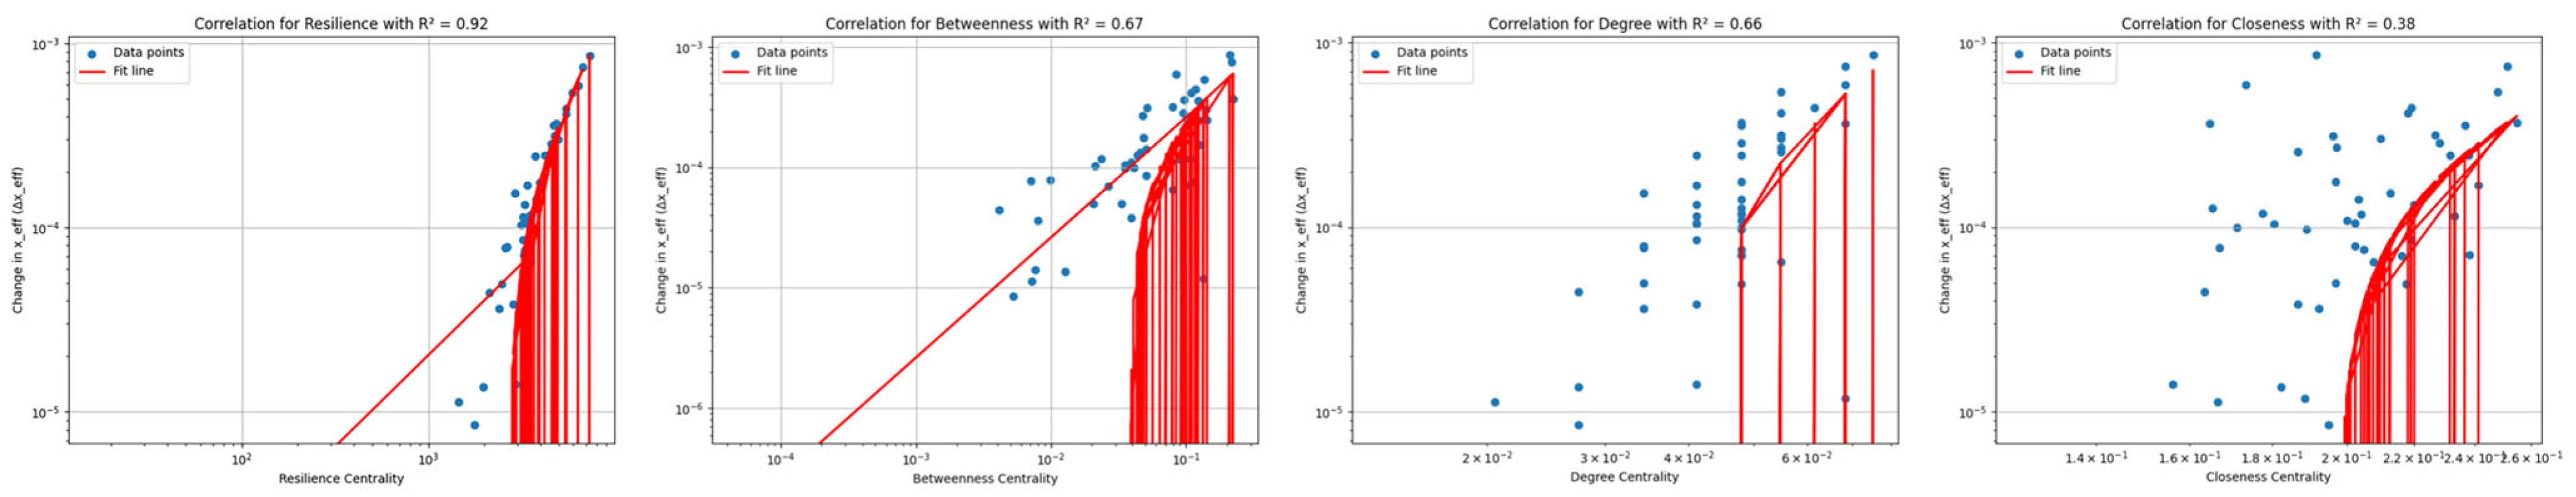
3.3.1. Advantages of Resilience Centrality

The results of the correlation analysis are shown in the Figure 10, with each subplot corresponding to one type of centrality metric. To clearly visualize the degree of correlation, regression curves were added to the scatter plots. Additionally, the R2 values were included in each plot to quantify the degree of correlation. Among the four types of centrality indicators, resilience centrality consistently showed that R2 values were greater than 0.9, whereas the R2 values for other indicators were significantly lower. This observation suggests that resilience centrality performs better in predicting the impact of node removal on system state changes compared to other centrality indicators. Considering the role of X e f f , in network resilience, we argue that resilience centrality can accurately quantify the influence of a node on overall system resilience, with a significantly better fit than the other three centrality metrics (degree, betweenness, and closeness centrality).

3.3.2. Network Resilience Assessment

In scenario a, critical nodes were mainly located within or around the built-up area of Wuhan, consistent with previous studies [75]. In scenario b, critical nodes were primarily found at the edges of the central urban area and peripheral regions. The number of key nodes in scenario a (15 nodes) was lower than in scenario b (26 nodes). Based on the selected attack strategies, nodes and corridors were ranked by importance and removed in order. Network resilience was calculated under different removal rates, and resilience change curves were plotted accordingly.
In the node attack scenarios (Figure 11a for scenario a and Figure 11b for scenario b), we observed that in scenario a, as the removal rate increased, the network’s structural and quality resilience declined rapidly. When the node removal rate reached approximately 15%, both functional and quality resilience experienced sharp drops of around 50%, indicating substantial network disruption and the critical importance of these nodes to network structure. Structural resilience declined more gradually but dropped below 0.5 when the removal rate reached 32%, marking severe network degradation. When the removal rate exceeded 25%, overall network resilience nearly vanished. In Figure 11b, a similar pattern was observed: functional and quality resilience were the first to fall below 0.5 as the removal rate increased. Functional resilience dropped below 0.5 at around a 25% removal rate and experienced a sharp collapse from 0.3166 to 0.2350 (a 25.8% reduction) at 40% removal. Quality resilience declined more slowly in the early phase, but collapsed when the removal rate reached approximately 50%, and dropped below 0.5 at around 60%, indicating that late-stage attacks have a significantly intensified impact on system quality resilience. Structural resilience declined more gradually and fell below 0.5 at about 40% removal, reflecting a critical loss of structural integrity during the mid-stage of the attack. The fastest decline in structural resilience occurred between the 50–65% removal range, with a 32.4% decrease. Once the removal rate exceeded 50%, overall network resilience fell below 30%.
In the scenario c (Figure 11c), structural resilience showed a significant drop of approximately 1.05% when the removal rate reached 15%. At a 40% removal rate, structural resilience dropped below 0.5, with the most dramatic decline occurring between 60 and 75%, where values decreased from 0.838 to 0.424. When the removal rate reached 25%, functional resilience fell out of the stable range and dropped below 0.5 with a sudden decrease of around 40%. At 40% removal, functional resilience plummeted from 0.932 to 0.745, indicating rapid functional collapse due to damage to key corridors. SE resilience remained more fragile than the other indicators; when the removal rate reached 25%, quality resilience quickly fell below 0.8, significantly affecting overall network performance. As the removal rate increased to 45%, corridor quality resilience experienced a sharp decline of about 30%, and overall quality resilience progressively diminished. With removal rates reaching 50%, overall network resilience dropped below 0.5, signifying a severe deterioration of system performance. When removal exceeded 50%, total network resilience declined to 0.3, at which point basic functional operations could no longer be maintained.
When removal rates reached certain thresholds, we observed substantial changes in the curves of quality, structural, or functional resilience, indicating that the removed nodes or corridors had significant impacts on network connectivity. We treated the removal rate at the point of dramatic change as the resilience threshold. It was found that when network importance was measured by degree, betweenness, and closeness centralities, the resilience value of Wuhan’s BHN fell within the range of 0.25–0.3. When resilience centrality was included in the resilience assessment, the BHN resilience value ranged from 0.5 to 0.53. Under the intentional corridor attack scenario, resilience began to decline notably between 15% and 25% removal rates, and all resilience metrics dropped below 0.5 beyond a 50% removal rate, indicating near-complete loss of overall network resilience. Therefore, the resilience value of Wuhan’s BHN can be classified into two ranges: 0.3 and 0.5.

4. Discussion

4.1. Ecological Security Pattern in International Wetland Cities

In 2022, Wuhan was listed among the second batch of International Wetland Cities. Wetland landscapes are vital for human livelihoods and ecological balance. As a major metropolis in central China and a vital node in the middle reaches of the Yangtze River, Wuhan’s wetland resources are indispensable for regional ecological stability and the sustainable development of society and the economy [76]. Wuhan holds a key position within China’s national ecological security strategy [77]. However, rapid urban expansion and population concentration have led to severe fragmentation of the existing urban landscape [46]. Ecological networks can mitigate the destructive effects of urban sprawl by connecting fragmented ecological sources to maintain species exchange [63,78]. Therefore, constructing urban ecological networks and identifying critical nodes and corridors are fundamental requirements for wetland city conservation and restoration planning [46]. Such spatial planning strategies not only alleviate edge effects caused by habitat fragmentation [79] but also offer effective technical pathways for maintaining regional biodiversity [78,80]. However, due to the lack of clear species-specific information, these strategies are often difficult to implement in practice [6,20,81]. Moreover, recent research on wetland cities has largely overlooked ecological network construction based on specific species, which further limits the effectiveness of conservation efforts.
As one of the International Wetland Cities and a critical stopover and overwintering site for migratory birds along the East Asian–Australasian Flyway [82,83], Wuhan is a meaningful case study for wetland city conservation. Unlike previous studies that maintained biodiversity goals within generalized regional spatial models, our study integrates species distribution modeling with data on dozens of key bird populations and diverse environmental variables to construct the bird habitat network [84]. This approach effectively mitigates the adverse impacts of land intensification and landscape fragmentation in wetland cities [20], enhances the accuracy of ecological source identification, and aligns with the higher biodiversity conservation standards expected of strategic sites like international wetland cities. In addition to surface landscape heterogeneity, resistance surfaces are influenced by species’ mobility and sensitivity to barriers [85]. Previous research has shown that elevation and height significantly impede bird presence and diversity in urban areas [86,87]. Earlier studies have primarily relied on 2D landscape surfaces for resistance modeling, overlooking the critical vertical dimension. Our study incorporates vertical barriers in urban built environments by including building height and elevation indicators in the resistance surface construction [6,88], thereby simulating bird migration paths across complex urban terrains. The 3D resistance surface we developed has proven effective in reducing the deviation between the BHN model and real-world conditions [89].
Furthermore, prior urban ecological network studies have typically focused on natural sources at urban fringes, such as national parks [90,91] and large nature reserves [92]. However, our findings indicate that many bird habitats in Wuhan are situated within the built-up area [19], including small wetlands previously overlooked in ecological assessments [93]. Existing evidence suggests that intra-urban green spaces and wetlands often exhibit high species richness at the local scale and can provide essential resources for bird breeding and migration [94]. Moreover, some low-quality habitat patches may have relatively low resistance and thus do not significantly impede species movement [13]. Small urban wetlands are therefore critical for maintaining the structure and function of ecological networks [95]. Accordingly, suitable habitat patches within built-up areas should be considered as sources within ecological networks [78,96], emphasizing that ecological source identification must account for human-related factors rather than relying solely on landscape quality [19,97]. Our results offer new insights for the design of ecological conservation networks in international wetland cities.

4.2. Contributions to the Study of Spatial Resilience

This study yields several key findings. First and foremost, resilience centrality is highly correlated with changes in system states (R2 > 0.9) within bird habitat networks, indicating that it effectively captures the relationship between node resilience and actual network elasticity. Furthermore, resilience centrality outperforms traditional centrality metrics (degree, betweenness, and closeness) in explaining network resilience, demonstrating its greater generalizability and accuracy in assessing ecological network stability. This finding aligns with prior research [68] and expands the applicability of resilience centrality in complex network analyses. Second, in the simulated attack scenarios, the resilience thresholds derived using resilience centrality (scenario b) differ significantly from those obtained using traditional centralities (scenario a). This highlights the influence of surrounding nodes on individual node behavior [98] and suggests that static topological indices alone are insufficient for accurately describing the system’s dynamic responses to perturbations [32]. After node removal, network resilience may decline non-linearly rather than collapse immediately, necessitating a deeper understanding of the network’s dynamic properties. Comparative analysis reveals distinct characteristics among resilience centrality, percolation theory, and cascade failure models as dynamic network metrics. Percolation theory demonstrates strong generality across arbitrary network structures, but primarily facilitates static or quasi-static analyses, focusing on topological robustness during structural failures rather than dynamic processes like node state transitions or load redistribution [99]. In contrast, cascade failure models specialize in dynamic propagation mechanisms, making them ideal for simulating load-driven chain reactions; however, their implementation requires computationally intensive parameterization of load capacities and failure propagation rules [100]. Resilience centrality addresses these limitations by synergistically combining dynamic equations with network topology to quantify individual nodes’ restorative contributions [68]. Unlike traditional centrality measures, such as degree, closeness, and betweenness centrality, resilience centrality incorporates both topological and dynamic characteristics of the system. Consequently, these frameworks serve complementary purposes: percolation theory excels in quasi-static structural analysis, cascade models simulate dynamic behavioral responses, while resilience centrality provides node-level resilience quantification, each optimally deployed according to specific research objectives.
This study makes several theoretical contributions to the BHN field. Most notably, it introduces a resilience centrality metric based on weighted networks and actual ecological attributes to assess network resilience and identify critical regions in international wetland cities. Previous studies have typically relied on static topological attributes (e.g., degree, betweenness, closeness) to quantify ecological resilience [66,70], lacking consideration of the dynamic properties and cascading effects of complex networks [101]. Our results demonstrate that the dynamic interactions between nodes significantly affect system-level resilience. Moreover, many ecological network studies utilize unweighted networks [102], which fail to reflect real-world characteristics such as corridor width and resistance [103]. In contrast, resilience centrality is determined by the node degree and weighted nearest-neighbor degree, incorporating corridor weights and addressing the limitations of unweighted networks. This reinforces the advantage of resilience centrality in evaluating node influence on network resilience. In terms of resilience indicators, this study introduces the concept of source quality resilience, which integrates ecological sensitivity and patch size to characterize the quality dimension of network resilience. While previous studies have emphasized structural or functional resilience [34,66], they often overlook how physical node characteristics affect resilience [39]. Our proposed three-dimensional resilience framework (structural, functional, and quality) advances previous research by offering a more comprehensive understanding of BHN resilience through topological and physical node attributes. By analyzing changes in resilience at specific removal thresholds [104], we can identify strategic ecological zones [105]. Priority protection is recommended for critical nodes and links that are few but exhibit rapid resilience decline, thereby maximizing conservation benefits under limited resources. This approach provides practical guidance for international wetland city conservation.

4.3. Spatial Management Policies to Enhance Urban Ecological Network Resilience

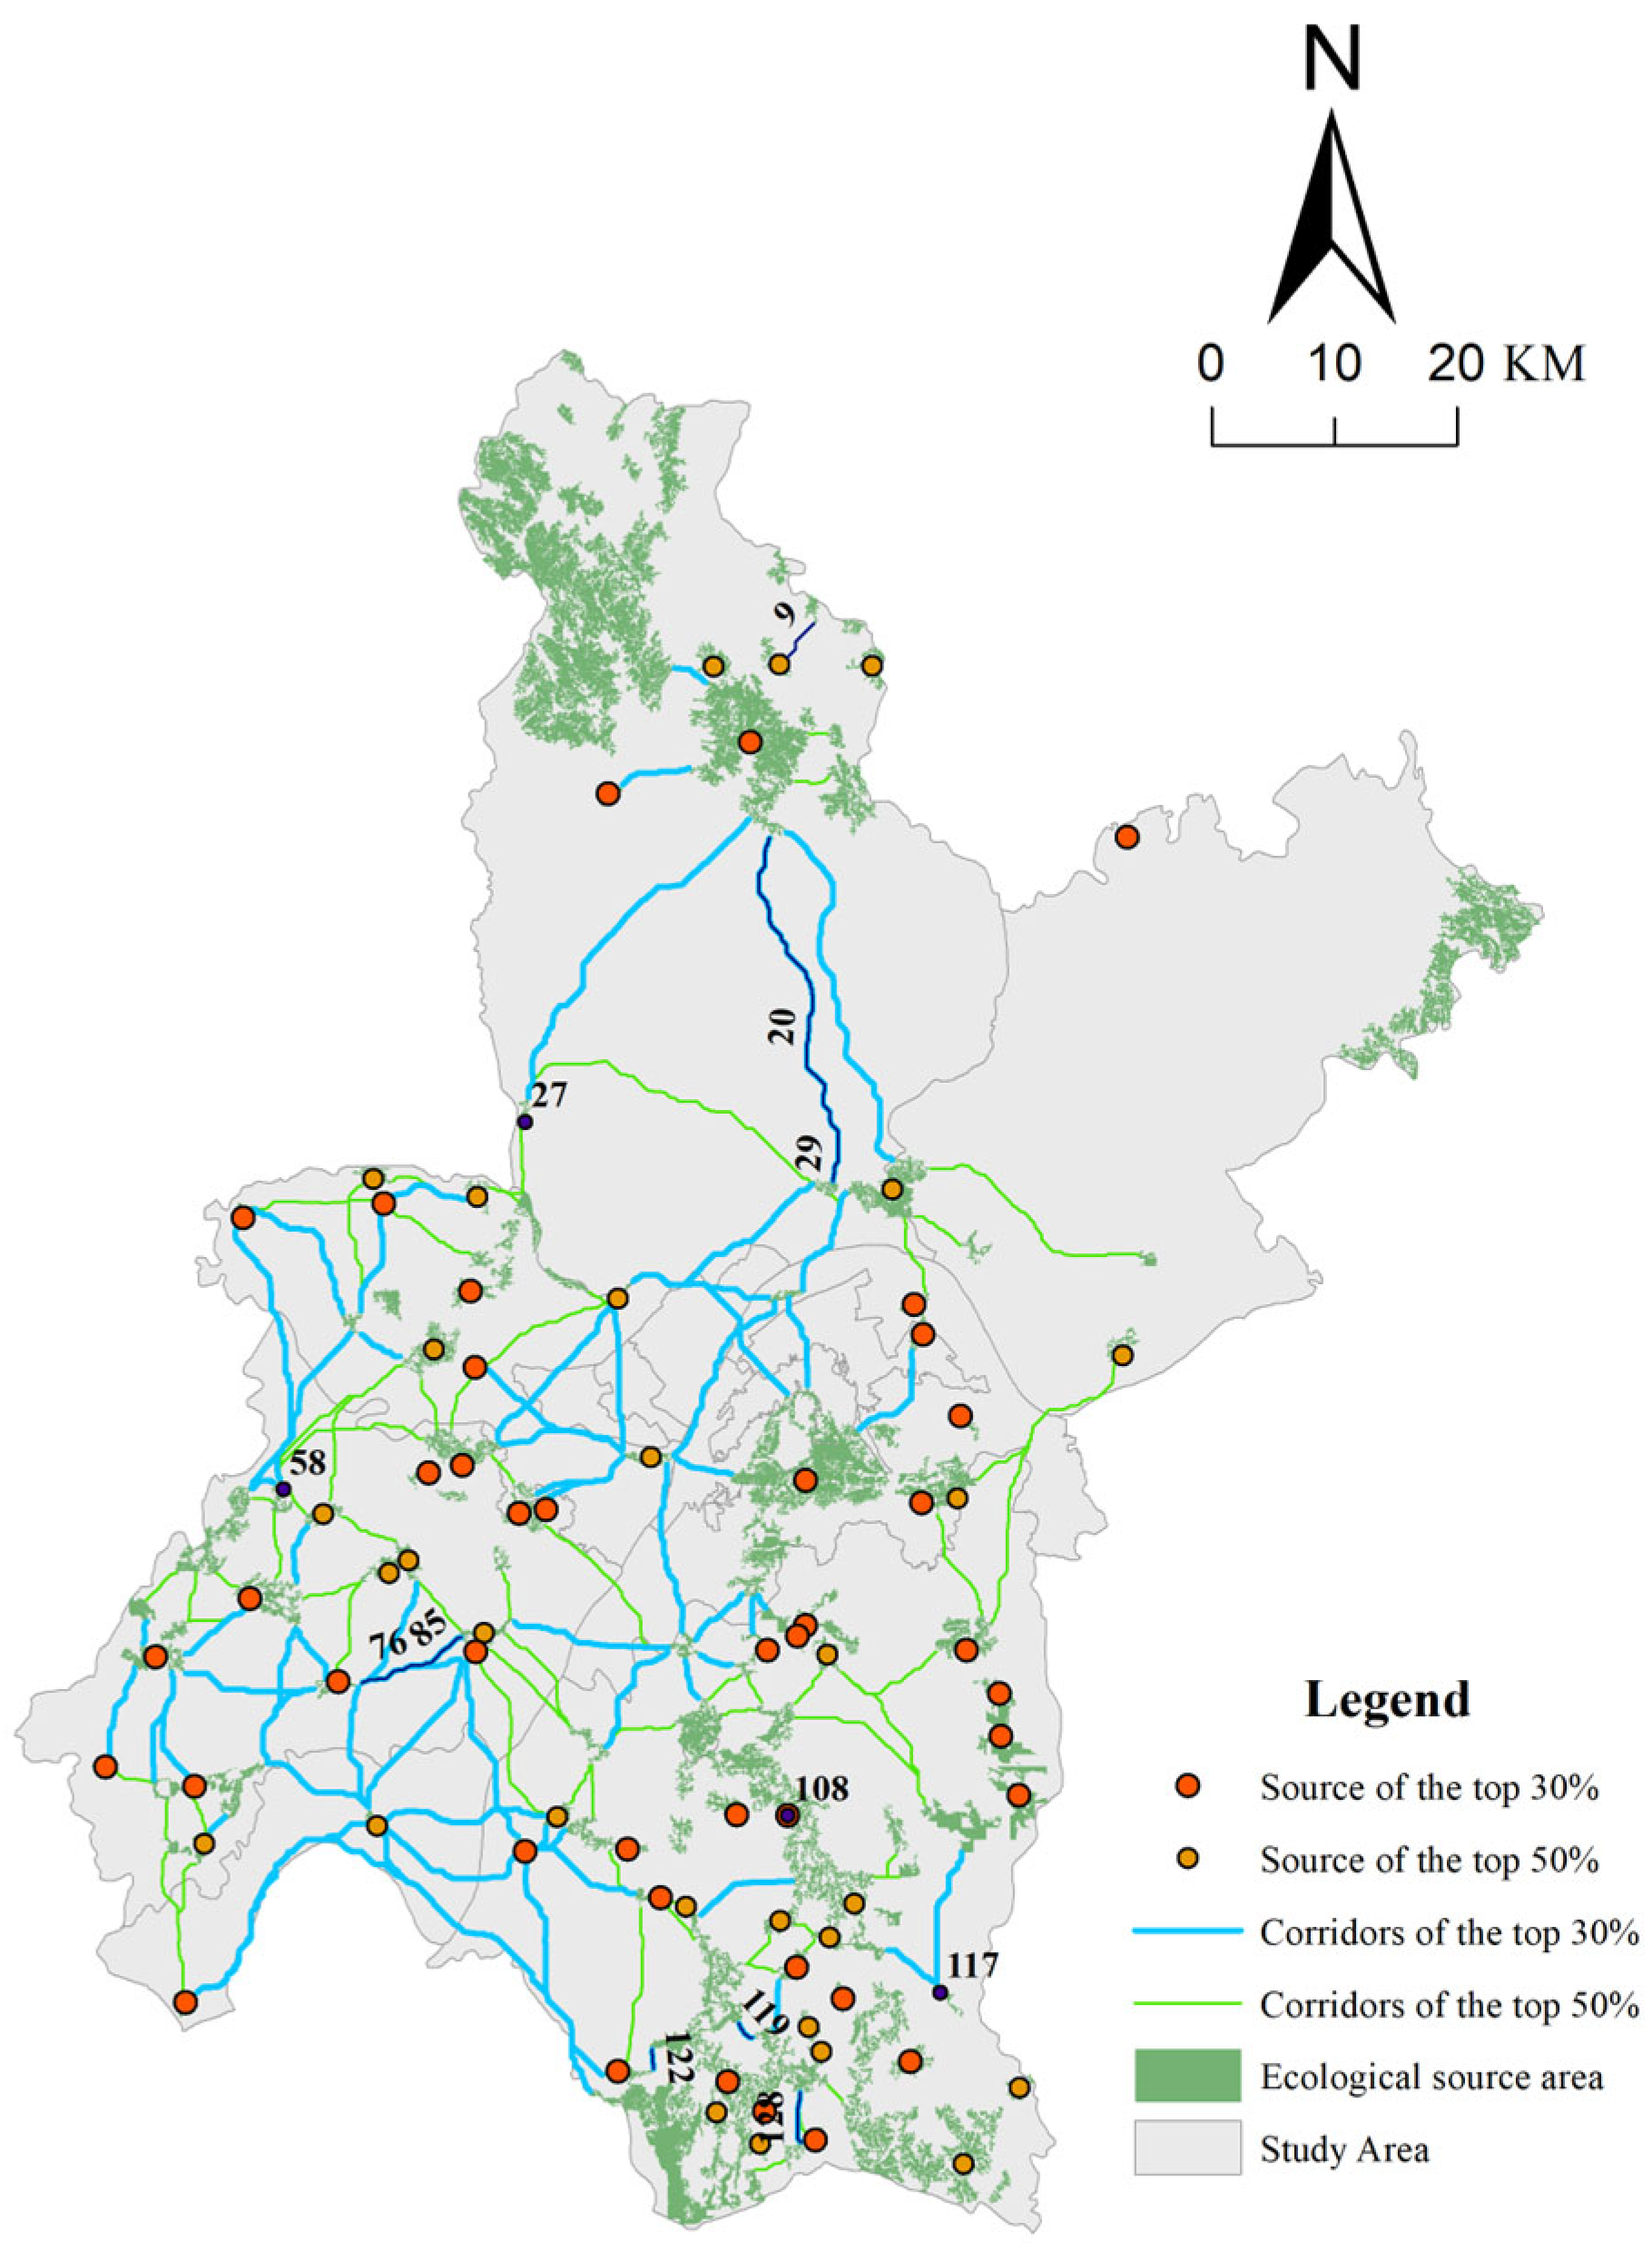
4.3.1. Strategic Space Identification

Based on scenario simulations and resilience assessments, this study aims to identify BHN spaces crucial for maintaining network resilience. These key spatial units significantly influence the network’s capacity to withstand disturbances. A hierarchical classification defined strategic areas within the BHN [106]. In the simulation results, scenario a produced resilience values between 25% and 30%, scenario b between 50% and 53%, and scenario c around 30%. The top 30% of regions with the greatest impact on overall resilience were classified as primary strategic spaces; regions ranked between the top 30–50% were designated as secondary strategic spaces. The remaining areas were categorized as tertiary strategic spaces. Key habitats (e.g., patches 58, 108, 117, and 27) and ecological corridors (e.g., 119–128, 9–12, 122–147, 128–138, 76–85, and 20–29) were identified as the core of strategic zones (Figure 12). These areas are predominantly located in the southern and southwestern parts of Wuhan, with secondary zones mainly concentrated in the southern urban periphery. These regions are essential for maintaining BHN resilience. Managing and protecting them from development and disturbance can, in theory, maximize the ecological network’s stability.

4.3.2. Planning Control Strategies

Protecting and restoring urban ecological networks is vital for regional ecological stability. In the face of external disturbances, maintaining adequate ecological areas and ensuring corridor connectivity are crucial for enhancing network resilience. Strategic areas are both crucial for network resilience and inherently vulnerable [107]. Therefore, a dual approach involving positive and negative control measures is required, supported by a regulatory checklist [43].
Based on Wuhan’s ecological context and the results of the resilience analysis, important nodes and corridors can be divided into two categories: protected areas and buffer areas. Protected areas are critical to network stability and should be prioritized for proactive conservation efforts to increase risk resistance and enhance biodiversity [108]. The positive list prioritizes ecological restoration initiatives aimed at rehabilitating degraded ecosystems while enhancing regional habitat quality and biodiversity, Key measures include establishing ecological corridors to improve landscape connectivity between core habitats and strengthen dynamic interactions among ecological nodes [107]. Implementation focuses on wetland biodiversity conservation (e.g., Donghu Lake, Niushan Lake), aquatic ecosystem restoration, and developing suburban park clusters. Strategic habitat connectivity enhancement will be achieved through constructing ecological stepping stones linking critical restoration areas like Lingshan–Jiangjun Mountain. Development activities are strictly regulated through statutory constraints that balance ecological protection with urban expansion, particularly enforcing the “Five Access Prohibitions” in ecological baseline zones per Wuhan’s Basic Ecological Control Line Regulations. When key areas are disturbed, the network will quickly suffer great losses, and those fragile areas are categorized as buffer nodes, which need to be controlled, often through restrictive policies. The main objective of negative policy implementation is to reduce the risk of nodes and corridors being exposed to interference, and strict restrictions and controls may be implemented. The main policies may include restricting the access of people; prohibiting any construction activities that replace the ecological functions of important areas with other types of uses, delineating the red line of ecological protection in conjunction with the Wuhan Territorial Spatial Master Plan (2021–2035), and clarifying the areas in which development is prohibited; prohibiting the destruction of trees and natural environments; and, for the subject of restricted development in the buffer zones, through the use of the “volume rate transfer” to give economic compensation; deploy “air–sky–ground” integrated monitoring network in the buffer zone, and utilize modern satellite remote sensing and drones and other technologies to realize dynamic monitoring of human activities in the area; suggest amending the Wuhan Environmental Protection Regulations to clarify the penalty standards for damaging behaviors in the buffer zone, and incorporate them into the municipal environmental protection regulations. It is recommended that the Regulations on Environmental Protection of Wuhan City be revised to clarify the standards of punishment for buffer zone destruction and incorporate them into the key contents of municipal environmental protection inspection.

4.4. Limitations and Future Directions

This study proposes an integrated framework for evaluating multidimensional resilience in bird habitat networks of international wetland cities, but several limitations remain. First, aligning with prior research [19,109], even after applying outlier removal and RSEI-based corrections, citizen science data may overlook species diversity in remote urban areas. The AHP method, which relies on expert scoring within a hierarchical framework, carries inherent subjectivity. In addition, the spatial distribution of bird habitats was inferred primarily using species distribution models and the RSEI, which, while accurate, may not fully capture fine-scale behavioral and habitat preferences of different bird species. There are some limitations in using a fixed ratio to partition the dataset, and this approach may lead to insufficient data in the test set when the sample size is small, affecting the reliability of the model performance assessment. Temporal dynamics such as seasonal migration and human disturbances were also not considered, potentially affecting the temporal validity of network construction. Second, resilience assessment was conducted using static network models, lacking time-series analyses. This static approach may overlook how network structures and functions change across temporal scales, particularly under rapid urbanization and climate change. While simulated targeted attacks help explore network vulnerability, they may not fully capture the socio-ecological complexities of wetland cities. Incorporating real-world management scenarios and policy responses could enhance the realism of resilience assessments. Third, resilience centrality has appeared rarely in previous ecological network studies, but it is an important indicator that reveals the ability of key nodes to influence system stability in complex networks. This study does not account for heterogeneity among ecological nodes. The one-dimensional equation approximation assumes the system state can be described by a single variable (e.g., X e f f ), but ecological networks may involve multiple variables (e.g., population size and resource availability).
Although the existing species assemblage covers the major groups of endangered birds in Wuhan, a stratified and species-specific modeling approach is recommended for future studies focusing on a particular species group to balance conservation priorities [6,20]. If the proportion of endangered species is high, the model may ignore low probability areas or be over-sensitive due to insufficient sample size caused by the rarity of endangered species, and further manual correction is needed. If the proportion of migratory birds increases, the model may emphasize the connectivity of stopover sites during migration [110], and may consider introducing satellite and GPS tracking data [111], Migration Flow Network (MFN) [112], and machine learning models [113] to further improve the model construction. Future research should consider integrating long-term biological monitoring data [114], multi-species movement tracking [115], and broader expert-led field investigations to further validate and refine habitat identification results. Additionally, landscape-driven dynamic land-use simulation scenarios [48,116] may further improve dynamic assessments of ecological resilience and evaluate the long-term effectiveness of planning strategies. Extending this framework to comparative studies across multiple international wetland cities could help identify both universal strategies and location-specific policies, advancing coordinated biodiversity conservation and ecological security globally. Our work is exploratory, introducing this approach into a resilience metric framework for ecological networks. Results show promising explanatory power: resilience centrality effectively captures dynamic responses to network disturbances. Future studies should incorporate actual dynamical equations (e.g., Lotka–Volterra models) and parameters to better reflect system states and responses, further validating the applicability of resilience centrality in EN.

5. Conclusions

This study proposed a comprehensive framework for assessing the multidimensional resilience of the bird habitat network in Wuhan, an international wetland city. Despite its abundant wetland resources, Wuhan’s ecosystem has been severely affected by rapid urbanization and land use changes, posing significant ecological challenges. Utilizing citizen science data with explicit species information, along with various modeling approaches—including species distribution models and RSEI—we identified key bird habitats, constructed a three-dimensional resistance surface, and developed an ecological network integrating critical corridors and sources essential for biodiversity conservation.
Our analysis demonstrates that resilience centrality provides a more effective representation of network resilience changes compared to traditional centrality measures as it highlights the dynamic relationships between nodes and the overall robustness of the network. Additionally, resilience metrics that incorporate the actual physical attributes of habitat sources more accurately reflect real-world conditions. We further delineated strategic areas that are vital for maintaining resilience and proposed targeted management policies to enhance the overall resilience of BHN. The main findings are as follows. (1) A total of 147 bird habitats were identified, primarily distributed in the continuous forested green spaces in the southern and southwestern parts of the city. In contrast, ecological sources within the densely built-up central urban area were more fragmented and smaller in size, indicating a priority area for future ecological restoration. (2) The spatial distribution of bird ecological corridors exhibited marked heterogeneity. The southwestern and southern parts of the network were relatively dense, whereas the central urban area and northeastern corner had fewer corridors, reflecting pronounced landscape fragmentation. (3) Based on multidimensional resilience metrics, under the scenario of intentional attacks considering resilience centrality, the rate of network resilience decline was slower than under conventional centrality-based attack scenarios. According to the assessment of both node and edge attack scenarios, the ecological network’s resilience threshold falls within two levels: 30% and 50%. (4) The strategic ecological spaces are mainly composed of habitats “58, 108, 117, 27” and corridors “131–147, 9–12, 122–130, 128–138, 76–85, 20–29”, primarily located in the southern part of Wuhan. This study provides critical scientific support for ecological conservation policymaking in international wetland cities. It emphasizes the need to incorporate biodiversity protection into future urban development through strategic planning, safeguarding ecological sources and corridors, and mitigating ecological risks to achieve ecological balance and social harmony.

Supplementary Materials

The following supporting information can be downloaded at: https://www.mdpi.com/article/10.3390/land14061166/s1.

Author Contributions

Conceptualization, A.T. and Y.Z.; methodology, A.T.; software, A.T., H.O. and Z.L.; writing—original draft preparation, A.T., H.O. and Z.L.; writing—review and editing, A.T., H.O. and Y.Z.; visualization, H.O.; supervision, Y.Z. All authors have read and agreed to the published version of the manuscript.

Funding

This research was funded by the National Key Research and Development Program of China (2023YFB3906703) and the National Natural Science Foundation of China (72174158, 72474164).

Data Availability Statement

Data supporting the key findings of this study are included in the Results section. Additional raw data can be obtained from the corresponding author upon reasonable request.

Conflicts of Interest

The authors declare that they have no known competing financial interests or personal relationships that could appear to have influenced the work reported in this paper.

Abbreviations

The following abbreviations are used in this manuscript:
BHNBird Habitat Network
EAAFEast Asian–Australasian Flyway
RSEIRemote Sensing Ecological Index
MSPAmorphological spatial pattern analysis
AHPanalytic hierarchy process
MaxEntMaximum Entropy
SDMsspecies distribution models

References

  1. Goyette, J.-O.; Cimon-Morin, J.; Mendes, P.; Thériault, M.; Pellerin, S.; Poulin, M. Planning wetland protection and restoration for the safeguard of ecosystem service flows to beneficiaries. Landsc. Ecol. 2021, 36, 2691–2706. [Google Scholar] [CrossRef]
  2. Luo, J.; Zhu, L.; Fu, H. Construction of wetland ecological network based on MSPA-Conefor-MCR: A case study of Haikou City. Ecol. Indic. 2024, 166, 112329. [Google Scholar] [CrossRef]
  3. Qu, Y.; Gong, H.; Zheng, Y.; Shi, J.; Zeng, X.; Yang, H.; Wang, J.; Zhenguo, N.; Li, L.; Wang, S.; et al. Global conservation priorities for wetlands and setting post-2025 targets. Commun. Earth Environ. 2024, 5, 4. [Google Scholar] [CrossRef]
  4. Wang, Z.; Zhao, X.; Cui, L.; Lei, Y.; Guo, Z.; Wang, J.; Li, J.; Zhai, X.; Wang, R.; Li, W. Identification and optimization of urban wetland ecological networks in highly urbanized areas: A case study of Haidian District, Beijing. Ecol. Indic. 2025, 170, 113028. [Google Scholar] [CrossRef]
  5. Zhu, L.; Zhu, K.; Zeng, X. Evolution of landscape pattern and response of ecosystem service value in international wetland cities: A case study of Nanchang City. Ecol. Indic. 2023, 155, 110987. [Google Scholar] [CrossRef]
  6. Xu, W.; Yang, H.; Chen, Z.; Shi, R.; Liu, Y.; Chen, J. Enhancing bird habitat networks in metropolitan areas: Resilience assessment and improvement strategies—A case study from Shanghai. Sci. Total Environ. 2024, 954, 176316. [Google Scholar] [CrossRef]
  7. Jiang, X.; Mao, D.; Zhen, J.; Wang, J.; Van de Voorde, T. Exploring the conservation of historic avian corridors under urbanization threats in China: A case study of egrets in the Greater Bay Area. Sci. Total Environ. 2024, 948, 174921. [Google Scholar] [CrossRef]
  8. Ikin, K.; Yong, D.L.; Lindenmayer, D.B. Effectiveness of woodland birds as taxonomic surrogates in conservation planning for biodiversity on farms. Biol. Conserv. 2016, 204, 411–416. [Google Scholar] [CrossRef]
  9. Eastough, A.; Hughes, M.; Newsome, D. Investigating the extent that different recreational users of urban wetlands value birds and bird habitat. Int. J. Geoheritage Parks 2024, 12, 434–445. [Google Scholar] [CrossRef]
  10. Wu, Z.; Cheng, S.; Xu, K.; Qian, Y. Ecological network resilience evaluation and ecological strategic space identification based on complex network theory: A case study of Nanjing city. Ecol. Indic. 2024, 158, 111604. [Google Scholar] [CrossRef]
  11. Forman, R.T.T. Some general principles of landscape and regional ecology. Landsc. Ecol. 1995, 10, 133–142. [Google Scholar] [CrossRef]
  12. Yu, K. Security patterns and surface model in landscape ecological planning. Landsc. Urban Plan. 1996, 36, 1–17. [Google Scholar] [CrossRef]
  13. Peng, J.; Yang, Y.; Liu, Y.X.; Hu, Y.N.; Du, Y.Y.; Meersmans, J.; Qiu, S.J. Linking ecosystem services and circuit theory to identify ecological security patterns. Sci. Total Environ. 2018, 644, 781–790. [Google Scholar] [CrossRef] [PubMed]
  14. Huang, X.; Wang, X.; Li, J.; Zhang, M.; Chen, S.; Xu, B.; Nie, W. Multi-Scale Applicability Analysis of Three Ecological Network Construction Methods in Resilience Assessment. Land Degrad. Dev. 2025, 36, 1594–1613. [Google Scholar] [CrossRef]
  15. Hashemi, R.; Darabi, H.; Hashemi, M.; Wang, J. Graph theory in ecological network analysis: A systematic review for connectivity assessment. J. Clean. Prod. 2024, 472, 143504. [Google Scholar] [CrossRef]
  16. Wang, S.; Wu, M.; Hu, M.; Fan, C.; Wang, T.; Xia, B. Promoting landscape connectivity of highly urbanized area: An ecological network approach. Ecol. Indic. 2021, 125, 107487. [Google Scholar] [CrossRef]
  17. Li, S.; Zhao, Y.; Xiao, W.; Yue, W.; Wu, T. Optimizing ecological security pattern in the coal resource-based city: A case study in Shuozhou City, China. Ecol. Indic. 2021, 130, 108026. [Google Scholar] [CrossRef]
  18. Dong, X.; Wang, F.; Fu, M. Research progress and prospects for constructing ecological security pattern based on ecological network. Ecol. Indic. 2024, 168, 112800. [Google Scholar] [CrossRef]
  19. Yang, H.; Xu, W.; Chen, Z.; Xie, X.; Yu, J.; Lei, X.; Guo, S.; Ding, Z. Ecological network construction for bird communities in high-density urban areas: A perspective of integrated approaches. Ecol. Indic. 2024, 158, 111592. [Google Scholar] [CrossRef]
  20. Shen, Z.; Yin, H.; Kong, F.; Wu, W.; Sun, H.; Su, J.; Tian, S. Enhancing ecological network establishment with explicit species information and spatially coordinated optimization for supporting urban landscape planning and management. Landsc. Urban Plan. 2024, 248, 105079. [Google Scholar] [CrossRef]
  21. Liu, X.; Zhao, Y.; Zeng, D.; Yang, Y.; Li, W.; Kang, Y.; Wei, G.; Yuan, X.; Bo, S.; Si, X. Characterizing bird species for achieving the win-wins of conserving biodiversity and enhancing regulating ecosystem services in urban green spaces. Urban For. Urban Green. 2023, 87, 128064. [Google Scholar] [CrossRef]
  22. Pan, J.; Liang, J.; Zhao, C. Identification and optimization of ecological security pattern in arid inland basin based on ordered weighted average and ant colony algorithm: A case study of Shule River basin, NW China. Ecol. Indic. 2023, 154, 110588. [Google Scholar] [CrossRef]
  23. Song, S.; Gong, Y.; Yu, Y. Integrating pattern, process, and function in urban landscape ecological network planning: A case study of Harbin central city. Ecol. Indic. 2024, 159, 111671. [Google Scholar] [CrossRef]
  24. Liu, Z.; Huang, Q.; Tang, G. Identification of urban flight corridors for migratory birds in the coastal regions of Shenzhen city based on three-dimensional landscapes. Landsc. Ecol. 2021, 36, 2043–2057. [Google Scholar] [CrossRef]
  25. Lin, J.; Wang, Y.; Lin, Z.; Li, S. National-scale connectivity analysis and construction of forest networks based on graph theory: A case study of China. Ecol. Eng. 2025, 216, 107639. [Google Scholar] [CrossRef]
  26. Geng, J.; Yu, K.; Sun, M.; Xie, Z.; Huang, R.; Wang, Y.; Zhao, Q.; Liu, J. Construction and Optimisation of Ecological Networks in High-Density Central Urban Areas: The Case of Fuzhou City, China. Remote Sens. 2023, 15, 5666. [Google Scholar] [CrossRef]
  27. Men, D.; Pan, J. Incorporating network topology and ecosystem services into the optimization of ecological network: A case study of the Yellow River Basin. Sci. Total Environ. 2024, 912, 169004. [Google Scholar] [CrossRef]
  28. Su, H.; Du, M.; Liu, Q.; Kang, X.; Zhao, L.; Zheng, W.; Liao, Z. Assessment of regional Ecosystem Service Bundles coupling climate and land use changes. Ecol. Indic. 2024, 169, 112844. [Google Scholar] [CrossRef]
  29. Zhao, J.; Yu, Q.; Xu, C.; Ma, J.; Liu, W.; Sun, W.; Miao, Y.; Nawaz, T. Integrated approach for ecological restoration and ecological spatial network optimization with multiple ecosystem functions in mining areas. Ecol. Indic. 2023, 156, 111141. [Google Scholar] [CrossRef]
  30. Yang, H.; Yan, S.; Wang, X.; Li, C.; Meng, H.; Yao, Q. Constructing Ecological Networks Based on Ecosystem Services and Network Analysis in Chongqing, China. Land 2024, 13, 662. [Google Scholar] [CrossRef]
  31. Lu, Y.; Liu, Y.; Huang, D.; Liu, Y. Evolution Analysis of Ecological Networks Based on Spatial Distribution Data of Land Use Types Monitored by Remote Sensing in Wuhan Urban Agglomeration, China, from 2000 to 2020. Remote Sens. 2022, 14, 2618. [Google Scholar] [CrossRef]
  32. Xiang, Q.; Yu, H.; Huang, H.; Li, F.; Ju, L.; Hu, W.; Yu, P.; Deng, Z.; Chen, Y. Assessing the resilience of complex ecological spatial networks using a cascading failure model. J. Clean. Prod. 2024, 434, 140014. [Google Scholar] [CrossRef]
  33. Shi, J.; Zhang, D.; Yin, J.; Wang, Z.; Feng, H.; Liu, Y.; Shi, P. Regional ecosystem health improvement pathway design based on ecological network optimization. Ecol. Indic. 2025, 173, 113377. [Google Scholar] [CrossRef]
  34. Wang, T.; Li, H.; Huang, Y. The complex ecological network’s resilience of the Wuhan metropolitan area. Ecol. Indic. 2021, 130, 108101. [Google Scholar] [CrossRef]
  35. Zhou, Y.; Zheng, Z.; Wu, Z.; Guo, C.; Chen, Y. Construction and evaluation of ecological networks in highly urbanised regions: A case study of the Guangdong-Hong Kong-Macao greater Bay Area, China. Ecol. Indic. 2023, 152, 110336. [Google Scholar] [CrossRef]
  36. Wang, T.; Huang, Y.; Cheng, J.; Xiong, H.; Ying, Y.; Feng, Y.; Wang, J. Construction and optimization of watershed-scale ecological network based on complex network method: A case study of Erhai Lake Basin in China. Ecol. Indic. 2024, 160, 111794. [Google Scholar] [CrossRef]
  37. Cumming, G.S. Spatial resilience: Integrating landscape ecology, resilience, and sustainability. Landsc. Ecol. 2011, 26, 899–909. [Google Scholar] [CrossRef]
  38. Kéfi, S.; Saade, C.; Berlow, E.; Sarmento Cabral, J.; Fronhofer, E. Scaling up our understanding of tipping points. Philos. Trans. R. Soc. B Biol. Sci. 2022, 377, 20210386. [Google Scholar] [CrossRef]
  39. Huang, L.; Wang, J.; Cheng, H. Spatiotemporal changes in ecological network resilience in the Shandong Peninsula urban agglomeration. J. Clean. Prod. 2022, 339, 130681. [Google Scholar] [CrossRef]
  40. McCloy, M.W.D.; Andringa, R.K.; Maness, T.J.; Smith, J.A.; Grace, J.K. Promoting urban ecological resilience through the lens of avian biodiversity. Front. Ecol. Evol. 2024, 12, 1302002. [Google Scholar] [CrossRef]
  41. McCloy, M.W.D.; Andringa, R.K.; Grace, J.K. Resilience of Avian Communities to Urbanization and Climate Change: An Integrative Review. Front. Conserv. Sci. 2022, 3, 918873. [Google Scholar] [CrossRef]
  42. Epele, L.B.; Grech, M.G.; Manzo, L.M.; Macchi, P.A.; Hermoso, V.; Miserendino, M.L.; Bonada, N.; Cañedo-Argüelles, M. Identifying high priority conservation areas for Patagonian wetlands biodiversity. Biodivers. Conserv. 2021, 30, 1359–1374. [Google Scholar] [CrossRef]
  43. Hong, W.; Guo, R.; Li, X.; Liao, C. Measuring urban ecological network resilience: A disturbance scenario simulation method. Cities 2022, 131, 104057. [Google Scholar] [CrossRef]
  44. Tan, C.; Ma, J.; Yan, Y.; Hong, G.; Wu, X. Identifying priority wetlands for the conservation of waterbirds in Wuhan, China. Ecol. Indic. 2023, 157, 111240. [Google Scholar] [CrossRef]
  45. Greening, W. Wuhan Shares Wetland Conservation Experience with the World. Available online: https://ylj.wuhan.gov.cn/xwdt/mtbd_12295/202410/t20241017_2469620.shtml (accessed on 10 March 2025).
  46. Cui, X.Y.; Li, H.B.; Wang, T. Structural Evolution and Stability Simulation of Wetland Ecological Network: A Case Study of Wuhan City, China. Wetlands 2022, 42, 73. [Google Scholar] [CrossRef]
  47. Zhai, H.; Lv, C.; Liu, W.; Yang, C.; Fan, D.; Wang, Z.; Guan, Q. Understanding Spatio-Temporal Patterns of Land Use/Land Cover Change under Urbanization in Wuhan, China, 2000–2019. Remote Sens. 2021, 13, 3331. [Google Scholar] [CrossRef]
  48. Gao, J.; Gong, J.; Li, Y.; Yang, J.; Liang, X. Ecological network assessment in dynamic landscapes: Multi-scenario simulation and conservation priority analysis. Land Use Policy 2024, 139, 107059. [Google Scholar] [CrossRef]
  49. Poisson, A.C.; McCullough, I.M.; Cheruvelil, K.S.; Elliott, K.C.; Latimore, J.A.; Soranno, P.A. Quantifying the contribution of citizen science to broad-scale ecological databases. Front. Ecol. Environ. 2020, 18, 19–26. [Google Scholar] [CrossRef]
  50. Elith, J.; Phillips, S.J.; Hastie, T.; Dudík, M.; Chee, Y.E.; Yates, C.J. A statistical explanation of MaxEnt for ecologists. Divers. Distrib. 2011, 17, 43–57. [Google Scholar] [CrossRef]
  51. Warren, D.L.; Seifert, S.N. Ecological niche modeling in Maxent: The importance of model complexity and the performance of model selection criteria. Ecol. Appl. 2011, 21, 335–342. [Google Scholar] [CrossRef]
  52. Xu, C.; Yu, Q.; Wang, F.; Qiu, S.; Ai, M.; Zhao, J. Identifying and optimizing ecological spatial patterns based on the bird distribution in the Yellow River Basin, China. J. Environ. Manag. 2023, 348, 119293. [Google Scholar] [CrossRef] [PubMed]
  53. Kang, J.; Liu, M.; Qu, M.; Guang, X.; Chen, J.; Zhao, Y.; Huang, B. Identifying the potential soil pollution areas derived from the metal mining industry in China using MaxEnt with mine reserve scales (MaxEnt_MRS). Environ. Pollut. 2023, 329, 121687. [Google Scholar] [CrossRef]
  54. Shi, F.; Liu, S.; Sun, Y.; An, Y.; Zhao, S.; Liu, Y.; Li, M. Ecological network construction of the heterogeneous agro-pastoral areas in the upper Yellow River basin. Agric. Ecosyst. Environ. 2020, 302, 107069. [Google Scholar] [CrossRef]
  55. Shen, Z.; Wu, W.; Chen, S.; Tian, S.; Wang, J.; Li, L. A static and dynamic coupling approach for maintaining ecological networks connectivity in rapid urbanization contexts. J. Clean. Prod. 2022, 369, 133375. [Google Scholar] [CrossRef]
  56. Sun, D.; Wu, X.; Wen, H.; Ma, X.; Zhang, F.; Ji, Q.; Zhang, J. Ecological Security Pattern based on XGBoost-MCR model: A case study of the Three Gorges Reservoir Region. J. Clean. Prod. 2024, 470, 143252. [Google Scholar] [CrossRef]
  57. Tremblay, M.A.; St. Clair, C.C. Permeability of a heterogeneous urban landscape to the movements of forest songbirds. J. Appl. Ecol. 2011, 48, 679–688. [Google Scholar] [CrossRef]
  58. Bahía, R.; Lambertucci, S.A.; Speziale, K.L. Anthropogenic city noise affects the vocalizations of key forest birds. Biodivers. Conserv. 2024, 33, 2405–2421. [Google Scholar] [CrossRef]
  59. Konstantopoulos, K.; Moustakas, A.; Vogiatzakis, I.N. A spatially explicit impact assessment of road characteristics, road-induced fragmentation and noise on birds species in Cyprus. Biodiversity 2020, 21, 61–71. [Google Scholar] [CrossRef]
  60. Cicort-Lucaciu, A.; Keshta, H.V.; Popovici, P.V.; Munkácsi, D.; Telcean, I.C.; Gache, C. Urban avifauna distribution explained by road noise in an Eastern European city. Avian Res. 2022, 13, 100067. [Google Scholar] [CrossRef]
  61. Fijn, R.C.; Krijgsveld, K.L.; Poot, M.J.M.; Dirksen, S. Bird movements at rotor heights measured continuously with vertical radar at a Dutch offshore wind farm. Ibis 2015, 157, 558–566. [Google Scholar] [CrossRef]
  62. Hager, S.B.; Cosentino, B.J.; McKay, K.J.; Monson, C.; Zuurdeeg, W.; Blevins, B. Window area and development drive spatial variation in bird-window collisions in an urban landscape. PLoS ONE 2013, 8, e53371. [Google Scholar] [CrossRef] [PubMed]
  63. Chen, R.; Carruthers-Jones, J.; Carver, S.; Wu, J. Constructing urban ecological corridors to reflect local species diversity and conservation objectives. Sci. Total Environ. 2024, 907, 167987. [Google Scholar] [CrossRef] [PubMed]
  64. Kaplan, G. Human-Caused High Direct Mortality in Birds: Unsustainable Trends and Ameliorative Actions. Animals 2024, 15, 73. [Google Scholar] [CrossRef]
  65. Wang, X.; Xie, X.; Wang, Z.; Lin, H.; Liu, Y.; Xie, H.; Liu, X. Construction and Optimization of an Ecological Security Pattern Based on the MCR Model: A Case Study of the Minjiang River Basin in Eastern China. Int. J. Environ. Res. Public Health 2022, 19, 8370. [Google Scholar] [CrossRef]
  66. Li, J.; Nie, W.; Zhang, M.; Wang, L.; Dong, H.; Xu, B. Assessment and optimization of urban ecological network resilience based on disturbance scenario simulations: A case study of Nanjing city. J. Clean. Prod. 2024, 438, 140812. [Google Scholar] [CrossRef]
  67. Liu, H.; Wang, Z.; Zhang, L.; Tang, F.; Wang, G.; Li, M. Construction of an ecological security network in the Fenhe River Basin and its temporal and spatial evolution characteristics. J. Clean. Prod. 2023, 417, 137961. [Google Scholar] [CrossRef]
  68. Zhang, Y.; Shao, C.; He, S.; Gao, J. Resilience centrality in complex networks. Phys. Rev. E 2020, 101, 022304. [Google Scholar] [CrossRef] [PubMed]
  69. De Montis, A.; Ganciu, A.; Cabras, M.; Bardi, A.; Peddio, V.; Caschili, S.; Massa, P.; Cocco, C.; Mulas, M. Resilient ecological networks: A comparative approach. Land Use Policy 2019, 89, 104207. [Google Scholar] [CrossRef]
  70. Wang, Y.; Cai, Y.; Xie, Y.; Chen, L.; Zhang, P. An integrated approach for evaluating dynamics of urban eco-resilience in urban agglomerations of China. Ecol. Indic. 2023, 146, 109859. [Google Scholar] [CrossRef]
  71. Chen, H.; Yan, W.; Li, Z.; Wende, W.; Xiao, S. A framework for integrating ecosystem service provision and connectivity in ecological spatial networks: A case study of the Shanghai metropolitan area. Sustain. Cities Soc. 2024, 100, 105018. [Google Scholar] [CrossRef]
  72. Carey, M.; Boland, J.; Keppel, G. Generalized Logarithmic Species-Area Relationship Resolves the Arrhenius-Gleason Debate. Environ. Model. Assess. 2023, 28, 491–499. [Google Scholar] [CrossRef]
  73. Gurka, M.J.; Edwards, L.J.; Nylander-French, L. Testing transformations for the linear mixed model. Comput. Stat. Data Anal. 2007, 51, 4297–4307. [Google Scholar] [CrossRef]
  74. Kong, F.; Yin, H.; Nakagoshi, N.; Zong, Y. Urban green space network development for biodiversity conservation: Identification based on graph theory and gravity modeling. Landsc. Urban Plan. 2010, 95, 16–27. [Google Scholar] [CrossRef]
  75. Zheng, Q.; Zeng, J.; Luo, J.; Cui, J.; Sun, X. Spatial Structure and Space Governance of Ecological Network in Wuhan City. Econ. Geogr. 2018, 38, 191–199. [Google Scholar] [CrossRef]
  76. Yan, Y.; Gan, X.; Zhao, Y.; Liao, Q.; Huang, C. Wetland Landscape Dynamics and Multi-Functional Assessment of Wuhan City, China. Water 2024, 16, 2914. [Google Scholar] [CrossRef]
  77. Wang, L.; Li, Z.; Zhang, Z. City profile: Wuhan 2004–2020. Cities 2022, 123, 103585. [Google Scholar] [CrossRef]
  78. Qian, M.; Huang, Y.; Cao, Y.; Wu, J.; Xiong, Y. Ecological network construction and optimization in Guangzhou from the perspective of biodiversity conservation. J. Environ. Manag. 2023, 336, 117692. [Google Scholar] [CrossRef]
  79. Saunders, D.A.; Hobbs, R.J.; Margules, C.R. Biological Consequences of Ecosystem Fragmentation: A Review. Conserv. Biol. 1991, 5, 18–32. [Google Scholar] [CrossRef]
  80. Tarabon, S.; Dutoit, T.; Isselin-Nondedeu, F. Pooling biodiversity offsets to improve habitat connectivity and species conservation. J. Environ. Manag. 2021, 277, 111425. [Google Scholar] [CrossRef]
  81. Beger, M.; Metaxas, A.; Balbar, A.C.; McGowan, J.A.; Daigle, R.; Kuempel, C.D.; Treml, E.A.; Possingham, H.P. Demystifying ecological connectivity for actionable spatial conservation planning. Trends Ecol. Evol. 2022, 37, 1079–1091. [Google Scholar] [CrossRef]
  82. Liu, B.; Gao, H.; Wang, J.; Zhu, Z.; Qian, C.; Fan, Z.; He, K. Migratory Connectivity of Zhejiang, with a Critical Stopover in East Asian-Australasian Flyway, Based on Recovery Data. Animals 2024, 14, 2404. [Google Scholar] [CrossRef] [PubMed]
  83. Wu, H.; Chen, J.; Zeng, G.; Xu, J.; Sang, L.; Liu, Q.; Dai, J.; Xiong, W.; Yuan, Z.; Wang, Y.; et al. Effects of Early Dry Season on Habitat Suitability for Migratory Birds in China’s Two Largest Freshwater Lake Wetlands after the Impoundment of Three Gorges Dam. J. Environ. Inform. 2019, 36, 82–92. [Google Scholar] [CrossRef]
  84. Modica, G.; Praticò, S.; Laudari, L.; Ledda, A.; Di Fazio, S.; De Montis, A. Implementation of multispecies ecological networks at the regional scale: Analysis and multi-temporal assessment. J. Environ. Manag. 2021, 289, 112494. [Google Scholar] [CrossRef]
  85. Salgueiro, P.A.; Valerio, F.; Silva, C.; Mira, A.; Rabaça, J.E.; Santos, S.M. Multispecies landscape functional connectivity enhances local bird species’ diversity in a highly fragmented landscape. J. Environ. Manag. 2021, 284, 112066. [Google Scholar] [CrossRef]
  86. Utama, A.; Nurvianto, S. The building size effect on bird community assemblages in tropical urban ecosystem. Biodiversitas J. Biol. Divers. 2022, 23, 5. [Google Scholar] [CrossRef]
  87. Villegas, M.; Garitano-Zavala, Á. Bird community responses to different urban conditions in La Paz, Bolivia. Urban Ecosyst. 2010, 13, 375–391. [Google Scholar] [CrossRef]
  88. Yang, Y.; Zhou, Y.; Feng, Z.; Wu, K. Making the Case for Parks: Construction of an Ecological Network of Urban Parks Based on Birds. Land 2022, 11, 1144. [Google Scholar] [CrossRef]
  89. Fei, F.; Yin, H.; Kong, F.; Chen, J.; Liu, J.; Song, X. Comparative analysis of ecological network pattern using 2D and 3D information in main urban area of Nanjing, China. Acta Ecol. Sin. 2020, 40, 5534–5545. [Google Scholar]
  90. Hou, W.; Zhou, W.; Li, J.; Li, C. Simulation of the potential impact of urban expansion on regional ecological corridors: A case study of Taiyuan, China. Sustain. Cities Soc. 2022, 83, 103933. [Google Scholar] [CrossRef]
  91. Li, P.; Cao, H.; Sun, W.; Chen, X. Quantitative evaluation of the rebuilding costs of ecological corridors in a highly urbanized city: The perspective of land use adjustment. Ecol. Indic. 2022, 141, 109130. [Google Scholar] [CrossRef]
  92. Sun, X.; Long, Z.; Jia, J. A multi-scale Maxent approach to model habitat suitability for the giant pandas in the Qionglai mountain, China. Glob. Ecol. Conserv. 2021, 30, e01766. [Google Scholar] [CrossRef]
  93. Kim, B.; Park, J. Random ecological networks that depend on ephemeral wetland complexes. Ecol. Eng. 2020, 156, 105972. [Google Scholar] [CrossRef]
  94. Chan, M.; Tsang, T.P.N.; Dingle, C.; Early, R.; Sorte, C.J.B.; Bonebrake, T.C. Microhabitat coverage influences avian species composition more than habitat heterogeneity in Hong Kong urban parks. Urban For. Urban Green. 2024, 101, 128519. [Google Scholar] [CrossRef]
  95. Kim, B.; Lee, J.; Park, J. Role of small wetlands on the regime shift of ecological network in a wetlandscape. Environ. Res. Commun. 2022, 4, 041006. [Google Scholar] [CrossRef]
  96. Li, Z.; Liu, Y.; Zeng, H. Application of the MaxEnt model in improving the accuracy of ecological red line identification: A case study of Zhanjiang, China. Ecol. Indic. 2022, 137, 108767. [Google Scholar] [CrossRef]
  97. Blazquez-Cabrera, S.; Gastón, A.; Beier, P.; Garrote, G.; Simón, M.Á.; Saura, S. Influence of separating home range and dispersal movements on characterizing corridors and effective distances. Landsc. Ecol. 2016, 31, 2355–2366. [Google Scholar] [CrossRef]
  98. Xing, Y.; Lu, J.; Chen, S.; Dissanayake, S. Vulnerability analysis of urban rail transit based on complex network theory: A case study of Shanghai Metro. Public Transp. 2017, 9, 501–525. [Google Scholar] [CrossRef]
  99. Li, M.; Liu, R.R.; Lü, L.Y.; Hu, M.B.; Xu, S.Q.; Zhang, Y.C. Percolation on complex networks: Theory and application. Phys. Rep. 2021, 907, 1–68. [Google Scholar] [CrossRef]
  100. Dang, H.; Bai, J.; Lü, Y.; Li, J. The cascade failure model under ecological network is effective for quantifying the resilience of urban regions. Sustain. Cities Soc. 2024, 114, 105749. [Google Scholar] [CrossRef]
  101. Xia, Y.; Wang, C.; Shen, H.-L.; Song, H. Cascading failures in spatial complex networks. Phys. A Stat. Mech. Appl. 2020, 559, 125071. [Google Scholar] [CrossRef]
  102. Gao, C.; Pan, H.; Wang, M.; Zhang, T.; He, Y.; Cheng, J.; Yao, C. Identifying priority areas for ecological conservation and restoration based on circuit theory and dynamic weighted complex network: A case study of the Sichuan Basin. Ecol. Indic. 2023, 155, 111064. [Google Scholar] [CrossRef]
  103. Xie, Y.; Wang, Q.; Xie, M.; Shibata, S. Construction feasibility evaluation for potential ecological corridors under different widths: A case study of Chengdu in China. Landsc. Ecol. Eng. 2023, 19, 381–399. [Google Scholar] [CrossRef]
  104. Zhang, K.; Pan, J. Evaluation of ecological network resilience using OWA and attack scenario simulation in the Gansu section of the Yellow River Basin, NW China. Environ. Res. Commun. 2024, 6, 8. [Google Scholar] [CrossRef]
  105. Sasaki, T.; Furukawa, T.; Iwasaki, Y.; Seto, M.; Mori, A.S. Perspectives for ecosystem management based on ecosystem resilience and ecological thresholds against multiple and stochastic disturbances. Ecol. Indic. 2015, 57, 395–408. [Google Scholar] [CrossRef]
  106. Lu, Y.; Liu, Y.; Xing, L.; Liu, Y. Robustness test of multiple protection strategies for ecological networks from the perspective of complex networks: Evidence from Wuhan Metropolitan Area, China. Land Degrad. Dev. 2023, 34, 52–71. [Google Scholar] [CrossRef]
  107. Zhao, Y.; Zhang, M.; Zhao, D.; Duo, L.; Lu, C. Optimizing the ecological network of resource-based cities to enhance the resilience of regional ecological networks. Environ. Sci. Pollut. Res. 2024, 31, 17182–17205. [Google Scholar] [CrossRef] [PubMed]
  108. Calderón-Contreras, R.; Quiroz-Rosas, L.E. Analysing scale, quality and diversity of green infrastructure and the provision of Urban Ecosystem Services: A case from Mexico City. Ecosyst. Serv. 2017, 23, 127–137. [Google Scholar] [CrossRef]
  109. Callaghan, C.T.; Bino, G.; Major, R.E.; Martin, J.M.; Lyons, M.B.; Kingsford, R.T. Heterogeneous urban green areas are bird diversity hotspots: Insights using continental-scale citizen science data. Landsc. Ecol. 2019, 34, 1231–1246. [Google Scholar] [CrossRef]
  110. Guo, F.; Buler, J.J.; Smolinsky, J.A.; Wilcove, D.S. Autumn stopover hotspots and multiscale habitat associations of migratory landbirds in the eastern United States. Proc. Natl. Acad. Sci. USA 2023, 120, e2203511120. [Google Scholar] [CrossRef]
  111. Walker, J.; Therrien, J.-F.; Bégin-Marchand, C.; Côté, P.; Terrigeol, A.; Gagnon, F.; Tremblay, J.A. Insights from a decade of using the Motus network to track boreal bird species from Observatoire d’oiseaux de Tadoussac, Québec to temperate and tropical wintering grounds. J. Field Ornithol. 2025, 96, 2. [Google Scholar] [CrossRef]
  112. Taylor, C.M.; Laughlin, A.J.; Hall, R.J. The response of migratory populations to phenological change: A Migratory Flow Network modelling approach. J. Anim. Ecol. 2016, 85, 648–659. [Google Scholar] [CrossRef] [PubMed]
  113. Kudari, M.; Nandeppanavar, A.S.; Thotad, P.; Jatti, S.; Koti, S. A Machine Learning based approach for Bird Migration Detection and feature analysis with SHAP. In Proceedings of the 2024 IEEE North Karnataka Subsection Flagship International Conference (NKCon), Bagalkote, India, 21–22 September 2024; pp. 1–7. [Google Scholar]
  114. Haase, P.; Tonkin, J.D.; Stoll, S.; Burkhard, B.; Frenzel, M.; Geijzendorffer, I.R.; Häuser, C.; Klotz, S.; Kühn, I.; McDowell, W.H.; et al. The next generation of site-based long-term ecological monitoring: Linking essential biodiversity variables and ecosystem integrity. Sci. Total Environ. 2018, 613–614, 1376–1384. [Google Scholar] [CrossRef] [PubMed]
  115. Marrotte, R.R.; Bowman, J.; Brown, M.G.C.; Cordes, C.; Morris, K.Y.; Prentice, M.B.; Wilson, P.J. Multi-species genetic connectivity in a terrestrial habitat network. Mov. Ecol. 2017, 5, 21. [Google Scholar] [CrossRef] [PubMed]
  116. Geng, J.; Cheng, C.; Shen, S.; Dai, K.; Zhang, T. STAPLE: A land use/-cover change model concerning spatiotemporal dependency and properties related to landscape evolution. Environ. Model. Softw. 2024, 178, 106059. [Google Scholar] [CrossRef]
Figure 1. (a) Location of the study area in China. (b) Study area: Wuhan.
Land 14 01166 g001
Figure 2. Distribution of bird sites.
Land 14 01166 g002
Figure 3. Research framework.
Land 14 01166 g003
Figure 4. The selected five resistance surface factors.
Land 14 01166 g004
Figure 5. Principle of toughness centrality calculation.
Land 14 01166 g005
Figure 6. Network resilience measures [39].
Land 14 01166 g006
Figure 7. (a) MaxEnt, RESI simulation results; (b) PC1 of PCA; (c) Jackknife of AUC; (d) ROC curve of Maxent model.
Land 14 01166 g007
Figure 8. High-quality regional overlay extraction of MaxEnt and RESI to obtain the ecological source of birds in Wuhan City.
Land 14 01166 g008
Figure 9. Results of bird habitat network construction.
Land 14 01166 g009
Figure 10. Fitting results of centrality indicators.
Land 14 01166 g010
Figure 11. Results of network resilience analysis.
Land 14 01166 g011
Figure 12. Key strategic spaces.
Land 14 01166 g012
Table 1. Data sources.
VariableDescriptionData TypeResolutionSource
Bird point data-Excel-https://www.eBird.org;
https://www.gbif.org
Land useCLCDRaster30 mhttps://doi.org/10.5281/zenodo.12779975
Normalized Difference Vegetation IndexNDVIRaster30 mGoogle Earth Engine (GEE)
Fractional Vegetation CoverFVCRaster30 mhttps://doi.org/10.11888/Terre.tpdc.300590
Digital Elevation ModelDEMRaster30 mhttps://www.gscloud.cn/
Slope-Raster30 mCalculate in ArcGIS Pro
Aspect-Raster30 mCalculate in ArcGIS Pro
Road-Shape-http://www.openstreetmap.org/
Building height-Shape-https://doi.org/10.5281/zenodo.11397015
Table 2. Resistance factors.
Resistance FactorClassificationResistance ValueWeightResistance FactorClassificationResistance ValueWeight
Distance to Road>1500 m50.3523CLCDForest50.1449
900–1500 m10 Grassland5
600–900 m20 water10
300–600 m50 Cropland20
<300 m100 Impervious Surface100
NDVI0.9–1.050.2516Building height<20 m200.2437
0.8–0.910 20–50 m40
0.7–0.820 50–100 m60
0.6–0.730 100–200 m80
0.5–0.640 >200 m100
0.4–0.550 DEM<100 m50.0075
0.3–0.460 100–300 m20
0.2–0.370 >300 m50
0.1–0.280
0.0–0.190
Disclaimer/Publisher’s Note: The statements, opinions and data contained in all publications are solely those of the individual author(s) and contributor(s) and not of MDPI and/or the editor(s). MDPI and/or the editor(s) disclaim responsibility for any injury to people or property resulting from any ideas, methods, instructions or products referred to in the content.

