Article

Forest Fire Risk Prediction in South Korea Using Google Earth Engine: Comparison of Machine Learning Models

1
Department of Forestry and Environmental Systems, Kangwon National University, Chuncheon 24341, Republic of Korea
2
Department of Ecological Landscape Architecture Design, Kangwon National University, Chuncheon 24341, Republic of Korea
3
Division of Forest Science, Kangwon National University, Chuncheon 24341, Republic of Korea
*
Author to whom correspondence should be addressed.
Land 2025, 14(6), 1155; https://doi.org/10.3390/land14061155
Submission received: 15 April 2025 / Revised: 14 May 2025 / Accepted: 26 May 2025 / Published: 27 May 2025

Abstract

:
Forest fires pose significant threats to ecosystems, economies, and human lives. However, existing forest fire risk assessments are over-reliant on field data and expert-derived indices. Here, we assessed the nationwide forest fire risk in South Korea using a dataset of 2289 and 4578 fire and non-fire events between 2020 and 2023. Twelve remote sensing-based environmental variables were exclusively derived from Google Earth Engine, including climate, vegetation, topographic, and socio-environmental factors. After removing the snow equivalent variable owing to high collinearity, we trained three machine learning models: random forest, XGBoost, and artificial neural network, and evaluated their ability to predict forest fire risks. XGBoost showed the best performance (F1 = 0.511; AUC = 0.76), followed by random forest (F1 = 0.496) and artificial neural network (F1 = 0.468). DEM, NDVI, and population density consistently ranked as the most influential predictors. Spatial prediction maps from each model revealed consistent high-risk areas with some local prediction differences. These findings demonstrate the potential of integrating cloud-based remote sensing with machine learning for large-scale, high-resolution forest fire risk modeling and have implications for early warning systems and effective fire management in vulnerable regions. Future predictions can be improved by incorporating seasonal, real-time meteorological, and human activity data.

1. Introduction

Forests are a vital global resource, covering approximately 4 billion ha (~31% of the Earth’s land surface) and providing essential ecosystem services and livelihoods for many communities [1,2]. Forest fires pose a serious threat to forests as they can rapidly devastate vast areas, leading to extensive ecological and economic losses and endangering human lives [3,4]. Despite significant investment in fire prevention and suppression, millions of hectares of forests burn annually worldwide, underscoring the urgent need to improve forest fire risk assessment and management [5,6].
In recent decades, global forest fire activity has increased through a combination of climate change and human factors. Higher temperatures and prolonged droughts associated with global climate change have been linked to frequent and intense fires in many regions [7,8]. Moreover, several countries have experienced unprecedented “megafires” in recent years, such as the Australian Black Summer bushfires of 2019–2020, which burned over 8 million ha of vegetation, and extensive fires in the Amazon rainforest during 2019–2021, which were largely induced by humans for land clearing [9]. More recently, Canada experienced its worst forest fire season on record in 2023 (with ~17 million ha burned), with Mediterranean countries such as Greece also facing catastrophic forest fires under extreme heatwaves [10,11]. In 2024, a devastating wildfire in Maui, Hawaii, resulted in over 100 fatalities and widespread destruction of Lahaina town, marking one of the deadliest fires in U.S. history. Other severe wildfires have occurred in regions such as Chile, Australia, and Algeria, driven by persistent heatwaves and droughts. Thus, the frequency and severity of wildfires is continuing to rise, with climate warming and drying trends contributing to an order-of-magnitude increase in forest fire incidence since the 1980s [12,13,14]. Direct human influences are another major contributor; the vast majority of forest fires are ignited by human activities (accidental or intentional), with the expansion of communities into wildland areas heightening ignition risks and exposure at the wildland–urban interface [15,16,17]. These global trends highlight the need for advanced tools to predict and mitigate forest fire risks in the context of changing environmental and social conditions.
Historically, forest fire prediction and monitoring have relied on ground-based observations and relatively simple indices. Early detection is often performed by human lookouts in fire watchtowers, which is labor-intensive, provides limited coverage, and can only detect fires after ignition rather than predict their occurrence [18,19]. Over time, systematic fire danger rating systems have been developed to quantify forest fire risks based on weather conditions. A notable example is the Canadian Forest Fire Danger Rating System, which includes a fire weather index system that uses meteorological inputs (e.g., temperature, humidity, wind, and precipitation) from thousands of weather stations to estimate fire potential [20,21]. These traditional approaches are valuable for operational forecasting but also have limitations, providing only coarse-scale risk indicators that may not capture detailed variations in fuel moisture or ignition likelihood, particularly in regions with sparse ground data. Other conventional methods have incorporated expert knowledge and global information system (GIS)-based multi-criteria analysis. For example, weighting schemes such as the analytic hierarchy process have been used to combine factors (topography, vegetation, accessibility, etc.) into fire susceptibility maps [22,23]. However, these approaches often rely on subjective judgments and assume static relationships, which may not be generalizable across different landscapes or changing climatic conditions. Statistical modeling techniques (e.g., logistic regression) have also been applied to relate environmental variables to fire occurrence; however, these “shallow” models require careful selection of input features and can struggle with the complex, non-linear interactions that characterize forest fire phenomena [24,25]. Another inherent challenge is that large fires are relatively rare events compared to days with no fire, leading to highly imbalanced datasets that traditional methods cannot effectively handle [26,27].
These limitations have prompted a shift toward more data-driven and automated prediction approaches. Advances in remote sensing have opened new avenues for forest fire monitoring and risk assessments. Satellite observations provide continuous synoptic coverage of environmental variables that influence fire behavior, thereby overcoming the limitations of point-based ground measurements [28,29]. For example, sensors such as Moderate Resolution Imaging Spectroradiometer (MODIS) and Sentinel can retrieve vegetation health and fuel moisture indicators, including the normalized difference vegetation index (NDVI), land surface temperature, and drought stress, all of which are linked to fire susceptibility [30,31]. Such satellite-derived data enable mapping of fuel conditions and fire-prone areas over large and often inaccessible regions in near real-time. The use of remote sensing for active fire detection and burn scar mapping is now common practice, with programs such as NASA’s Fire Information for Resource Management System using thermal infrared imagery to locate fires globally [32,33]. These technological improvements have significantly enhanced our ability to understand and anticipate forest fires.
In particular, the emergence of cloud-based geospatial platforms has revolutionized the processing of abundant Earth observational data. Google Earth Engine (GEE) is a prime example that provides free access to a vast archive of multi-temporal satellite imagery (Landsat, Sentinel, MODIS, etc.) and offers powerful cloud-computing resources to process data on a global scale [34,35,36]. GEE can be used to efficiently derive environmental layers (e.g., vegetation indices, topography, and climate proxies) over large areas without the need for local high-performance computing [37]. This capability is particularly advantageous for forest fire studies, which often require long time series and high-resolution spatial data across broad regions. GEE has been successfully employed in recent forest fire research, for example, to generate national-scale burn severity maps and fire risk indices in near real-time [38,39]. The ability of the platform to handle big data and its integration of remote sensing and GIS functionalities have significantly streamlined the development of data-driven forest fire assessment models.
Considering the huge increase in available data, machine learning (ML) techniques have become increasingly important in forest fire prediction. ML algorithms excel at uncovering complex patterns in large datasets, making them suitable for analyzing the multiple factors contributing to fire occurrence [40]. Unlike traditional regression or index-based models, ML methods can model non-linear relationships and interactions among variables (e.g., vegetation conditions, weather, topography, and human activity) without being explicitly programmed, often achieving higher predictive performance [41,42]. Recent studies have demonstrated the efficacy of various ML models in forecasting forest fire dangers and mapping fire susceptibility. For example, decision tree ensemble methods, such as random forest and gradient boosting (e.g., XGBoost), have been used to predict forest fire occurrence or burned areas with high accuracy by learning from historical fire and environmental data [43,44,45]. Similarly, support vector machines (SVMs) and other kernel-based classifiers have been applied to delineate fire-prone zones and demonstrated robust results in some cases [46]. Researchers have also explored artificial neural networks (ANNs) for fire prediction, with both shallow networks and deeper architectures (multilayer perceptrons, convolutional, or recurrent networks) able to capture complex, non-linear dependencies in data [47,48].
In practice, each model has different strengths; for example, tree-based models tend to handle mixed data and variable importance well, whereas ANNs can approximate intricate functional relationships given sufficient data. However, no single algorithm is universally optimal for all scenarios; model performance varies according to the region, dataset, and parameter choices [49,50]. For example, Gholamnia et al. compared different approaches (logistic regression, decision trees, SVM, and ANN variants) for forest fire susceptibility mapping and found that the random forest model achieved the highest accuracy (area under the curve [AUC]: ~88%) [51]. Conversely, Kalantar et al. showed that a boosted regression tree and SVM yielded comparable success in predicting fire hotspots when using an optimal set of predictors [52]. These examples highlight the importance of evaluating multiple models. Additionally, incorporating socioeconomic and human variables can improve predictions; for example, a study in South Korea found that models such as the maximum entropy model identified areas near settlements as having the highest fire probabilities, reflecting the influence of human ignition at the forest–urban interface [53].
In this study, to exploit the growing availability of satellite data and proven benefits of ML, we integrated these tools for forest fire risk assessment. GEE provides an ideal environment for compiling and processing a suite of satellite-derived environmental variables (e.g., vegetation indices, land cover, elevation, and temperature anomalies) for model input. Therefore, we leveraged the GEE platform to evaluate forest fire vulnerability in South Korea using exclusively GEE-derived variables as predictors, in contrast to previous research that relies on ground measurements and expert-derived indices. Moreover, we compared the performance of three state-of-the-art ML models, including an ensemble tree model (random forest), a gradient boosting model (extreme gradient boosting; XGBoost), and an ANN, to determine the most effective approach for predicting forest fire risks in South Korea. This study provides support for developing an accurate and scalable forest fire prediction framework to promote forest management and disaster mitigation efforts in South Korea and beyond.

2. Materials and Methods
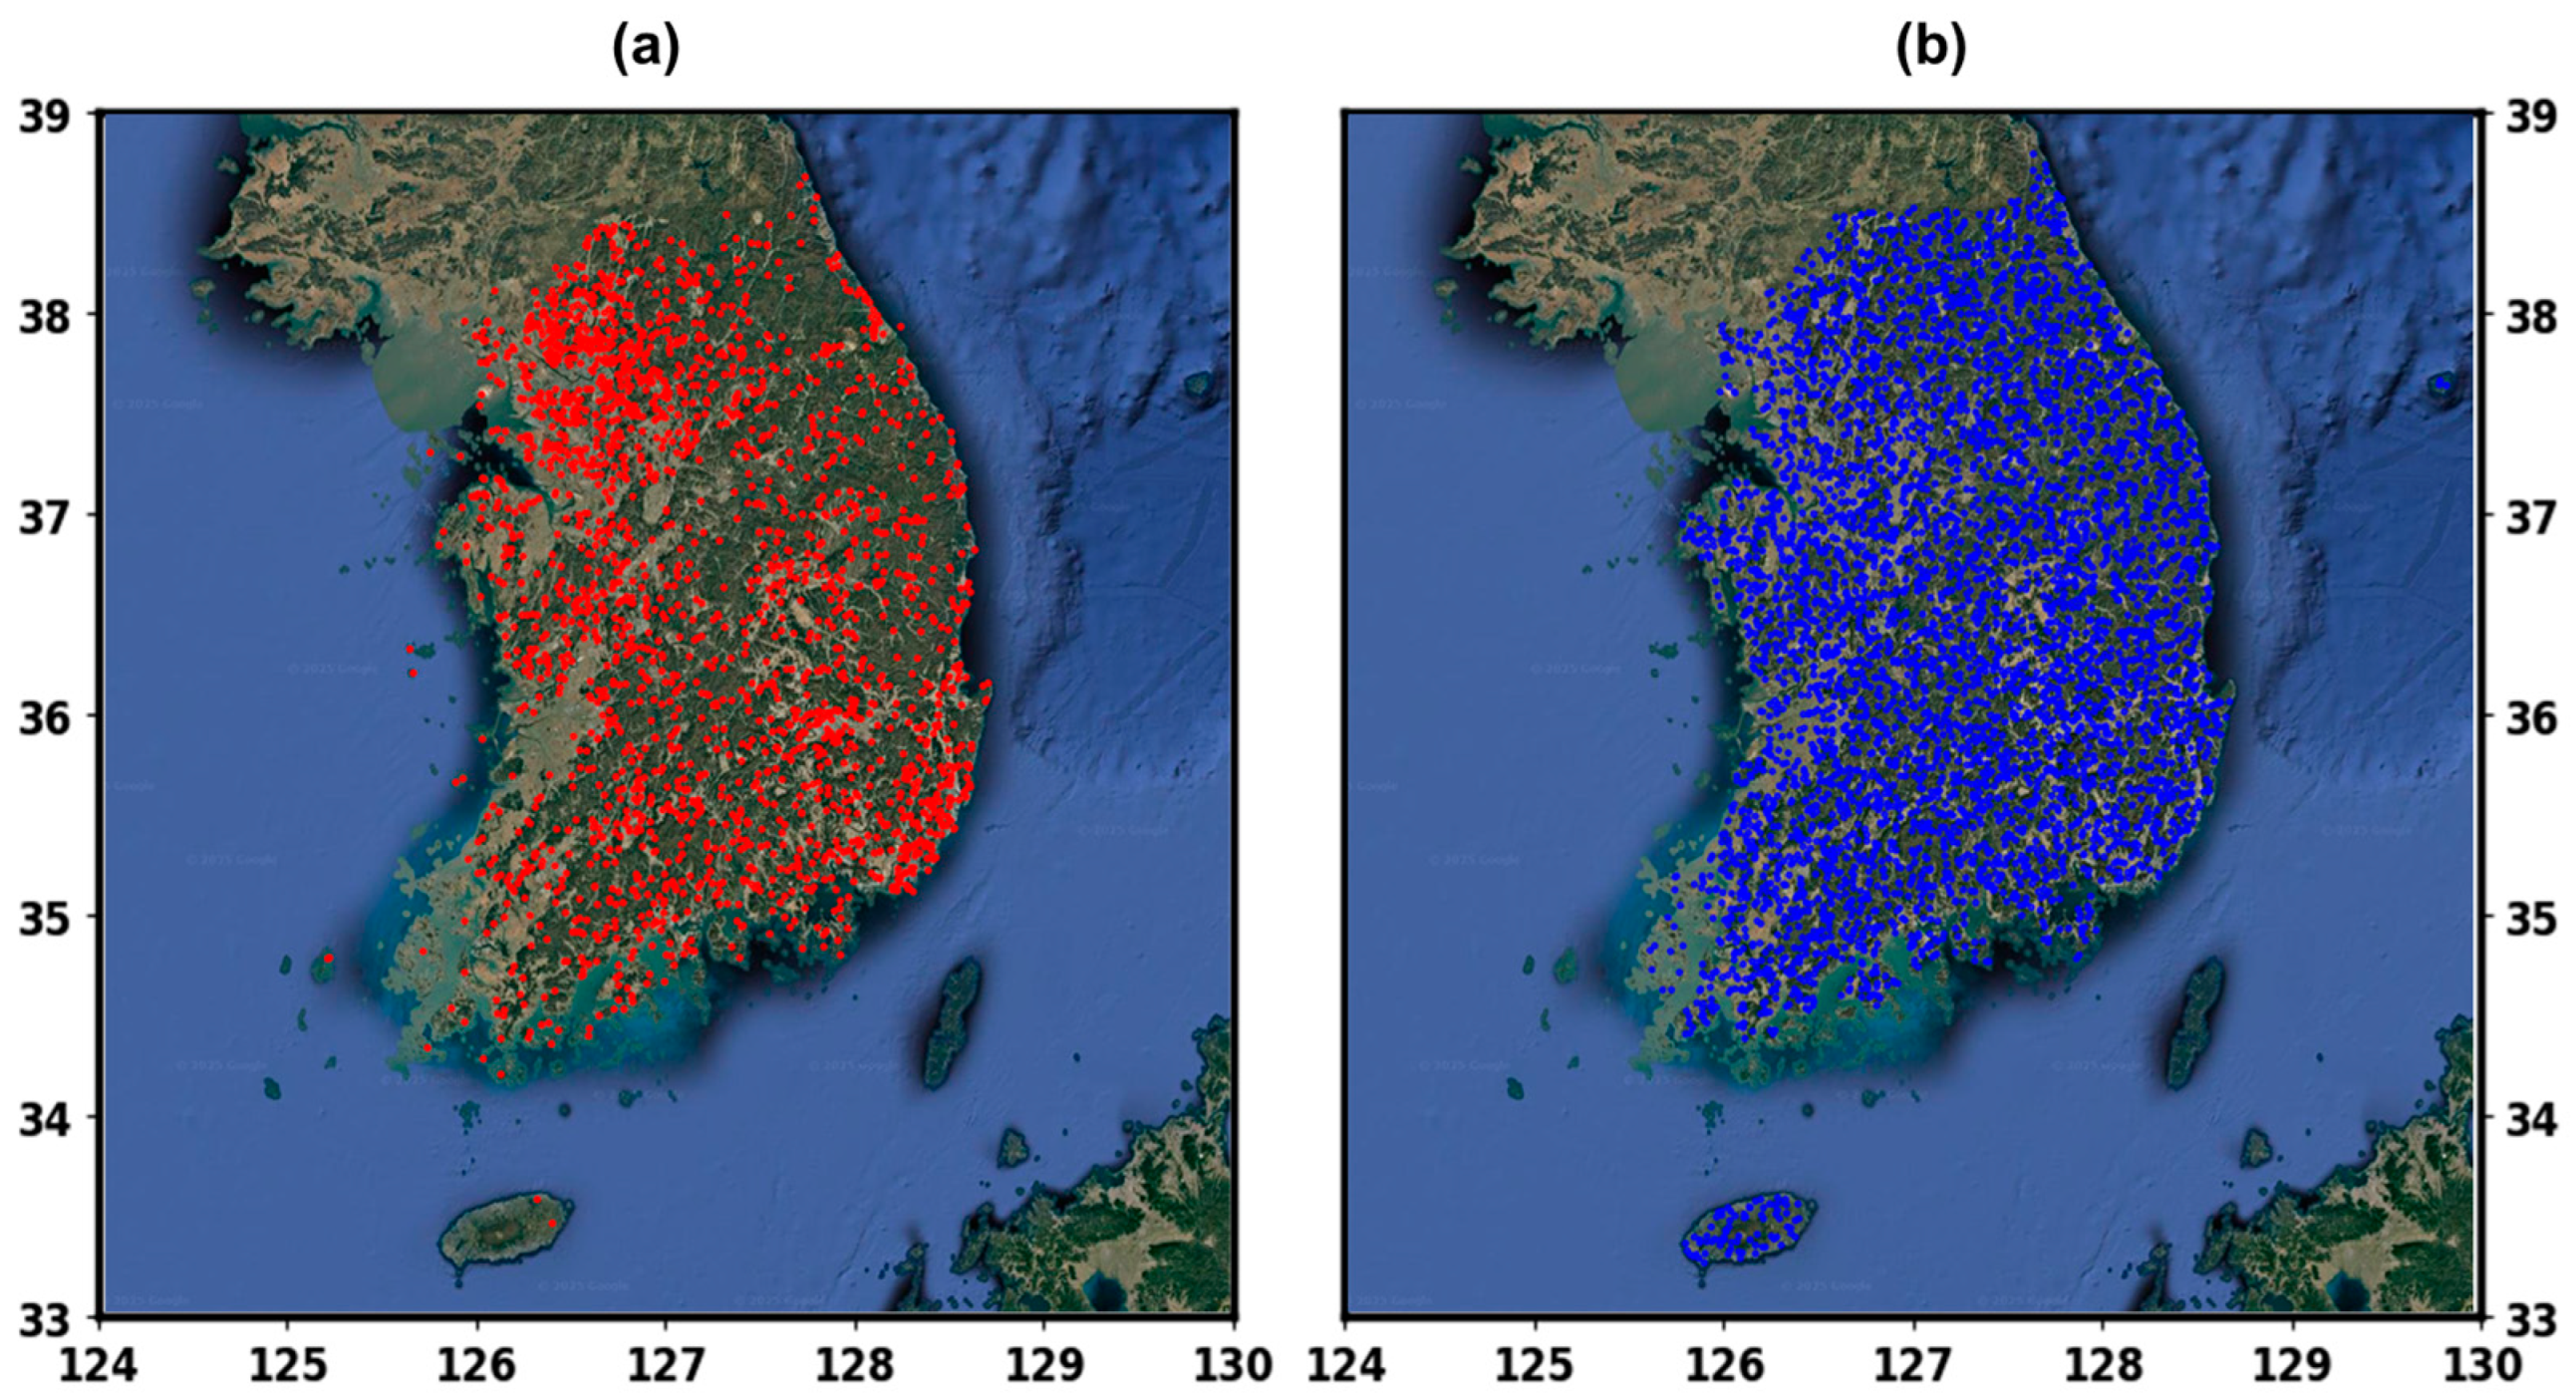
2.1. Study Area

The study area encompassed the entire Republic of Korea (South Korea), East Asia, with an approximate land area of 100,000 km2, spanning 33–38° N and 125–129° E. Approximately 70% of the terrain is mountainous, forming diverse landscapes with varying elevations and slopes [54].
South Korea has a temperate monsoonal climate with four distinct seasons. The annual mean temperature and precipitation ranges are 10–14 °C and approximately 1200–1500 mm, respectively. Coastal areas along the west and south tend to have milder winters, whereas the eastern and northern highlands experience relatively cooler conditions and greater temperature variability [55]. Soils in South Korea predominantly comprise brown forest soils, alluvial deposits, and weathered granitic materials. Sandy and silty loams are common, reflecting the complex geological history of the peninsula [56].
Forests cover approximately 63–64% of the land area in South Korea. Dominant tree species include red pine (Pinus densiflora), Korean pine (Pinus koraiensis), pitch pine (Pinus rigida), Japanese larch (Larix kaempferi), and various oaks (Quercus spp.). Natural forests and plantation stands are interspersed throughout the country, creating a mosaic of forest types. These diverse forest ecosystems play a critical role in supporting biodiversity, regulating water resources, and offering significant economic and cultural value.

2.2. GEE

GEE is a cloud-based platform designed to handle large-scale geospatial data processing and analysis. By granting users direct access to a wide array of publicly available satellite imagery, such as Landsat and Sentinel data, GEE enables rapid investigations into spatial and temporal phenomena without the need for an extensive local computing infrastructure. This accessibility is particularly advantageous in disciplines that rely on multi-temporal datasets, including environmental science, forestry, agriculture, and archaeology, which require efficient management and visualization of massive volumes of image data [57,58].
Beyond mere data access, GEE offers built-in ML tools that streamline the classification and regression tasks commonly performed on remotely sensed imagery. Researchers can develop, train, and validate models directly within the GEE interface, thereby significantly reducing the time required for data transfer and the overheads involved with handling full-resolution datasets locally. For example, partial classification runs can be completed within minutes in user-defined regions of interest, minimizing computational demands while maintaining methodological rigor [59,60]. Moreover, the platform includes intuitive mapping and vector editing features, allowing for on-the-fly creation and refinement of training data, an iterative process that is often essential for accurate classification outcomes. High-resolution base layers further support immediate quality checks because users can directly visually confirm or adjust areas of misclassification in the cloud environment. Overall, the integrated GEE toolset substantially enhances efficiency and reproducibility compared with more traditional workflows, making it an increasingly popular choice for large-scale geospatial research.

2.3. Forest Fire Dataset

We employed two primary datasets to model the forest fire risk across the Republic of Korea: (1) a forest fire occurrence dataset and (2) a non-occurrence (random) dataset (Figure 1). The forest fire occurrence dataset was derived from the Korea Forest Service fire statistics recorded from 2020 to 2023. After removing duplicate entries, anomalous records, and other outliers, 2289 valid occurrence points remained. Each point corresponded to a documented forest fire event and included essential attributes such as geographic coordinates.
It should be noted that both the fire occurrence records and environmental variables were aggregated over the full 2020–2023 period. This temporal averaging may obscure important seasonal or interannual variations in fire risk, particularly given that forest fires in South Korea tend to occur more frequently during specific periods such as spring.
To balance the data for supervised classification, a non-occurrence dataset was generated using the randomPoints function in GEE. A 1:2 ratio of fire to non-fire points (4578 non-fire points) was adopted. This sampling strategy was chosen after a sensitivity analysis comparing multiple fire-to-non-fire ratios (1:1 to 1:5). The 1:2 ratio produced the highest average AUC when model performance was averaged across the three classifiers (random forest, XGBoost, and ANN), indicating a generally strong trade-off between detection sensitivity and classification reliability [61,62].

2.4. Environmental Variables

Twelve environmental variables were collected using GEE to characterize the biophysical and socio-environmental conditions across the Republic of Korea (Table 1). The selection of variables was based on two main criteria: (1) their known relevance to forest fire risk, as supported by prior studies, and (2) their availability in satellite-derived formats via the GEE platform. The workflow for each variable typically involved: (i) loading the relevant satellite or model-derived dataset from the public data catalog of GEE; (ii) filtering the imagery by date (from 1 January 2020 to 31 December 2023) and by geographic region (the administrative boundary of South Korea); and (iii) calculating multi-year means or other aggregations as needed for subsequent modeling or analysis. Although most variables were calculated from 2020 to 2023 data, some static variables (e.g., canopy height) were calculated using data from other years (e.g., 2019–2020) owing to data availability restrictions. In certain cases (relative humidity and wind speed), additional processing steps were performed to derive the final variable from multiple image bands (dew point and temperature to compute relative humidity, and u- and v-wind components to compute the wind speed magnitude).
For gap filling and smoothing, focal mean operations can be applied to reduce noise and fill in missing pixels. These operations use a specified radius (3–10 km) and averaged values from neighboring cells [63,64]. After applying these operations, we clipped all outputs to the national boundary to remove values over ocean areas. This approach ensures consistency in the spatial coverage of each dataset and minimizes computational overheads by focusing only on the land areas of interest [65,66].
The resulting raster layers included climate variables (surface temperature, precipitation, solar radiation, snow equivalent, wind speed, and humidity), biophysical indicators (vegetation indices, soil moisture, canopy height, and topography), and socio-environmental data (population density).

2.5. Methods

The multi-source environmental variables were first gathered and preprocessed in GEE, with each dataset resampled to a spatial resolution of 100 m and clipped to the national boundary of South Korea. The variables included canopy height, digital elevation model (DEM), land surface temperature, mean temperature, mean wind speed, NDVI, population density, precipitation, relative humidity, soil moisture, and solar radiation. Official forest fire coordinates (2020–2023) from the Korea Forest Service were introduced into GEE and labeled as “fire = 1”. To balance the data, random points indicating non-fire conditions (labeled “fire = 0”) were generated at twice the number of observed fire points within the same region. Environmental values for both fire and non-fire points were then extracted using the sampleRegions function, yielding a combined dataset for model training.
Prior to classification, Pearson correlation analysis was conducted in GEE using 5000 randomly sampled pixels to identify and remove highly collinear predictors. The finalized set of variables was then used to train three ML models: random forest, XGBoost, and an ANN, all of which were executed within the GEE environment. Each model was trained on 80% of the data, with predictions evaluated on the remaining 20% of data using a 0.5 probability threshold to distinguish fire from non-fire outcomes. Once the models were trained in GEE, the results were exported for assessment in Python (version 3.10), where the accuracy, confusion matrices, and receiver operating characteristic (ROC) curves (including the AUC) were calculated. In addition, permutation feature importance was applied in Python to compare the influence of each environmental variable on the final predictions, considering the variability across multiple permutation iterations (Figure 2). To ensure consistent model comparison and reproducibility, each model was trained without additional hyperparameter tuning, using commonly employed settings, although not necessarily the default values of their respective libraries. The random forest model used 50 trees; XGBoost was configured with 100 estimators, a learning rate of 0.1, and a subsample ratio of 0.7; and the ANN included two hidden layers with ReLU activation, comprising 64 and 32 units, respectively.
After model training, the classification results were evaluated using a confusion matrix. The horizontal and vertical axes of the matrix represent predicted and actual labels, respectively. Non-fire conditions were treated as “negative,” and fire events as “positive,” resulting in four possible outcomes:
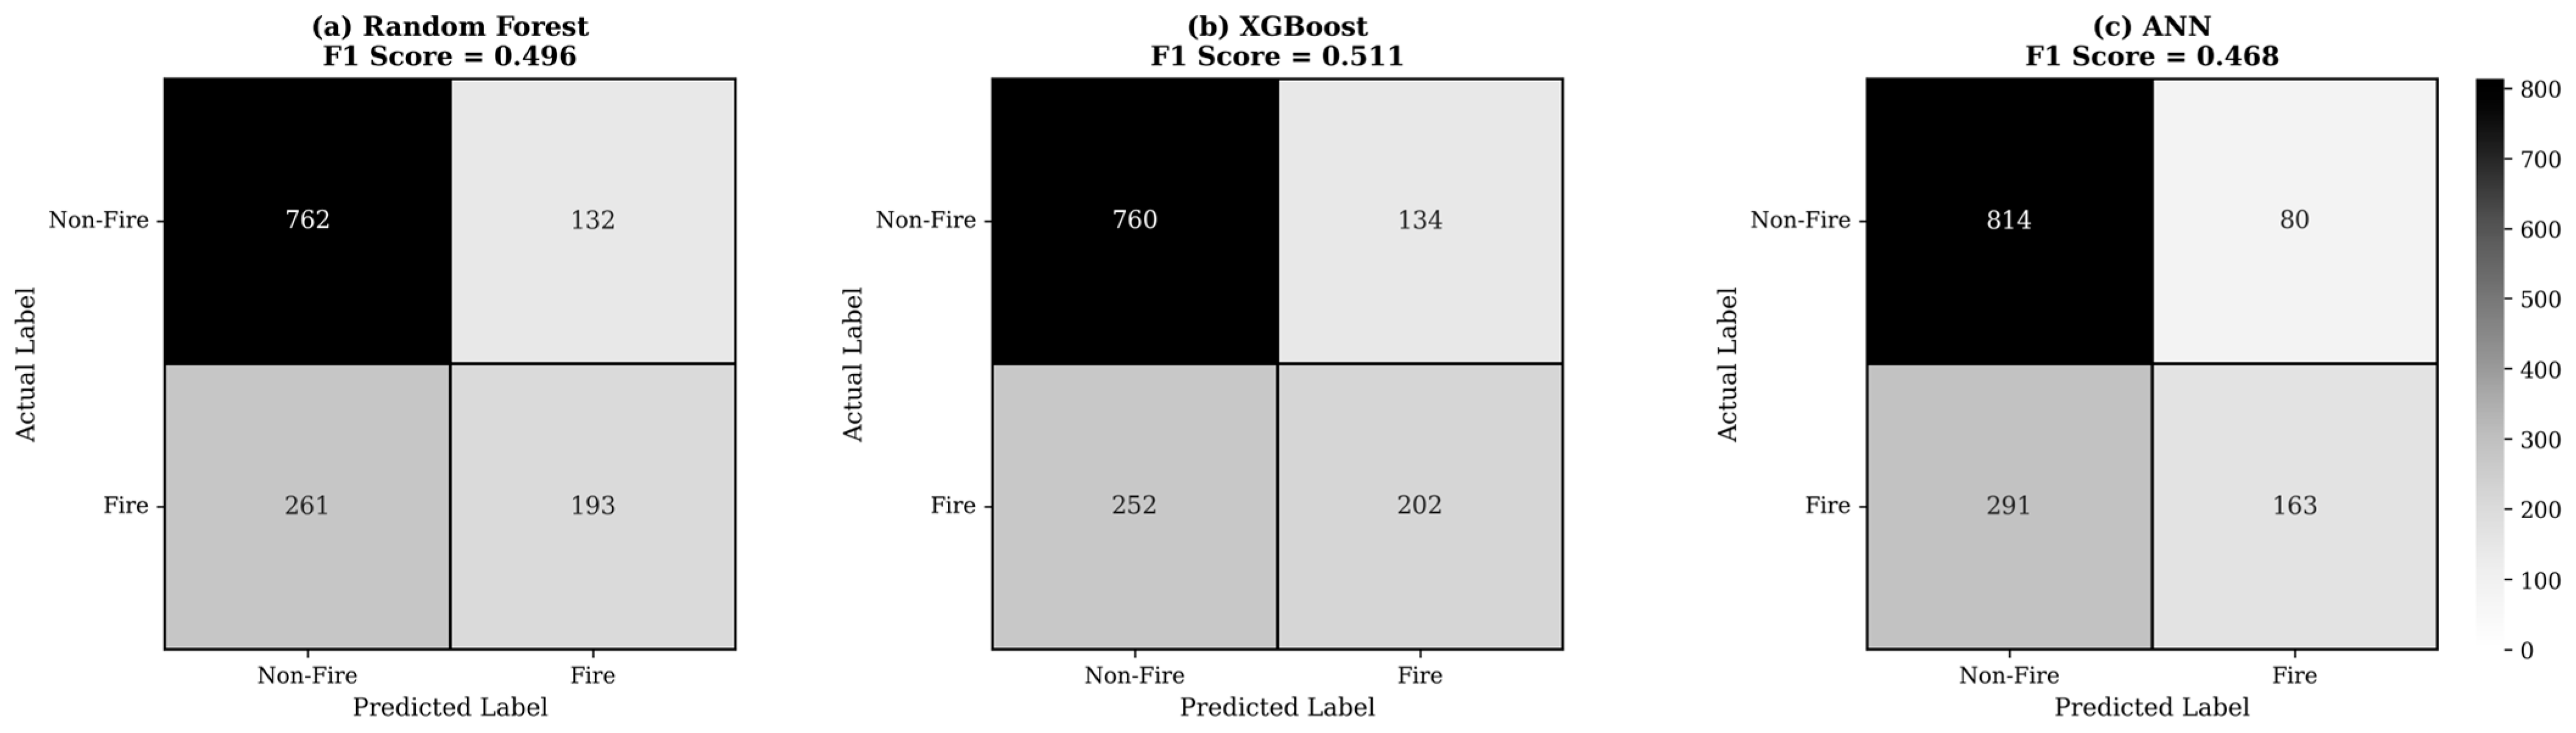
  • TP (true positive): actual fire events correctly predicted as fire
  • TN (true negative): actual non-fire events correctly predicted as non-fire events
  • FP (false positive): actual non-fire events mistakenly predicted as fire
  • FN (false negative): actual fire events mistakenly predicted as non-fire
The precision and recall metrics were defined as follows, with the F1 score capturing the balance between the two:
P r e c i s i o n = T P T P + F P ,   Recall = T P T P + F N ,   F 1 = 2 × P r e c i s i o n × R e c a l l P r e c i s i o n + R e c a l l

3. Results

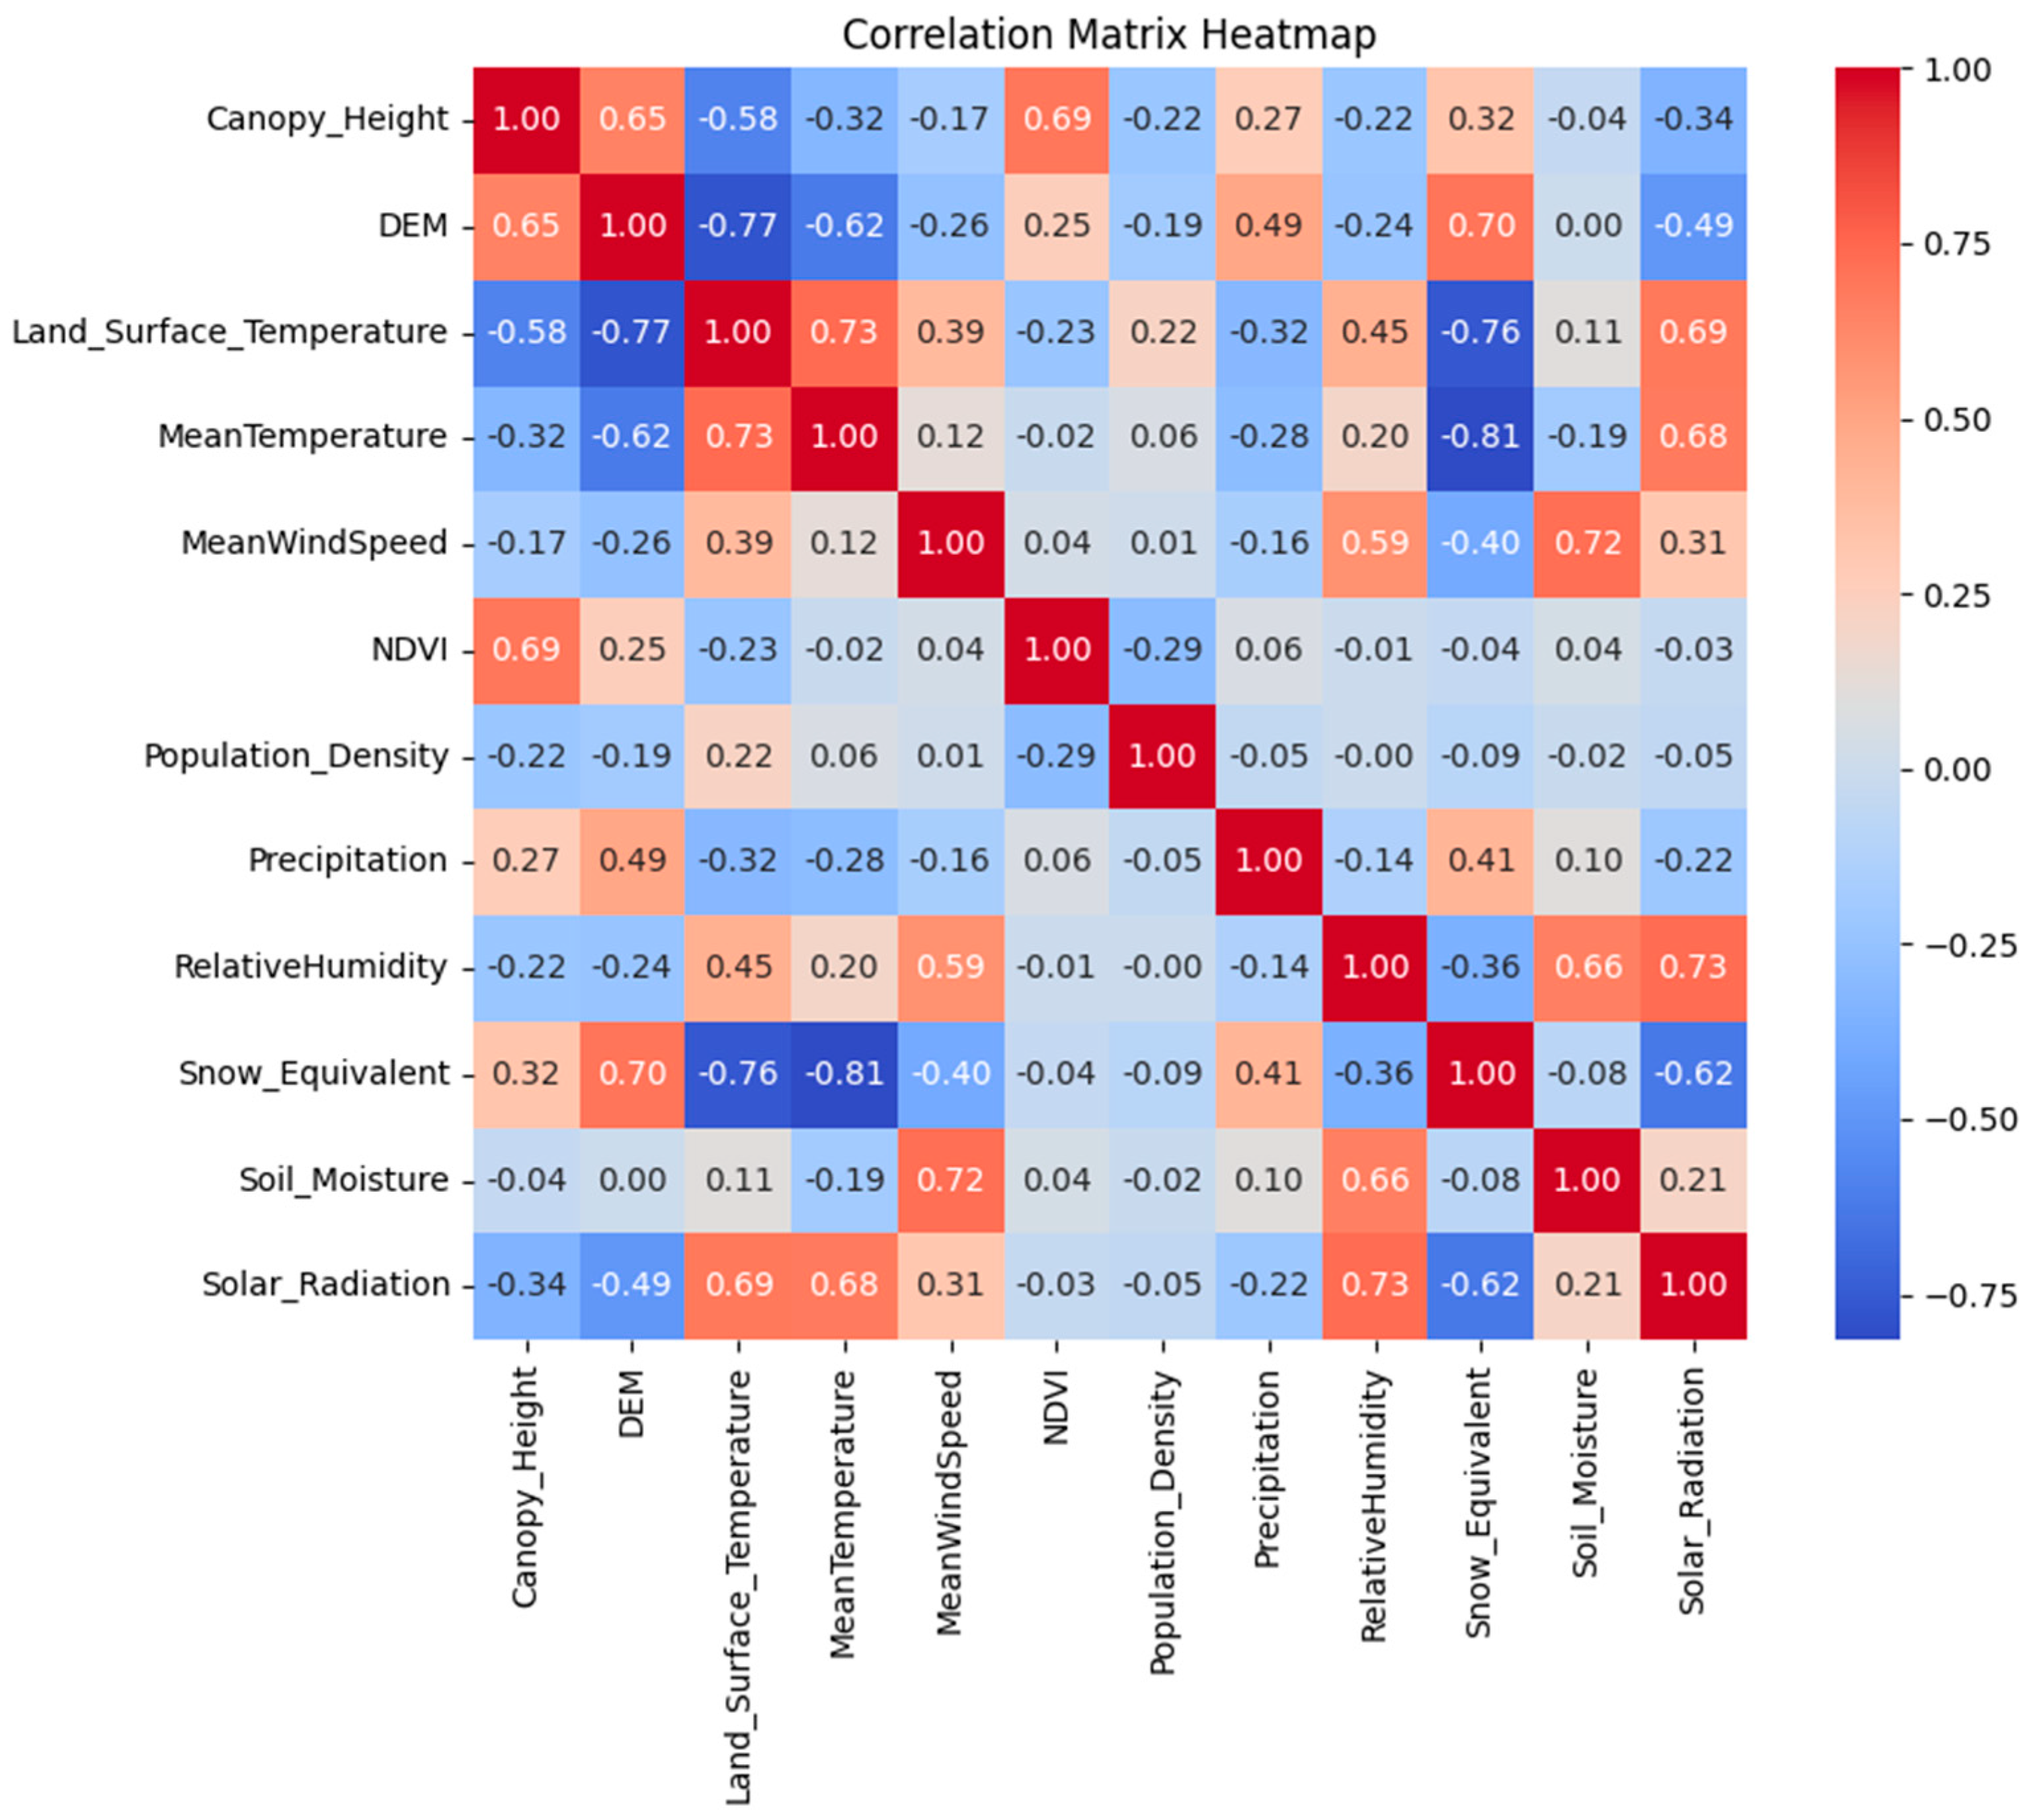
3.1. Removal of Highly Collinear Features

The Pearson correlation coefficients calculated for 5000 randomly sampled points across South Korea revealed several instances of strong linear dependence among the chosen predictors (Figure 3). A conservative threshold of |r| = 0.8 was adopted to guide the removal of highly collinear features. The most notable redundancy was observed for Snow_Equivalent, which showed a strong negative correlation with mean temperature (r = −0.81), exceeding the cutoff for exclusion. Although certain other pairs, most notably DEM and Land_Surface_Temperature (r = −0.76), also exhibited relatively high correlations, none surpassed ±0.8. After the removal of Snow_Equivalent, the remaining variables displayed only moderate or weak associations, thereby reducing the risk of multi-collinearity and providing a more stable basis for subsequent fire occurrence modeling.

3.2. Model Prediction Performance Visualization

All three models—random forest, XGBoost, and ANN—predicted broadly consistent patterns of fire risk across South Korea, with each highlighting largely similar regions with heightened risk (Figure 4). However, notable differences arose in the magnitudes of the predicted risk at finer spatial scales. In particular, the random forest model tended to yield the highest overall estimated probabilities, whereas ANN produced comparatively lower values. The XGBoost outputs typically fell between these two extremes, suggesting a more intermediate assessment of fire risk. Despite these local-scale variations, the three approaches agreed on the most vulnerable areas nationwide, reflecting shared identification of the core drivers of fire risk, despite each algorithm applying its own distinct strategy for handling non-linearities and variable interactions.
To more clearly visualize local-scale discrepancies among models, we mapped deviations in the predicted probability values from the mean predicted values for each model (Figure 5). These maps highlight subtle yet meaningful spatial variations, particularly in regions with heterogeneous topographic and vegetation patterns. The results confirm that, although the models agreed on regional trends, local prediction biases were observed, which may be attributed to the different methods used to process the environmental variables.
Further examination of the spatial bias patterns revealed distinct tendencies across models. The random forest model generally predicted values close to the ensemble mean; however, it tended to underpredict fire probability in forest–urban interface areas and overpredict in high-altitude, densely forested regions. In contrast, the XGBoost model exhibited sharper spatial differentiation, overpredicting in transitional zones near human settlements while underpredicting in interior forested areas with complex topography. The ANN model showed overall similarity to the mean predictions but exhibited a pattern of underprediction in urban-adjacent forests and overprediction in deep forested regions. These variations underscore how different learning algorithms respond to environmental heterogeneity and highlight the importance of model selection when interpreting spatial fire risk patterns.

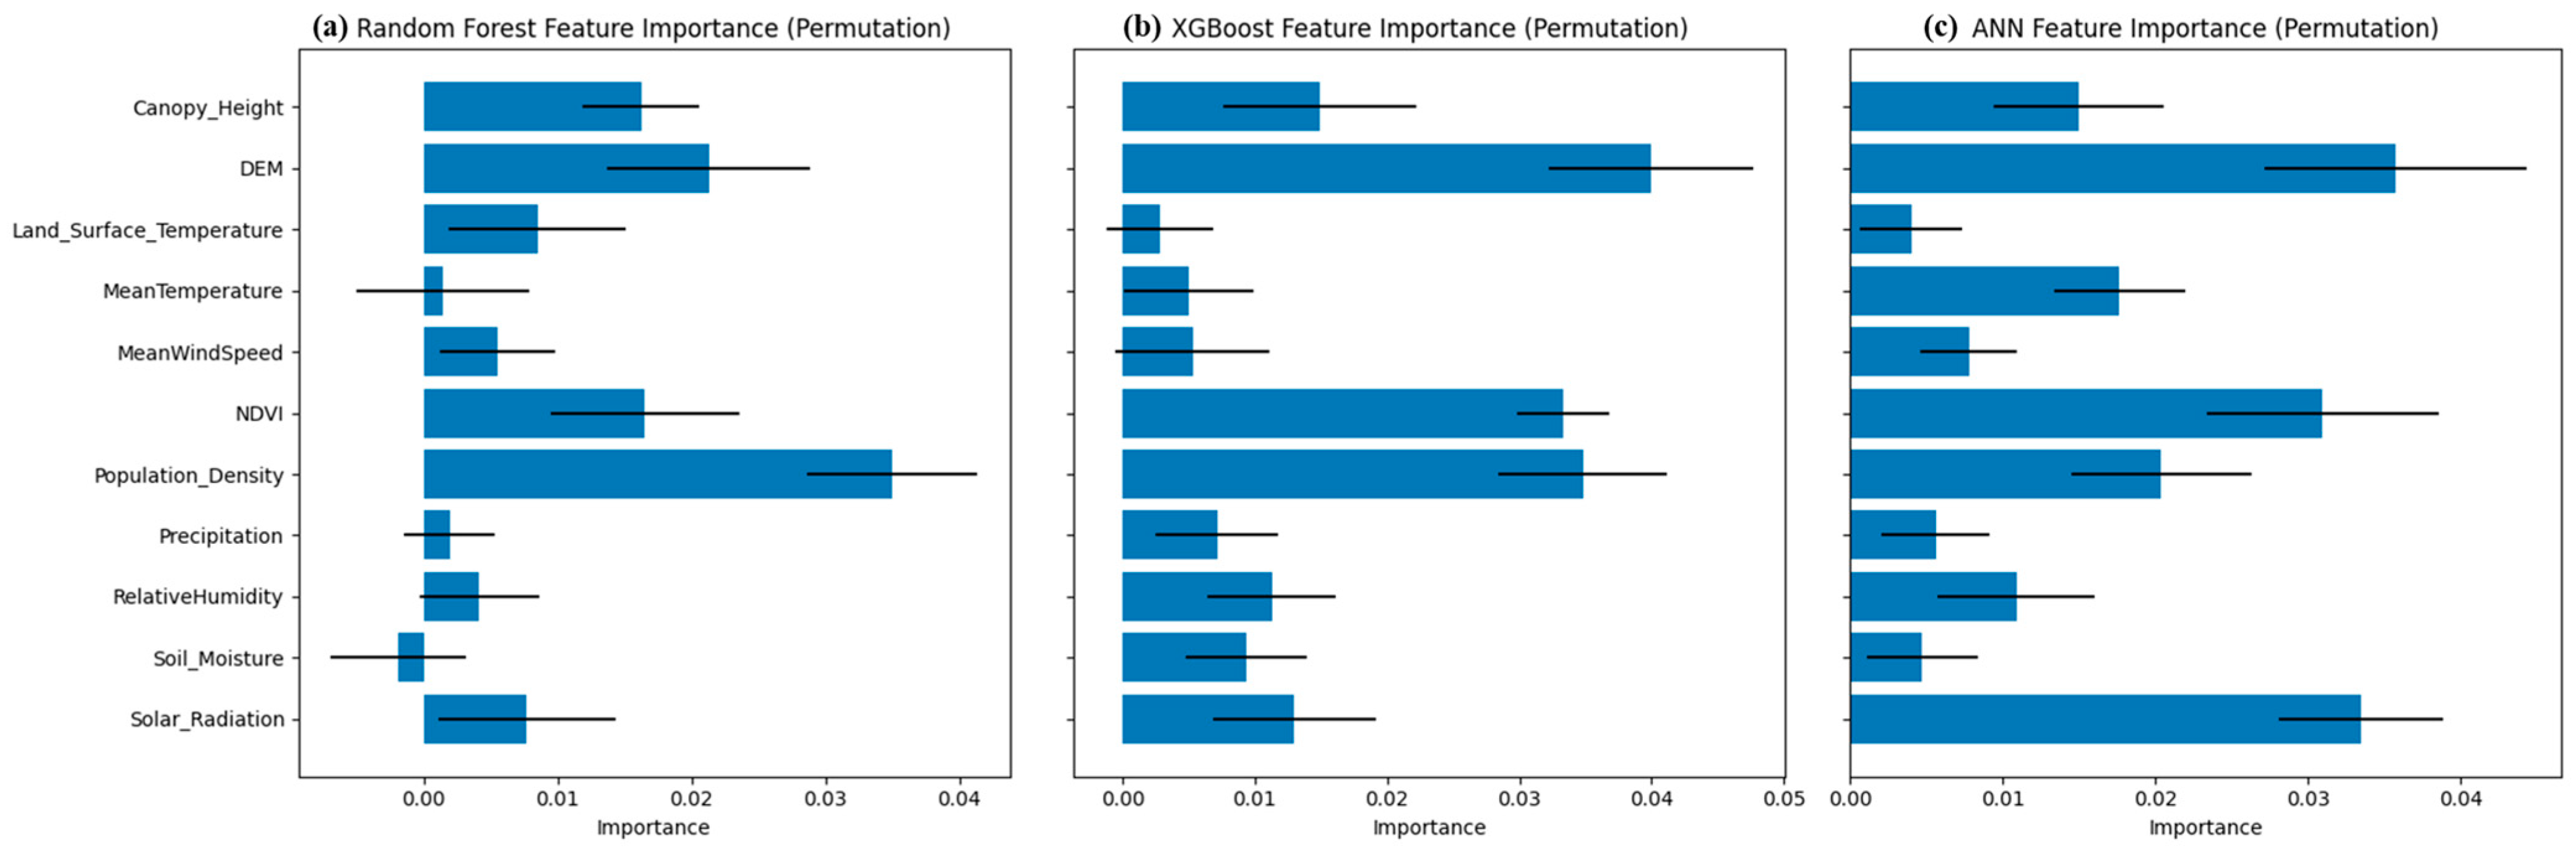
3.3. Permutation Feature Importance

To quantify the relative influence of each variable on fire occurrence, a permutation-based feature importance evaluation was conducted for the three ML models. This method examines the extent to which the predictive accuracy of a model declines when the values of a specific variable are randomly permuted, indicating the importance of that variable (Figure 6).
Through this ranking procedure, DEM, Population_Density, and NDVI emerged as consistently dominant contributors, albeit with some variation among models. For random forest, Population_Density was the highest ranked variable, followed by DEM and NDVI. For XGBoost, DEM ranked the highest, followed by Population_Density and NDVI. For ANN, DEM again ranked the highest; however, Solar_Radiation was the second-highest ranked variable, surpassing NDVI. Despite these differences, all three models attributed substantial influence on topographic and vegetative factors, as well as human-related elements, underscoring their central role in shaping predictions of fire risk.

3.4. Confusion Matrix and F1 Score Evaluation

The classification performance of each model was evaluated using confusion matrices and corresponding F1 scores (Figure 7). Among the three models, XGBoost achieved the highest F1 score (0.511), followed by random forest (0.496) and ANN (0.468). The XGBoost model exhibited a favorable balance between true positives and false positives, which contributed to its overall good performance. Although the ANN model correctly predicted a high number of non-fire cases, its relatively high false negative rate reduced its effectiveness in detecting fire events. These differences highlight variations in sensitivity and specificity across model types under imbalanced data conditions.

3.5. ROC Curve and AUC Evaluation

As well as confusion matrices and F1 scores, we further evaluated the performance of each model by examining the ROC curves and their corresponding AUC values (Figure 8). The ROC curve plots the true-positive rate against the false-positive rate across all possible classification thresholds, with the diagonal red line representing the random chance performance (AUC = 0.5). As shown in Figure 7, XGBoost achieved the highest AUC (0.76), indicating a marginally better overall ability to discriminate between fire and non-fire cases than the other two models. The ANN and random forest models followed closely with AUC values of 0.75 and 0.74, respectively. These AUC values aligned closely with the trends observed in the confusion matrices. Although all three models exhibited relatively similar performance, XGBoost consistently handled the trade-off between true and false positives slightly more effectively.

4. Discussion

In this study, we compared three ML algorithms (random forest, XGBoost, and an ANN) using forest fire occurrence data (2020–2023) and various remote sensing indicators spanning the entire Republic of Korea. All three models exhibited relatively strong discriminatory power, as evidenced by their similar ROC AUC scores (0.74–0.76). These findings confirm that satellite-based data can be reliably employed to evaluate forest fire risk on a national scale. However, the algorithms exhibited differences in their sensitivity to rare events and non-linear relationships, as reflected by variations in the F1 scores and confusion matrices. This suggests that imbalanced datasets and complex variable interactions have different impacts on the predictive approaches of each model.
According to permutation-based feature importance, DEM, population density, and NDVI consistently emerged as critical predictors of forest fire occurrence. DEM influences fire risk by affecting both slope steepness and elevation, which alter wind exposure and fuel continuity. Population density reflects human activity, which is a common source of ignition, especially in wildland–urban interface areas. NDVI indicates vegetation greenness and fuel load, which are closely linked to landscape flammability. Thus, our results suggest that geophysical and anthropogenic factors jointly contribute to wildfire vulnerability. These findings agree with previous research demonstrating that topographic conditions, anthropogenic factors (e.g., residential proximity, illegal burning, and outdoor recreation), and vegetation conditions interact to collectively influence ignition likelihood and fire spread [67]. Climate and biophysical variables, such as solar radiation or NDVI, also play an important role through their effect on fuel moisture and consequently ignition probability.
However, unlike previous approaches that rely on ground-based data or expert weighting schemes, we exclusively used satellite-derived variables and implemented a nationwide, high-resolution risk assessment entirely within the GEE cloud platform. This study demonstrates the advantages of large-scale remote sensing and scalable computing for forest fire modeling in data-limited contexts.
From a methodological perspective, leveraging the GEE to process large-scale remote sensing data alongside ML proved highly efficient. The automated workflows of GEE, which encompass preprocessing tasks such as resampling, gap filling, and multi-year compositing, greatly reduce computational demands on local systems [68]. In future studies, more frequent temporal updates of remote sensing inputs (e.g., monthly or weekly NDVI and meteorological data) and higher-spatial-resolution imagery could further enhance the short-term predictive capability of forest fire modeling [69].
This study had some limitations. For example, the spatial and temporal resolutions of remote sensing data were not uniformly high across all environmental variables; thus, local-scale phenomena such as microclimates or detailed vegetation changes may have been overlooked. Additionally, certain socioeconomic dimensions, such as seasonal tourism or shifting land-use practices, were not captured; thus, the models may not have accounted for some real-world conditions. Moreover, non-fire points were generated through uniform random sampling across South Korea using GEE, without applying a spatial buffer to exclude areas close to the points of fire occurrence. Therefore, full spatial independence between fire and non-fire points was not guaranteed. However, owing to the large regional sampling scale and stable model performance (as evidenced by the AUC and F1 values), we believe that spatial autocorrelation had a minimal impact on model accuracy. Finally, to mitigate class imbalance, non-fire points were sampled at a 2:1 ratio; however, altering that ratio may have affected the sensitivity and specificity of the model. Future efforts may benefit from integrating more advanced sampling techniques to stabilize and refine model predictive performance.

5. Conclusions

In this study, we combined forest fire records from the Korea Forest Service (2020–2023) with satellite-based environmental variables processed in GEE to construct three distinct ML models—random forest, XGBoost, and ANN—for predicting the nationwide forest fire risk in South Korea. Although the models produced comparable results in terms of discrimination, XGBoost achieved the highest F1 score and an AUC of 0.76, highlighting the potential advantages of gradient boosting methods for complex, imbalanced datasets. Furthermore, DEM, population density, and NDVI consistently ranked among the most critical predictors of fire occurrence, underscoring the combined influence of topography, human activity, and vegetation status on forest fire risk.
Our approach represents a valuable decision–support tool for forest fire management in South Korea, enabling stakeholders to identify high-risk areas more rapidly and precisely. In the future, finer-resolution spatial and temporal datasets, such as monthly NDVI updates or high-resolution DEMs, should be incorporated along with additional factors such as on-site meteorological observations and dynamic land-use data to further enhance model accuracy.
Overall, our results highlight the critical role of satellite-based datasets and ML methods in monitoring and mitigating forest fire hazards under a rapidly changing climate and social environment. Enhanced collaboration among government agencies, researchers, and local communities could help transform such approaches into actionable policies and resource allocation strategies, both in South Korea and worldwide.

Author Contributions

Conceptualization, J.C. and H.C.; methodology, J.C. and H.C.; software, J.C.; validation, Y.Y. and H.C.; formal analysis, J.C.; investigation, J.C.; resources, J.C.; data curation, J.C. and Y.Y.; writing—original draft preparation, J.C.; writing—review and editing, H.C. and Y.Y.; visualization, J.C.; supervision, H.C. All authors have read and agreed to the published version of the manuscript.

Funding

This work was supported by the National Research Foundation of Korea (NRF) grant funded by the Korea government (MSIT) (NO.RS-2023-NR076912) and the R&D Program for Forest Science Technology (Project No. RS-2024-00402624), provided by the Korea Forest Service (Korea Forestry Promotion Institute).

Data Availability Statement

The original contributions of this study are included in this article. Further inquiries related to the data can be directed to Jukyeong Choi at ju6891@kanwon.ac.kr.

Conflicts of Interest

The authors declare no conflicts of interest.

References

  1. Baccini, A.; Walker, W.; Carvalho, L.; Farina, M.; Sulla-Menashe, D.; Houghton, R.A. Tropical forests are a net carbon source based on aboveground measurements of gain and loss. Science 2017, 358, 230–234. [Google Scholar] [CrossRef]
  2. Scholes, R.J.; Archer, S.R. Tree-Grass Interactions in Savannas. Annu. Rev. Ecol. Syst. 1997, 28, 517–544. [Google Scholar] [CrossRef]
  3. Bowman, D.M.J.S.; Balch, J.K.; Artaxo, P.; Bond, W.J.; Carlson, J.M.; Cochrane, M.A.; D’Antonio, C.M.; DeFries, R.S.; Doyle, J.C.; Harrison, S.P.; et al. Fire in the Earth System. Science 2009, 324, 481–484. [Google Scholar] [CrossRef]
  4. Liu, Y.; Stanturf, J.; Goodrick, S. Trends in global wildfire potential in a changing climate. For. Ecol. Manag. 2010, 259, 685–697. [Google Scholar] [CrossRef]
  5. Calkin, D.E.; Cohen, J.D.; Finney, M.A.; Thompson, M.P. How risk management can prevent future wildfire disasters in the wildland-urban interface. Proc. Natl. Acad. Sci. USA 2013, 111, 746–751. [Google Scholar] [CrossRef]
  6. Ager, A.A.; Vaillant, N.M.; Finney, M.A. A comparison of landscape fuel treatment strategies to mitigate wildland fire risk in the urban interface and preserve old forest structure. For. Ecol. Manag. 2010, 259, 1556–1570. [Google Scholar] [CrossRef]
  7. Jones, M.W.; Smith, A.; Betts, R.; Canadell, J.G.; Prentice, I.C.; Le Quéré, C. Climate Change Increases the Risk of Wildfires. Science-Brief.org, 14 January 2020. Available online: https://sciencebrief.org/briefs/wildfires (accessed on 15 April 2025).
  8. Jolly, W.M.; Cochrane, M.A.; Freeborn, P.H.; Holden, Z.A.; Brown, T.J.; Williamson, G.J.; Bowman, D.M.J.S. Climate-induced variations in global wildfire danger from 1979 to 2013. Nat. Commun. 2015, 6, 7537. [Google Scholar] [CrossRef] [PubMed]
  9. Godfree, R.C.; Knerr, N.; Encinas-Viso, F.; Albrecht, D.; Bush, D.; Cargill, D.C.; Clements, M.; Gueidan, C.; Guja, L.K.; Harwood, T.; et al. Implications of the 2019–2020 megafires for the biogeography and conservation of Australian vegetation. Nat. Commun. 2021, 12, 1023. [Google Scholar] [CrossRef]
  10. Boulanger, Y.; Arseneault, D.; Bélisle, A.C.; Bergeron, Y.; Boucher, J.; Boucher, Y.; Danneyrolles, V.; Erni, S.; Gachon, P.; Girardin, M.P.; et al. The 2023 wildfire season in Québec: An overview of extreme conditions, impacts, lessons learned, and considerations for the future. Can. J. For. Res. 2024, 55, 1–21. [Google Scholar] [CrossRef]
  11. Sarris, D.; Christopoulou, A.; Angelonidi, E.; Koutsias, N.; Fulé, P.Z.; Arianoutsou, M. Increasing extremes of heat and drought associated with recent severe wildfires in southern Greece. Reg. Environ. Change 2014, 14, 1257–1268. [Google Scholar] [CrossRef]
  12. Abatzoglou, J.T.; Williams, A.P. Impact of anthropogenic climate change on wildfire across western US forests. Proc. Natl. Acad. Sci. USA 2016, 113, 11770–11775. [Google Scholar] [CrossRef] [PubMed]
  13. Dennison, P.E.; Brewer, S.C.; Arnold, J.D.; Moritz, M.A. Large wildfire trends in the western United States, 1984–2011. Geophys. Res. Lett. 2014, 41, 2928–2933. [Google Scholar] [CrossRef]
  14. Flannigan, M.D.; Stocks, B.J.; Wotton, B.M. Climate change and forest fires. Sci. Total Environ. 2000, 262, 221–229. [Google Scholar] [CrossRef] [PubMed]
  15. Kouassi, J.-L.; Wandan, N.; Mbow, C. Predictive modeling of wildfire occurrence and damage in a tropical savanna ecosystem of West Africa. Fire 2020, 3, 42. [Google Scholar] [CrossRef]
  16. Syphard, A.D.; Radeloff, V.C.; Keeley, J.E.; Hawbaker, T.J.; Clayton, M.K.; Stewart, S.I.; Hammer, R.B. Human influence on California fire regimes. Ecol. Appl. 2007, 17, 1388–1402. [Google Scholar] [CrossRef]
  17. Modugno, S.; Balzter, H.; Cole, B.; Borrelli, P. Mapping regional patterns of large forest fires in Wildland–Urban Interface areas in Europe. J. Environ. Manag. 2016, 172, 112–126. [Google Scholar] [CrossRef] [PubMed]
  18. Martell, D.L. A review of operational research studies in forest fire management. Can. J. For. Res. 1982, 12, 119–140. [Google Scholar] [CrossRef]
  19. Barmpoutis, P.; Papaioannou, P.; Dimitropoulos, K.; Grammalidis, N. A review on early forest fire detection systems using optical remote sensing. Sensors 2020, 20, 6442. [Google Scholar] [CrossRef]
  20. Van Wagner, C.E. Development and Structure of the Canadian Forest Fire Weather Index System; Canadian Forestry Service: Ottawa, ON, Canada, 1987. [Google Scholar]
  21. Taylor, S.W.; Alexander, M.E. Science, technology, and human factors in fire danger rating: The Canadian experience. Int. J. Wildland Fire 2006, 15, 121–135. [Google Scholar] [CrossRef]
  22. Chuvieco, E.; Congalton, R.G. Application of remote sensing and geographic information systems to forest fire hazard mapping. Remote Sens. Environ. 1989, 29, 147–159. [Google Scholar] [CrossRef]
  23. Suryabhagavan, K.V.; Alemu, M.; Balakrishnan, M. GIS-based multi-criteria decision analysis for forest fire susceptibility mapping: A case study in Harenna forest, southwestern Ethiopia. Trop. Ecol. 2016, 57, 33–43. [Google Scholar]
  24. Guo, F.; Zhang, L.; Jin, S.; Tigabu, M.; Su, Z.; Wang, W. Modeling anthropogenic fire occurrence in the boreal forest of China using logistic regression and random forests. Forests 2016, 7, 250. [Google Scholar] [CrossRef]
  25. Oliveira, S.; Oehler, F.; San-Miguel-Ayanz, J.; Camia, A.; Pereira, J.M. Modeling spatial patterns of fire occurrence in Mediterranean Europe using Multiple Regression and Random Forest. For. Ecol. Manag. 2012, 275, 117–129. [Google Scholar] [CrossRef]
  26. Guo, H.; Li, Y.; Shang, J.; Gu, M.; Huang, Y.; Gong, B. Learning from class-imbalanced data: Review of methods and applications. Expert Syst. Appl. 2017, 73, 220–239. [Google Scholar] [CrossRef]
  27. Kanwal, R.; Rafaqat, W.; Iqbal, M.; Weiguo, S. Data-driven approaches for wildfire mapping and prediction assessment using a convolutional neural network (CNN). Remote Sens. 2023, 15, 5099. [Google Scholar] [CrossRef]
  28. Chuvieco, E.; Aguado, I.; Salas, J.; García, M.; Yebra, M.; Oliva, P. Satellite remote sensing contributions to wildland fire science and management. Curr. For. Rep. 2020, 6, 81–96. [Google Scholar] [CrossRef]
  29. Tian, L.; Wu, X.; Tao, Y.; Li, M.; Qian, C.; Liao, L.; Fu, W. Review of remote sensing-based methods for forest aboveground biomass estimation: Progress, challenges, and prospects. Forests 2023, 14, 1086. [Google Scholar] [CrossRef]
  30. Sivrikaya, F.; Günlü, A.; Küçük, Ö.; Ürker, O. Forest fire risk mapping with Landsat 8 OLI images: Evaluation of the potential use of vegetation indices. Ecol. Inform. 2024, 79, 102461. [Google Scholar] [CrossRef]
  31. Peña-Molina, E.; Moya, D.; Marino, E.; Tomé, J.L.; Fajardo-Cantos, Á.; González-Romero, J.; Lucas-Borja, M.E.; de las Heras, J. Fire vulnerability, resilience, and recovery rates of mediterranean pine forests using a 33-year time series of satellite imagery. Remote Sens. 2024, 16, 1718. [Google Scholar] [CrossRef]
  32. Hu, X.; Ban, Y.; Nascetti, A. Sentinel-2 MSI data for active fire detection in major fire-prone biomes: A multi-criteria approach. Int. J. Appl. Earth Obs. Geoinf. 2021, 101, 102347. [Google Scholar] [CrossRef]
  33. Kurbanov, E.; Vorobev, O.; Lezhnin, S.; Sha, J.; Wang, J.; Li, X.; Cole, J.; Dergunov, D.; Wang, Y. Remote sensing of forest burnt area, burn severity, and post-fire recovery: A review. Remote. Sens. 2022, 14, 4714. [Google Scholar] [CrossRef]
  34. Ghosh, S.; Kumar, D.; Kumari, R. Cloud-based large-scale data retrieval, mapping, and analysis for land monitoring applications with Google Earth Engine (GEE). Environ. Chall. 2022, 9, 100605. [Google Scholar] [CrossRef]
  35. Tamiminia, H.; Salehi, B.; Mahdianpari, M.; Quackenbush, L.; Adeli, S.; Brisco, B. Google Earth Engine for geo-big data applications: A meta-analysis and systematic review. ISPRS J. Photogramm. Remote Sens. 2020, 164, 152–170. [Google Scholar] [CrossRef]
  36. Gemitzi, A.; Kopsidas, O.; Stefani, F.; Polymeros, A.; Bellos, V. A Constantly updated flood hazard assessment tool using satellite-based high-resolution land cover dataset within Google Earth Engine. Land 2024, 13, 1929. [Google Scholar] [CrossRef]
  37. Gorelick, N.; Hancher, M.; Dixon, M.; Ilyushchenko, S.; Thau, D.; Moore, R. Google Earth Engine: Planetary-scale geospatial analysis for everyone. Remote Sens. Environ. 2017, 202, 18–27. [Google Scholar] [CrossRef]
  38. Quintero, N.; Viedma, O.; Urbieta, I.R.; Moreno, J.M. Assessing landscape fire hazard by multitemporal automatic classification of Landsat time series using the Google Earth Engine in west-central spain. Forests 2019, 10, 518. [Google Scholar] [CrossRef]
  39. Khan, S.M.; Shafi, I.; Haider Butt, W.; de la Torre Diez, I.; López Flores, M.A.; Castanedo Galán, J.; Ashraf, I. A systematic review of disaster management systems: Approaches, challenges, and future directions. Land 2023, 12, 1514. [Google Scholar] [CrossRef]
  40. Limber, R.; Hargrove, W.W.; Hoffman, F.M.; Kumar, J. Forecast of wildfire potential across California USA using a transformer. In Proceedings of the 2024 IEEE International Conference on Big Data (BigData), Sorrento, Italy, 15–18 December 2024; pp. 4342–4350. [Google Scholar] [CrossRef]
  41. Xia, Z.; Liao, K.; Guo, L.; Wang, B.; Huang, H.; Chen, X.; Fang, X.; Zu, K.; Luo, Z.; Shen, F.; et al. Determining dominant factors of vegetation change with machine learning and multisource data in the Ganjiang River Basin, China. Land 2025, 14, 76. [Google Scholar] [CrossRef]
  42. Chen, H.; Zhao, W.; He, Z.; Zhang, Y.; Wu, W.; Chen, T. Quantifying nonlinear responses of vegetation to hydro-climatic changes in mountainous Southwest China. Front. For. Glob. Change 2024, 7, 1417737. [Google Scholar] [CrossRef]
  43. Shahzad, F.; Mehmood, K.; Hussain, K.; Haidar, I.; Anees, S.A.; Muhammad, S.; Ali, J.; Adnan, M.; Wang, Z.; Feng, Z. Comparing machine learning algorithms to predict vegetation fire detections in Pakistan. Fire Ecol. 2024, 20, 57. [Google Scholar] [CrossRef]
  44. Zhang, L.; Shi, C.; Zhang, F. Predicting forest fire area growth rate using an ensemble algorithm. Forests 2024, 15, 1493. [Google Scholar] [CrossRef]
  45. Wang, C.; Liu, H.; Xu, Y.; Zhang, F. A forest fire prediction framework based on multiple machine learning models. Forests 2025, 16, 329. [Google Scholar] [CrossRef]
  46. Sarkar, M.S.; Majhi, B.K.; Pathak, B.; Biswas, T.; Mahapatra, S.; Kumar, D.; Bhatt, I.D.; Kuniyal, J.C.; Nautiyal, S. Ensembling machine learning models to identify forest fire-susceptible zones in Northeast India. Ecol. Inform. 2024, 81, 102598. [Google Scholar] [CrossRef]
  47. Joshi, J.; Sukumar, R. Improving prediction and assessment of global fires using multilayer neural networks. Sci. Rep. 2021, 11, 3295. [Google Scholar] [CrossRef]
  48. Kucuk, O.; Sevinc, V. Fire behavior prediction with artificial intelligence in thinned black pine (Pinus nigra Arnold) stand. For. Ecol. Manag. 2023, 529, 120707. [Google Scholar] [CrossRef]
  49. Akinci, H.A.; Akinci, H.; Zeybek, M. Comparison of diverse machine learning algorithms for forest fire susceptibility mapping in Antalya, Türkiye. Adv. Space Res. 2024, 74, 647–667. [Google Scholar] [CrossRef]
  50. Chen, X.; Zhang, Y.; Wang, S.; Zhao, Z.; Liu, C.; Wen, J. Comparative study of machine learning methods for mapping forest fire areas using Sentinel-1B and 2A imagery. Front. Remote Sens. 2024, 5, 1446641. [Google Scholar] [CrossRef]
  51. Gholamnia, K.; Nachappa, T.G.; Ghorbanzadeh, O.; Blaschke, T. Comparisons of diverse machine learning approaches for wildfire susceptibility mapping. Symmetry 2020, 12, 604. [Google Scholar] [CrossRef]
  52. Kalantar, B.; Ueda, N.; Idrees, M.O.; Janizadeh, S.; Ahmadi, K.; Shabani, F. Forest fire susceptibility prediction based on machine learning models with resampling algorithms on remote sensing data. Remote Sens. 2020, 12, 3682. [Google Scholar] [CrossRef]
  53. Choi, J.; Chae, H. Assessing wildfire risk in South Korea under climate change using the Maximum Entropy model and Shared Socioeconomic Pathway scenarios. Atmosphere 2025, 16, 5. [Google Scholar] [CrossRef]
  54. Kil, S.-H.; Lee, D.K.; Kim, H.G.; Kim, N.-C.; Im, S.; Park, G.-S. Comparing potential unstable sites and stable sites on revegetated cut-slopes of mountainous terrain in Korea. Sustainability 2015, 7, 15319–15341. [Google Scholar] [CrossRef]
  55. Choe, H.; Thorne, J.H.; Lee, D. Comparing climate projections for Asia, East Asia and South Korea. J. Environ. Impact Assess. 2017, 26, 114–126. [Google Scholar] [CrossRef]
  56. Hur, T.C.; Joo, S.H. Comparison of soil physical and chemical properties between coniferous and deciduous forests in Mt. Palgong. Curr. Res. Agric. Life Sci. 2002, 20, 39–47. [Google Scholar]
  57. Estanqueiro, M.; Šalamon, A.; Lewis, H.; Molloy, B.; Jovanović, D. Sentinel-2 imagery analyses for archaeological site detection: An application to Late Bronze Age settlements in Serbian Banat, southern Carpathian Basin. J. Archaeol. Sci. Rep. 2023, 51, 104188. [Google Scholar] [CrossRef]
  58. He, P.; Shi, Y.; Ding, H.; Yang, F. Classification and transition of grassland in Qinghai, China, from 1986 to 2020 with Landsat archives on Google Earth Engine. Land 2023, 12, 1686. [Google Scholar] [CrossRef]
  59. Vanama, V.S.K.; Mandal, D.; Rao, Y.S. GEE4FLOOD: Rapid mapping of flood areas using temporal Sentinel-1 SAR images with Google Earth Engine cloud platform. J. Appl. Remote Sens. 2020, 14, 034505. [Google Scholar] [CrossRef]
  60. Wang, S.; Feng, W.; Quan, Y.; Li, Q.; Dauphin, G.; Huang, W.; Li, J.; Xing, M. A heterogeneous double ensemble algorithm for soybean planting area extraction in Google Earth Engine. Comput. Electron. Agric. 2022, 197, 106955. [Google Scholar] [CrossRef]
  61. Quan, X.; Jiao, M.; He, Z.; Jaafari, A.; Xie, Q.; Lai, X. Effects of different sampling strategies for unburned label selection in machine learning modelling of wildfire occurrence probability. Int. J. Wildland Fire 2023, 32, 561–575. [Google Scholar] [CrossRef]
  62. Tavakoli, F. Dataset Creation and Imbalance Mitigation in Big Data: Enhancing Machine Learning Models for Forest Fire Prediction. Master’s Thesis, University of Waterloo, Waterloo, ON, Canada, 10 October 2023. [Google Scholar]
  63. Senay, G.B.; Friedrichs, M.; Morton, C.; Parrish, G.E.; Schauer, M.; Khand, K.; Kagone, S.; Boiko, O.; Huntington, J. Mapping actual evapotranspiration using Landsat for the conterminous United States: Google Earth Engine implementation and assessment of the SSEBop model. Remote Sens. Environ. 2022, 275, 113011. [Google Scholar] [CrossRef]
  64. Wiethase, J.H.; Critchlow, R.; Foley, C.; Foley, L.; Kinsey, E.J.; Bergman, B.G.; Osujaki, B.; Mbwambo, Z.; Kirway, P.B.; Redeker, K.R.; et al. Pathways of degradation in rangelands in Northern Tanzania show their loss of resistance, but potential for recovery. Sci. Rep. 2023, 13, 2417. [Google Scholar] [CrossRef]
  65. Balch, J.K.; Denis, L.A.S.; Mahood, A.L.; Mietkiewicz, N.P.; Williams, T.M.; McGlinchy, J.; Cook, M.C. FIRED (Fire Events Delineation): An open, flexible algorithm and database of US fire events derived from the MODIS burned area product (2001–2019). Remote Sens. 2020, 12, 3498. [Google Scholar] [CrossRef]
  66. Sharma, S.; Khanal, P. Forest fire prediction: A spatial machine learning and neural network approach. Fire 2024, 7, 205. [Google Scholar] [CrossRef]
  67. Carmo, M.; Moreira, F.; Casimiro, P.; Vaz, P. Land use and topography influences on wildfire occurrence in northern Portugal. Landsc. Urban Plan. 2011, 100, 169–176. [Google Scholar] [CrossRef]
  68. Piao, Y.; Lee, D.; Park, S.; Kim, H.G.; Jin, Y. Forest fire susceptibility assessment using Google Earth Engine in Gangwon-do, Republic of Korea. Geomat. Nat. Hazards Risk 2022, 13, 432–450. [Google Scholar] [CrossRef]
  69. Xu, H.; Chen, J.; He, G.; Lin, Z.; Bai, Y.; Ren, M.; Zhang, H.; Yin, H.; Liu, F. Immediate assessment of forest fire using a novel vegetation index and machine learning based on multi-platform, high temporal resolution remote sensing images. Int. J. Appl. Earth Obs. Geoinf. 2024, 134, 104210. [Google Scholar] [CrossRef]
Figure 1. Distribution of (a) forest fire occurrences and (b) non-forest fire reference points in the study area.
Land 14 01155 g001
Figure 2. Integrated workflow for forest fire risk prediction: Google Earth Engine was used for environmental data processing, machine learning models were used for risk classification, and Python was used for model evaluation.
Land 14 01155 g002
Figure 3. Pearson correlation analysis of 12 environmental variables collected from GEE.
Land 14 01155 g003
Figure 4. Forest fire probability values predicted by different machine learning models: (a) random forest; (b) XGBoost; (c) ANN. Insets present higher-spatial-resolution maps for two locations in the study area.
Land 14 01155 g004
Figure 5. Prediction bias maps showing differences in predicted fire probability values from the mean probability values for each machine learning model: (a) random forest; (b) XGBoost; (c) ANN. Insets present higher-spatial-resolution maps for two locations in the study area.
Land 14 01155 g005
Figure 6. Relative importance of environmental variables for forest fire risk prediction using three machine learning models: (a) random forest, (b) XGBoost, and (c) ANN.
Land 14 01155 g006
Figure 7. Confusion matrices and F1 scores for forest fire risk classification using three machine learning models: (a) random forest, (b) XGBoost, and (c) ANN.
Land 14 01155 g007
Figure 8. ROC curves and AUC values for forest fire risk prediction using random forest, XGBoost, and ANN models. The red dashed line represents a random classifier (AUC = 0.5), serving as a baseline for model comparison.
Land 14 01155 g008
Table 1. Environmental variables collected from GEE for forest fire risk prediction.
VariableDescriptionData SourceSpatial
Resolution
UnitTime
Period
Temporal Resolution
Land surface temperatureSurface temperature measured from satellite dataMODIS/006/MOD11A11 km°C
(converted)
2020–2023Daily
average
Temperature (2 m)Mean air temperature 2 m above the groundECMWF/ERA5_LAND/DAILY_AGGR~9 km°C
(converted)
2020–2023Daily
average
Relative humidityAtmospheric relative humidityECMWF/ERA5_LAND/DAILY_AGGR (dewpoint + temperature)~9 kmpercentage (%)2020–2023Daily
average
Soil moistureVolumetric soil moisture contentNASA_USDA/HSL/SMAP10KM_soil_moisture10 kmmm2020–2023Three-day average
Solar radiationSolar radiation received at the surfaceIDAHO_EPSCOR/TERRACLIMATE (srad)~4.6 kmW/m22020–2023Monthly average
PrecipitationTotal precipitationIDAHO_EPSCOR/TERRACLIMATE (pr)~4.6 kmmm2020–2023Monthly total
Snow equivalentEquivalent snow water contentIDAHO_EPSCOR/TERRACLIMATE (swe)~4.6 kmmm2020–2023Monthly average
Elevation (DEM)Digital elevation modelUSGS/SRTMGL1_003 (SRTM DEM)30 mm2000Static
NDVINormalized difference vegetation indexCOPERNICUS/S2_SR_HARMONIZED10 mindex
(−1 to 1)
2020–2023Monthly composite
Canopy heightHeight of forest canopyusers/potapovpeter/GEDI_V27 (UMD GEDI)30 mm2019–2020Static
Population densityPopulation density in the areaWorldPop/GP/100m/pop/KOR_2020100 mpersons per km22020Static
Wind speedAverage wind speedECMWF/ERA5_LAND/DAILY_AGGR (u10, v10)~9 kmm/s2020–2023Daily average
Disclaimer/Publisher’s Note: The statements, opinions and data contained in all publications are solely those of the individual author(s) and contributor(s) and not of MDPI and/or the editor(s). MDPI and/or the editor(s) disclaim responsibility for any injury to people or property resulting from any ideas, methods, instructions or products referred to in the content.

