Abstract
The sustainable development of minority characteristic villages (MCVs) is crucial to regional diversity, equality, and inclusion. However, it also faces multi-dimensional challenges, especially spatial imbalance. Taking Qiandongnan, China as a typical case, this study employed multiple methods to assess the sustainability of MCVs. First, this study constructed a comprehensive resistance surface integrating social, economic, and environmental dimensions based on the Minimum Cumulative Resistance (MCR) model and conducted a systematic assessment of the sustainability of MCVs in Qiandongnan. Second, this study evaluated the spatial distribution characteristics of MCV’s sustainability based on the kernel density analysis and the gravity model. Finally, this study proposed a targeted spatial optimization pathway. The results reveal there are significant spatial differences in MCVs; villages in the central, southern, and central-western Qiandongnan exhibit stronger sustainability, whereas the southwest and eastern regions are weak. Seven core villages and one key node were identified. Five sustainable development corridors were established to enhance spatial connectivity. This study provides novel insights for optimizing the spatial governance of MCVs for achieving regional sustainable development and enriches the knowledge body of global rural revitalization.
1. Introduction
Minority characteristic villages (MCVs) refer to those where the population of minorities is relatively concentrated and the proportion is relatively high, the production and living functions are relatively complete, and the cultural characteristics and settlement features of minorities are obvious [1]. MCVs in China have completely displayed the unique architectural art, traditional cultures, and lifestyles of ethnic groups. In particular, the MCVs in Yunnan, Guizhou, Xinjiang are the most representative [2,3]. MCVs are a vital spatial arena of traditional culture and significant geographical units for cultural diversity [4]. MCVs reflect the historical formation and evolution of ethnic settlements across different periods, regions, and cultural contexts, preserving the cultural gene of various ethnic groups and crystallizing their historical heritage [5]. However, in the context of intertwining urbanization, industrialization, and globalization, MCVs are facing multiple dilemmas between protection and development, tradition and modernity [6]. On the one hand, most MCVs are located in remote and underdeveloped areas with prominent poverty problems [7]. On the other hand, the ethnic culture and ecological environment of MCVs have suffered a huge impact, and the ethnic and rural characteristics of MCVs have disappeared rapidly [8]. The development of MCVs is a concentrated manifestation of urban–rural inequality and regional inequality in China [9]. Therefore, the transformation and sustainable development of MCVs is an important challenge for local governments and the academic community both in China and many other countries.
As a crucial spatial vehicle of cultural diversity, the sustainable development of MCVs has gained significant academic attention in recent years. Scholars have explored a wide range of topics regarding MCVs, including sustainable human settlements, cultural continuity, spatial planning and landscape preservation, sustainable tourism, and ecological sustainability [10,11,12,13,14,15]. Some scholars have summarized practical experiences for specific villages and identified obstacles to sustainable development. For example, Feng et al. (2024) proposed a multi-criteria evaluation model, integrating economic, social, and environmental dimensions, which has been proposed to enhance decision-making for MCVs’ sustainability [16]. In addition, scholars have also emphasized the need for rational spatial layouts to guide the development of mountainous ethnic townships, offering insights into spatial logic and strategies for conservation and tourism [17]. Current research primarily employs qualitative methods such as field surveys, the Delphi method, composite indices, coupling coordination models, and Pressure-State-Response (PSR) frameworks [18,19,20]. Although these approaches provide diverse perspectives, they often rely on subjective judgments and lack advanced technical tools for efficient data collection and spatial analysis. Furthermore, existing studies tend to focus on positive factors while neglecting resistance-based assessments. Therefore, adopting a novel method for comprehensive sustainability evaluation and constructing spatial optimization pathways for regional sustainable development of MCVs has significant theoretical and practical significance.
To address this gap, this study selected Qiandongnan, China as a typical case to conduct the sustainability assessment and spatial optimization of MCVs. Since 2014, China’s government has designated three batches totaling 1652 MCVs. Guizhou has rich resources of MCVs with 1328 provincial MCVs and 312 Chinese MCVs, both of which rank first in the country. In particular, Qiandongnan Miao and Dong Autonomous Prefecture, home to the largest concentrations of Miao and Dong populations, have been recognized as “National Demonstration Zones for Ethnic Unity and Progress” by the State Ethnic Affairs Commission of China, with 126 state-approved MCVs. These villages are distributed in various regions of Qiandongnan, and each village has its own unique cultural and historical background. Research on the sustainability and spatial optimization path of MCVs in this region is not only important for the sustainable development of local MCVs but also has reference value for other regions and countries.
This study selected 126 MCVs in Qiandongnan as research subjects and applied the Minimum Cumulative Resistance (MCR) model to construct a comprehensive resistance surface integrating social, economic, and environmental dimensions to assess sustainability. Based on the assessment results, five spatial optimization corridors are proposed to provide scientific guidance and policy references for the sustainable development of MCVs in Qiandongnan. The contribution of this study is multifold. First, this study provides a novel insight for rural revitalization and sustainable development through an empirical analysis of MCVs in Qiandongnan, China. Second, this study enriches the global knowledge body of rural development through the lens of MCVs in China. Finally, this study also provides a scientific basis for decision-making on the transformation and sustainable development of MCVs in China.
2. Materials and Methods
2.1. Study Area
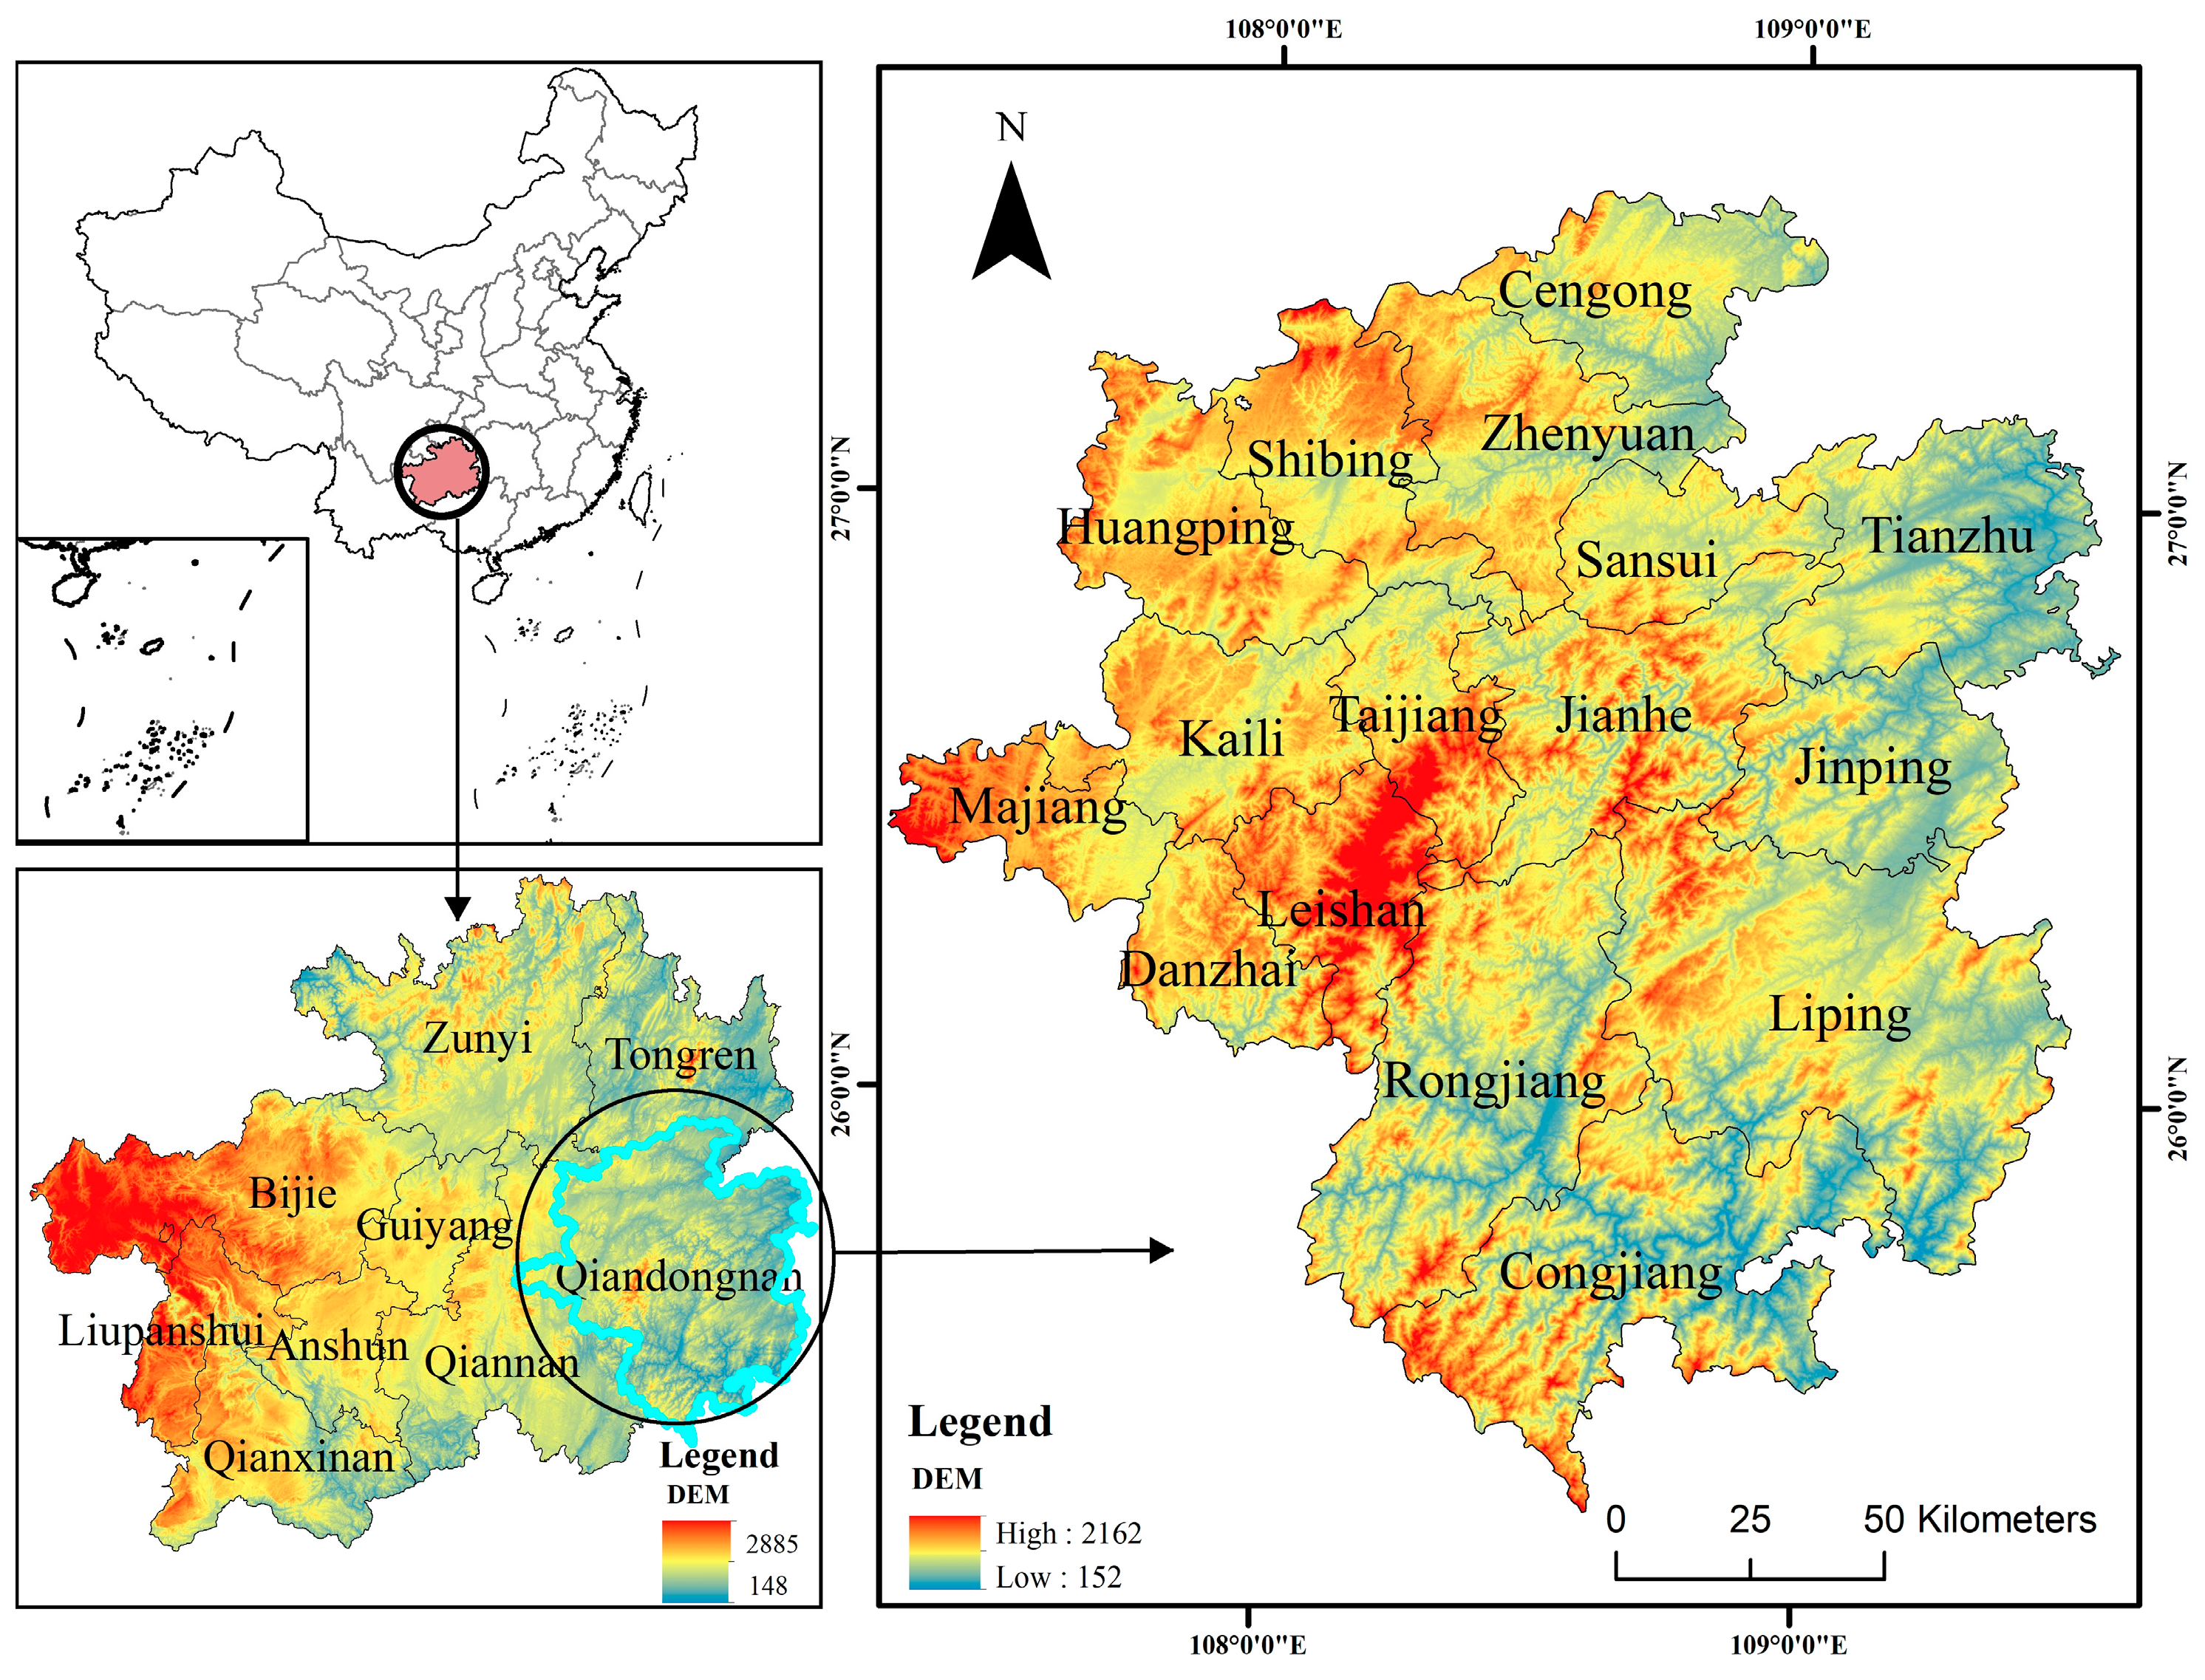
Qiandongnan Prefecture is located in the southeast of Guizhou Province, China. The terrain slopes downward from west to east, tilting toward the north, east, and south from its western highlands. Administratively, Qiandongnan governs 16 counties (Figure 1). As a major settlement area for ethnic minorities such as the Miao and Dong peoples, the minority population of Qiandongnan accounts for 81.6% of its total population. Qiandongnan is home to 126 state-designated MCVs recognized by the State Ethnic Affairs Commission as holding exemplary significance and reference value for regional development and cultural preservation. In addition, Qiandongnan is rich in ethnic cultural and intangible cultural heritage resources, including 56 national intangible cultural heritages and 218 provincial intangible cultural heritages. The protection of intangible cultural heritage is an important issue of sustainable development.

Figure 1.
Locations within Qiandongnan, China.
2.2. Methods
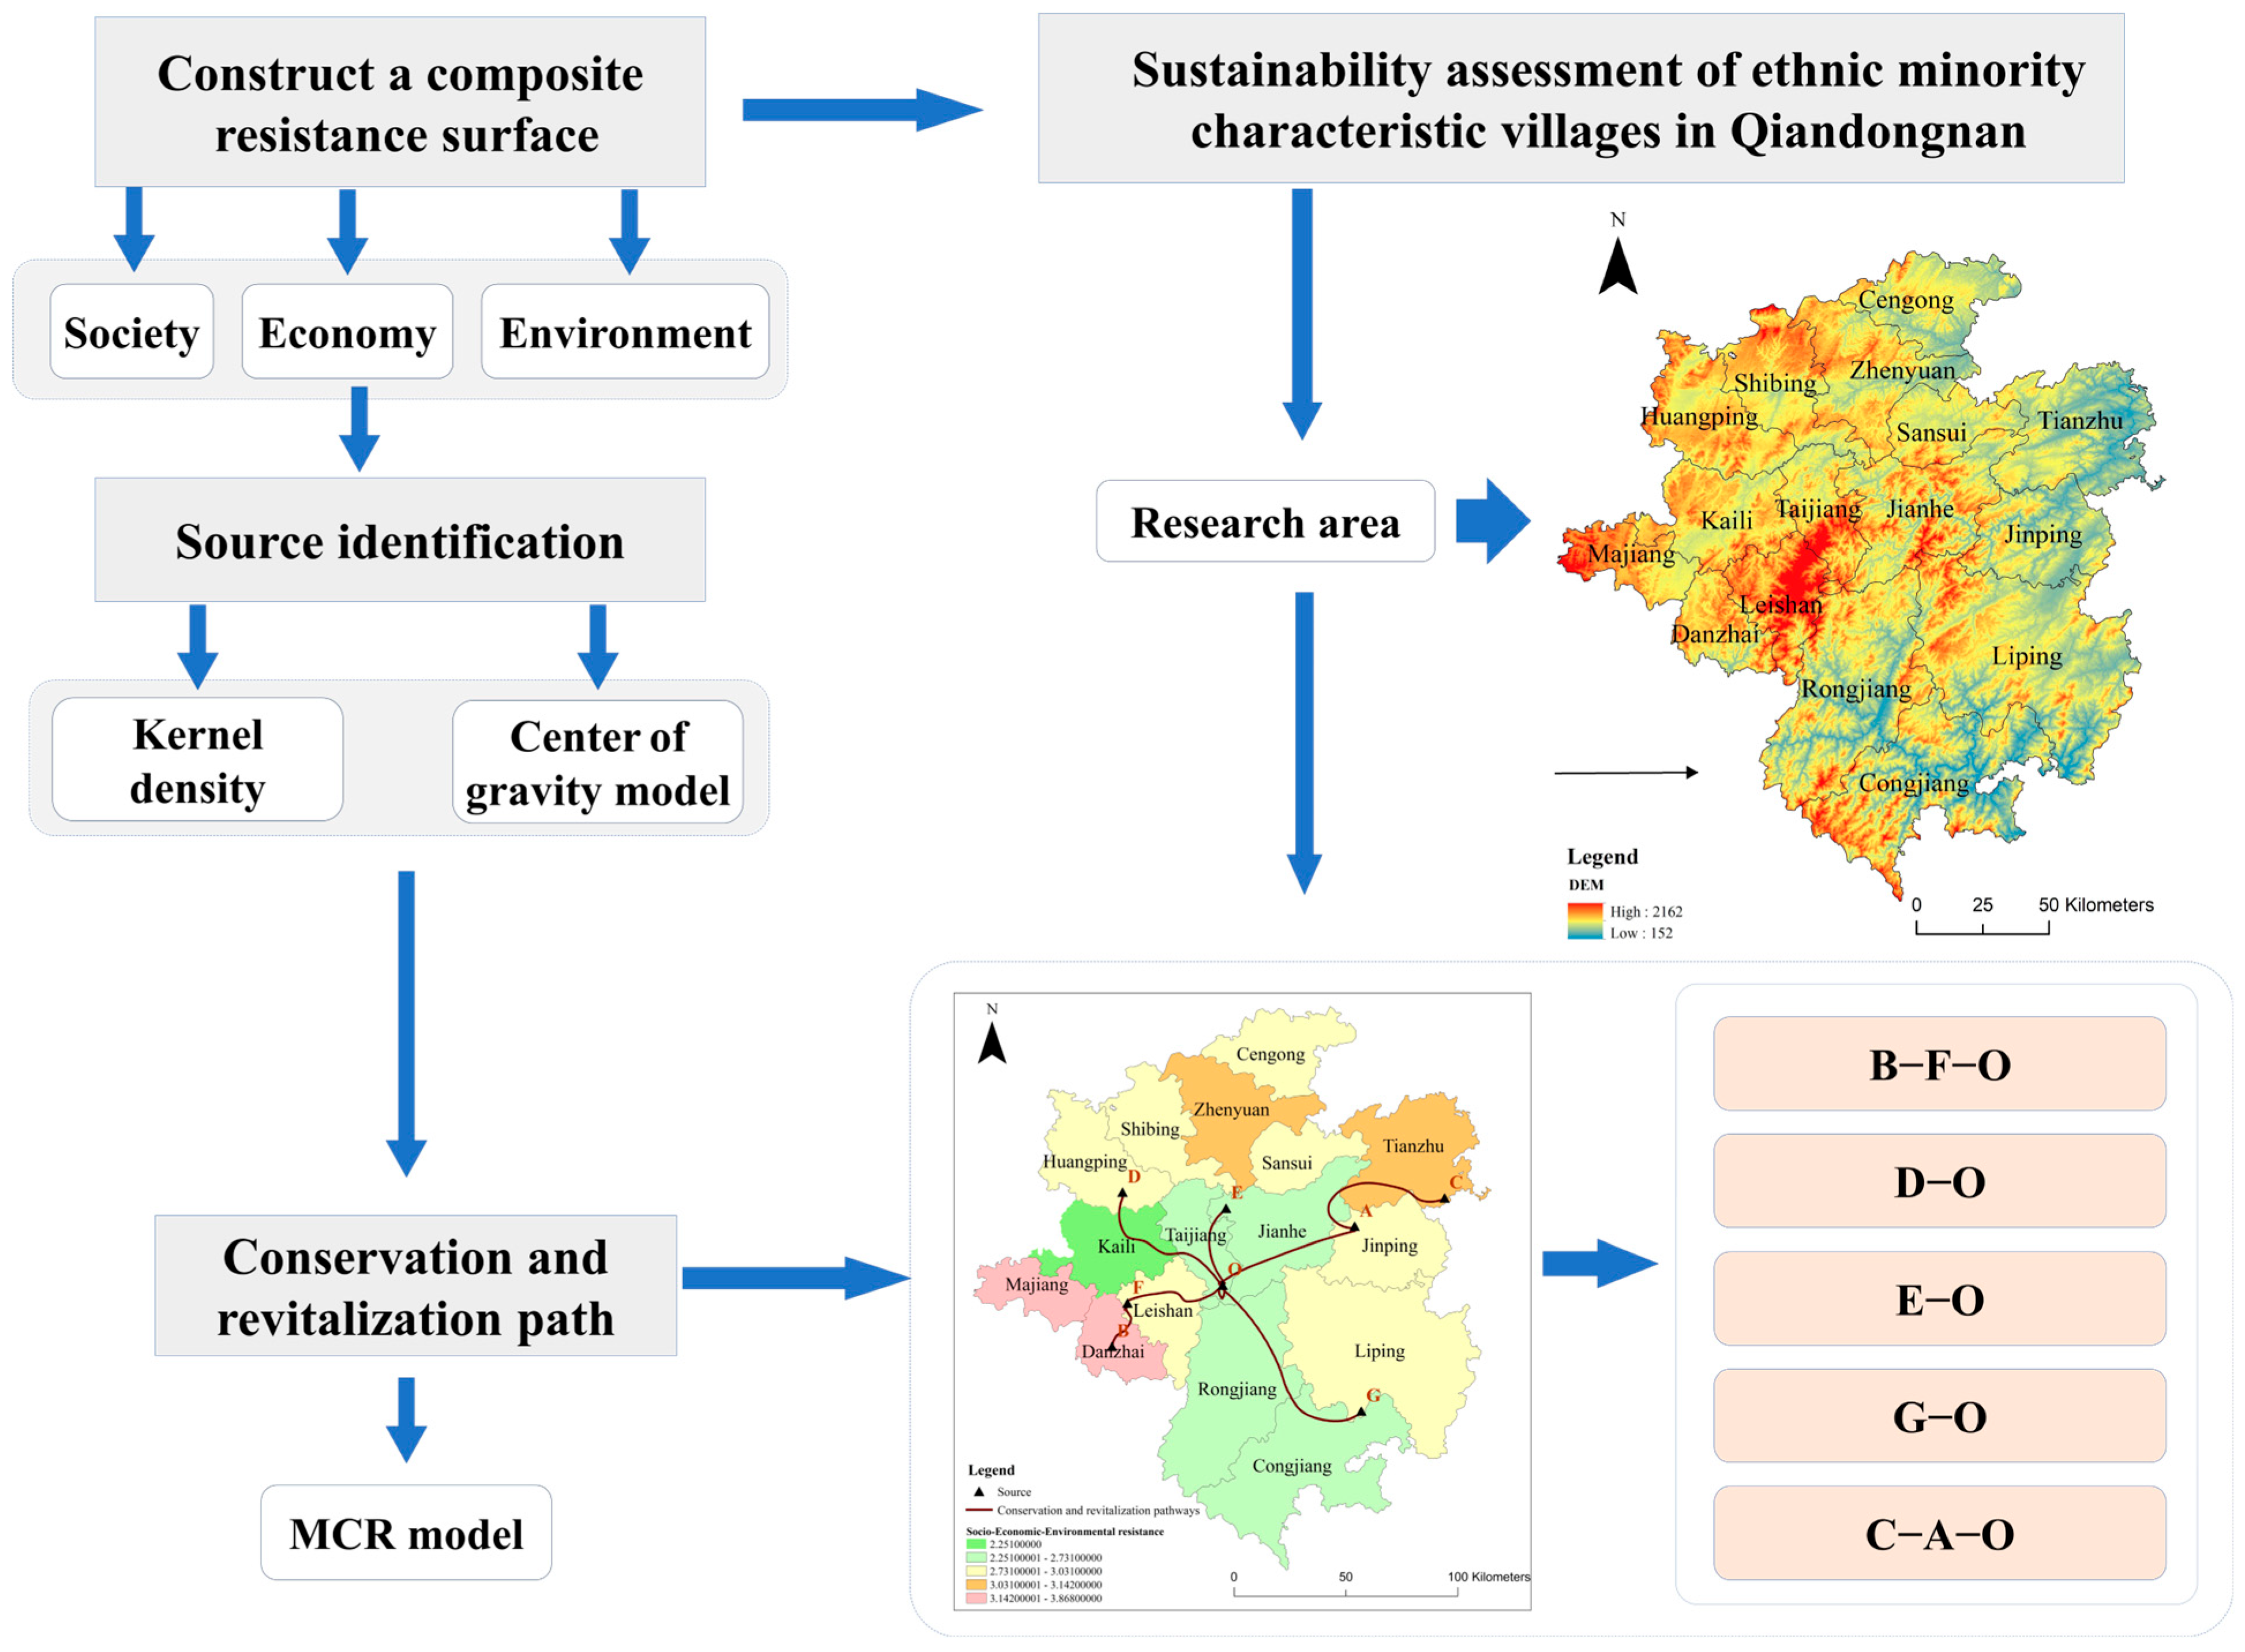
The specific research design of this study is as follows: First, a total of 15 indicators were selected across social, economic, and environmental dimensions based on the Minimum Cumulative Resistance (MCR) model. Second, the entropy method was applied to weigh single-factor resistance surfaces, which were composed of these 15 resistance factors, generating a comprehensive resistance surface. Third, spatial assessments were conducted using ArcGIS 10.2. Subsequently, methods such as kernel density estimation and the gravity model were employed to identify eight source areas of MCVs in Qiandongnan. Based on assessment results, five sustainable development corridors were constructed for MCVs sustainability. Finally, spatial optimization strategies for the sustainable development of MCVs in Qiandongnan were proposed (Figure 2).

Figure 2.
Research roadmap. (Note: Huangmen Village (A), Laodong Village (B), Longtang Village (C), Xiawengxi Village (D), Tunzhou Village (E), Wuxiang Village (F), Huanggang Village (G), and the center of gravity of MCVs (O)).
2.2.1. Minimum Cumulative Resistance Model
The MCR model was first proposed by Richard Kampe in 1976 [21]. This model calculates the resistance posed by different spatial dimensions to biological migration and species diffusion across varied spaces [22]. The pathway with the minimum cumulative resistance represents the lowest cost of movement and the highest potential for expansion, reflecting optimal accessibility, widely applied in fields such as rural settlement spatial pattern optimization as well as heritage network and landscape ecological network construction [23,24]. This study adopted the MCR model to construct a sustainability resistance surface for MCVs, enabling a systematic assessment of their sustainable development.
MCR is the minimum resistance value; is a positively correlated function of the minimum resistance of the distance from the source to the characteristic villages of ethnic minorities; represents the resistance factor i against the sustainable development of the villages; indicates the spatial distance of landscape base i from the source j of the village to a certain point. This study used kernel density estimation and gravity model analysis results, with the center of gravity of minority villages as the core source, and included Huangmen Village, Laodong Village, Longtang Village, Xiaweng, Tunzhou Village, Wuxiang Village, and Huanggang Village as the source areas.
The construction of a comprehensive resistance surface is one of the core steps in applying the minimum resistance model. This study selected indicators from three dimensions of sustainable development—social, economic, and environmental—to build the comprehensive resistance surface. First, the selected indicators were standardized. Then, the entropy method was used to calculate the weights of each resistance factor. The natural breaks method was applied to classify resistance factors into different categories, and appropriate resistance coefficients were assigned to derive resistance values. Resistance values were unified dimensionless coefficients assigned to resistance factors of varying levels. For villages, higher resistance values indicated greater challenges to sustainable development. The specific operational steps were as follows.
- Constructing the Indicator System
Drawing on existing indicator systems for assessing the sustainable development of traditional villages and relevant research literature [25,26,27,28,29], this study constructed a sustainable development indicator system for MCVs across three dimensions—social, economic, and environmental—and eight thematic areas: education, healthcare, population, income, consumption, climate, water, and waste. The secondary indicators included the following 15 metrics: Education expenditure as a percentage of GDP (%), school enrollment rate of school-age children (%), hospital beds per 1000 population (individuals), number of healthcare professionals per 1000 population (individuals), mortality rate (%), natural population growth rate (%), GDP per capita (CNY), total tourism revenue (CNY, billions), growth rate of general public budget expenditure (%), general public budget expenditure as a percentage of GDP (%), energy consumption per unit of gross output value (tons of standard coal per CNY 10,000), forest coverage rate (%), ambient air quality (e.g., P.M./PM10 concentrations), urban–rural household waste harmless treatment rate (%), and county-level domestic sewage treatment rate (%).
- Data Standardization
Because the different indicators had varying units of measurement, it was necessary to eliminate the dimensional differences in the raw data to enable comparison. Referring to existing research, the indicators were standardized using the following equations:
where: is the standardized value of indicator j for evaluation unit i, is the original value of the indicator, and max () and min () represent the maximum and minimum values of indicator j across all units, respectively.
- Weighting
The proportion of indicator j for evaluation object i was calculated as the following:
The information entropy of indicator was calculated as the following equation:
The divergence coefficient of indicator j: was determined via the following equation:
The weight was calculated through the following equation:
- Constructing resistance surface
Fifteen resistance factors were integrated to construct a comprehensive resistance surface (Table 1). Using the natural breaks classification method in ArcGIS, each factor was categorized into five levels (1, 2, 3, 4, 5), where higher values indicated greater resistance. The Air Quality Index (AQI), a dimensionless metric established by China’s Ministry of Ecology and Environment, was adopted for air quality classification. AQI is widely recognized for its authoritativeness, comprehensiveness, and reliability in monitoring air pollution levels. Sufficient educational funding is a critical driver of sustainable education development. The 4% threshold for government education expenditure (as a percentage of GDP) was applied to define resistance levels, as this benchmark was originally proposed to address historical underinvestment in education.

Table 1.
Comprehensive resistance surface for the sustainability of MCVs in Qiandongnan.
2.2.2. Kernel Density Analysis
Kernel density analysis is a method used to study the spatial distribution patterns of point features by calculating their density within surrounding neighborhoods [30]. Areas with higher point concentrations indicate greater probabilities of geographic events occurring, reflected by higher kernel density values, whereas sparser distributions yield lower values. This technique is typically implemented using the Spatial Analyst tools in ArcGIS.
2.2.3. Gravity Model
The Gravity Model calculates weighted spatial attributes by incorporating both geometric centers and specific spatial characteristics as weighting factors [31]. This study took area as the weight to calculate the center of gravity of MCVs in Qiandongnan. This center of gravity was taken as the core source, and the typical corridors for the sustainability of MCVs were constructed, effectively connecting the ethnic villages in the region, and being conducive to the spatial optimization of the sustainable development of MCVs. The equations were as follows:
where and represent longitude and latitude coordinates of the village cluster center of gravity, i represents the point features of the ethnic minority characteristic village belt within the study area, and represent geometric center coordinates of sub-region i, is area of the county containing MCVs, and n is total number of village points.
2.3. Data Sources
Considering data availability, this study employed 2022 panel data on county-level sustainable development in the Qiandongnan Prefecture. The data for indicators of economic development resistance, social development resistance, and environmental resistance were sourced from multiple official documents including the Statistical Bulletin of Qiandongnan 2022, Guizhou Statistical Yearbook 2023, Qiandongnan Statistical Yearbook 2023, and the 2023 work report of Qiandongnan government. Environmental data were obtained from the Qiandongnan Ecology and Environment Bureau, whereas the education expenditure-to-GDP ratio was calculated using GDP and education expenditure figures. The geographic coordinates of MCVs were primarily acquired through address-to-coordinate conversion via the Map Location website, followed by verification in ArcGIS. The 90 m-resolution DEM data for Qiandongnan was sourced from the Geo-spatial Data Cloud platform, and China’s administrative boundary map was developed based on the standard map from the National Administration of Surveying, Mapping, and Geographic Information.
3. Results
3.1. Sustainability Assessment
3.1.1. Single-Factor Resistance Surface Identification
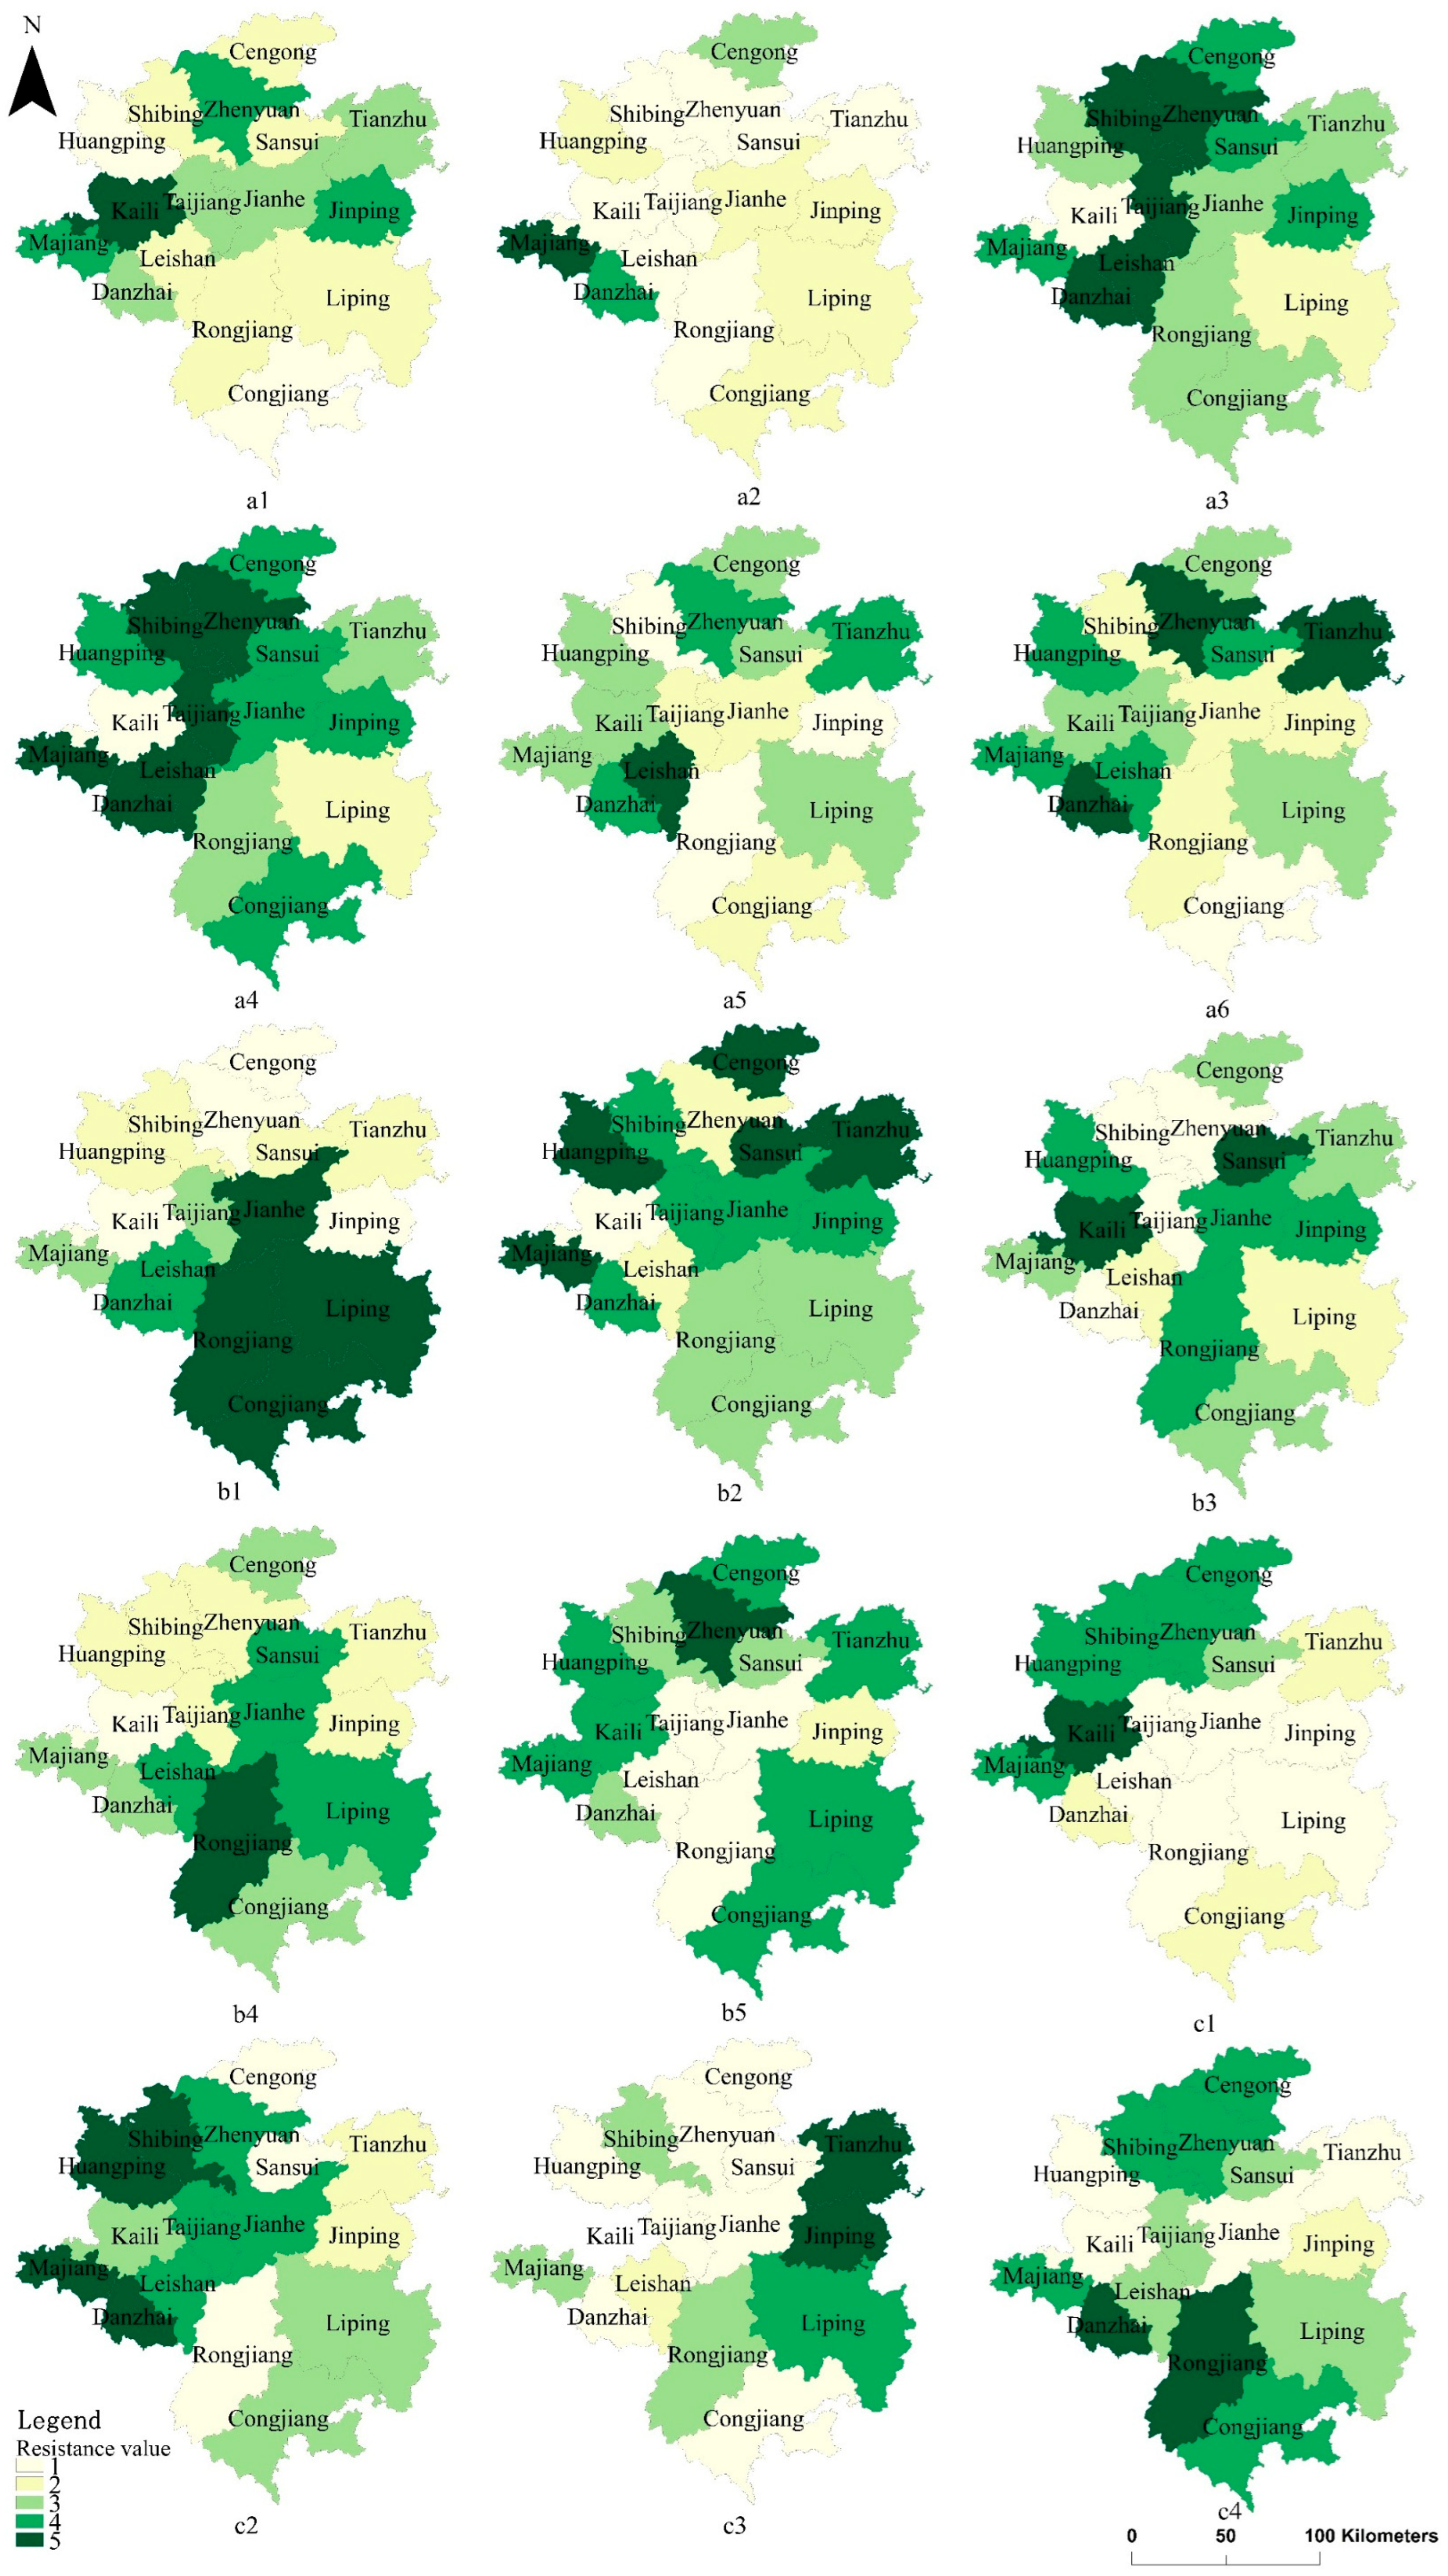
This study established a comprehensive resistance surface for sustainable development by treating MCVs as source areas and integrating multidimensional evaluation indicators. Villages exhibiting lower resistance values were interpreted as having stronger sustainability, whereas higher-resistance villages indicated weaker sustainability. Following the resistance indicator classifications and weights described in Table 1, this study systematically calculated 15 individual resistance surfaces after standardizing the coordinate systems and projections of all source datasets. The analysis specifically examined (i) social development resistance factors (a1–a6 including education, healthcare and population indicators), (ii) economic development resistance factors (b1–b5 covering income and consumption dimensions), and (iii) environmental resistance factors (c1–c4 encompassing land use, climate, water resources and waste management) with the resultant single-factor resistance surfaces (Figure 3).

Figure 3.
Single-factor resistance surface. (a1–a6) social development resistance, (b1–b5) economic development resistance, (c1–c4) environmental resistance factors.
The spatial resistance levels varied significantly across different indicators. Based on resistance values, the single-factor resistance surfaces for MCVs in Qiandongnan were categorized into four distinct spatial patterns, including surfaces with lower resistance in southern regions, surfaces with lower resistance in northern regions, surfaces with higher resistance in southern regions, and surfaces with higher resistance in northern regions. Specifically, the resistance surfaces for education expenditure as a percentage of GDP (Figure 3(a1)), enrollment rate of school-age children (Figure 3(a2)), mortality rate (Figure 3(a5)), natural population growth rate (Figure 3(a6)), and forest coverage rate (Figure 3(c1)) exhibited lower resistance in southern areas. In contrast, the comprehensive ambient air quality index (Figure 3(c2)), urban sewage treatment rate (Figure 3(c3)), and GDP per capita (Figure 3(b1)) showed lower resistance in northern regions. Conversely, higher resistance was observed in southern areas for GDP per capita (Figure 3(b1)) and urban–rural domestic waste harmless treatment rate (Figure 3(c4)). Meanwhile, northern regions displayed higher resistance for the number of health technicians (Figure 3(a4)), hospital beds per 1000 people (Figure 3(a3)), natural population growth rate (Figure 3(a6)), and energy consumption per unit of gross output value (Figure 3(b5)). This spatial differentiation highlights distinct regional disparities in sustainable development constraints, with southern areas facing stronger economic and waste management pressures, whereas northern regions encounter greater challenges in healthcare access and energy efficiency.
3.1.2. Comprehensive Resistance Surface Identification
Building on the single-factor resistance surfaces, this study systematically constructed four distinct resistance surfaces: social development resistance, economic development resistance, environmental resistance, and a comprehensive socio-economic-environmental integrated resistance surface. The resistance surfaces model was used to evaluate 126 MCVs in Qiandongnan (Figure 4). The resistance value is inversely proportional to sustainability; that is, the greater the resistance value, the weaker the sustainability. In this study, those with weak resistance values and strong sustainability were indicated by green and light green, while the remaining colors indicated larger resistance values and weak sustainability (Figure 4).
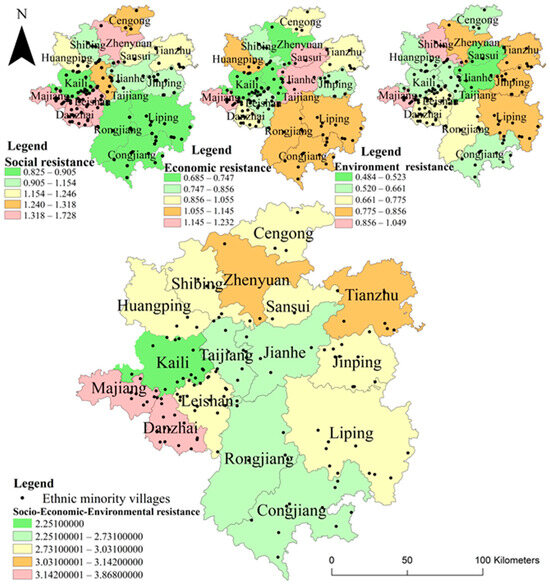
Figure 4.
Socio-economic-environmental resistance surface.
The social development resistance surface revealed that villages in southern Qiandongnan exhibited relatively stronger sustainability, whereas those in the northern and southwestern regions demonstrated weaker sustainability performance. Regarding economic sustainability, villages in the northwest showed greater resilience, contrasting with central and southern areas where economic sustainability was more constrained. The environmental resistance surface indicated superior environmental sustainability among central-region villages compared to their southwestern and eastern counterparts. The analysis of the integrated socio-economic-environmental resistance surface demonstrated that villages in central, southern, and central-western Qiandongnan faced lower resistance values (2.25–2.73), indicating stronger overall sustainability. Conversely, villages in southwestern and eastern regions encountered higher resistance values (2.73–3.86), reflecting weaker sustainability conditions. Geospatial distribution analysis showed that the 126 MCVs are dispersed across the prefecture, with the western region serving as the primary concentration area.
The analysis revealed distinct spatial patterns across multiple sustainability dimensions: a clear north–south divergence in social development sustainability, contrasting economic sustainability between the northwest (stronger) and central-south regions (weaker) and notable environmental advantages in the central region compared to challenges in eastern and western areas. The integrated assessment identified optimal sustainability conditions along the central-south corridor while highlighting the western cluster as the demographic core of MCVs. This multi-dimensional resistance surface approach successfully captured the complex spatial heterogeneity of sustainable development challenges throughout MCVs of Qiandongnan, demonstrating its effectiveness in revealing regional disparities and development priorities.
The analysis revealed significant spatial disparities in sustainability among Qiandongnan. Danzhai County’s 15 MCVs and Majiang County’s 8 MCVs face the strongest resistance and weakest sustainability. Although Zhenyuan and Tianzhu counties also showed relatively high resistance and weak sustainability, they contain fewer MCVs. Kaili, despite having a limited number of MCVs, demonstrated the strongest sustainability. Regionally, MCVs in central-western and southern Qiandongnan exhibited relatively stronger sustainability. Conversely, villages in southwestern, northern, and eastern regions will require more proactive intervention policies to establish scientific development pathways and improve village governance capacity. These findings suggest the need for differentiated regional strategies, such as reinforcing successful models in high-sustainability areas while implementing targeted support programs to address specific constraints in lagging regions.
3.2. Spatial Optimization Pathway
3.2.1. Source Area Identification
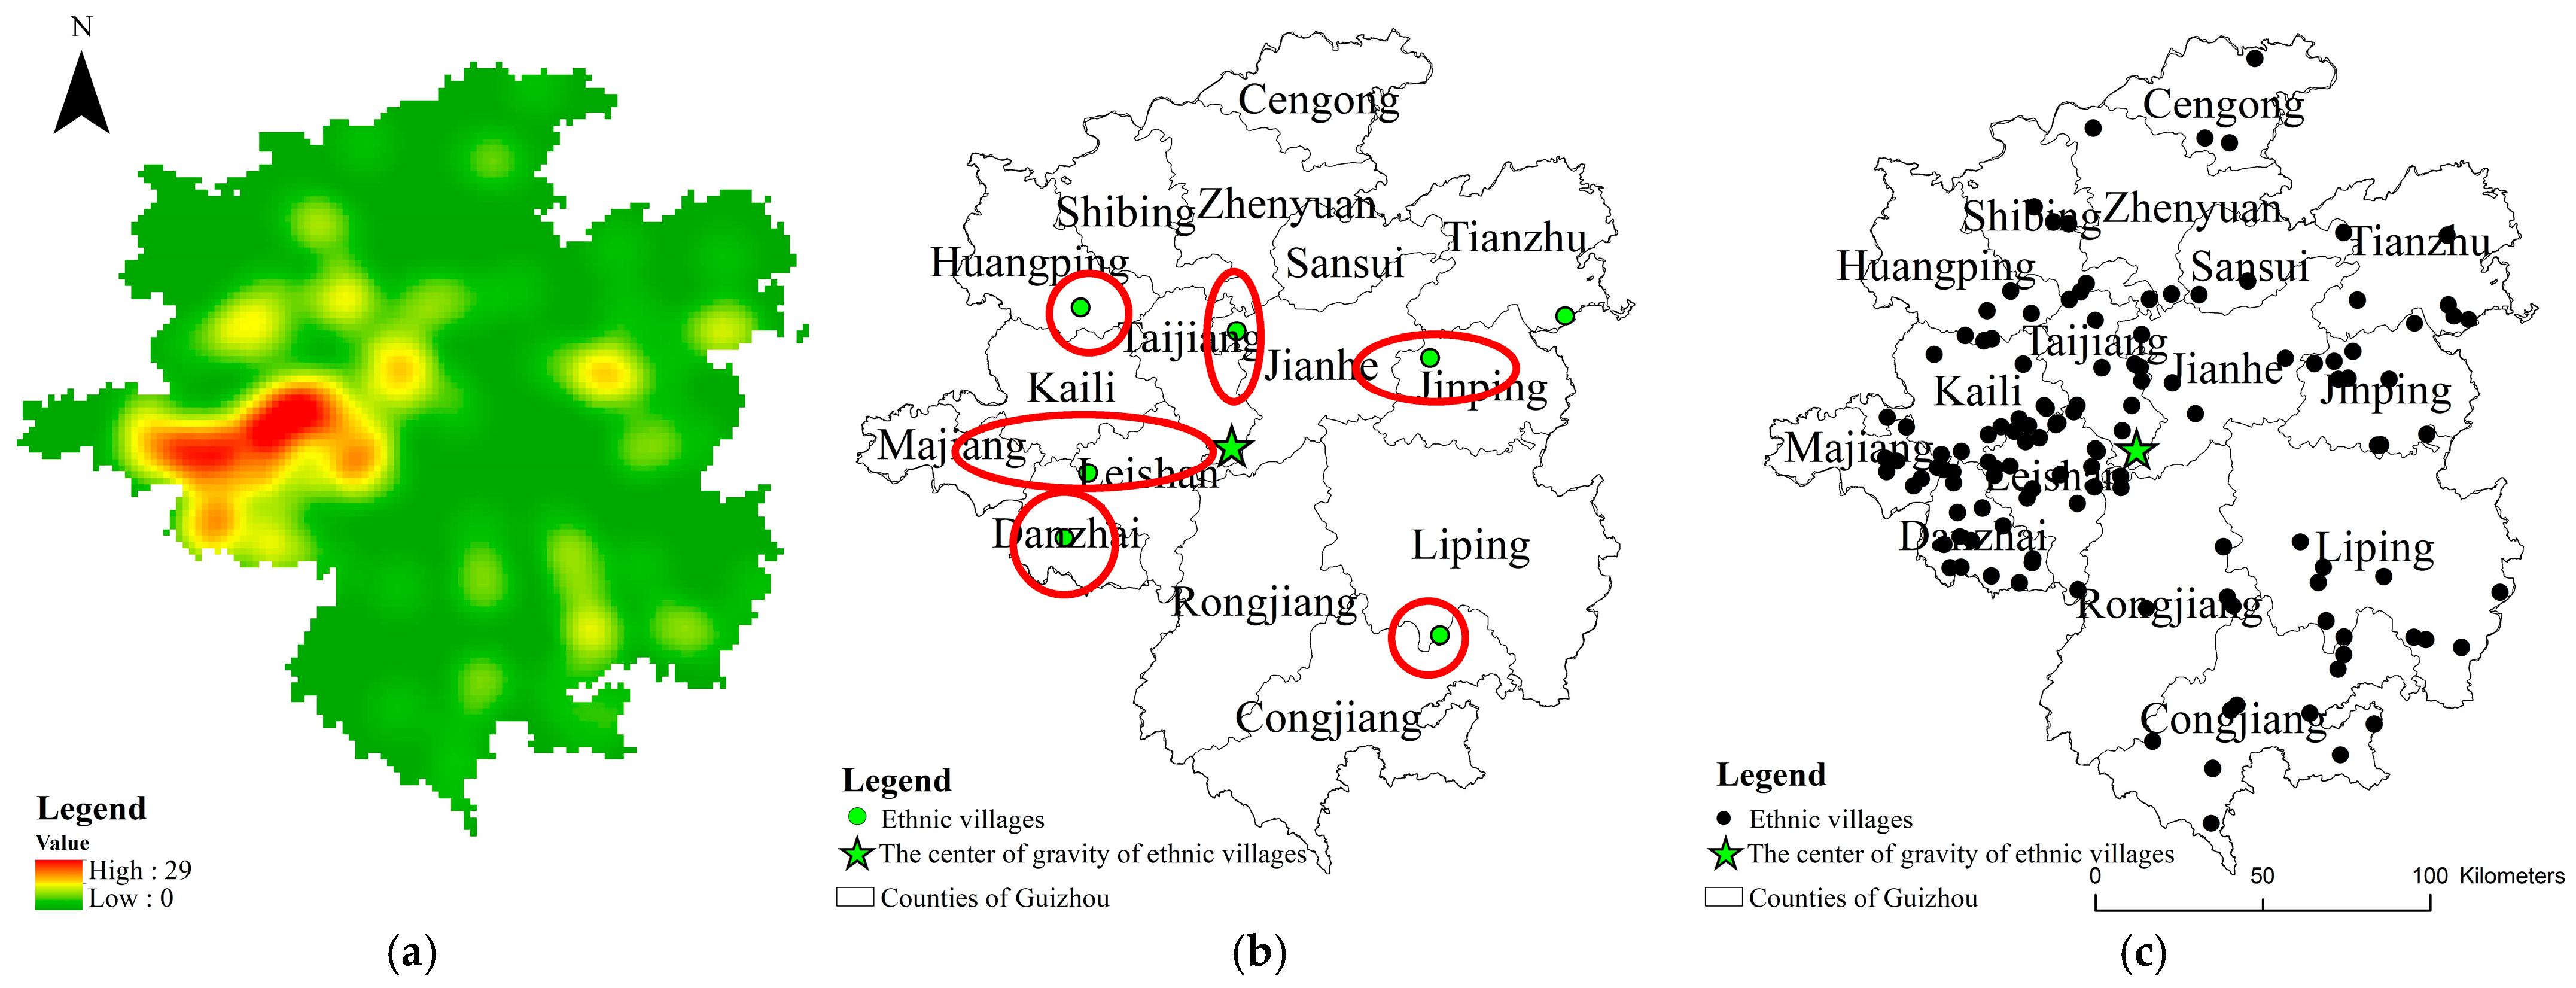
Identifying the source areas of MCVs is the key step in building a spatial optimization pathway. First, a kernel density estimation was conducted on 126 MCVs in Qiandongnan to determine their clustering status. The core areas with high-density distribution of MCVs were selected as the source of spatial optimization paths for MCVs (Figure 5a,b). Second, the centroid model was used to obtain the distribution center of gravity of MCVs in Qiandongnan (Figure 5c). As an important node connecting all MCVs in Qiandongnan Prefecture, the center of gravity can effectively connect the seven core source areas identified in this study. Through the above two methods, one important node of the center of gravity for MCVs that included seven source areas was constructed: Huangmen Village, Laodong Village, Longtang Village, Xiawengxi Village, Tunzhou Village, Wuxiang Village, and Huanggang Village.

Figure 5.
Identification of the core source of MCVs. (a) result of the Kernel density analysis, (b) source of spatial optimization paths for MCVs, (c) center of gravity of MCVs.
3.2.2. Spatial Optimization Pathway Construction
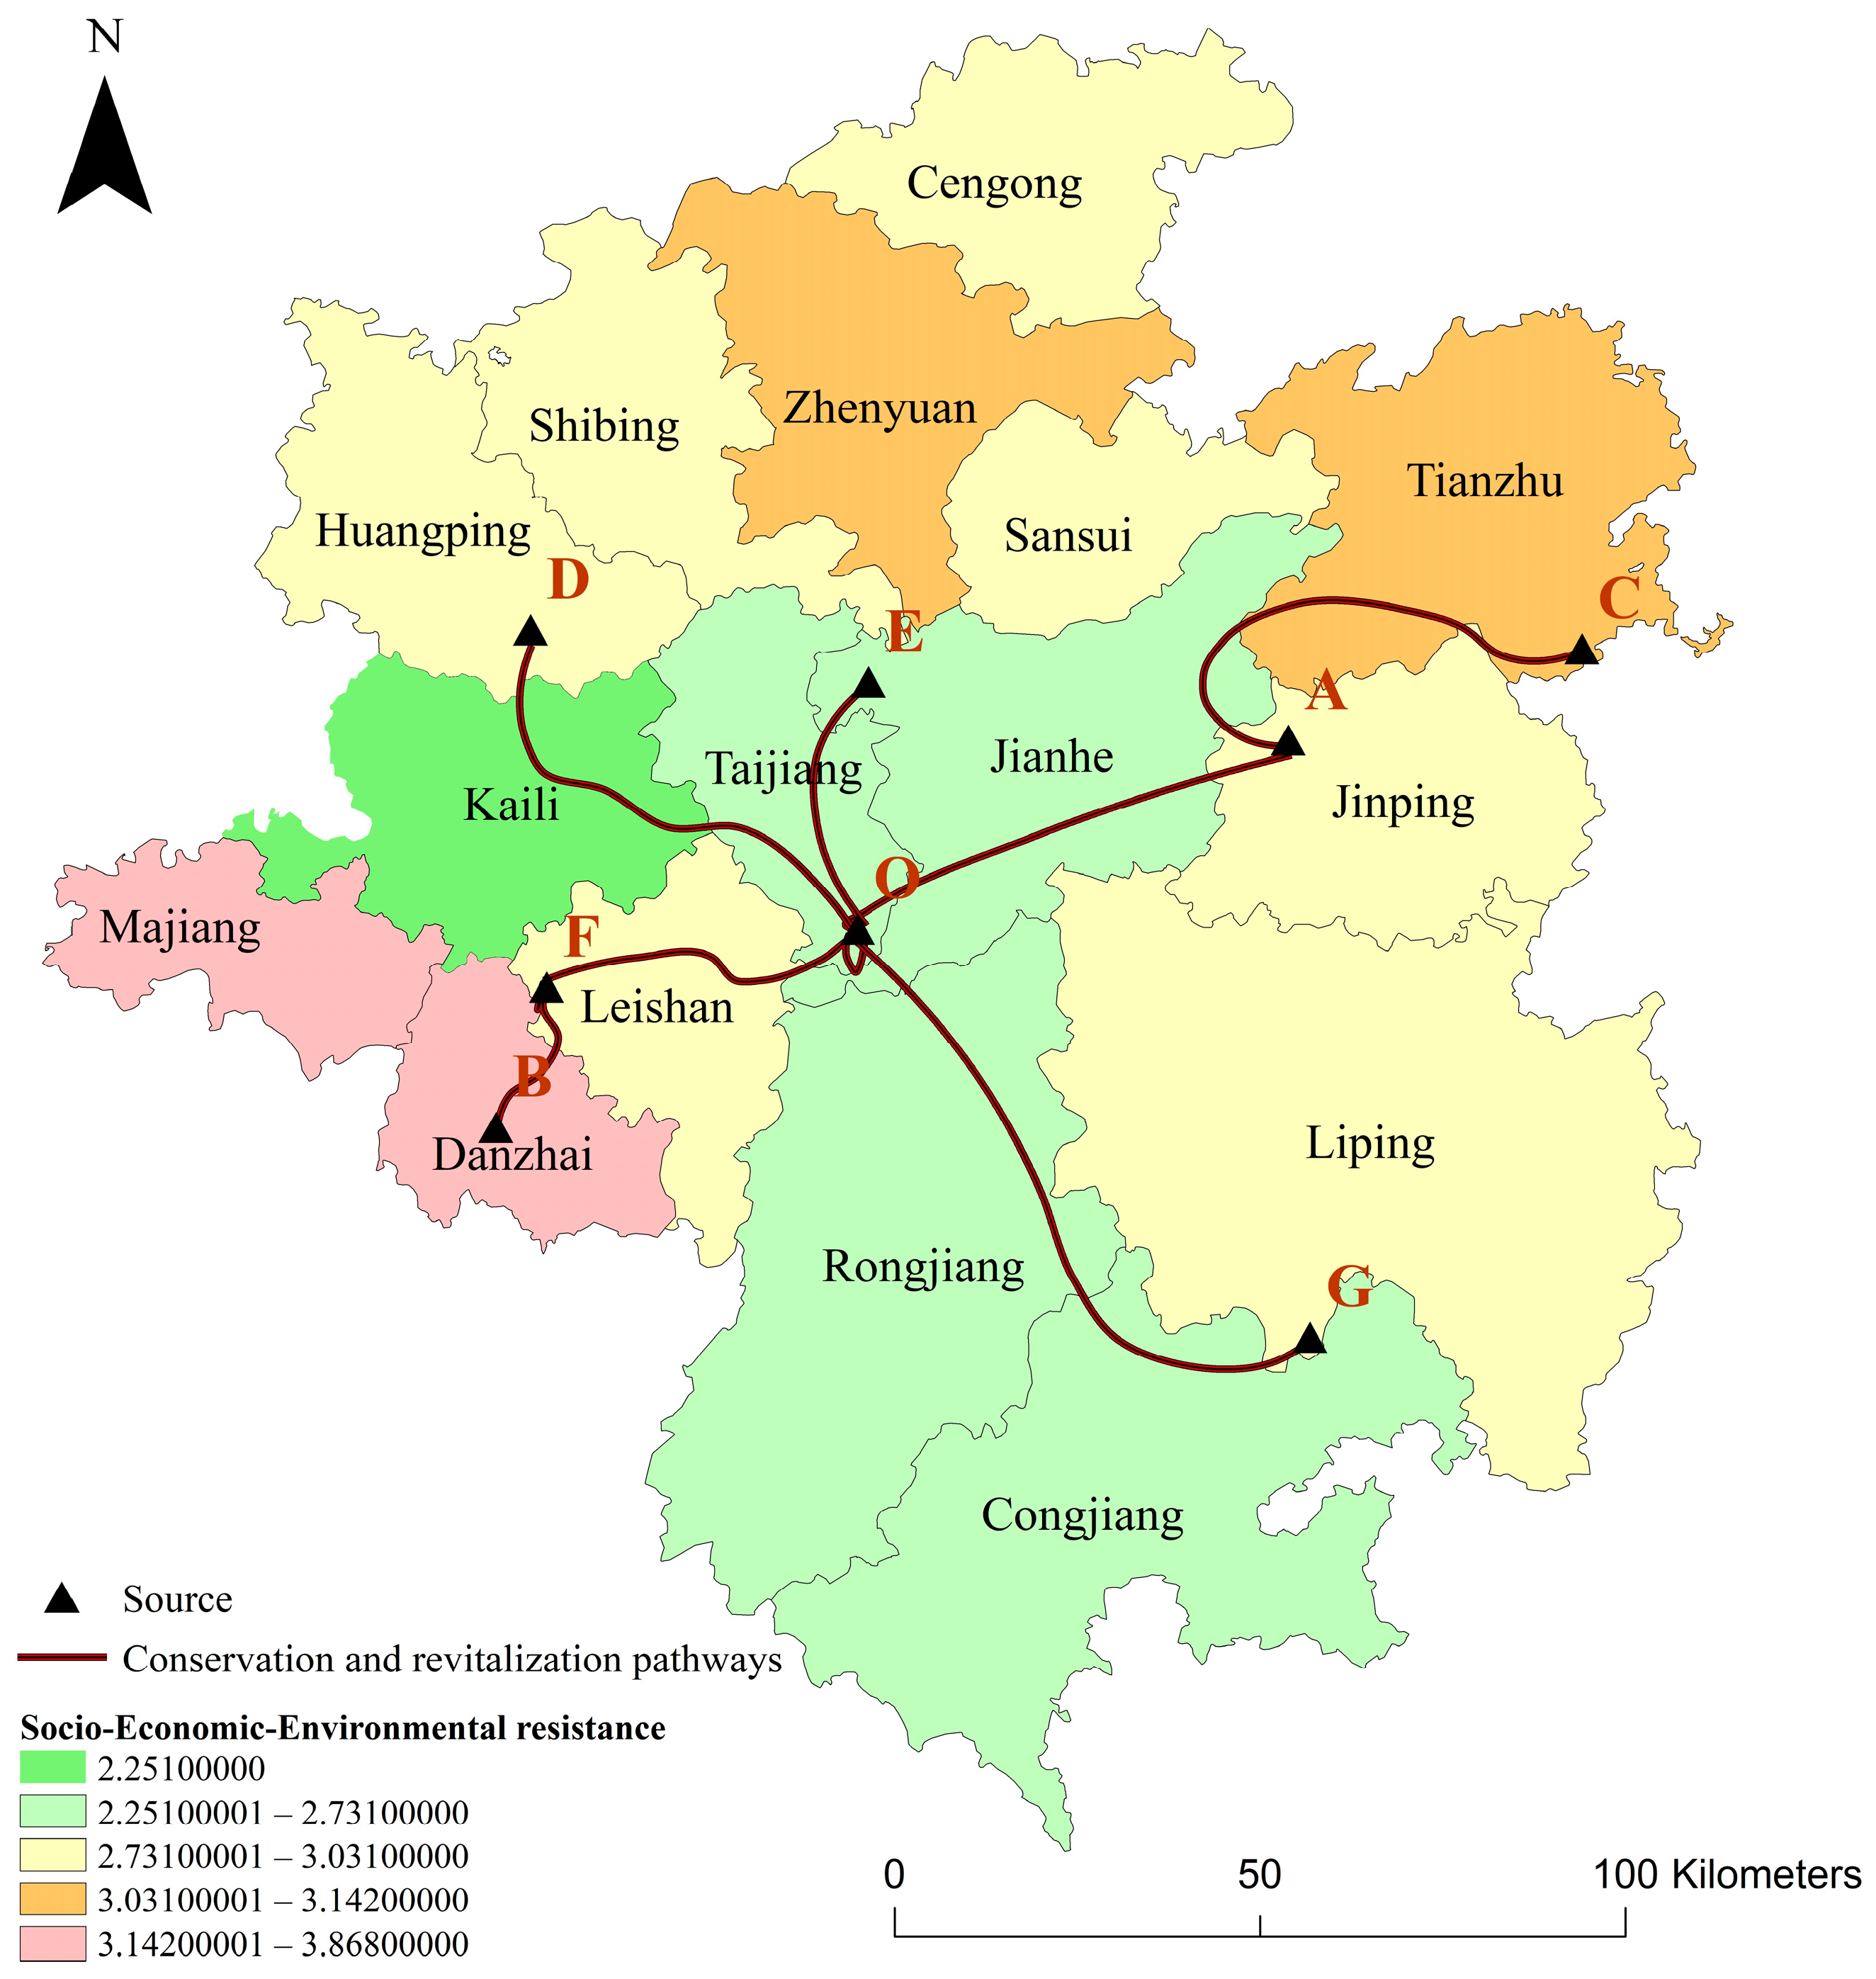
The purpose of constructing the spatial optimization path for MCVs in Qiandongnan is to activate spatial governance that facilitates better preservation and development of traditional MCVs. The spatial optimization of MCVs can be understood as overcoming spatial resistance to establish sustainable development corridors connecting different cultural source areas, thereby forming a spatial network and achieving coordinated development. By constructing model sustainable development corridors from core cultural source areas, a point-axis development pattern can be formed. This approach links key points into linear corridors and expands corridors into networks, ultimately creating sustainable development corridors for MCVs in Qiandongnan that harmoniously integrate cultural heritage with natural environments. This spatial optimization strategy will enhance communication and collaborative development among all MCVs across Qiandongnan.
First, labeling was performed on the seven identified core source areas and one important node: Huangmen Village (A) in Jinping County, Laodong Village (B) in Danzhai County, Longtang Village (C) in Tianzhu County, Xiawengxi Village (D) in Huangping County, Tunzhou Village (E) in Jianhe County, Wuxiang Village (F) in LeiShan County, Huanggang Village (G) in Liping County, and the center of gravity of MCVs (O) in Qiandongnan. Taking the center of gravity of MCVs in Qiandongnan as the core, this study ultimately obtained the sustainable development corridors of MCVs in Qiandongnan, including Laodong Village–Wuxiang Village–center of gravity of MCVs in Qiandongnan (B-F-O); Xiawengxi Village–center of gravity of MCVs in Qiandongnan (D-O); Tunzhou Village–center of gravity of MCVs in Qiandongnan (E-O); Huanggang Village–center of gravity of MCVs in Qiandongnan (G-O); and Longtang Village–Huangmen Village–center of gravity of MCVs in Qiandongnan (C-A-O) (Figure 6). Building a spatial network of villages can strengthen the connections and integration between MCVs, effectively addressing the issue of sustainability polarization in MCVs.
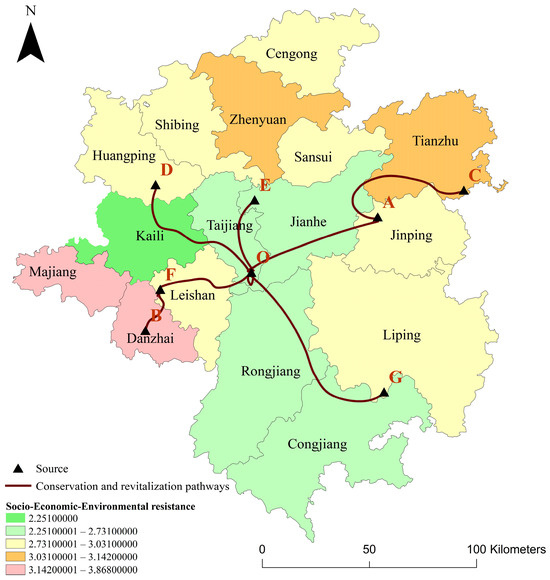
Figure 6.
Corridors for the sustainable development of MCVs.
Constructing a rational spatial network for MCVs constitutes a critical approach to achieving holistic conservation and sustainable development while serving as a vital pathway to reinforce regional cultural integrity and foster coordinated regional progress. This framework provides innovative perspectives for revitalizing and optimizing concentrated MCVs clusters in Qiandongnan. Analysis of sustainability assessments across these MCVs reveals that exemplary sustainable development corridors predominantly radiate from the central high-sustainability zones toward peripheral areas with weaker sustainability. Notably, counties including Majiang, Danzhai, Lei Shan, and Kaili exhibit dense concentrations of MCVs yet demonstrated the lowest sustainability. The establishment of B-F-O corridors facilitates spatial connectivity with high-sustainability villages in central Qiandongnan, enabling peripheral areas to leverage core resources for sustainability. These five spatial corridors form the developmental core and axes of the regional MCVs spatial network. Their implementation will strengthen socio-economic interactions across territories, promote the integration and transmission of ethnic cultures, and ultimately drive synergistic regional development.
4. Discussion
This study employs the MCR model to systematically evaluate the sustainability of MCVs from social, economic, environmental, and comprehensive dimensions. It identifies spatial distribution characteristics and proposes targeted spatial optimization pathways. This study proposes a spatially analytic framework for MCVs that integrates corridor construction with spatial governance. However, there has always been an inherent tension in MCVs between the necessity of protection and the need for development. That is the so-called “conservation-development paradox” [32].
Rural sustainable development has become a global hotspot in recent years, with sustainable development research on traditional villages attracting significant attention [33]. As a special type of traditional village, MCVs not only exhibit the general characteristics and challenges of rural development but also possess unique ethnic cultures and features, which are crucial to maintaining diversity, equality, and inclusion. Therefore, this study holds important theoretical and policy value [34].
Previous studies on sustainable development in MCVs primarily focused on constructing indicator systems for evaluation. In contrast, this study emphasizes resistance factors to sustainability, conducting an in-depth analysis from the perspectives of obstacle identification and spatial characteristics. The greater the resistance, the weaker the sustainability. This provides another insight into the sustainable development of MCVs. This is a key contribution of this study.
This study emphasizes innovative research in two aspects from a spatial perspective. On one hand, this study systematically analyzes the spatial patterns of MCVs’ sustainability across single-factor and multi-factor comprehensive scales, revealing significant spatial heterogeneity. On the other hand, this study identifies a multi-center structure of regional MCVs and discovers five sustainable development corridors. These central villages and corridors collectively form a point–axis model for the regional sustainable development of MCVs, providing a foundation for spatial optimization and governance of MCVs. This is another key contribution of this study.
The sustainability resistance model constructed in this study does not include specific indicators of cultural heritage, but there is a close relationship between sustainability and cultural heritage. The MCVs in the central, western, and southern regions of Qiandongnan have strong sustainability and a large number of intangible cultural heritages. For instance, Rongjiang and Taijiang counties each have nine. On one hand, the protection of intangible cultural heritage contributes to sustainable development. On the other hand, sustainable development provides opportunities and guarantees for the protective development of intangible cultural heritage.
This study also has limitations, such as whether the conclusions drawn based on a single case are universal, and the lack of evolutionary analysis caused by using a single annual panel data. Future potential research could include developing adaptive governance and spatial governance models and formulating context-sensitive spatial optimization models through comparative case studies. Given the dynamic nature of rural development and the temporal variability in resistance factors, a longitudinal and dynamic assessment to track development efficacy is needed in the future. In addition, cultural preservation is crucial to the development of MCVs; future research might attempt to operationalize cultural indicators alongside the current technical framework.
5. Conclusions and Policy Implications
This study investigated 126 MCVs in Qiandongnan, employing 15 indicators across social, economic, and environmental dimensions to construct single-factor resistance surfaces. These surfaces were subsequently weighted and synthesized into a socio-economic-environmental comprehensive resistance surface to assess village sustainability. Through kernel density estimation and the gravity model, this study identified seven source areas and one critical node for MCVs in the region, establishing five corridors for sustainable development. The findings are as follows.
The MCVs in Qiandongnan show significant spatial heterogeneity. The MCVs in the central, southern, and central-western regions show strong sustainability, while the MCVs in the southwest and eastern regions shows weak sustainability.
Five typical corridors for sustainable development have been established, including Laodong–Wuxiang–the center of gravity of MCVs in Qiandongnan; Xiawengxi–the center of gravity of MCVs in Qiandongnan; Tunzhou–the center of gravity of MCVs in Qiandongnan; Huanggang–the center of gravity of MCVs in Qiandongnan; and Longtang–Huangmen–the center of gravity of MCVs in Qiandongnan.
In the context of interweaving globalization, industrialization, urbanization, and sustainable development, MCVs are facing diversified challenges, including the demographic hollowing-out resulting from labor migration to cities, the deterioration of the ecological environment, the destruction of traditional culture by modernization, and insufficient sustainable driving force. Dealing with these challenges is a common task for local governments and the academic community.
This study examined Qiandongnan as a typical case to evaluate the sustainability and spatial optimization paths of local MCVs. The findings reveal significant sustainability disparities across the region, with pronounced vulnerabilities observed in specific clusters. Based on the research results, we put forward targeted policy suggestions.
- Interventions for Low-Sustainability MCVs
Some MCVs exhibit weak sustainability, such as Majiang, Danzhai, Zhenyuan, and Tianzhu counties; thus, active intervention measures should be taken. First, local governments can realize the spillover effect of resources by planning to establish corridors linking low-sustainability and high-sustainability villages. Second, local governments should formulate proactive industrial revitalization measures, including targeted financial support and expansive infrastructure development, and prioritize the development of culturally embedded industries. Third, governments should take the cultural-economic synergy effect into account. Last, governments should construct an ecological governance mechanism, including implementing clustered ecological conservation zones with stringent anti-over development regulations.
- 2.
- Consolidate High-Sustainability MCVs
For high-sustainability MCVs, such as Kaili, measures should be taken to further consolidate and develop. Local governments should summarize successful experiences and promote them. Local governments should also establish cultural transmission centers to systematize intangible heritage documentation and education. Finally, they should optimize inter-village resource circulation through digital platforms and cooperative networks.
- 3.
- Digital Empowerment for Ecological-Cultural Governance
A comprehensive “digital twin + intelligent decision-making” system should be implemented through synergistic technological interventions, including developing 3D digital archives for MCVs; creating holographic models of endangered traditional architecture while establishing cultural gene mapping systems; and deploying environmental sensor networks for real-time monitoring of critical ecological zones.
Author Contributions
Conceptualization, M.W. and Z.C.; methodology, A.H.; software, M.W.; validation, A.H. and Z.C.; formal analysis, M.W. and A.H.; investigation, M.W. and A.H.; resources, Q.Z.; data curation, M.W.; writing—original draft preparation, M.W. and A.H.; writing—review and editing, Z.C. and Q.Z.; supervision, Q.Z.; project administration, Q.Z.; funding acquisition, Z.C. All authors have read and agreed to the published version of the manuscript.
Funding
This research was funded by the Guizhou Provincial Major Scientific and Technological Program (No. [2023]113) and the National Natural Science Foundation of China (No. 42271185).
Data Availability Statement
The raw data supporting the conclusions of this article will be made available by the authors on request.
Conflicts of Interest
The authors declare no conflicts of interest.
References
- Zhang, X. Protection and Development of Ethnic Minority Characteristic Cultural Villages. BCP Educ. Psychol. 2023, 10, 208–214. [Google Scholar] [CrossRef]
- Zheng, G.-h.; Jiang, D.-f.; Luan, Y.-f.; Yao, Y. GIS-Based Spatial Differentiation of Ethnic Minority Villages in Guizhou Province, China. J. Mt. Sci. 2022, 19, 987–1000. [Google Scholar] [CrossRef]
- Xu, X.; Genovese, P.V.; Zhao, Y.; Liu, Y.; Woldesemayat, E.M.; Zoure, A.N. Geographical Distribution Characteristics of Ethnic-Minority Villages in Fujian and Their Relationship with Topographic Factors. Sustainability 2022, 14, 7727. [Google Scholar] [CrossRef]
- Yang, J. Living as a Tree: The Concept of Symbiosis in the Zhanli Kam Minority Village. Asian J. Soc. Sci. Stud. 2022, 7, 15. [Google Scholar] [CrossRef]
- Zhong, H. Protection and Development of Minority Characteristic Villages in the Context of Rural Revitalization—Take Guizhou Province as an Example. J. Humanit. Arts Soc. Sci. 2023, 7, 1240–1249. [Google Scholar] [CrossRef]
- Hannum, E.; Wang, F. Fewer, Better Pathways for All? Intersectional Impacts of Rural School Consolidation in China’s Minority Regions. World Dev. 2022, 151, 105734. [Google Scholar] [CrossRef]
- Shao, D.; Zoh, K. Analysis of Spatial Distribution Characteristics and Driving Factors of Ethnic-Minority Villages in China Using Geospatial Technology and Statistical Models. J. Mt. Sci. 2024, 21, 2770–2789. [Google Scholar] [CrossRef]
- Song, J. Ethnic Minority Characteristic Villages from the Perspective of Rural Revitalization Inheritance and Innovation of Architectural Culture: A Case Study of Oroqen Nationality. Int. J. Arts Humanit. Stud. 2022, 2, 68–77. [Google Scholar] [CrossRef]
- Ferretto, P.W.; Cai, L. Village Prototypes: A Survival Strategy for Chinese Minority Rural Villages. J. Archit. 2020, 25, 1–23. [Google Scholar] [CrossRef]
- Zhang, G.; Zu, G.; Li, M.; Lin, W. Minority Rural Tourism Development Planning Based on Targeted Poverty Alleviation: A Case Study of Chaikeng She Village in Jiaocheng District of Ningde City, Fujian Province, China. J. Landsc. Res. 2018, 10, 97–101. [Google Scholar]
- MU, Q. Understanding Heritage-Led Development of the Historic Villages of China: A Multi-Case Study Analysis of Tongren. Hist. Environ. Policy Pract. 2022, 13, 216–241. [Google Scholar] [CrossRef]
- Gong, L.; Yang, J.; Wu, C.; Zhou, H. Fractal Characteristics of the Spatial Texture in Traditional Miao Villages in Qiandongnan, Guizhou, China. Sustainability 2023, 15, 13218. [Google Scholar] [CrossRef]
- Gao, W.; Zhuo, X.; Xiao, D. Spatial Patterns, Factors, and Ethnic Differences: A Study on Ethnic Minority Villages in Yunnan, China. Heliyon 2024, 10, e27677. [Google Scholar] [CrossRef] [PubMed]
- Sun, Y.; Zhan, H.; Gao, C.; Li, H.; Guo, X. Spatial Syntactic Analysis and Revitalization Strategies for Rural Settlements in Ethnic Minority Areas: A Case Study of Shuanglang Town, China. Buildings 2024, 14, 2531. [Google Scholar] [CrossRef]
- Li, X.; Xie, C.; Morrison, A.M.; Nguyen, T.H.H. Experiences, Motivations, Perceptions, and Attitudes Regarding Ethnic Minority Village Tourism. Sustainability 2021, 13, 2364. [Google Scholar] [CrossRef]
- Feng, W.-W.; Huang, Z.-S.; Zhang, Y.-B.; Liu, Y.-F.; Pang, M. Landscape Scenic Beauty of Traditional Dong Minority Villages in Southeast of Guizhou Province. Chin. J. Ecol. 2019, 38, 3820–3830. [Google Scholar] [CrossRef]
- Qin, F.; Fukamachi, K.; Shibata, S. Land-Use/Landscape Pattern Changes and Related Environmental Driving Forces in a Dong Ethnic Minority Village in Southwestern China. Land 2022, 11, 349. [Google Scholar] [CrossRef]
- Xue, B.; Hong, L.; Xu, K. Research on the Sustainable Development of Villages in China’s Minority Regions Promoted by Cultural Factors<Br>A Case Study of Changyang Tujia Autonomous County in China. Am. J. Ind. Bus. Manag. 2020, 10, 944–962. [Google Scholar] [CrossRef]
- Wang, B.; Rosenberg, M.W.; Wang, S.; Yang, P.; Tian, J. Multilevel and Spatially Heterogeneous Factors Influencing Poor Households’ Income in a Frontier Minority Area in Northeast China. Complexity 2021, 2021, 8834422. [Google Scholar] [CrossRef]
- Li, F.; Ye, Y.; Song, B.; Wang, R. Evaluation of Urban Suitable Ecological Land Based on the Minimum Cumulative Resistance Model: A Case Study from Changzhou, China. Ecol. Model. 2015, 318, 194–203. [Google Scholar] [CrossRef]
- Luo, L.; Yang, C.; Chen, R.; Liu, W. Comprehensive Land Consolidation Zoning Based on Minimum Cumulative Resistance Model—A Case Study of Chongqing, Southwest China. Land 2023, 12, 1935. [Google Scholar] [CrossRef]
- Wei, H.; Zhu, H.; Chen, J.; Jiao, H.; Li, P.; Xiong, L. Construction and Optimization of Ecological Security Pattern in the Loess Plateau of China Based on the Minimum Cumulative Resistance (MCR) Model. Remote Sens. 2022, 14, 5906. [Google Scholar] [CrossRef]
- Zhu, K.; Chen, Y.; Zhang, S.; Yang, Z.; Huang, L.; Lei, B.; Li, L.; Zhou, Z.; Xiong, H.; Li, X. Identification and Prevention of Agricultural Non-Point Source Pollution Risk Based on the Minimum Cumulative Resistance Model. Glob. Ecol. Conserv. 2020, 23, e01149. [Google Scholar] [CrossRef]
- Wu, J.; Zuo, J.; Li, L.; Yang, Y.; Yang, M.; Liu, S. Evaluation of Rural Ecological Resilience from the Perspective of Communities and Farmers: A Study on Laochehe Ethnic Minority Village in China. Environ. Res. Commun. 2024, 6, 045010. [Google Scholar] [CrossRef]
- Hu, Q.; Xiang, L.; Lin, A.; Hou, Y.; Dai, Y. Exploring the Spatial Configuration of Tourism Resources through Ecosystem Services and Ethnic Minority Villages. Ecol. Inform. 2024, 79, 102426. [Google Scholar] [CrossRef]
- Xu, X.; Genovese, P.V. Assessment on the Spatial Distribution Suitability of Ethnic Minority Villages in Fujian Province Based on GeoDetector and AHP Method. Land 2022, 11, 1486. [Google Scholar] [CrossRef]
- Chen, P.; Nutteera, P.; Yan, Y.; Chai, C.T. Research on Driving Factors and Mechanism of Minority Village Tourism Development in Guizhou Province, China1. Heliyon 2023, 9, e20483. [Google Scholar] [CrossRef]
- Ma, X.; Shi, Y.; Zhang, S.; Yang, J.; Guo, L. Analysis of the Impact of Traditional Ethnic Villages in Hani Area on Sustainable Development. PLoS ONE 2023, 18, e0283142. [Google Scholar] [CrossRef]
- Firdaus; Hardjosoekarto, S.; Lawang, R.M.Z. The Role of Local Government on Rural Tourism Development: Case Study of Desa Wisata Pujonkidul, Indonesia. Int. J. Sustain. Dev. Plan. 2021, 16, 1299–1307. [Google Scholar] [CrossRef]
- Fleming, C.H.; Calabrese, J.M. A New Kernel Density Estimator for Accurate Home-Range and Species-Range Area Estimation. Methods Ecol. Evol. 2017, 8, 571–579. [Google Scholar] [CrossRef]
- Wu, C.; Ye, X.; Du, Q.; Luo, P. Spatial Effects of Accessibility to Parks on Housing Prices in Shenzhen, China. Habitat Int. 2017, 63, 45–54. [Google Scholar] [CrossRef]
- Jing, Z.; Yu, Y.; Wang, Y.; Su, X.; Qiu, X.; Yang, X.; Xu, Y. Study on the Mechanism of Livelihood Behavior Decision of Rural Residents in Ethnic Tourism Villages in Western Sichuan. Ecol. Indic. 2024, 166, 112250. [Google Scholar] [CrossRef]
- Hossain, M.; Park, S.; Shahid, S. Frugal Innovation for Sustainable Rural Development. Technol. Forecast. Soc. Change 2023, 193, 122662. [Google Scholar] [CrossRef]
- Genovese, P.V.; Xu, X.; Wu, H.; Hao, D.; Wang, H. Assessment of Environmental Suitability for the Spatial Distribution of Minority Villages in Mountainous Areas—Taking Fujian Province as an Example. Land 2025, 14, 131. [Google Scholar] [CrossRef]

Disclaimer/Publisher’s Note: The statements, opinions and data contained in all publications are solely those of the individual author(s) and contributor(s) and not of MDPI and/or the editor(s). MDPI and/or the editor(s) disclaim responsibility for any injury to people or property resulting from any ideas, methods, instructions or products referred to in the content. |
© 2025 by the authors. Licensee MDPI, Basel, Switzerland. This article is an open access article distributed under the terms and conditions of the Creative Commons Attribution (CC BY) license (https://creativecommons.org/licenses/by/4.0/).