Abstract
Increasing anthropogenic disturbance in urban areas and the expansion of built-up zones into surrounding rural landscapes represent one of the most significant spatial and ecological challenges of recent decades. Urban expansion influences not only land use patterns but also the ecological integrity and naturalness of the landscape. In the present study, anthropogenic landscape change trends and changes in land cover categories were investigated within the current administrative boundaries of Nyíregyháza, a county seat located in northeastern Hungary. Using data from the CORINE Land Cover program (1990, 2000, 2012, 2018) and historical military surveys (1819–1869), landscape development trends within the municipality were examined over the past one and a half centuries. Particular attention was focused on examining changes in the extent of built-up areas, which are among the most concerning from a landscape ecological perspective. By comparing the results with data from other Hungarian cities (Debrecen and Szeged), a significant increase—nearly 20%—in built-up areas was identified. The proportion of built-up areas in relation to the total municipal administrative area increased in all the periods studied, even in those where the population was decreasing. This indicates that even in municipalities experiencing demographic decline, internal population redistribution may lead to the spatial growth of certain neighborhoods, which are the primary contributors to the expansion of built-up urban areas. Finally, based on CORINE Land Cover data, the ecological conditions of Nyíregyháza were assessed, and a hemeroby map of the municipality was created, reflecting landscape changes that occurred between 1990 and 2018. It was found that over a 28-year period, the total area of the most ecologically problematic meta- and polyhemerobic categories increased by 6%, in parallel with the growth of built-up areas.
1. Introduction
Increasing anthropogenic impacts and the transformation of the original landscape structure can be observed in almost all populated areas in recent times [1,2]. These transformations can be particularly intense in cities and their peripheries, where they are most often associated with expansion of settlement fabric, expansion of transport infrastructure, intensification of agricultural activity, or changes in land use [3,4]. Changes in landscape structure can significantly alter the ecological potential, conservation value, and naturalness (hemeroby) of the area concerned [5,6]. A particularly significant issue is the intensifying urban development driven by suburbanization and the expansion of industrial activities, resulting in a substantial increase in the proportion of built-up areas. This often entails the permanent sealing of soils and the withdrawal of land from cultivation [7]. In addition, urban development can lead to severe degradation or even the destruction of habitats, along with the loss of ecological functions in the affected areas [8].
Suburbanization is spreading to ever larger areas around the world. In Europe, the process is now evident in almost all major urban areas. Suburbanization first appeared in the countries of Western Europe and then, with a considerable delay, has been present in Central, Eastern, and Southeastern Europe since around 1990–2000 [9,10].
Suburbanization is most often understood as the expansion of suburban areas outside the administrative boundaries of cities and an increase in population. In addition, however, there is also the spatial reallocation of population within the administrative boundaries of the municipality, the flow of population from inner cities to suburban areas, mainly in the form of detached houses, which can be considered as internal suburbanization [11,12]. Both forms of this process ultimately result in a significant increase in the area of built-up surfaces.
A number of studies have examined the relationship between suburbanization and the growth of built-up areas [10,12]. Hardi and colleagues have investigated the phenomenon in the case of Nitra, using CORINE and Urban Atlas databases and field research [10]. Cocheci and Petrisor evaluated the adverse effects of suburbanization in five Romanian cities [9]. In Hungary, Nagy and Hegedűs studied the internal suburbanization of medium-sized cities in Zalaegerszeg and Hegedüs and colleagues in Debrecen [12,13]. In Nyíregyháza, Bácskainé and Kókai carried out similar research, identifying the directions of suburbanization and the main spatial differences in its intensity [14].
Particularly notable are the Benelux countries (especially the Netherlands), Ireland, and the Spanish Riviera, where both population and urban sprawl are growing intensively. However, there are also areas where the population is decreasing but the number of properties and the population are increasing (the interior of Spain and most of East-Central Europe, including Hungary in general) [11,15,16].
In the case of Nyíregyháza, expansion is mainly observed within the administrative boundaries, but some settlements in the immediate vicinity of the city (Nyírtelek, Nyí-rpazony) show signs of external suburbanization and agglomeration [14].
Over the past decades, several studies have been carried out to investigate the intensification of anthropogenic impacts and the expansion of built-up areas, and in certain cases, their impact on landscape structure and ecological functions [17,18,19]. Most studies in the literature have investigated this phenomenon using remote sensing methods based on the analysis of satellite imagery, which enables research at very large spatial scales [20,21]. For detecting regional or local changes in European areas, several authors have used CORINE Land Cover data [22]; however, some studies have also aimed to compare the two approaches [23,24,25].
Among the limited number of studies conducted in Hungary, Szilassi examined changes in individual land cover categories at the national scale [6]. Iváncsics provided a more detailed analysis of the expansion of built-up areas in Hungarian settlements, but did not examine the landscape-level or ecological implications of these changes [26,27].
In the present study, the changes in the extent of each land cover and land use category within the municipality were examined. In addition, changes in the extent of built-up areas—such as contiguous and non-contiguous settlement structures, as well as industrial and commercial units—were analyzed in detail. The role of internal suburbanization in the growth of built-up areas was examined, and the current and anticipated future focal points of suburban expansion were identified.
The data on built-up areas were compared with similar data from two Hungarian county capitals (Debrecen, Szeged) in order to see whether there are general trends or whether there are specific changes in the case of Nyíregyháza.
We hypothesized that the proportion of built-up areas increased in all three cities—Nyíregyháza, Debrecen, and Szeged—during the 1990–2018 period. This assumption was based on findings from the international literature [20,21]. Our second hypothesis was that there is no significant relationship between the growth of built-up areas and changes in population size. In addition, we were also interested in how the potential expansion of settlement structures affects the naturalness of urban landscapes and their hemeroby values, and whether a decline in landscape naturalness can be detected based on land cover data.
The hemeroby level of the municipality and its changes between 1990 and 2018 were analyzed based on data from the Copernicus Land Monitoring Service [28].
Finally, the ecological status of the municipality was assessed using the available data. The elements of the ecological network were identified and used to draw up a landscape ecological map of the municipality. This study also addressed the issues and vulnerabilities within the ecological network.
2. Materials and Methods
2.1. Location of the Study Area
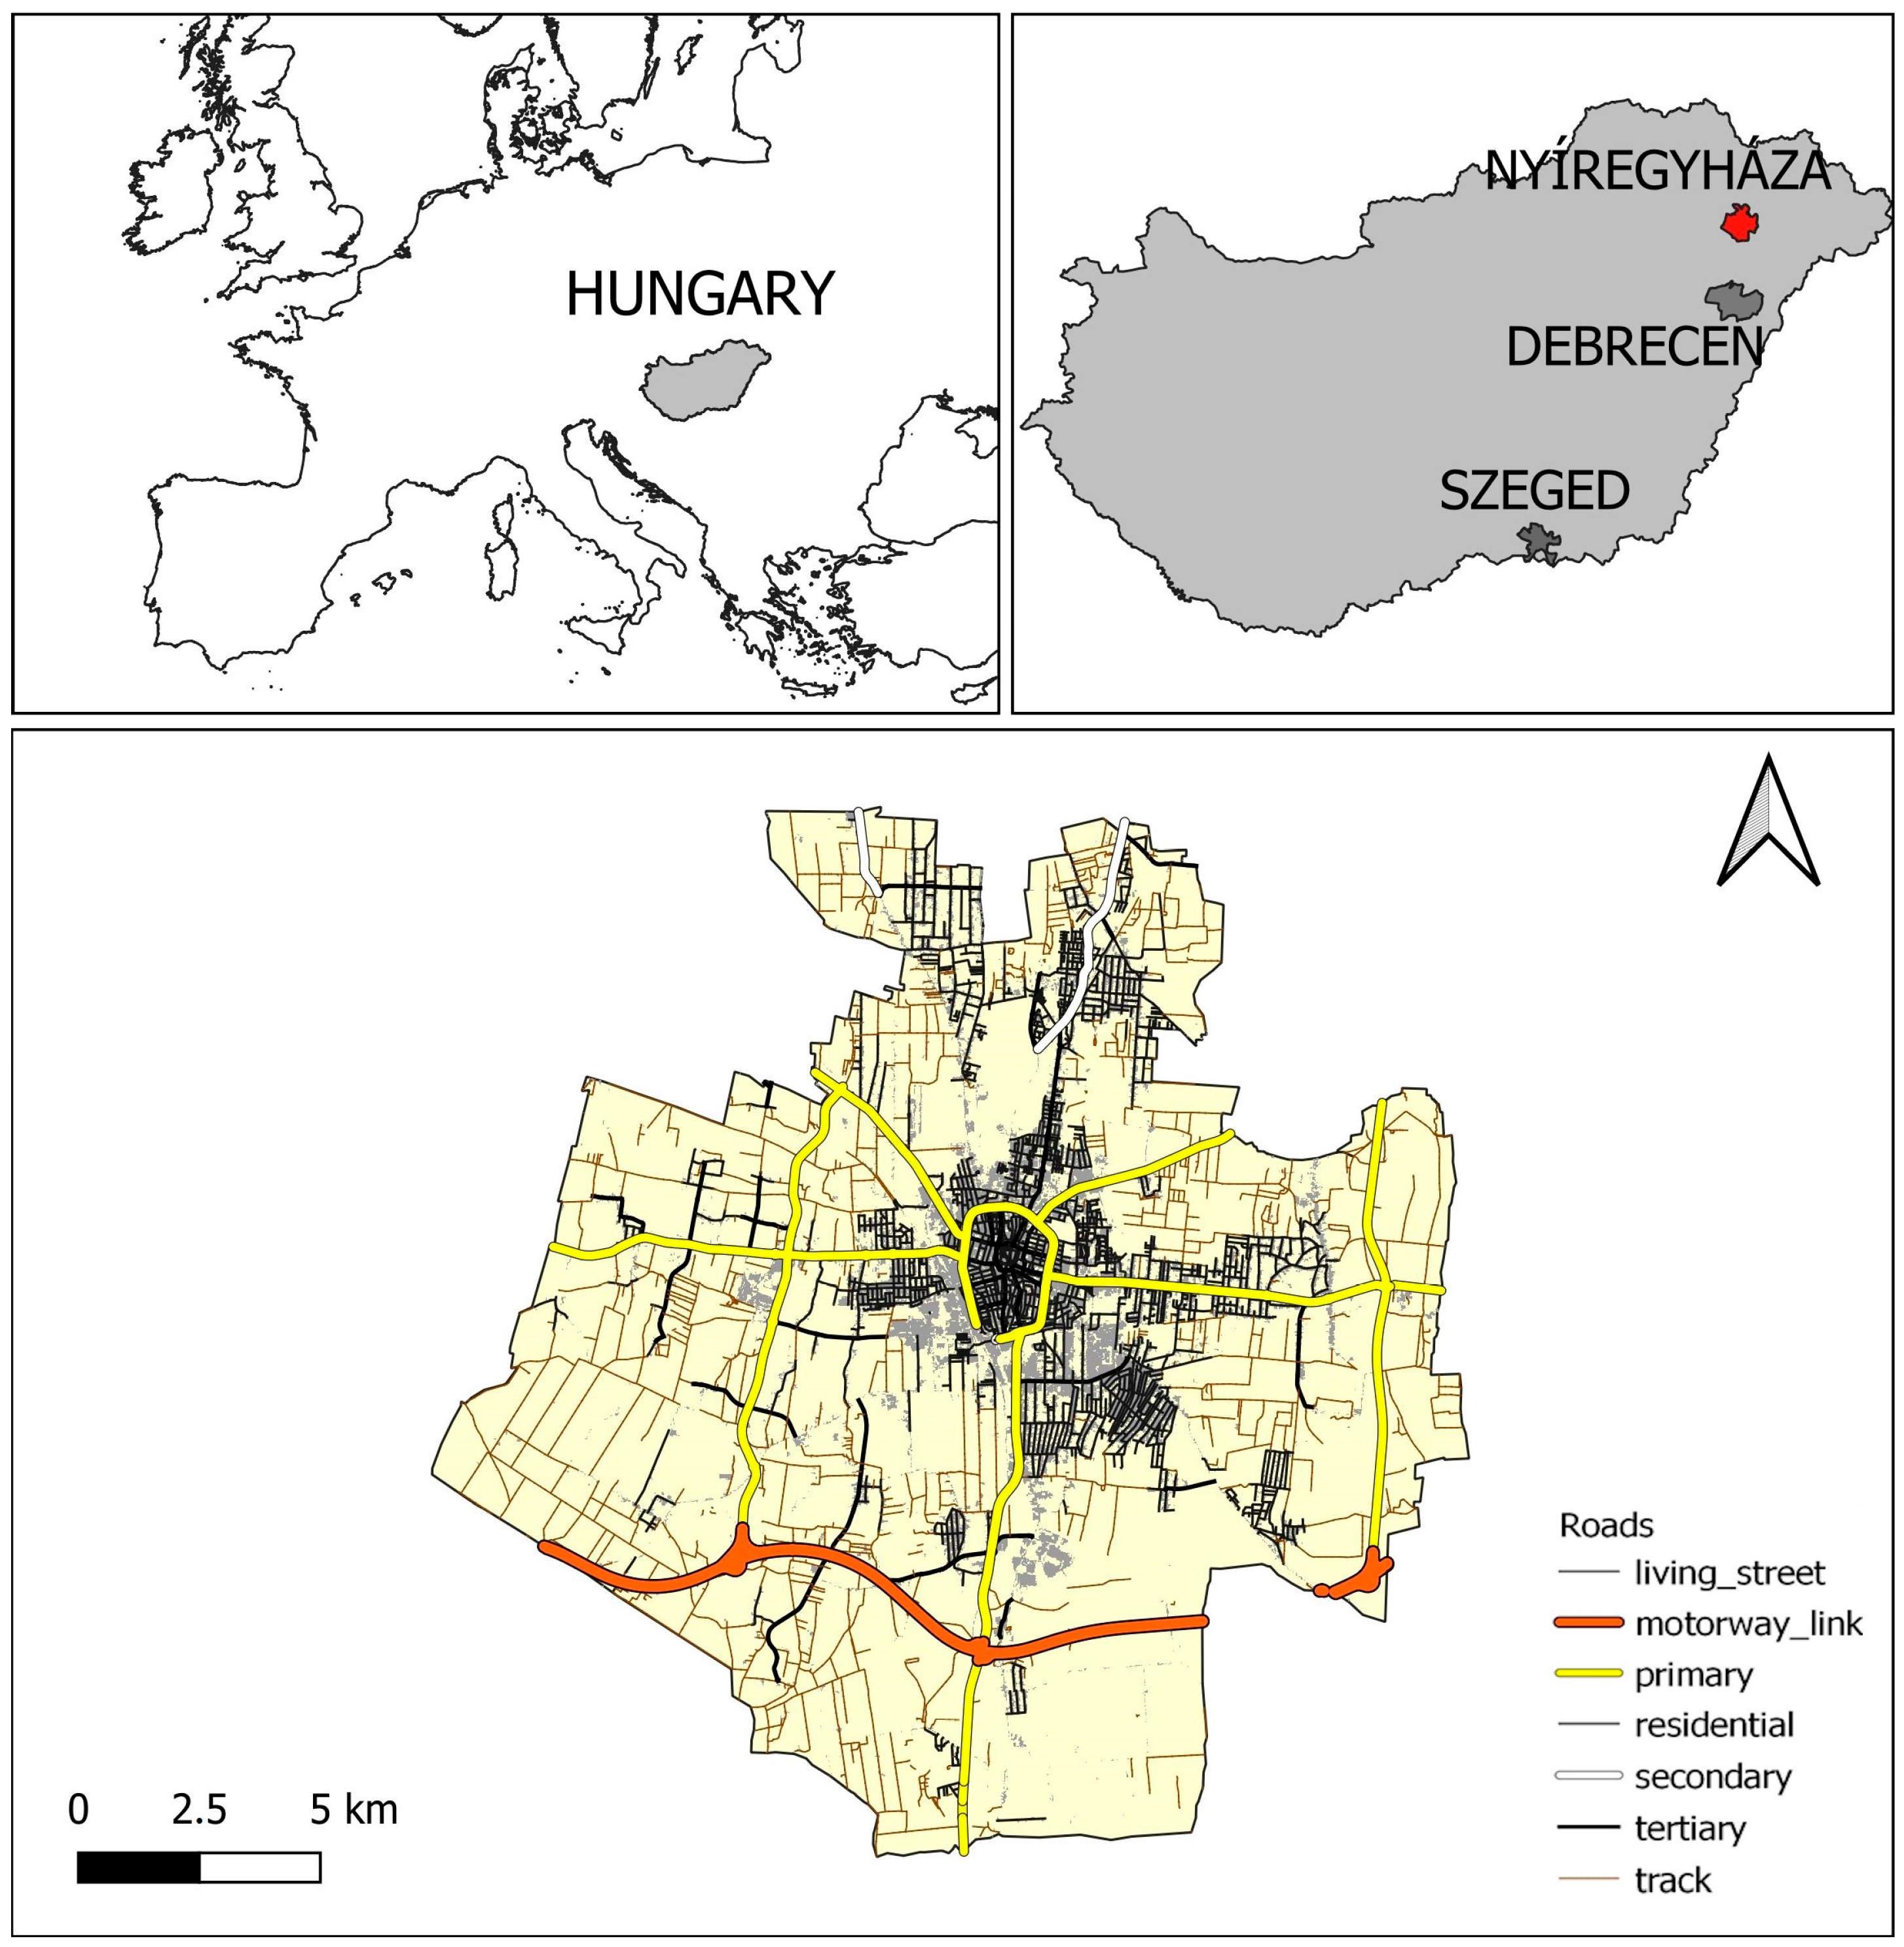
The present research was conducted in Nyíregyháza, a medium-sized city in Hungary, covering an administrative area of about 275 km2 (Figure 1). Nyíregyháza is a county town with a population of more than 115,000, located in the northeastern part of the Central-Nyírség lowland in the central part of the Great Hungarian Plain. The settlement has a more varied geomorphology than in the lowlands: it is situated in a low hilly landscape with sand hummocks and hollows between the hummocks, bordered from the west by the Nyugati-Nyírség hills. As a result, the area has a wide variety of soil, hydro-geological, and landscape characteristics, which, even under natural conditions, result in a high degree of landscape diversity and a mosaic landscape structure. Increased human disturbance in the city and its surroundings has further increased the mosaic character of the landscape.
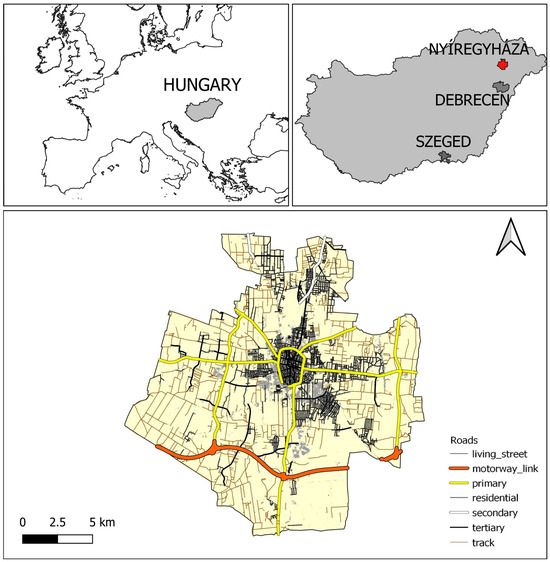
Figure 1.
Geographic location of the study area and the comparative reference cities within the Hungarian Great Plain and the administrative border of Nyíregyháza.
Changes in built-up areas were compared with corresponding datasets from two other Hungarian county capitals—Debrecen and Szeged—in order to determine whether the observed trends are unique to the study area or reflect a broader regional pattern (Figure 1). The selection of these control cities was based on their comparable population sizes and their geographical location within the Hungarian Great Plain.
2.2. Methodology
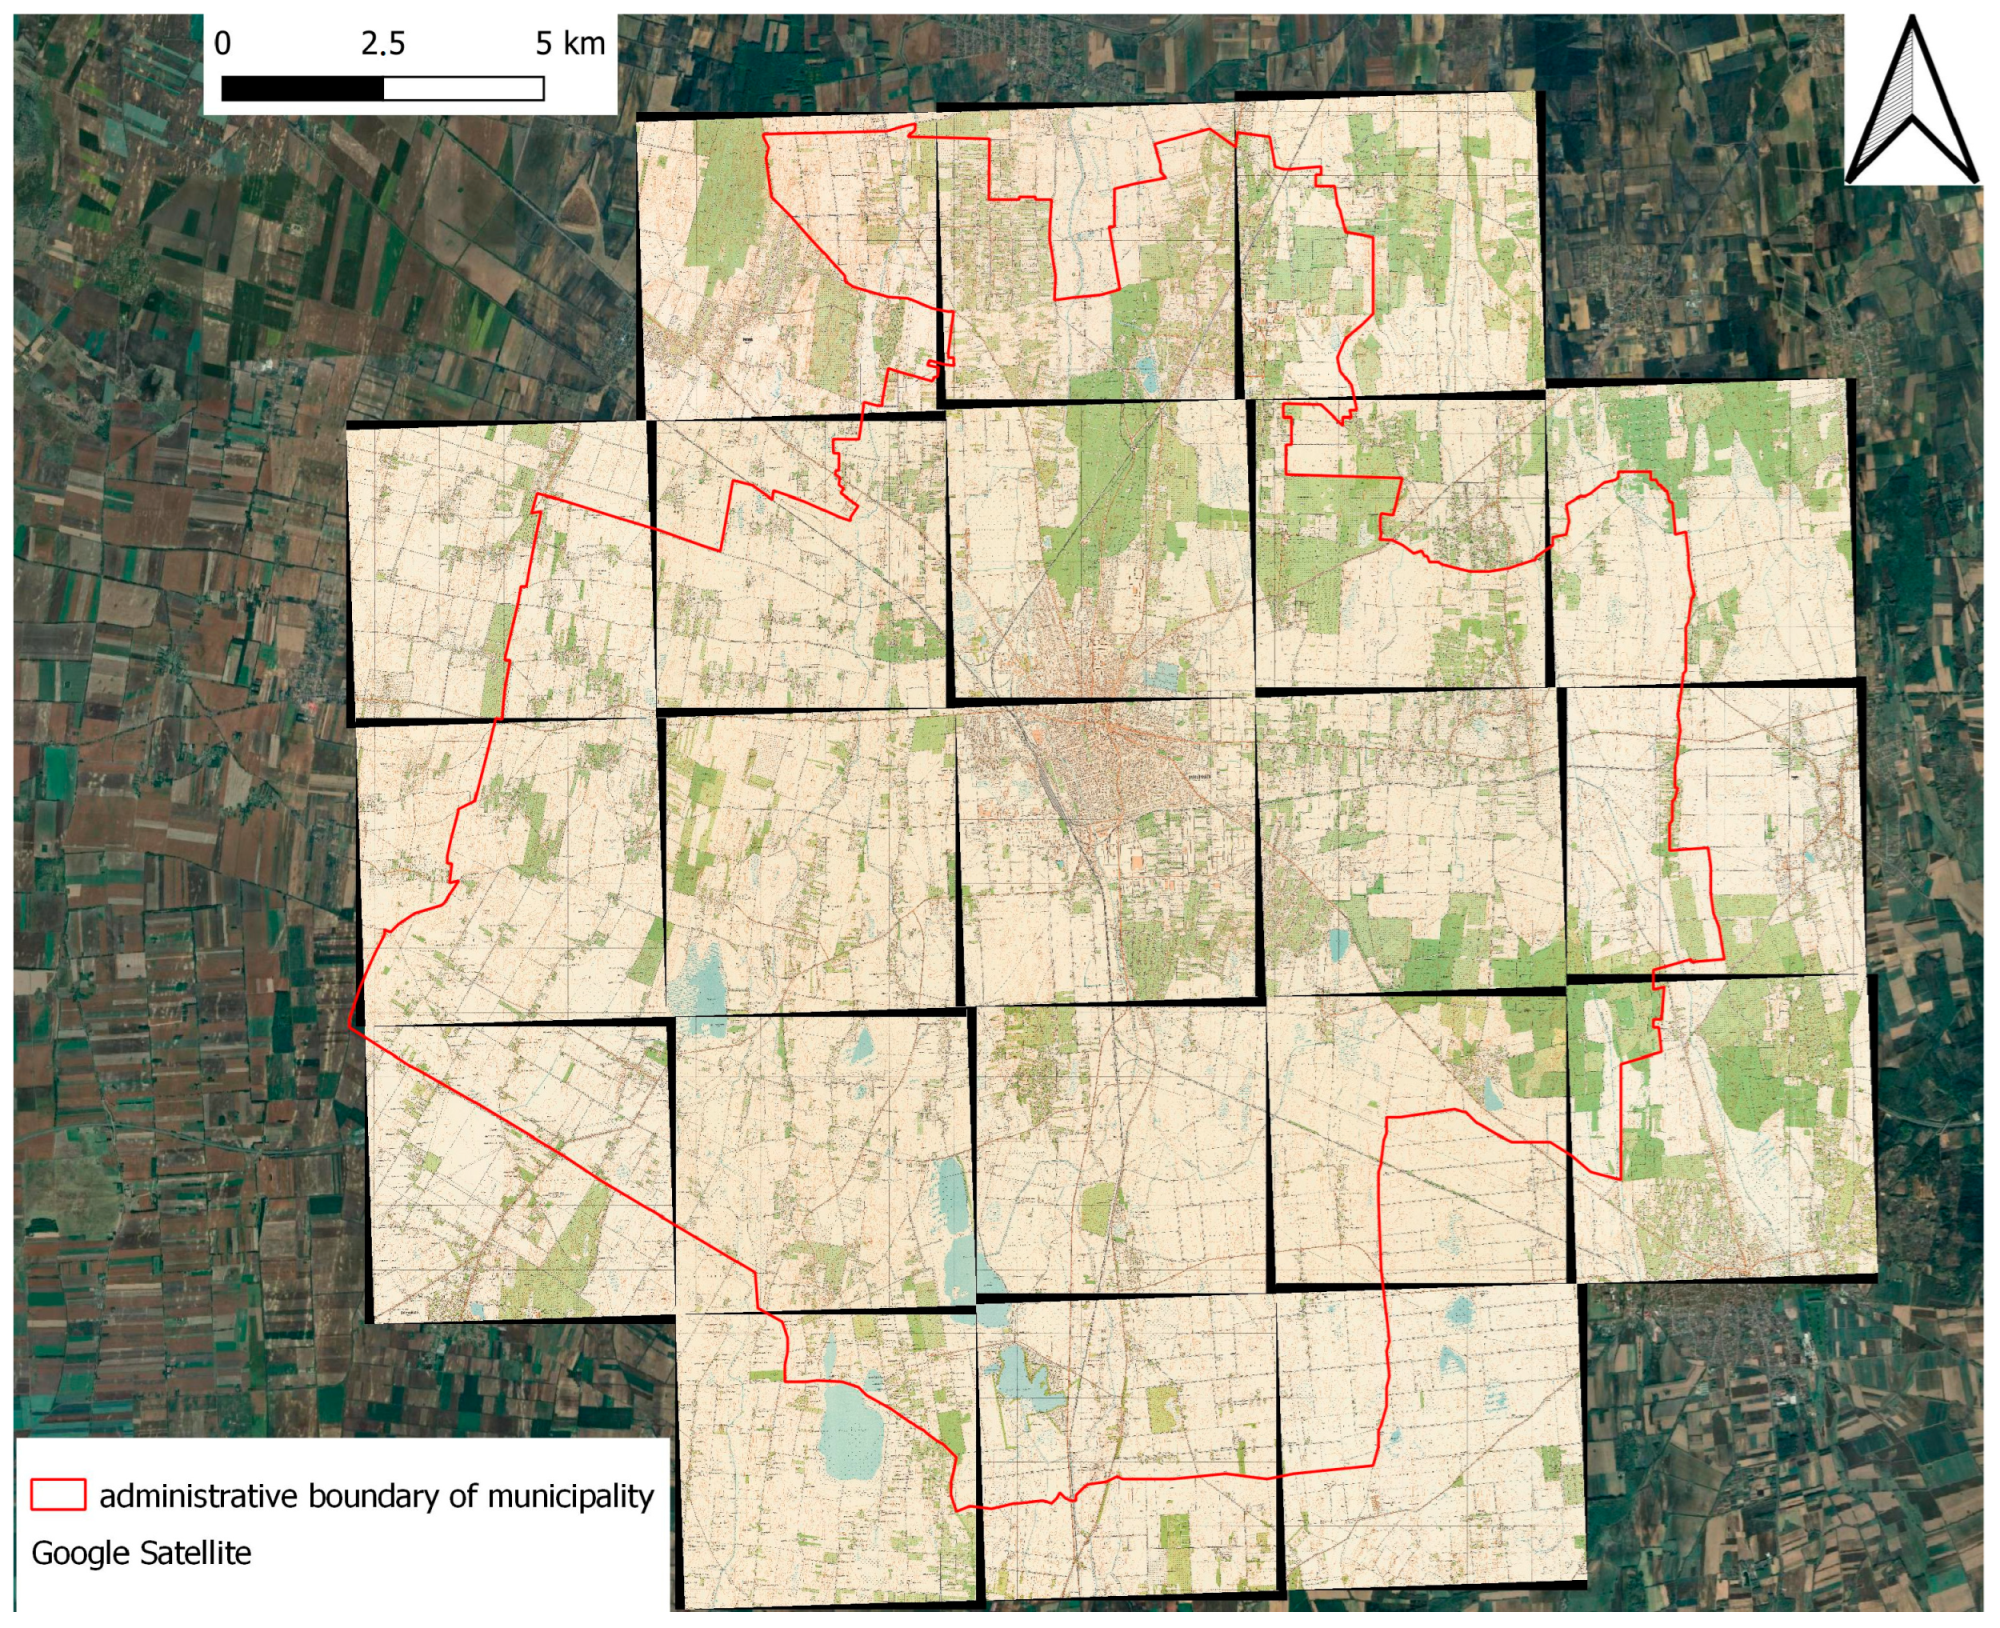
The research was primarily based on map databases of military surveys, EOTR (Unified National Ordnance Survey) map sections from the 1970s, and CORINE Land Cover data [28,29,30,31,32] (Figure 2). In the case of the military surveys, the objective was to identify the land cover categories that could be read from the maps and to georeference and polygonally vectorize these data into geographic information software (QGIS). The land cover categories identified from these databases were aligned, as far as possible, with the CORINE land cover classification system, in order to create so-called pre-CORINE land cover maps of the municipality. This allowed for the comparison of historical land cover conditions with those of the recent past (1990–2018). A similar approach was taken for the 1:10,000 m EOTR sections representing the “pre-Corine” conditions of 1972-75. A total of 21 map sections provided near-complete coverage of the town (Figure 2). The map sections were georeferenced to a satellite image of the area using the EOV (Unified National Projection) coordinate system. The maps show the main land use categories in detail, allowing for the production of a detailed land cover map.

Figure 2.
The 1972-75 1:10,000 sections of Nyíregyháza in QGIS, after georeferencing. Source: own editing.
CORINE Land Cover data were available at five-year intervals between 1990 and 2018. In this study, vector data from 1990, 2000, 2012, and 2018, provided in GPKG format, were utilized. We considered the limitations of using CLC data within the urban environment, given its relatively coarse spatial resolution of 100 m. Although the CLCplus Backbone dataset—offering significantly higher spatial accuracy with a 10-m resolution—is available, it only covers the years 2018 and 2021. Consequently, it could not be used for comparative analysis across the full time span of interest, as data for earlier years (1990, 2000, and 2012) were not available. A similar problem was encountered with the Urban Atlas database, which, although also with a better resolution, only provides data for the 12-year period 2006–2018. Another important aspect of the research was the assessment of the settlement’s landscape naturalness through the analysis of hemeroby levels. For this purpose, the classical seven-level hemeroby scale introduced by Jalas we applied [33]. According to the system, the ahemerobic category refers to undisturbed, natural landscapes (not applicable in the study area), while the oligohemerobic category represents near-natural areas (not applicable in the study area). The mesohemerobic level denotes semi-natural landscape units, where natural and anthropogenic landscape-shaping processes are in balance [5]. The α- and β-euhemerobic categories already reflect increasingly disturbed environments. Finally, the poly- and metahemerobic levels refer to heavily and completely transformed areas, respectively.
3. Results
3.1. Historical Overview of Changes in Land Cover Categories
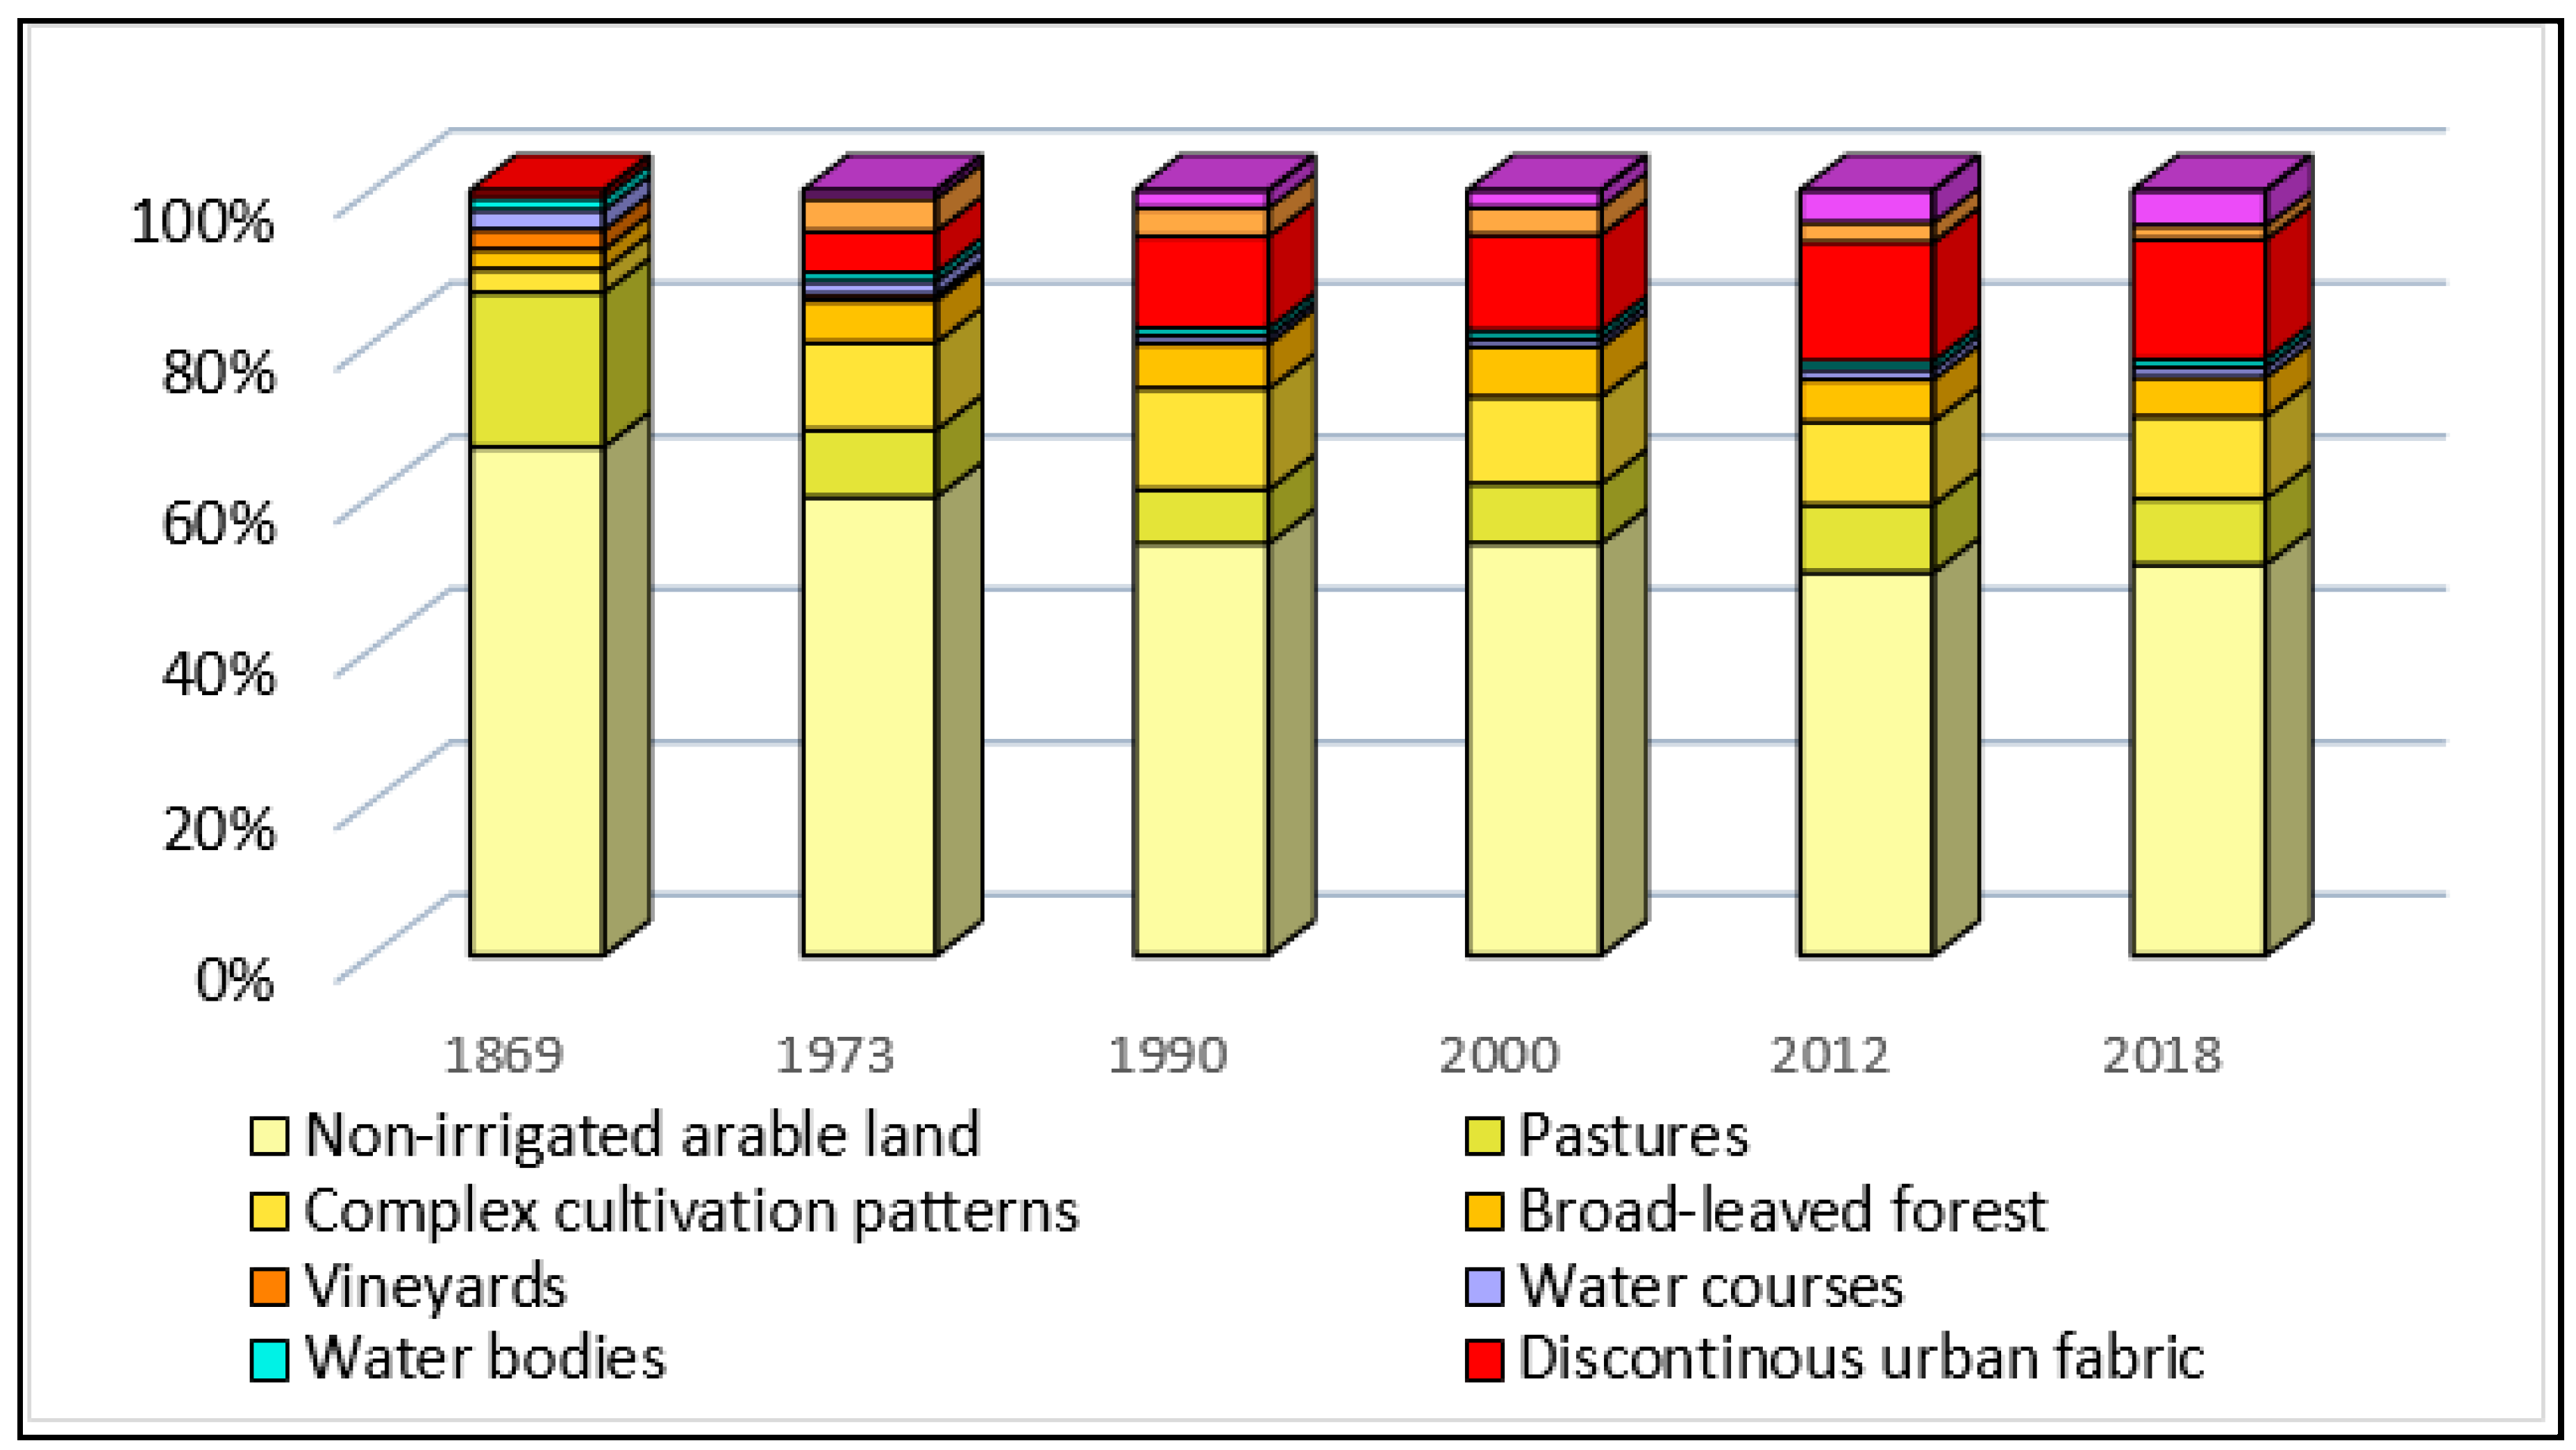
In the second half of the 19th century, land use practices were markedly different from those observed today, as evidenced by the map sections of the Second Military Survey covering the area. The most striking feature is the very high proportion of unirrigated arable land, covering 66% of the area (Figure 3). Therefore, they represented the dominant land use category and formed the landscape ecological matrix of the region. Although the extent of arable land shows a decreasing trend until 2012 (almost 30% decrease since the period of the II Military Survey), it still appears recently as the land cover category with the largest area (47%) (Figure 3).
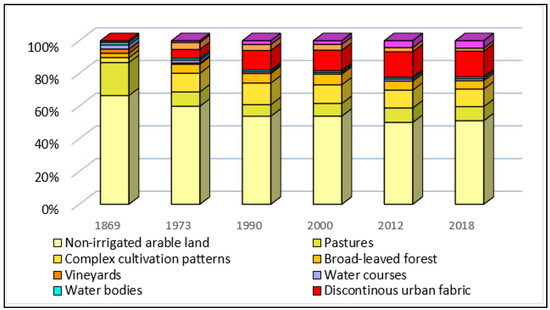
Figure 3.
Changes in the spatial distribution of land cover categories over the study periods, in km2. Source: own editing.
The markedly greater share of grasslands during the period—amounting to 20%—is also notable. According to the Second Military Survey, their total area reached around 5500 hectares. They formed an uninterrupted, extensive patch of landscape in the south-western and western outskirts of the town and on the eastern border of Oros, which was still an independent municipality at that time. With the gradual decline of traditional land use practices and grazing-based livestock farming, the once continuous grassland areas became fragmented and were increasingly replaced by arable land or built-up areas. Today, fewer than 2200 hectares of grassland remain, mostly as scattered and fragmented remnants, separated from one another to varying degrees.
The proportion of areas covered by woody vegetation was low at that time, occurring on only 3% of the area (Figure 3). Even that time, the largest patch of woodland was the Sóstó forest, predominantly composed of pedunculate oak (Quercus robur), located in the northern part of the town. Smaller patches of mainly softwood and acacia forest were found between Nagyszállás and Oros. By the 1970s, the forest area had more than doubled (from 716 ha to 1500 ha), but it is important to note that a significant proportion of the newly planted forests were acacia (Robinia pseudoacacia) or noble poplar plantations, which were not able to fulfill the ecological functions of forests.
Vineyards represented a notable land use category as well, covering more than 700 hectares during this period (Figure 3 and Figure 4). The largest areas of vineyards were located in the northern part of the current urban area (Nyírszőlős, Új-szőlő, Ó-szőlő) and in the southern sandy areas (Kistelekiszőlő, Borbánya). As the city expanded, their area rapidly decreased. In 1973, vineyards covered only 210 ha, and today they have almost disappeared (they are not identified as a separate category in any of the CORINE database base years in the urban area), surviving only in small private gardens and mixed cultivation areas. Nevertheless, their historical presence is still reflected in the names of several neighborhoods of Nyíregyháza.
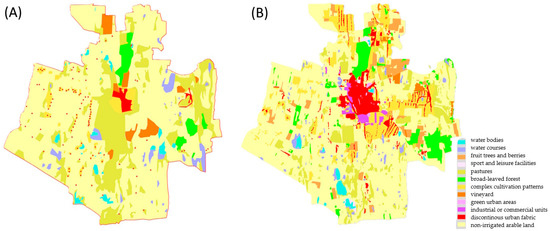
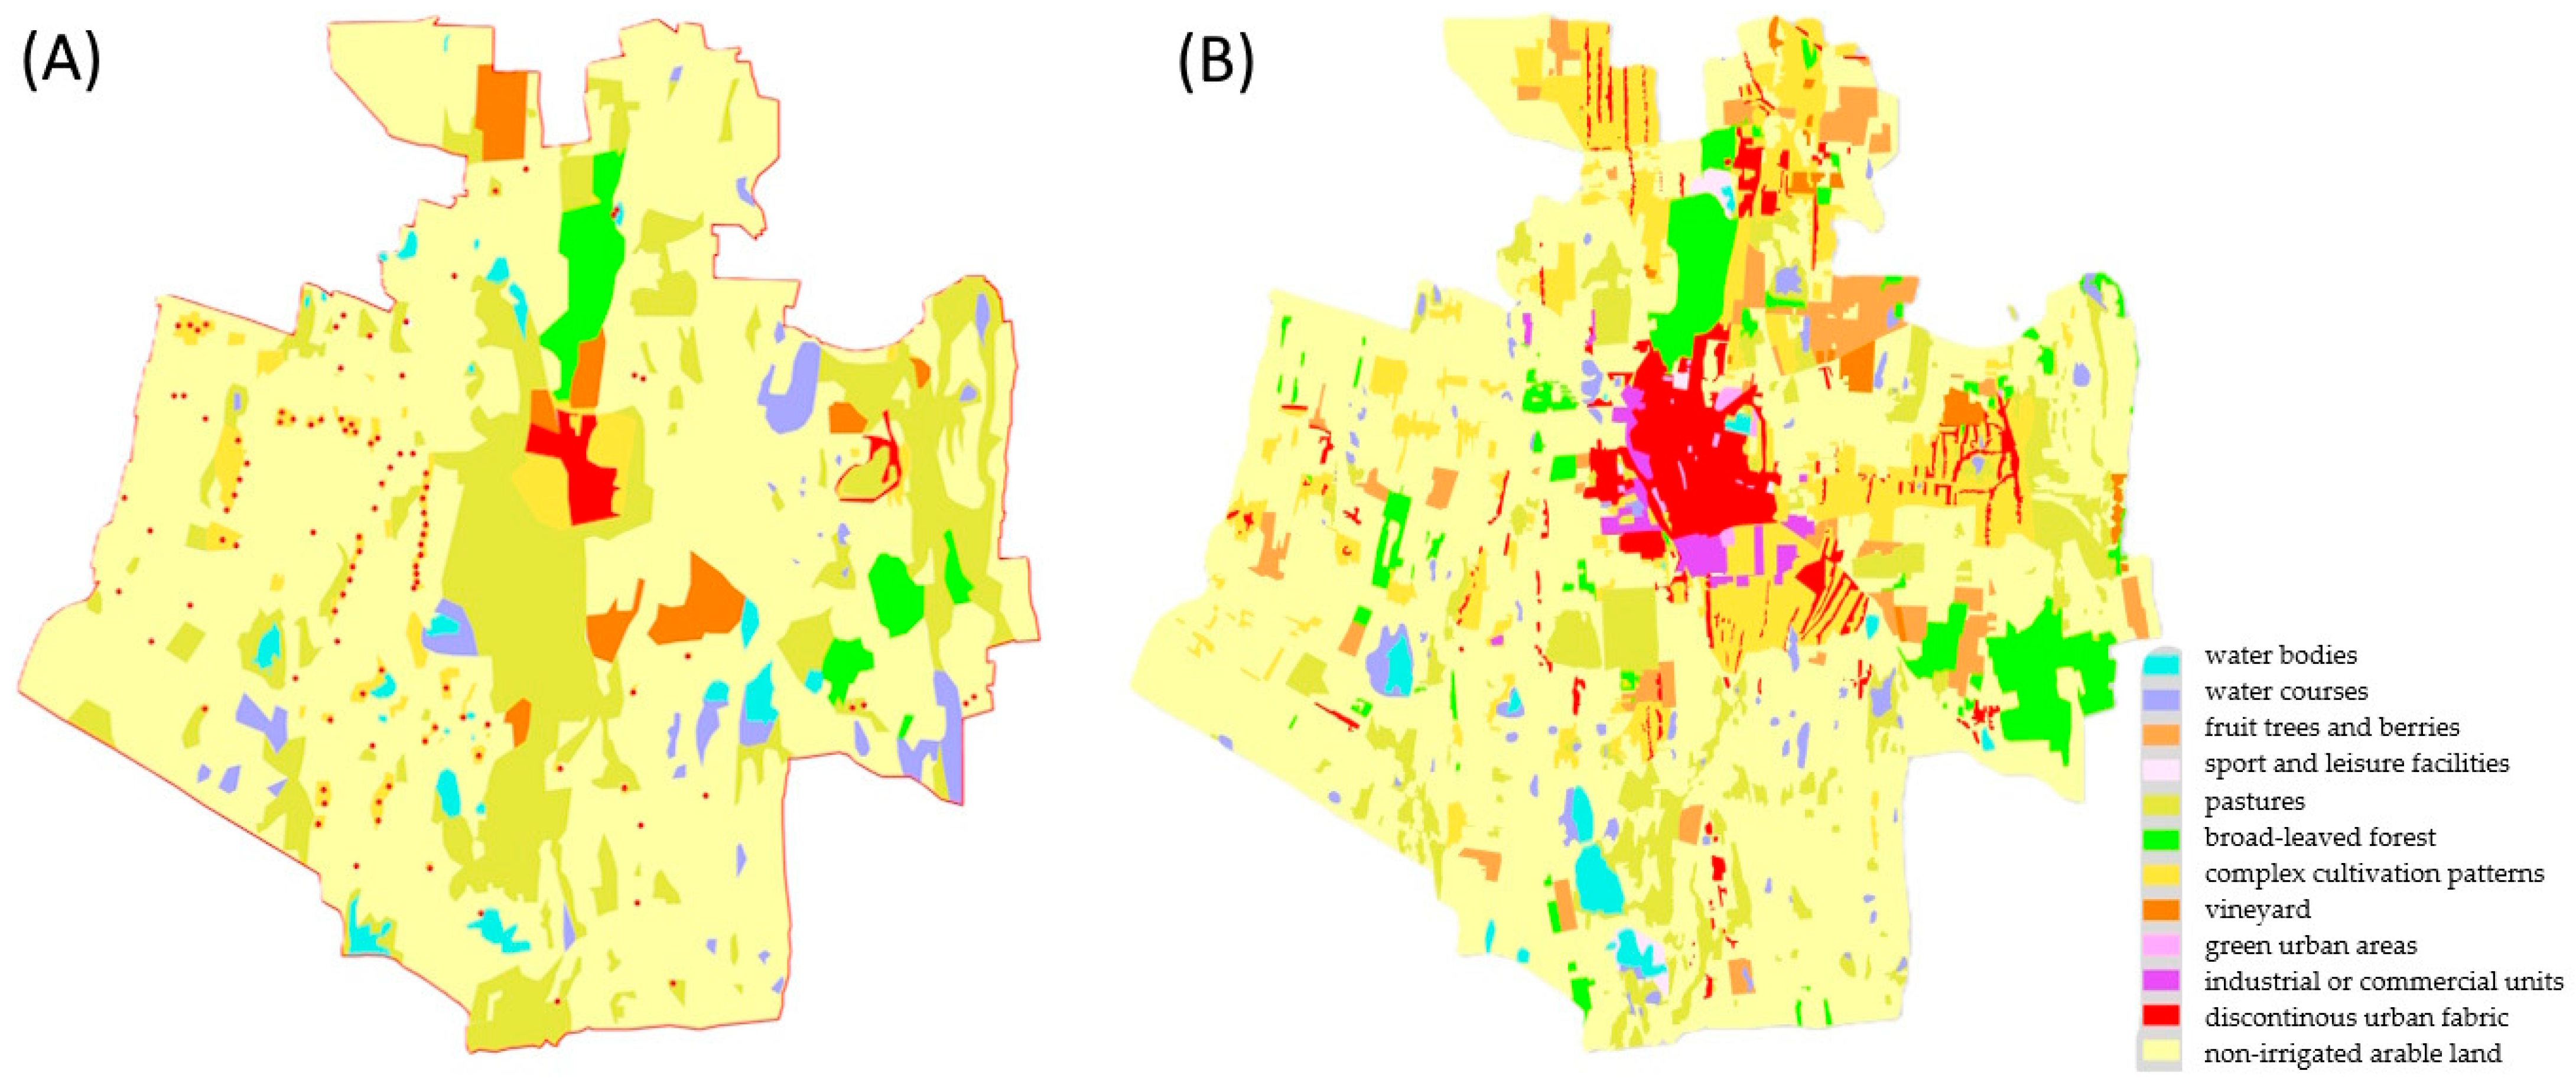
Figure 4.
“Pre-CORINE” surface cover map of the study area (Nyíregyháza) from the period of the Second Military Survey (A) and based on EOTR section data from 1972-75 (B). Source: own editing.
Significant differences were observed in both the spatial proportion and extent of the orchards category across the reference years. During the period of the Second Military Survey, no contiguous orchard areas could be clearly identified. The reason for this is that during this period, fruit growing was limited to small plots in private gardens, mixed with vegetable crops and fodder crops, and primarily served the needs of the local population. For this reason, orchards from this period would most appropriately have been classified under the ’complex cultivation patterns’ category. The establishment of large-scale, export-oriented cooperative apple orchards—characteristic of the Nyírség region for decades—began primarily after World War II, in parallel with the development of COMECON (Council for Mutual Economic Assistance) markets. Comparable trends can be identified in the case of smaller walnut, sour cherry, and peach plantations, which likewise existed within the study area.
This is also reflected in the data from the 1973 EOTR sections: during this period, almost 1200 hectares were under fruit production, covering 4% of the total administrative area. Following the post-socialist transition in Hungary in 1990, the area of orchards began to decline rapidly as a result of the collapse of traditional export markets, increasing production costs, and decreasing selling prices. Based on the 2000 CORINE dataset, the extent of orchards had decreased to less than 1000 hectares, and by 2018, only around 460 hectares remained, indicating a decline of approximately 60% compared with the 1970s. Orchards have most often been replaced by non-irrigated croplands or newly built residential areas (Figure 5).
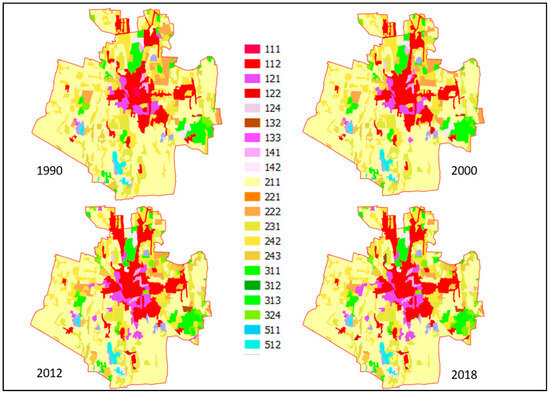
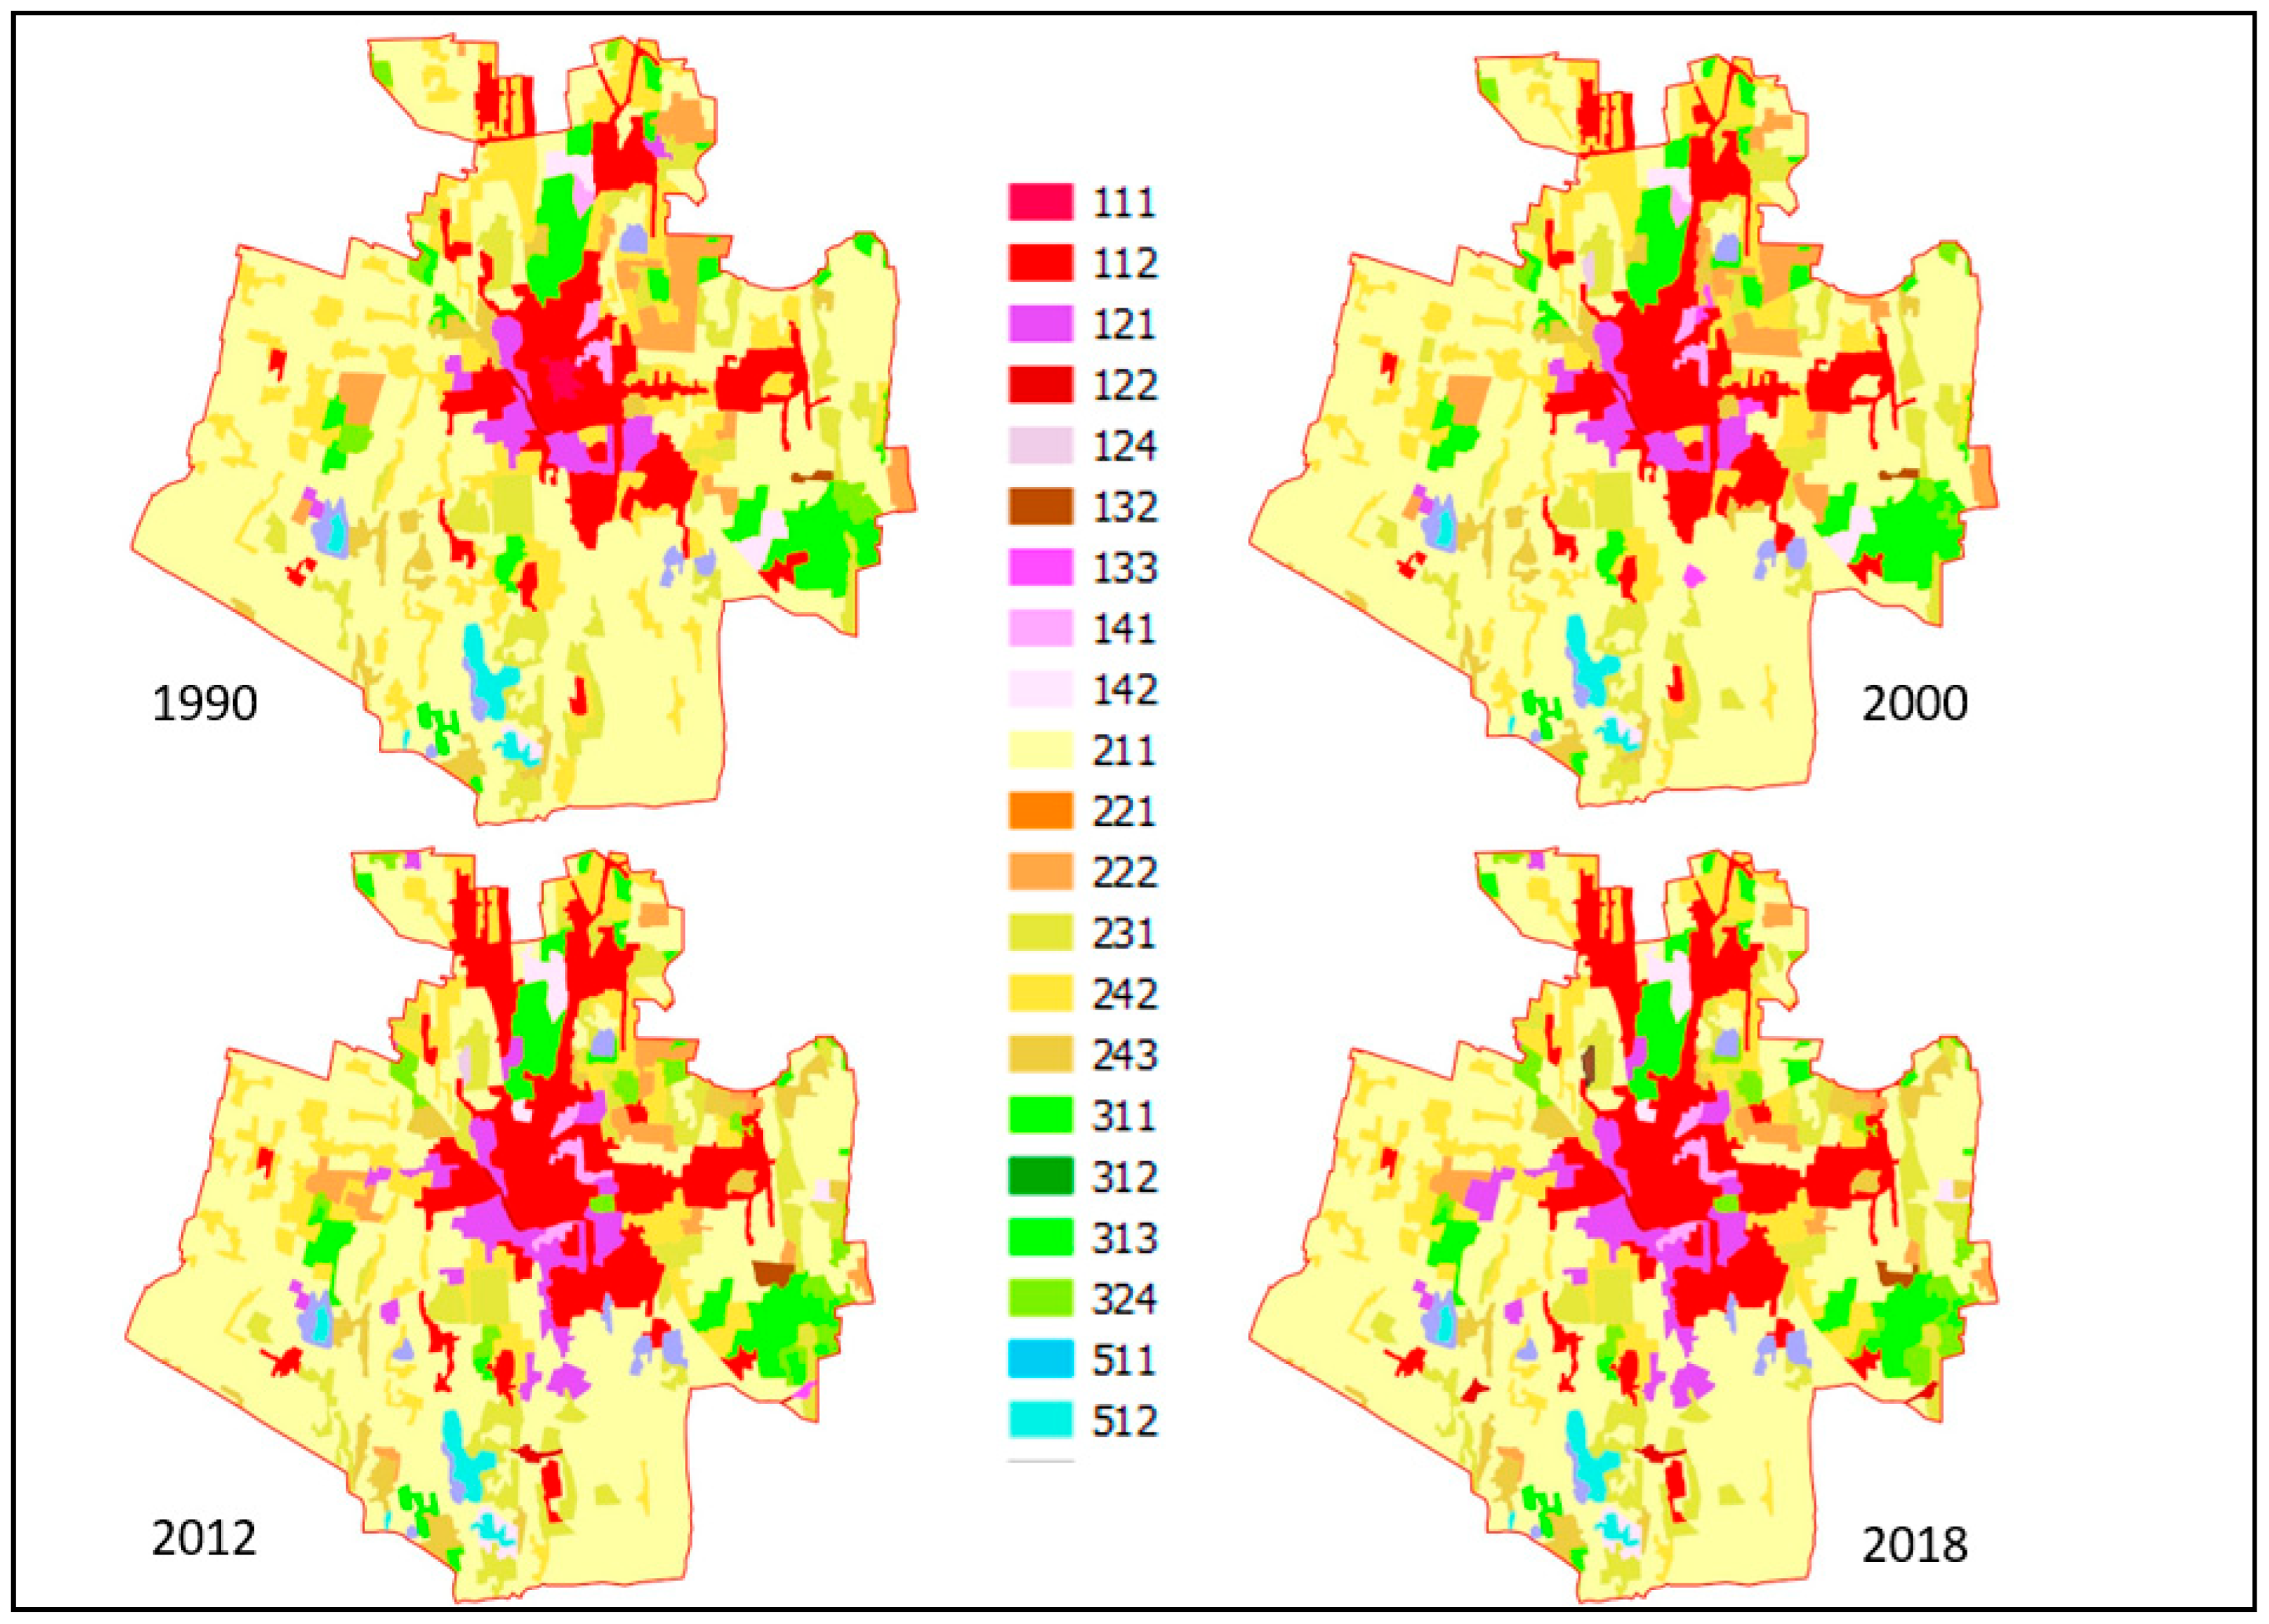
Figure 5.
Evolution of CORINE land cover categories in the years under study, between 1990 and 2018. Source: own editing.
Wetland or standing water represents one of the most valuable categories of land cover from both conservation and ecological perspectives. At the time of the Second Military Survey, the total area of wetlands exceeded 1000 hectares. The most significant wetland habitats have developed around saline lakes formed in deflation hollows (e.g., Nagy-Vadas Lake, Hosszúháti Lake, Szelkó Lake), as well as in fen areas scattered with grey willow (Salix cinerea) in interdune depressions (e.g., Igrice Marsh and certain parts of the Orosi Grasslands). At present, as a result of drainage activities and climate change-related desiccation and groundwater level decline, the extent of wetland areas has markedly decreased. The long-term persistence of the remaining wetlands is increasingly uncertain, mainly as a consequence of recurrent summer droughts and continued groundwater level decline.
3.2. Critical Comparison of the CLC and CLCplus Backbone Databases in Terms of Accuracy and Applicability to the Sample Area
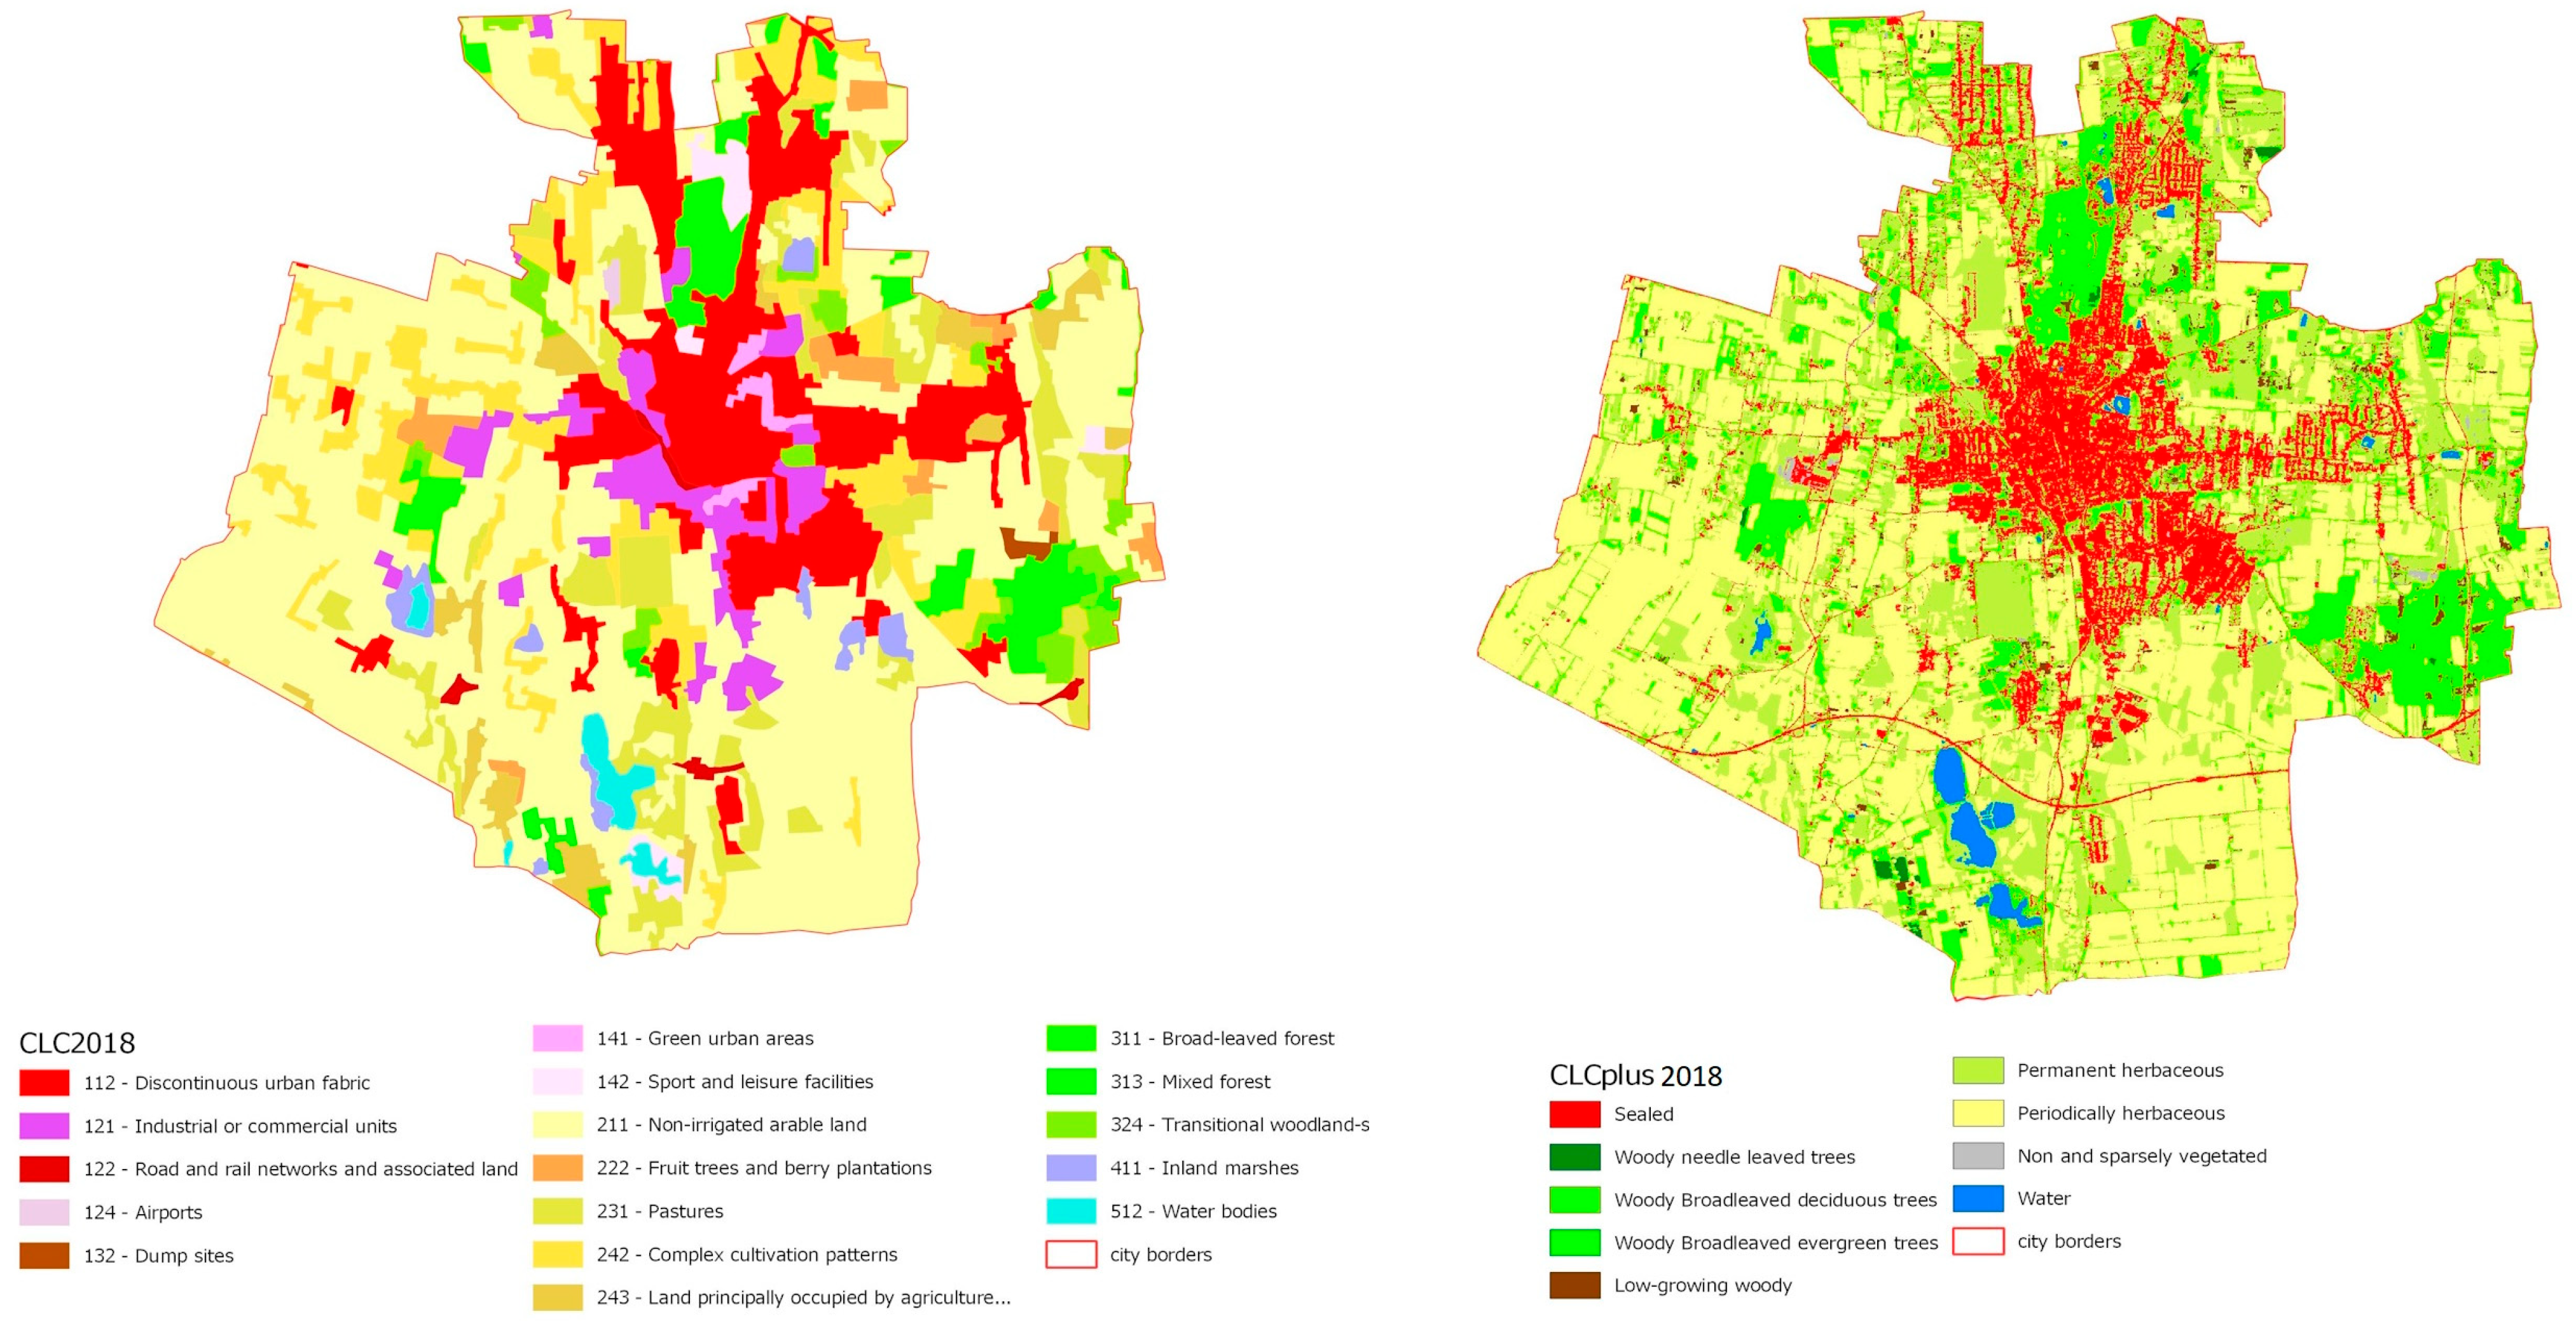
As already mentioned in Section 2.2, CORINE Land Cover (CLC) is of limited use for small spatial scales, such as cities and urban areas, due to its low resolution of 100 m. The authors considered the use of the CLCplus Backbone, which offers a higher resolution of 10 m, and the Urban Atlas databases, but neither CLCplus nor Urban Atlas provides data for the period before 2000. CLCplus is only available for the years 2018 and 2021, while Urban Atlas provides datasets from 2006 to 2018. Since our aim was to examine a longer time span, we opted to use the traditional CLC dataset, which, although lower in spatial accuracy, is available from 1990. A further problem with the CLCplus raster database was that, although it is more accurate in terms of resolution, it nevertheless displays far fewer categories than the CLC (Figure 6). The merging of categories and the different and much smaller number of element keys make it considerably more difficult to compare the data from the two databases. As an example, the traditional CLC shows several types of built-up areas (discontinuous and continuous urban fabric, industrial and commercial units, road and rail networks) as separate categories, while the CLCplus Backbone shows all of them in the “sealed” group. It does not separate non-irrigated ploughland and orchards, which are grouped under the category “periodically herbaceous”. The category ‘permanent herbaceous’ is also inaccurate, as it includes other CLC categories (e.g., inland marshes, complex cultivation patterns, etc.) in addition to grassland.
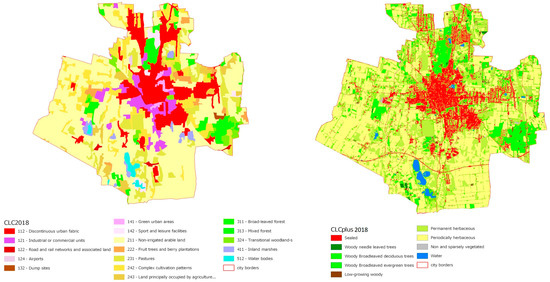
Figure 6.
Comparison of the accuracy of maps generated from CLC and CLCplus Backbone data based on the dataset for the year 2018. Source: own editing.
The comparison of the CLC and CLCplus databases could only be made for the reference year 2018, as CLCplus was not available for the previous CLC base years. It can be concluded that there are differences in the data on the spatial distribution of the over-coverage categories due to the different resolution (Figure 6). However, the CLCplus data do not differ so markedly from the CLC data that the latter are considered as inconclusive for our analysis. As an example, the proportion of built-up areas was 19.1% for CLC 2018 compared with 12.4% for CLCplus Backbone. However, this difference could not only be due to differences in resolution between the databases, but also to the different categories: the CLCplus “sealed” category did not necessarily cover all the CLC categories that we included in the built-up areas.
Due to the low resolution of 100 m, CLC was not suitable for detecting narrow, line-less infrastructure elements (roads, railways, forest tracks), or isolated built-up patches of scattered settlements (bocot villages) concentrated in the western outskirts of the municipality, or for detecting changes in small areas. These will require the use of CLCplus and complementary databases. However, CLC has proved to be a useful tool for longer time scale studies over larger areas to detect landscape development trends.
3.3. Analysis of the Spatial Extent of Built-Up Areas
3.3.1. Historical Overview
Among the land cover categories, built-up areas—particularly discontinuous urban fabric and ‘industrial or commercial units’—exhibited the most significant change in spatial extent. The changes in built-up area extent were illustrated in Figure 7. Until the period of the Second Military Survey, only approximately 1% of the current urban area had been built up. At that time, industrial areas were not yet present, and built-up land consisted almost entirely of residential areas and related infrastructure. These historical areas form the current urban core (Kossuth Square and its surroundings). During this period, part of the railway network already existed, while the residential areas in the southwest (Érkert) and northeast (Bujtos) were still characterized by low-lying, water-permeable areas. By 1900, additional areas had been built up, including Huszártelep, and by 1941, parts of Érkert and Bujtos —now considered the outskirts of the city center—were also developed. By this time, the built-up area had reached nearly 750 hectares.
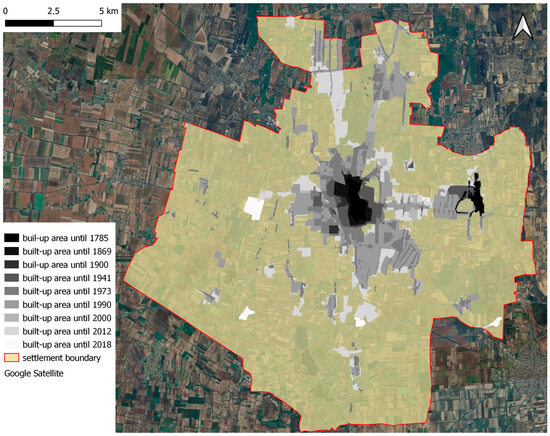
Figure 7.
Temporal expansion of built-up areas between 1785 and 2018. Source: own editing based on various map databases.
Between 1941 and 1973, the expansion of built-up areas accelerated significantly, with their extent increasing two- to threefold. The area of industrial zones reached 288 hectares, while the extent of discontinuous urban fabric (i.e., the settlement structure itself) expanded to 1463 hectares. The period between 1973 and 1990 was marked by another substantial increase—over a twofold growth—in built-up areas, primarily due to the development of extensive panel-constructed residential districts, including Örökösföld and parts of Jósaváros. In 1990, urban spaces, defined by CORINE as non-coherent urban structures, accounted for more than 12% of the city’s approximately 275 km2 administrative area, while industrial and commercial facilities covered an additional 2%. By 2018, the share of discontinuous urban fabric had increased to 14%, while industrial and commercial areas accounted for 4% of the city’s total area. This indicates that the urban settlement structure expanded by nearly 30%—from 3120 hectares to almost 4000 hectares—while the area occupied by industrial and commercial facilities nearly doubled over the course of 28 years, increasing from 600 to 1170 hectares. Overall, the proportion of artificial surfaces had reached nearly 20% by 2018, compared with only 13.55% in 1990. Overall, the amount of built-up areas increased by approximately 38% between the first (1990) and the last (2018) survey years of the CORINE database. As a result, more than 1700 hectares of arable land have been lost due to soil sealing and permanent abandonment of cultivation. When compared with the period of the First Military Survey, a more than twentyfold increase can be observed by 2018. The expansion of built-up areas is almost certain to continue in the near future, in line with international trends [19,34,35].
3.3.2. The Role of Suburbanization in the Recent Increase in the Proportion of Built-Up Areas and the Change in the Spatial Concentration of the Urban Population
The population of Nyíregyháza has declined several times in the 1990s and almost uninterruptedly since 2016. Despite this, the urban settlement tissue has been growing steadily. The apparent contradiction is partly explained by the change in the settlement structure, i.e., the conscious settlement development. By the 1980s and 1990s, the construction of large-scale housing estates, which had previously provided cheap housing, had come to an end, and single-family housing estates came to the fore. This was partly due to changing population needs and partly to the conscious development of new rural or zártkert districts (Oros, Borbánya, Nyírszőlős), which had previously been annexed to the town. The development of suburban neighborhoods, often located further away from the urban core, and their connection to the urban core, was high on the list of urban development priorities.
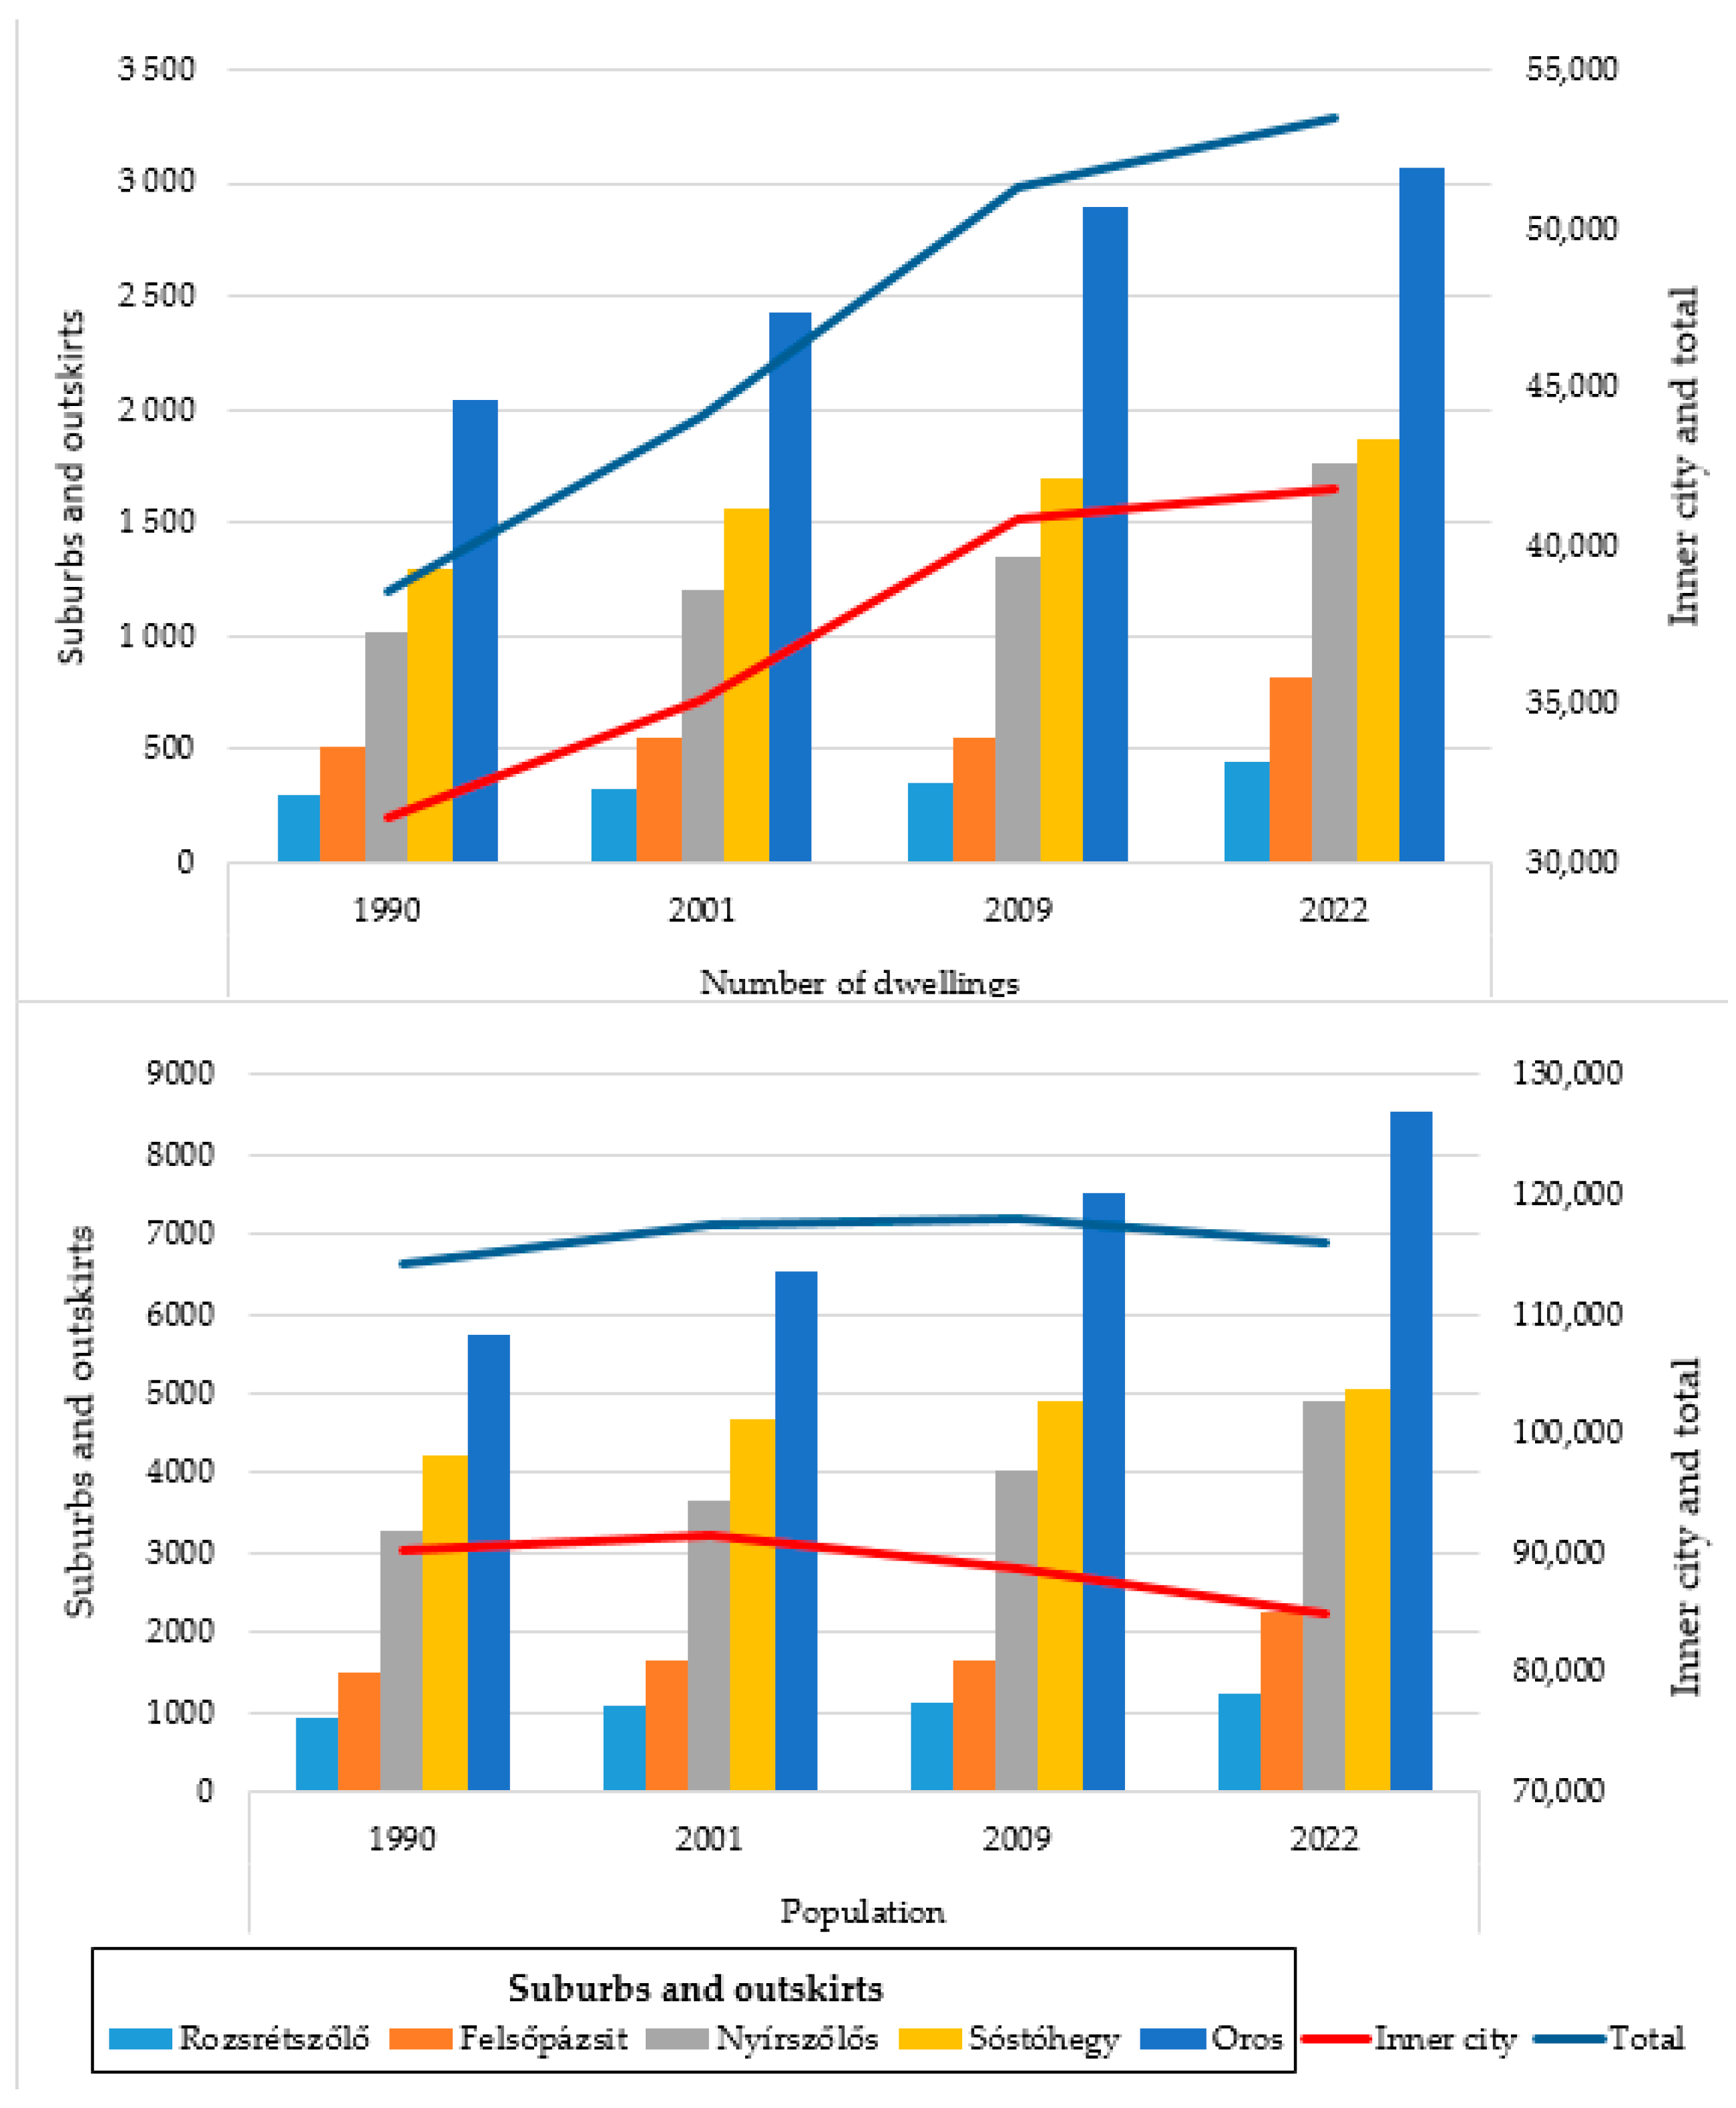
However, the increase in urban area that has accompanied the decline in population is mainly explained by the increasing internal suburbanization, i.e., the spatial reallocation of the urban population within the settlement boundaries, which has been increasing since the 1990s–2000s. Based on data from the Central Statistical Office and the censuses, it is clear that the suburbs with largely loose, detached housing (e.g., Oros, Nyírszőlős, Sóstóhegy) have experienced (sometimes significant) growth in both housing stock and population in all the periods under study (Figure 8) [14]. This, along with the expansion of industrial areas, is the main reason for the increase in built-up areas. The city center of Nyíregyháza, on the other hand, has been losing population since the 2000s, despite the fact that its housing stock has increased in all the periods under study (Figure 8). This type of internal population reallocation is essentially independent of the positive or negative change in the population of the municipality [11,36]. Many large cities across Europe are also experiencing urban expansion in parallel with past (e.g., Liverpool and Leipzig) or even current (e.g., Budapest and Bucharest) population decline [37].
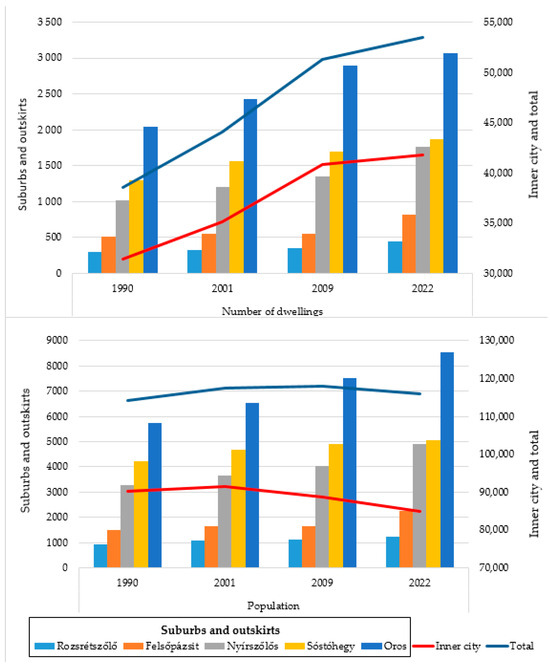
Figure 8.
Change in population and number of dwellings in the suburbs, inner city, and total of Nyíregyháza. Data source: Hungarian Statistical Office.
Thus, despite the fact that the housing stock and the built-up area of Nyíregyháza have been steadily increasing over the period under study, the total population of the city has been decreasing several times in the 1990s and almost every year since 2016, following the national trends, mainly due to low fertility rates and the increasing proportion of elderly people in the population.
3.3.3. Future Vision: Focal Points of Expansion of Built-Up Areas and Their Changes up to 2030
The increase in the size and proportion of built-up areas is likely to continue in the near future, despite the fact that the total population of the city is expected to decrease. Suburban residential areas will continue to grow in terms of both dwellings and population if current trends continue. Of these suburbs, Oros and Nyírszőlős are expected to show the most spectacular and highest rates of growth. The population of the former could reach 10,000 by 2030 (i.e., almost 10% of the total population of the city will be concentrated here), while the latter will have between 5500 and 6000 inhabitants. In comparison, Oros had only 5749 inhabitants in 1990, while Nyírszőlős had 3285, so that in 40 years (1990–2030), Oros could increase its population by more than 70% and Nyírszőlős by as much as 75–80%, as well as similar rates of increase in the number of dwellings. Significant expansion is also expected in Sóstóhegy, Rozsrétszőlő, Borbánya-Kistelekiszőlő, and Felsőpázsit (Figure 9).
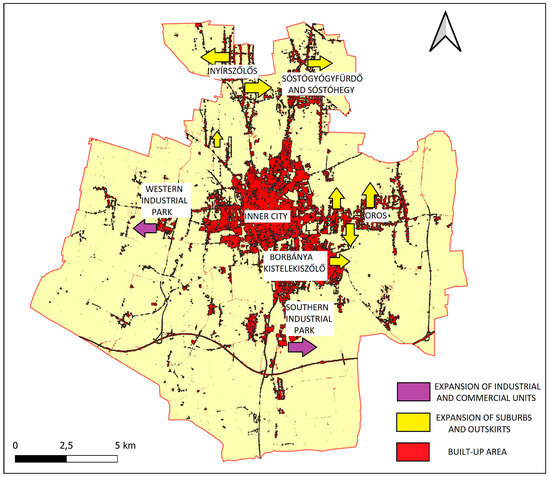
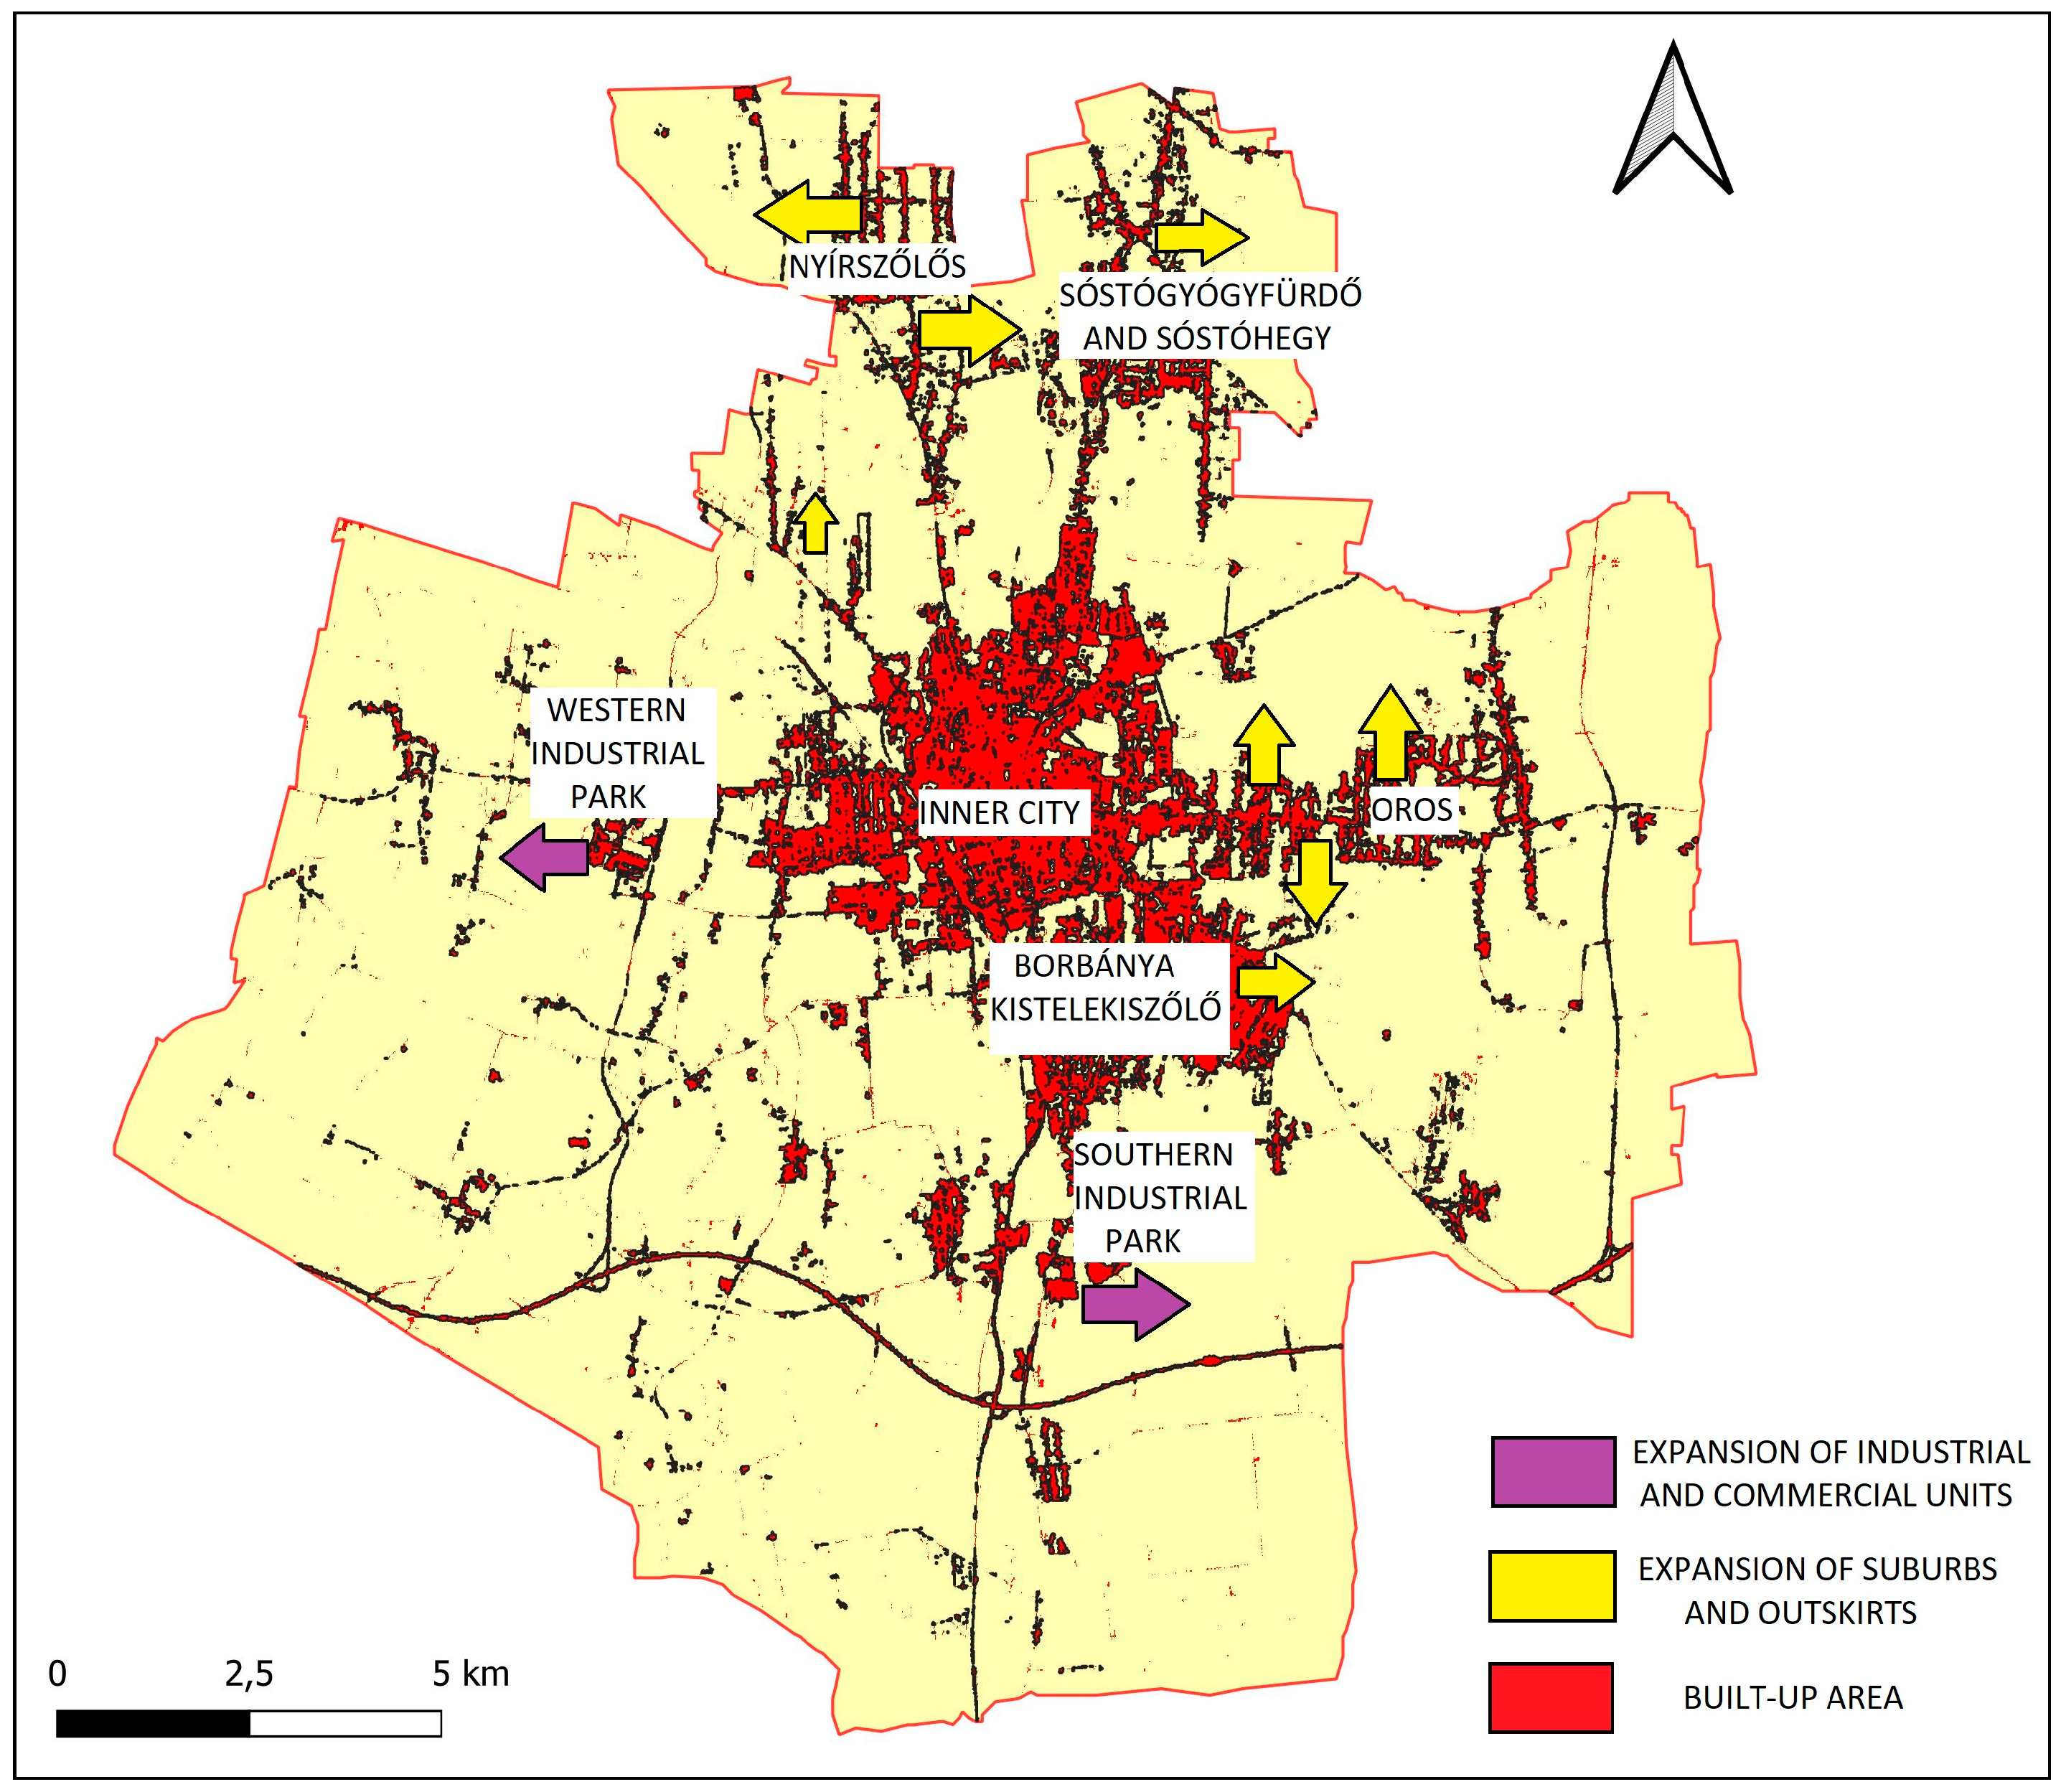
Figure 9.
Probable future directions of growth of built-up areas. The map shows the names of the municipalities most affected by the expansion. Source: own editing.
The expansion of built-up areas is also fueled by the further expansion of industrial and commercial facilities, in addition to internal suburbanization. In particular, the Western and Southern Industrial Parks have recently witnessed spectacular greenfield investments. Further development of several hundred hectares is expected by 2030, mainly as a consequence of the industrial developments currently underway in the Southern Industrial Park, linked to Boysen, W-Scope, Sunwoda, and MCE (Figure 9).
3.3.4. Comparative Analysis of the Change in Built-Up Areas in Nyíregyháza Based on the Relevant Data for Debrecen and Szeged
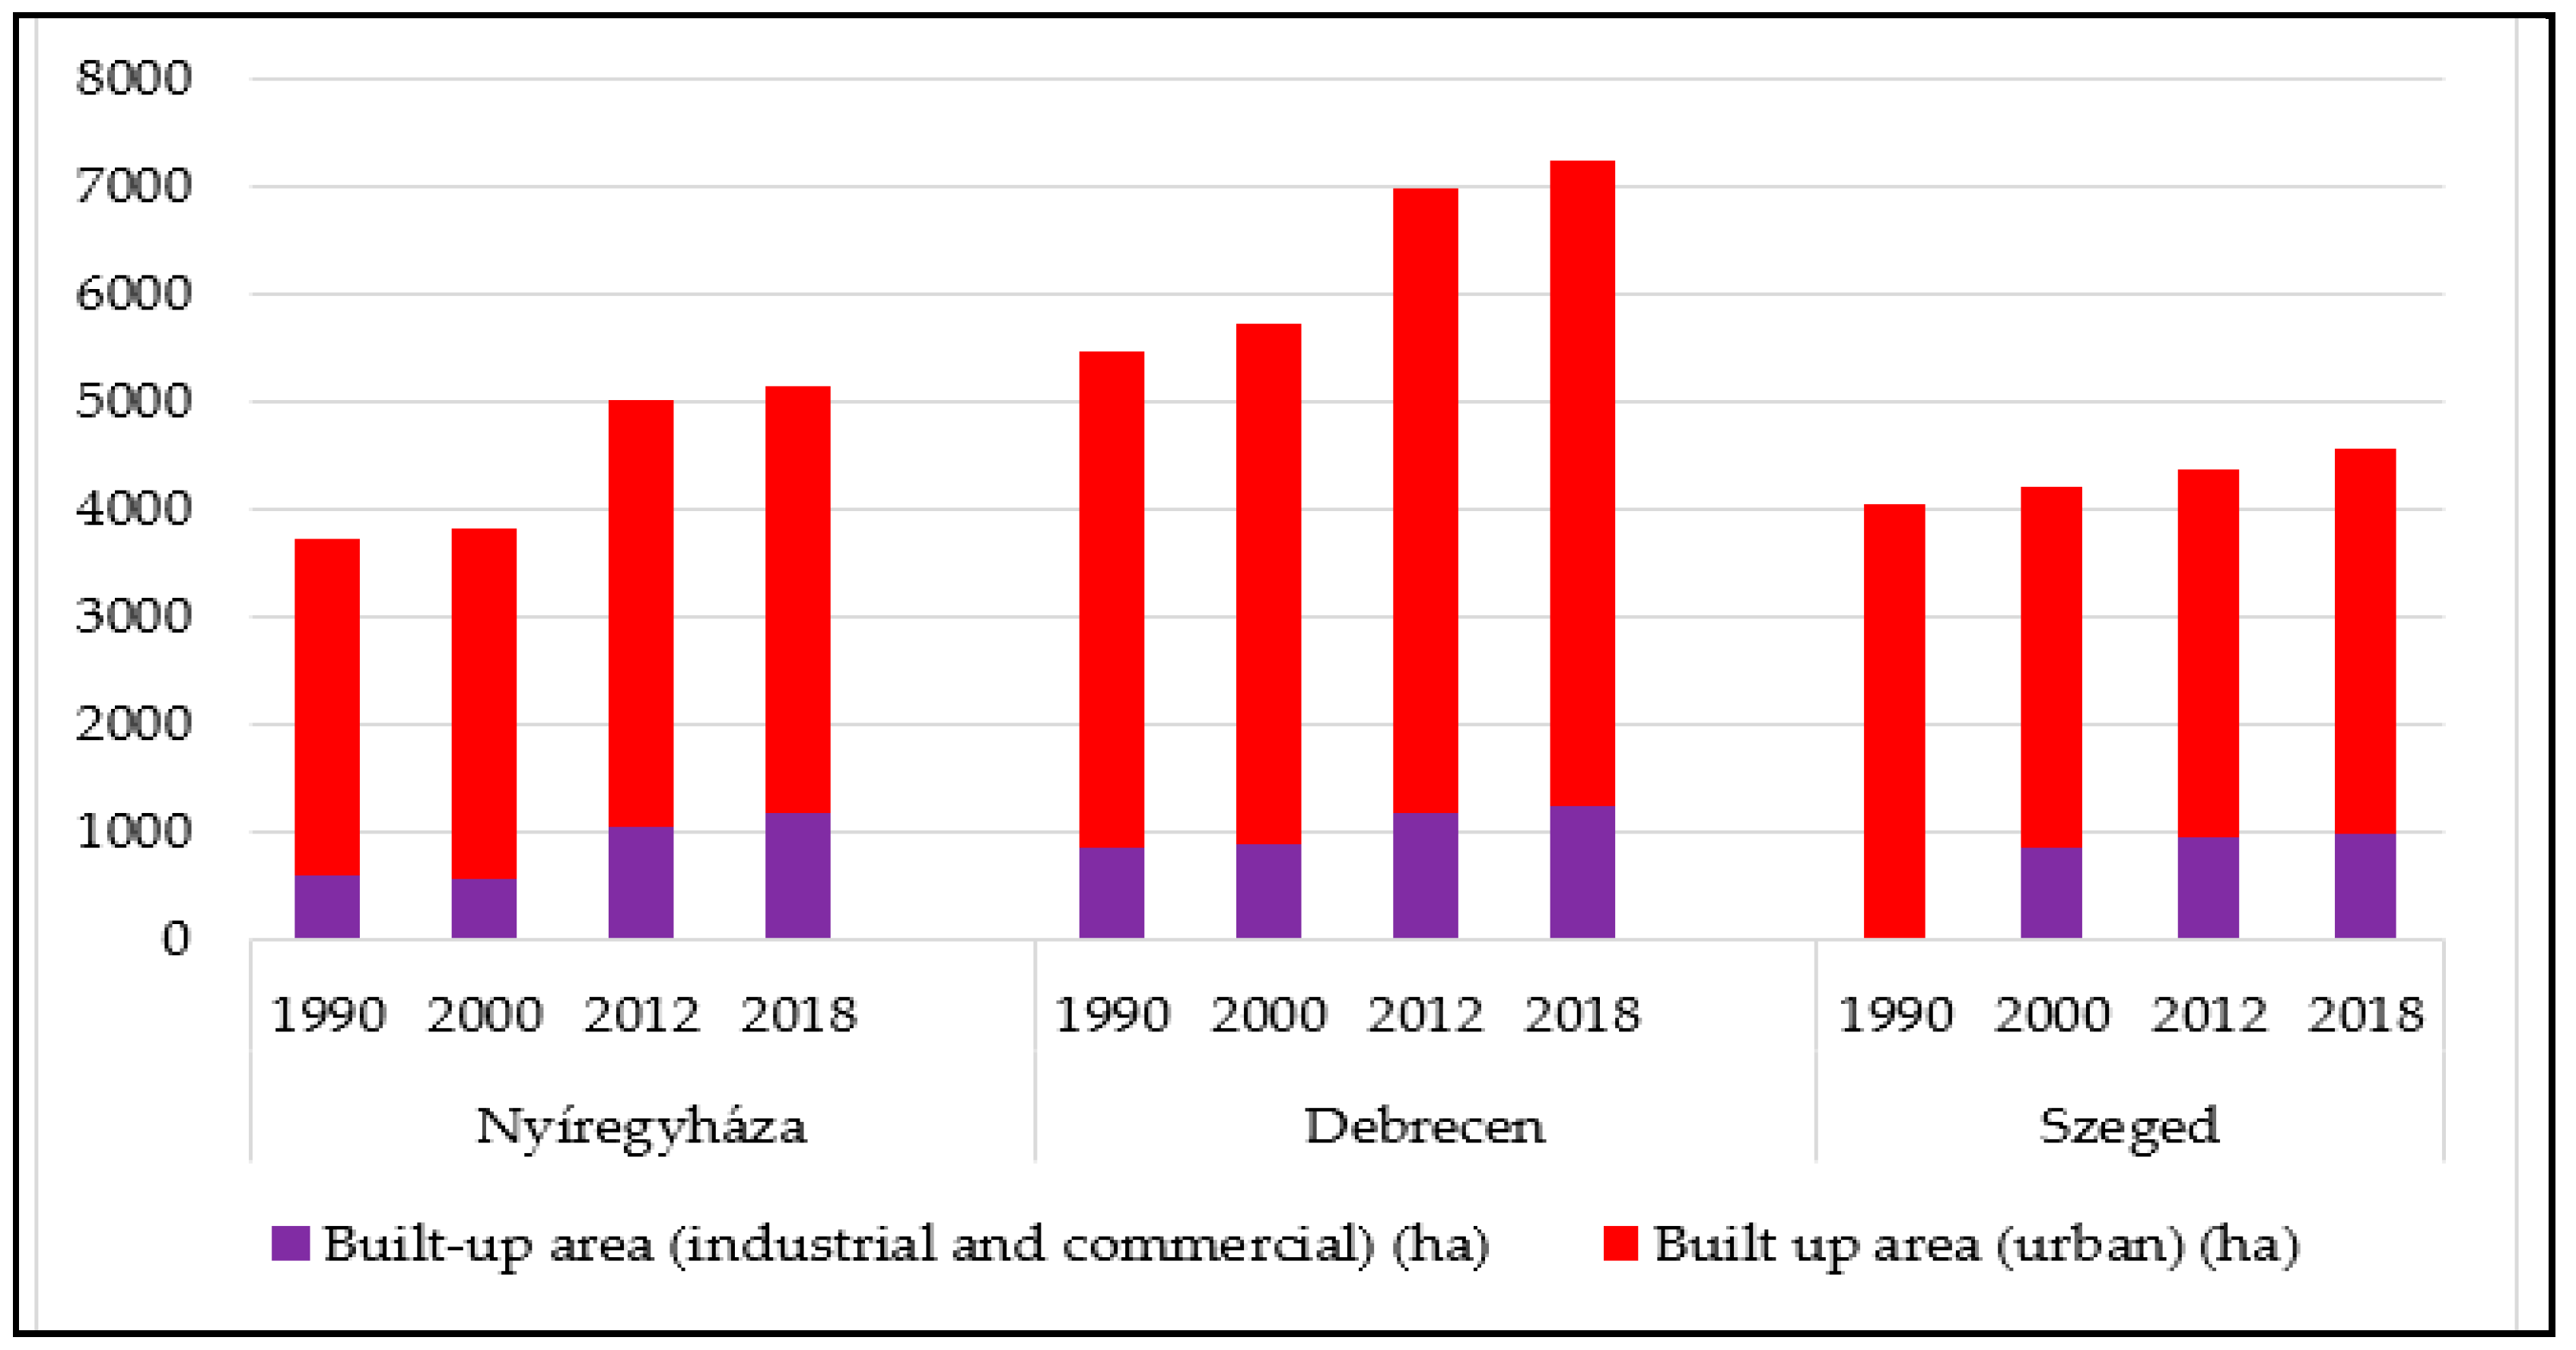
In order to identify potential trend-like patterns, the changes in the extent of built-up areas were also compared with values from other major cities in the Great Hungarian Plain (Szeged and Debrecen). In general, the overall size and proportion of built-up areas increased in all three municipalities studied over the four study periods (Figure 10, Table 1).
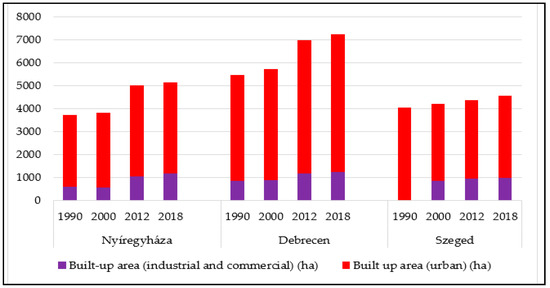
Figure 10.
Expansion of built-up areas in Nyíregyháza, Debrecen, and Szeged. Source: own editing.

Table 1.
Changes in the extent and proportion of built-up areas in Nyíregyháza, Debrecen, and Szeged.
Among the examined municipalities, the largest increase in build-up areas during the 1990–2018 period (38%) was observed in Nyíregyháza, while Szeged showed the smallest—though still significant—increase, at approximately 12%. In Debrecen, the combined extent of urban and industrial areas increased by 33%. It was also examined what percentage of the total administrative area of each municipality became built up during the same period. In Nyíregyháza, the built-up area accounted for 13.55% of the total area in 1990, including continuous and discontinuous urban fabric, as well as industrial and commercial zones. By 2018, this figure had increased to nearly 19%, representing the highest proportion among the three municipalities analyzed. This was largely due to the expansion of industrial parks and (internal) suburbanization, with the development of large residential areas, typically with garden houses.
Szeged had the highest built-up ratio (approximately 14%); however, the intensity of urban expansion was considerably lower compared with Nyíregyháza, resulting in a built-up proportion of only 16% by 2018. Debrecen has by far the largest area of public land (46,167 ha) of the three municipalities, which explains why, despite significant suburbanization and industrial development, it had the lowest initial (12%) and the lowest (15.7%) built-up ratio in the most recent CORINE reference year.
Built-up ratios increased in all municipalities during each examined period, despite the fact that population numbers showed a declining trend in several cases. In the case of Nyíregyháza, the population decreased by 1.5% between 1990 and 2000; however, the built-up area increased by 2.72%. In the case of Szeged, it is even more striking that while the population decreased by almost 10% over the same period, the built-up area increased by 3.6%. A similarly disproportionate pattern was observed during the 2000–2012 period in both Nyíregyháza and Debrecen. While industrial and urban built-up areas expanded by 32% and 21.45%, respectively, population growth was limited to 5% in Nyíregyháza and to less than 1% in Debrecen.
3.4. Assessment of Landscape Naturalness in Nyíregyháza
Based on the CORINE Land Cover data, a hemeroby map of Nyíregyháza was created, showing the conditions in 1990 and 2018 (Figure 11A,B). The hemeroby categories are an excellent way to illustrate the degree of landscape naturalness [5,6]. According to the literature, increasing levels of anthropogenic disturbance in a landscape are associated with higher degrees of hemeroby [6,39]. Landscape naturalness is most frequently evaluated using the classical hemeroby categories introduced by Jalas in 1955, although in some cases, extended scales with up to ten levels are also applied [33,40]. In order to illustrate the extent of anthropogenic geomorphic disturbance, a modified version of the hemeroby concept, the hemeromorphic scale, has been introduced [41].
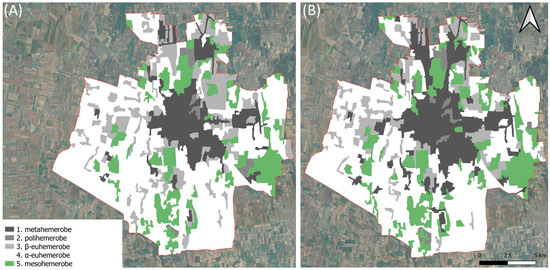
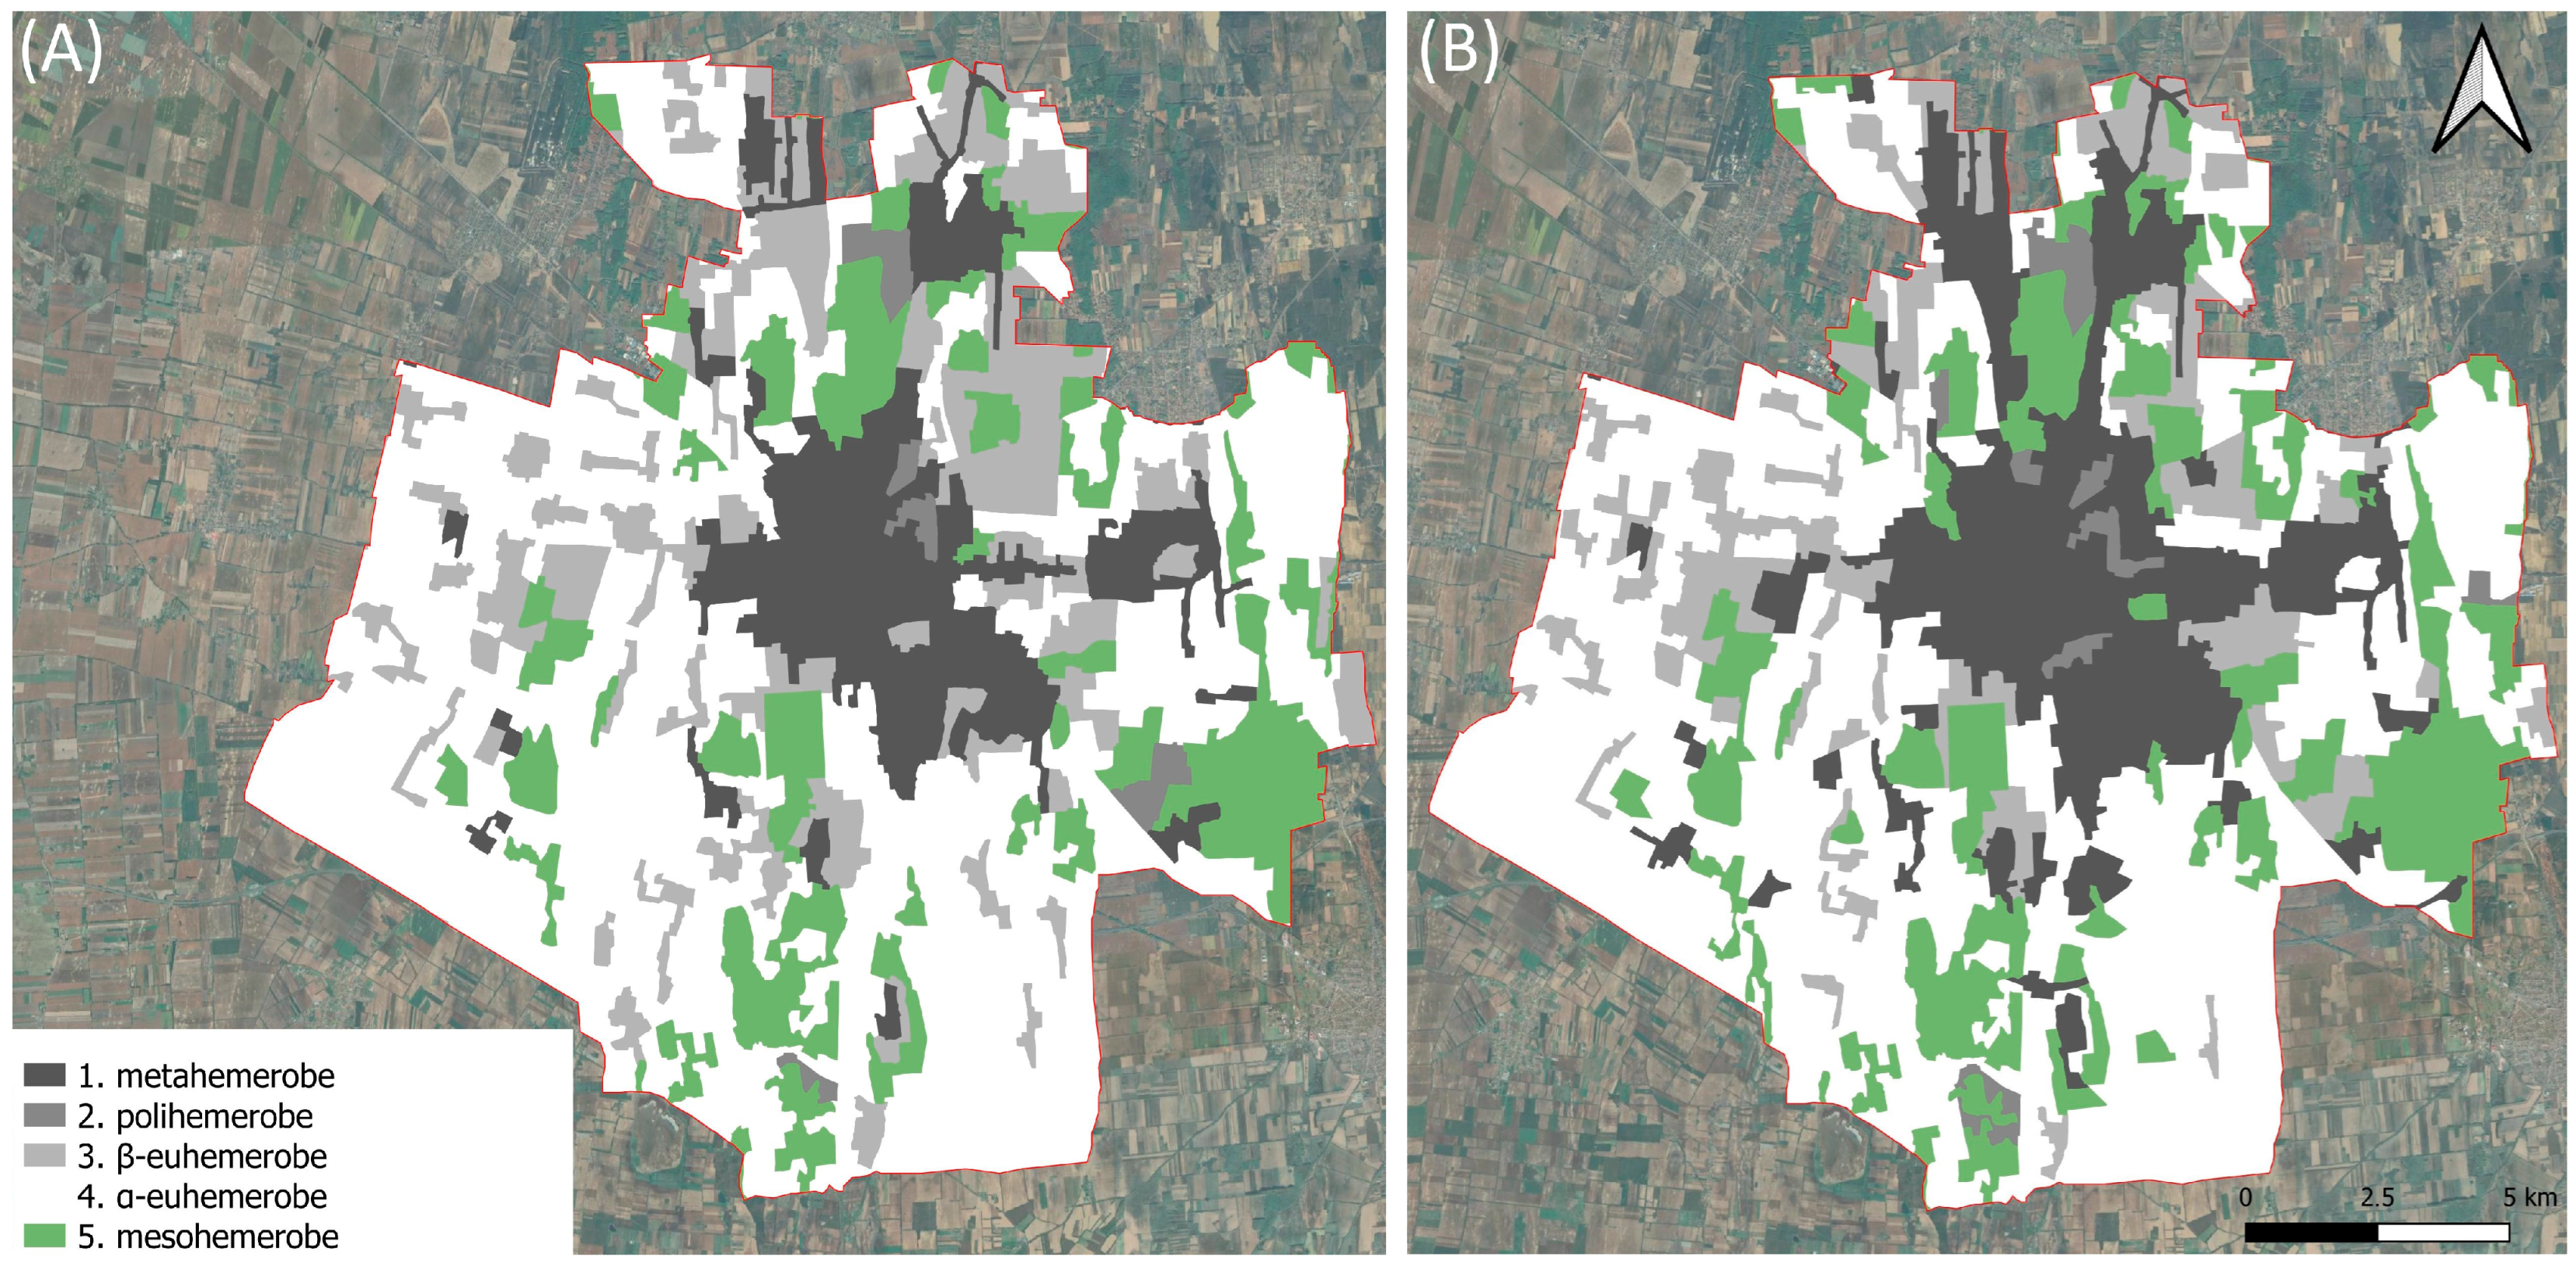
Figure 11.
Hemeroby map of Nyíregyháza in 1990 and 2018. Source: own editing.
Landscapes of higher naturalness than the mesohemerobic (semi-natural) category (oligohemerobic, ahemerobic) were not found in the municipality, and these areas were therefore found to be the most ecologically valuable. This category included all grasslands, meadows, areas covered by woody vegetation, as well as wetlands. In these areas, signs of anthropogenic disturbance—such as the presence of invasive species and altered soil and groundwater quality—are already evident; however, no major topographical modifications or landscape reshaping have occurred. In 1990, these semi-natural landscapes covered 15% of the total administrative area, while by 2018 this ratio increased slightly to 17% (Figure 12), most likely as a result of the increased proportion of forested land. The latter was probably due to an increase in the proportion of forested areas.

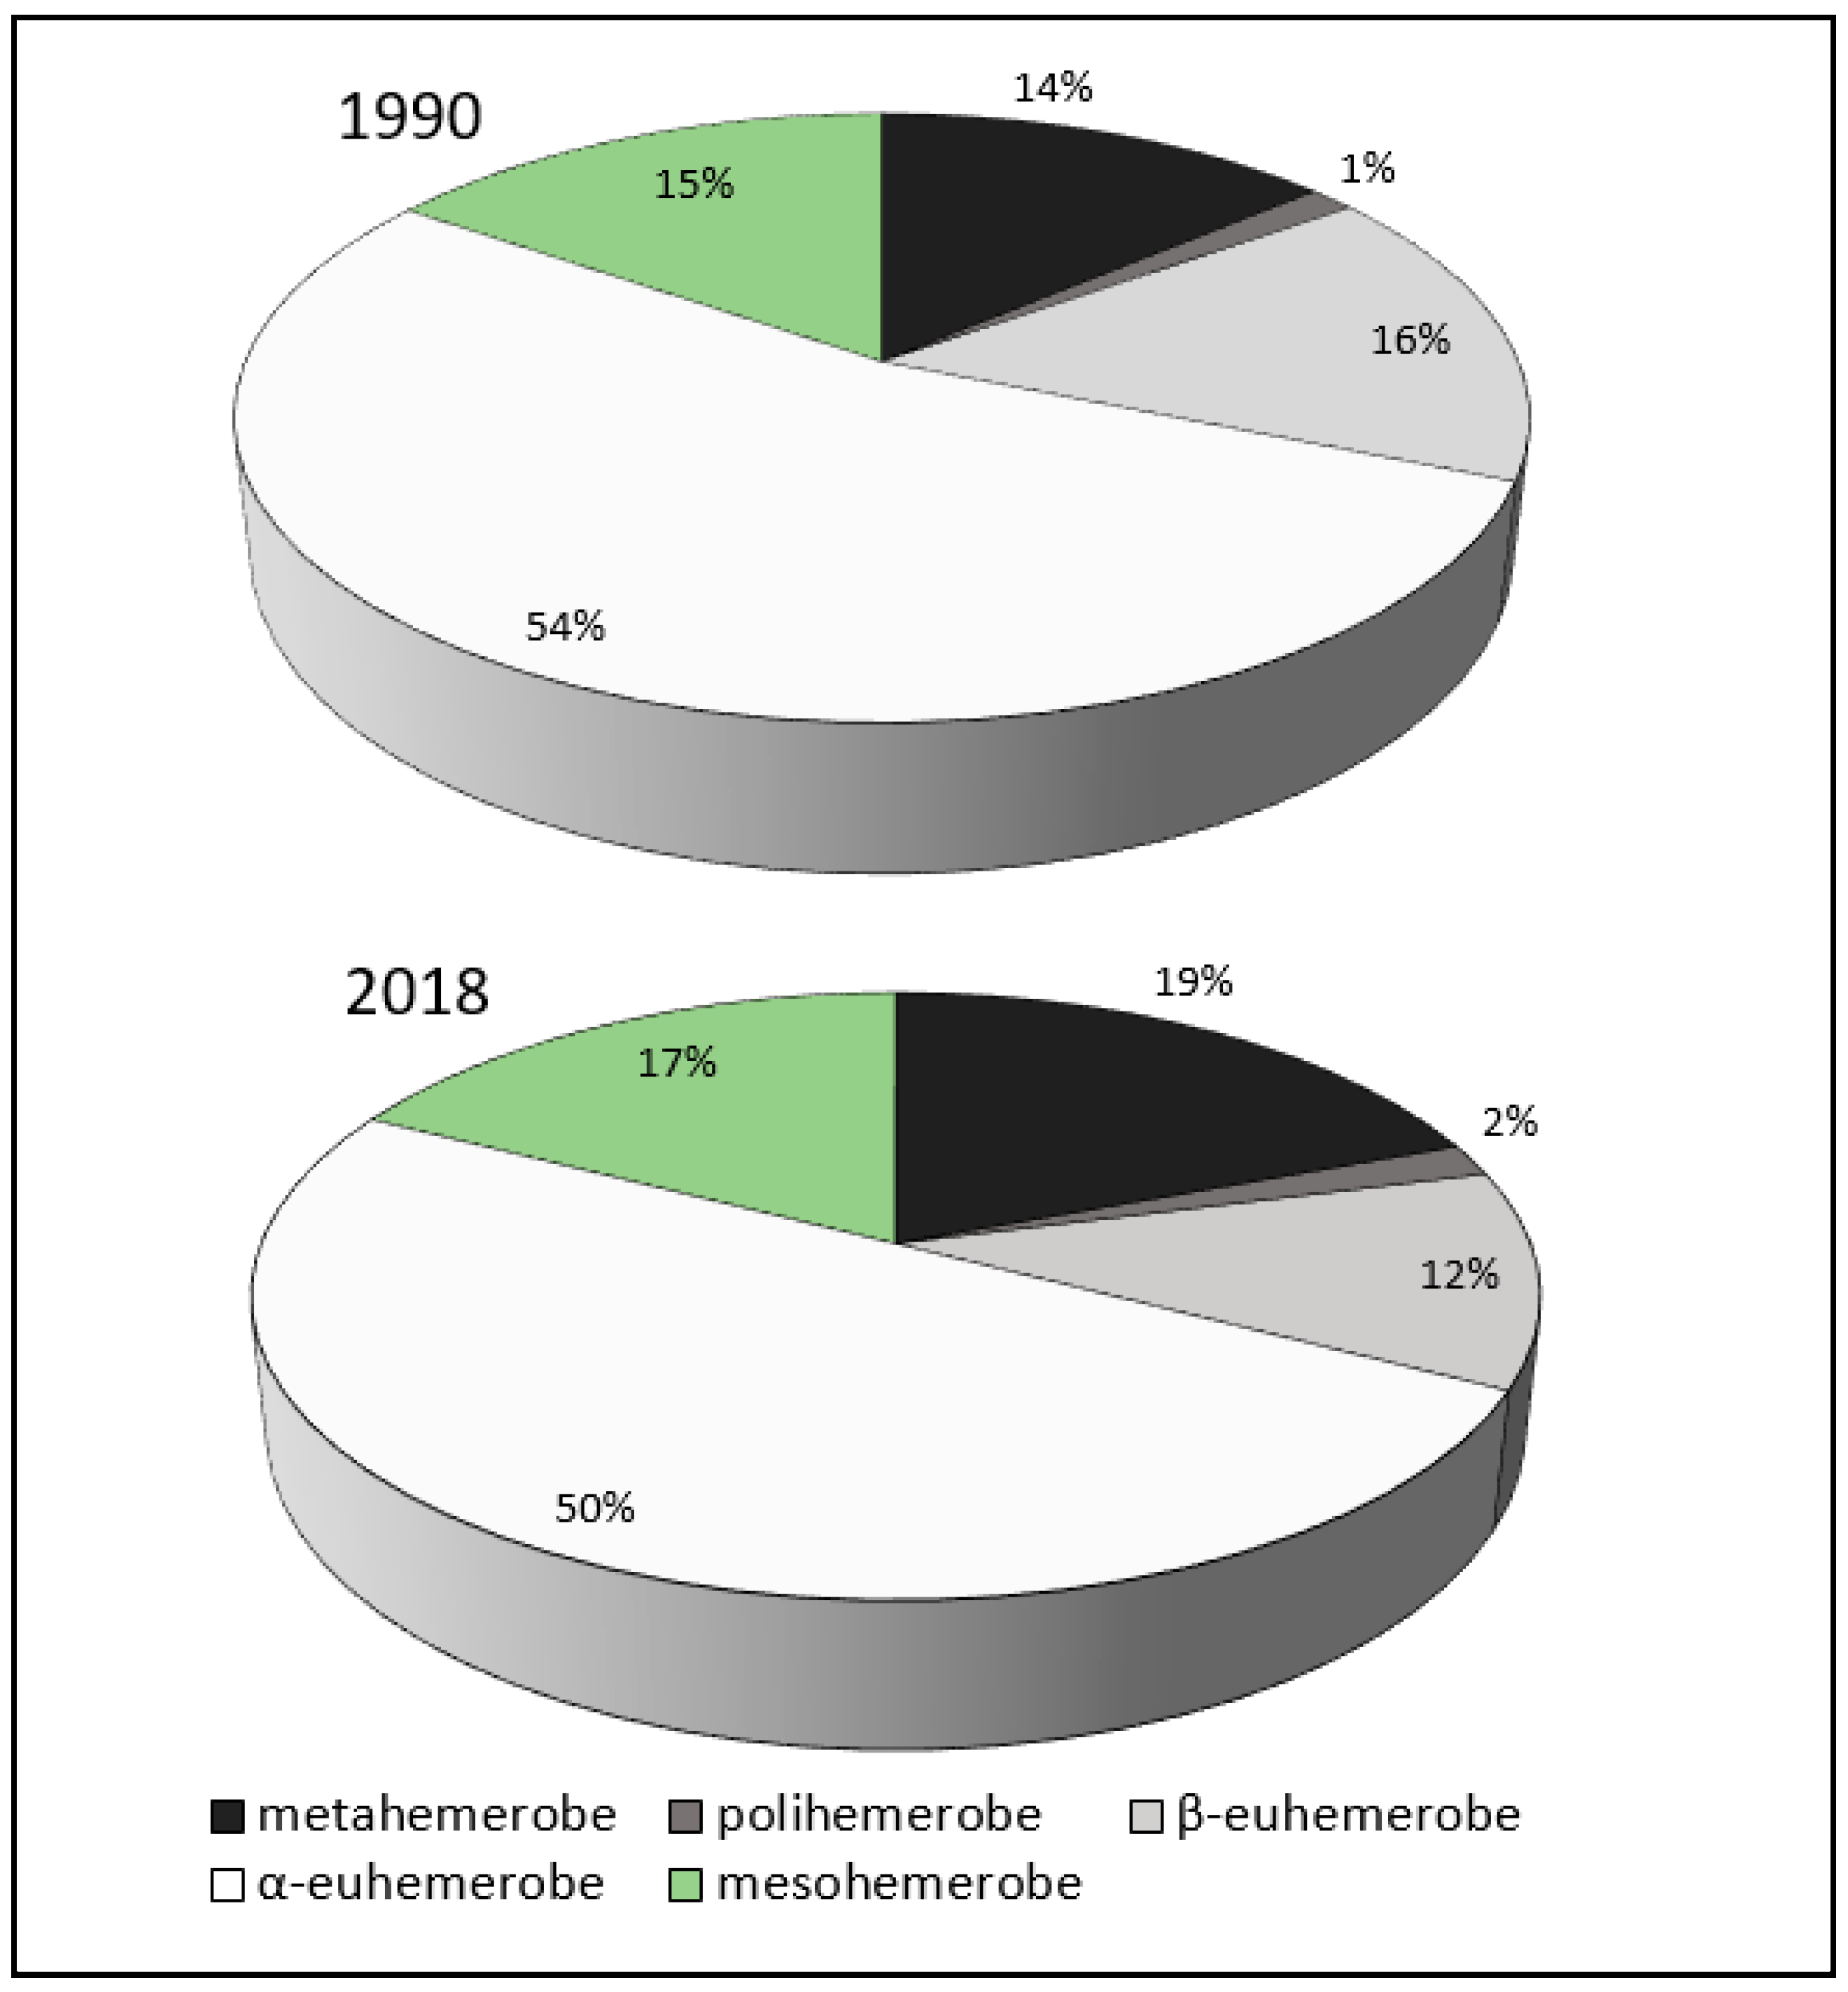
Figure 12.
Distribution of hemeroby categories in the area of Nyíregyháza in 1990 and 2018. Source: own editing.
The α-euhemerobe areas primarily consisted of arable land and predominantly agricultural areas that still retained significant elements of natural vegetation. The α-euhemerobic category was the most prevalent hemerobic category in both years studied. It covered 54% of the total area in 1990 and 50% in 2018, showing a relatively significant decrease (Figure 12) Although these areas are under agricultural use and therefore subject to significant disturbance, they still retain important ecological functions, serving as resting and foraging habitats for various animal species, as well as providing ecological corridors between mesohemerobic landscape patches.
The reduction in the extent of α-euhemerobic landscapes was mainly the result of the spatial expansion of polyhemerobic and metahemerobic landscapes. The β-euhemerobic category primarily included the CORINE classes of complex cultivation patterns and orchards, as these areas were subject to more intensive disturbance than non-irrigated arable land. Their share was 16% in 1990; however, it decreased to 12% in 2018 (Figure 12), mainly due to the gradual elimination of orchards.
Urban green spaces and sports and recreational facilities were classified as polyhemerobic areas, occupying only 1% and 2% of the total area, respectively, in 2018.
The metahemerobic category included continuous and discontinuous urban fabric, industrial areas, and landfill sites, essentially corresponding to built-up surfaces. A substantial increase in their overall proportion has been observed since 1990. Hile in that year they accounted for only 14% of the total area, by 2018 their share had risen to nearly 20%. Further significant growth can be expected in the future due to the large-scale industrial developments initiated in recent years. Overall, the naturalness of the landscape of the city of Nyíregyháza has declined, despite the slight increase in the proportion of mesohemerobic areas. This is primarily due to the fact that the combined extent of polyhemerobic and metahemerobic areas—considered the most problematic from an ecological perspective—has increased by 6% compared with 1990 (Figure 12). When numerical values are assigned to the categories based on their level of landscape naturalness, and a weighted average is calculated based on their proportional area, a similar pattern emerges. The highest scores would be assigned to undisturbed ahemerobic areas (6) and near-natural oligohemerobic areas (5); however, these categories were not present within the study area. Mesohemerobic landscape units were assigned 4 points, α-euhemerobic areas received 3 points, β-euhemerobic areas 2 points, and polyhemerobic areas 1 point, while metahemerobic areas were assigned 0 points. The weighted average value was 2.55 in 1990 and decreased to 2.44 by 2018. This indicates that while the average level of landscape disturbance in Nyíregyháza aligned with the α-euhemerobic category in 1990, by 2018 it had shifted toward the β-euhemerobic category.
3.5. Elements and Status of the Ecological Network of Nyíregyháza
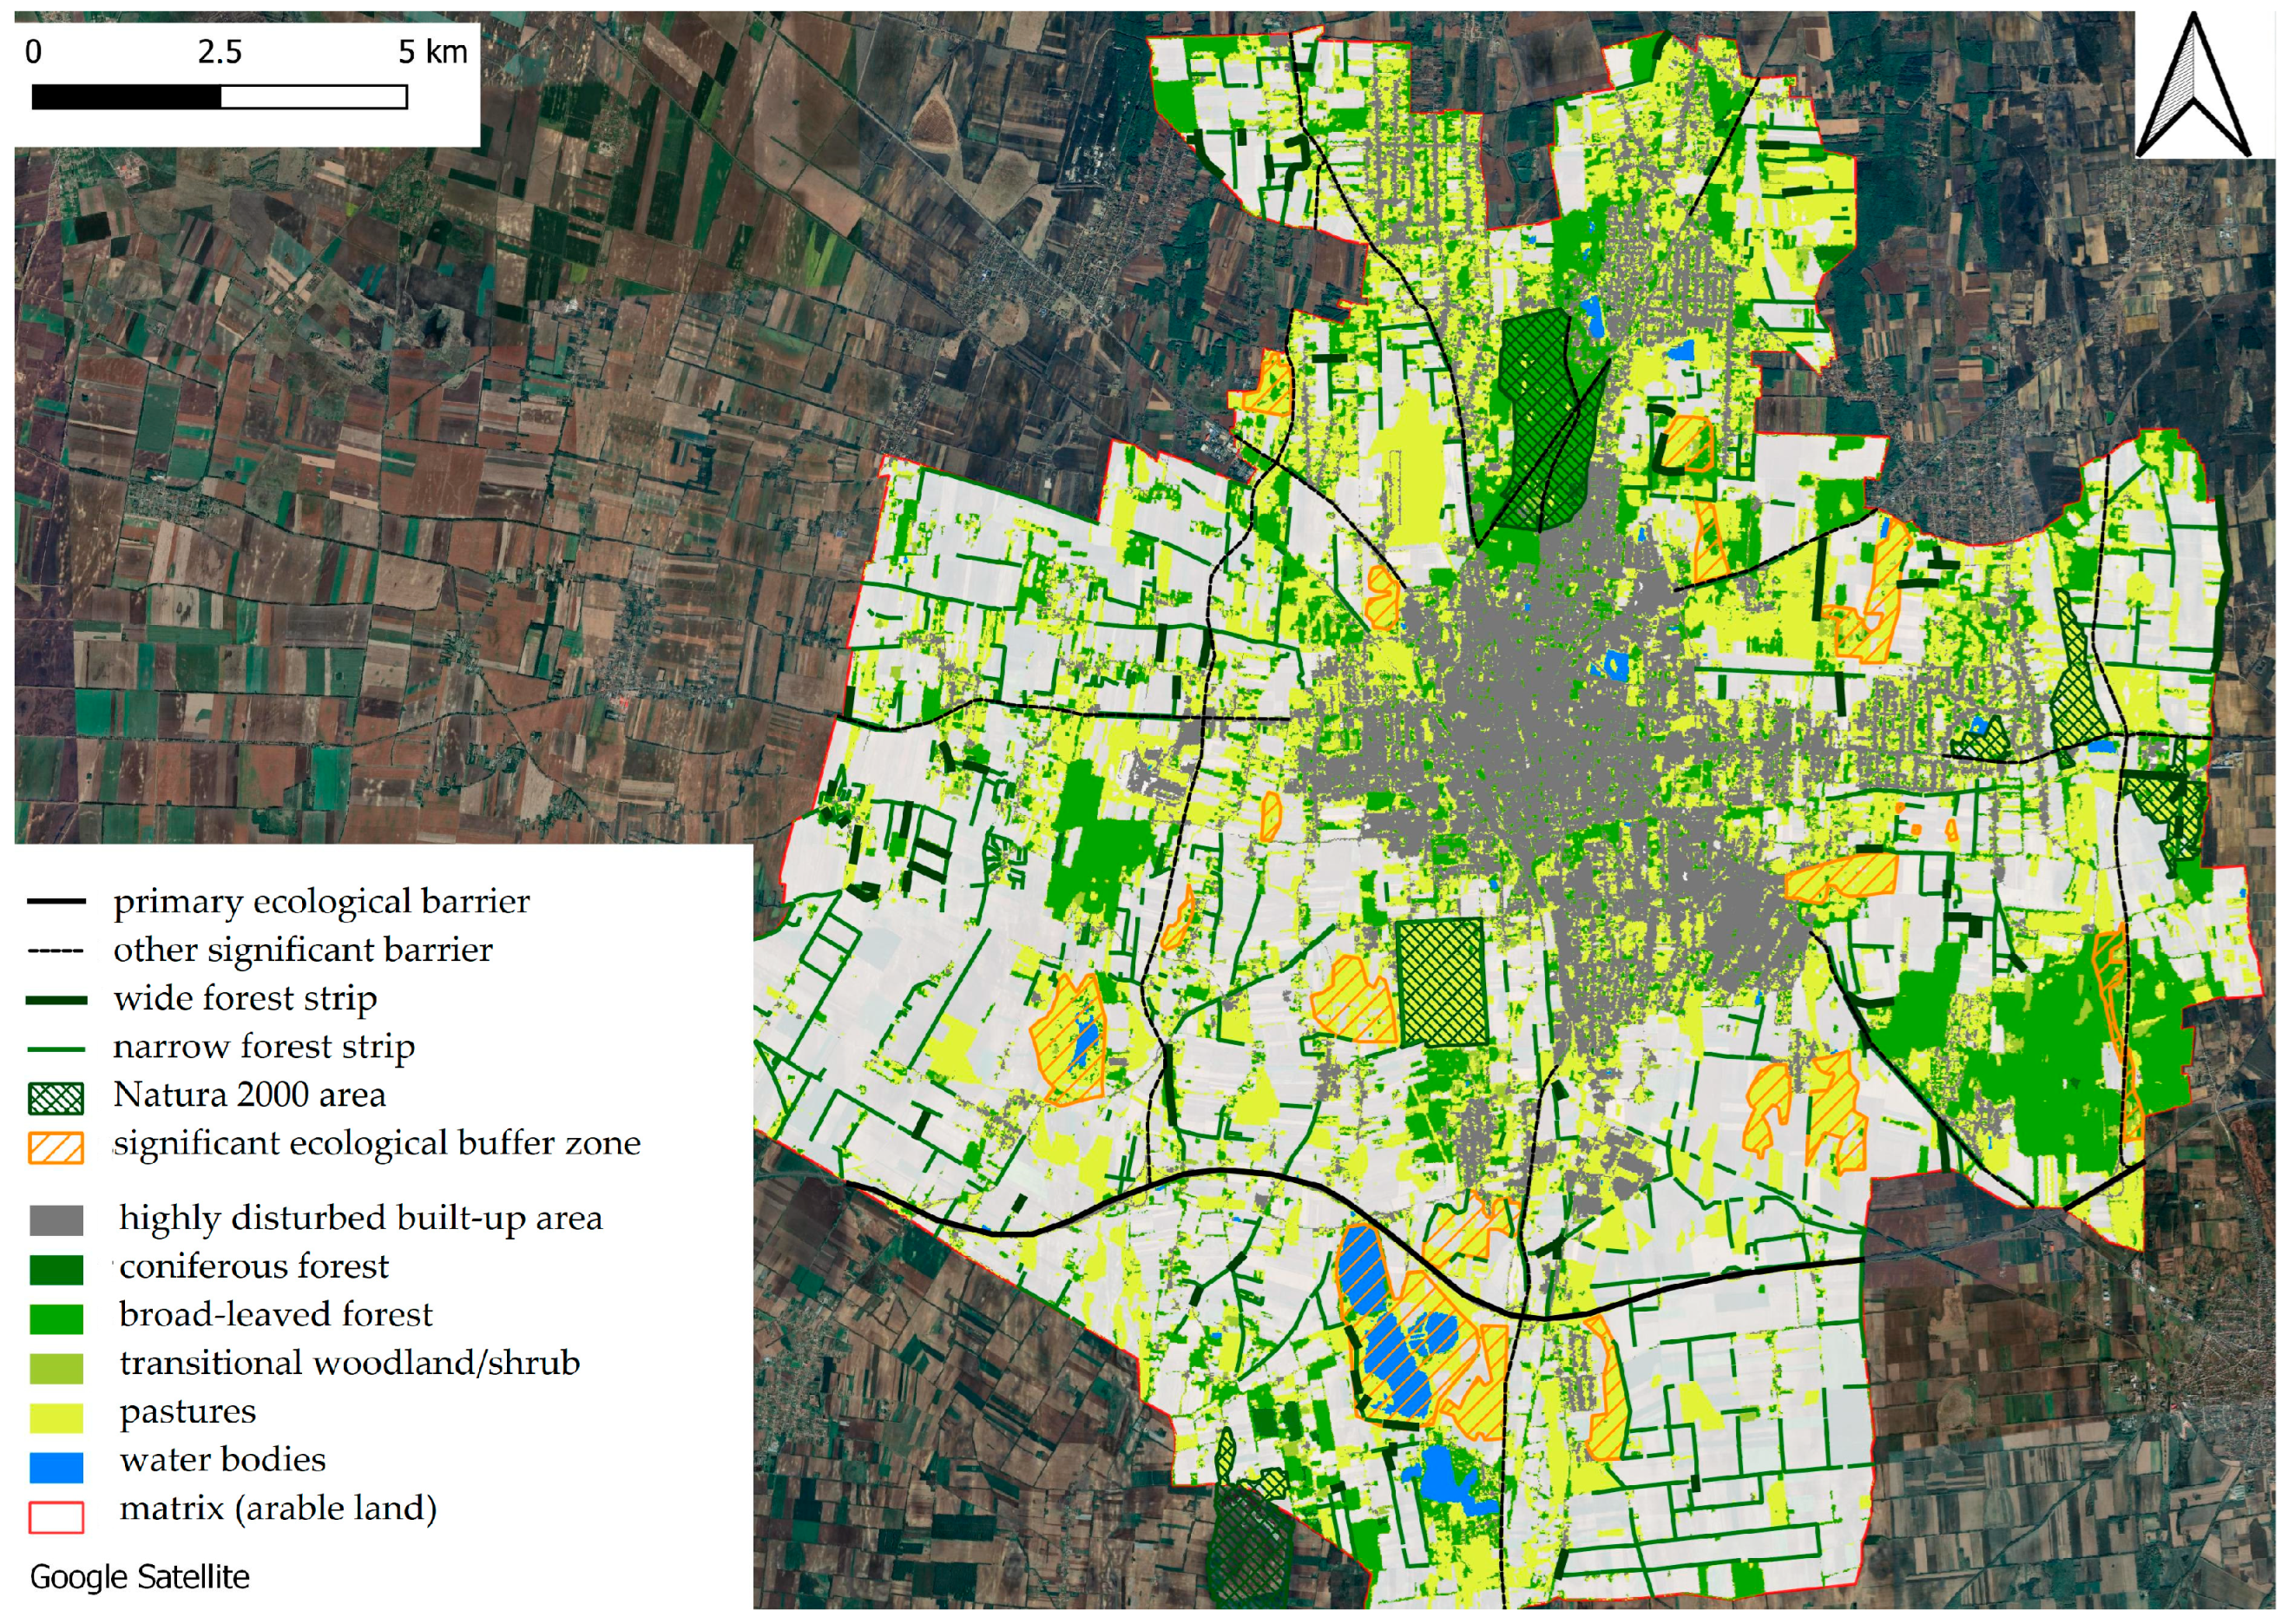
The most valuable elements of the municipal ecological network (Figure 13), a kind of core area, are the Natura 2000 sites, which together cover only about 700 hectares. These areas are also typically designated as locally significant protected natural sites. This includes the Sóstó Forest in the north of the town, an area of about 280 hectares of predominantly stalked oak, with a small proportion of acacia and other stands, the low-lying wet meadows and pastures of the eastern outskirts (Orosi meadows), the municipal shooting range, which also includes valuable grassland, and the last of the many salt lakes that once existed on the outskirts of the town, the Great Vadas Lake.
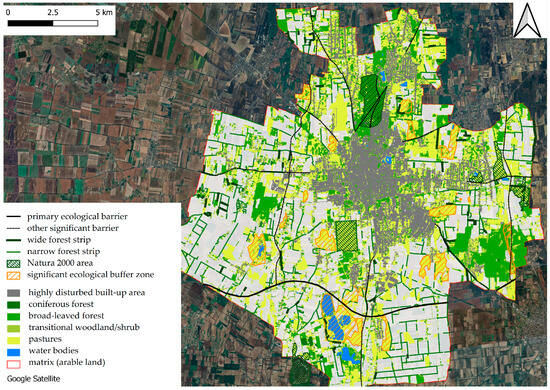
Figure 13.
Landscape ecological map of Nyíregyháza based on 2018 CLCplus Backbone data. Source: own editing.
Important elements of the ecological network are the buffer zones, which are located outside Natura 2000 areas but also harbor valuable ecotopes and habitat patches, covering a total area of about 4000 ha. These are typically also mesohemerobic, possibly α-euhemerobic areas, whose main function is (would be) to create free connectivity between core areas. Unfortunately, however, these ecological corridors are interrupted by the mainly linear infrastructure elements (mainly the 403 motorway, M3 motorway, E573 road, 338 motorway) that cross the outskirts of the municipality and are unable to fulfill their function or can only do so to a limited extent.
A similar role could be played by a network of forest strips to protect fields in the outskirts of the municipality, which could cover a total length of more than 200 km. In addition to separating field parcels from each other and more or less preventing the transport of dry soil material by wind erosion, the latter could also play an ecological corridor role [42]. However, in the case of Nyíregyháza, the average width and frequent interruptions of the field protection forest strips limit their ability to fulfill the latter function.
Overall, it can be concluded that the city’s ecological network is very fragile due to suburbanization, the combined expansion of municipal infrastructure and industrial areas, and its long-term survival is highly questionable. The most valuable core areas are often very distant and fragmented, and free passage of communities through buffer zones is not possible or is very limited, mainly due to the obstacles posed by linear infrastructure.
4. Discussion
The results clearly show that land use and land cover in Nyíregyháza have undergone intense and significant changes since the time of the Second Military Survey. Particularly striking is the extensive expansion of discontinuous urban fabric and industrial areas: since the Second Military Survey, the total extent of built-up areas has increased more than eighteenfold, which has also led to the continuous spatial expansion of the administrative boundaries of the city. Up until the 1990s, urban expansion occurred in parallel with population growth. However, the expansion of built-up areas has continued steadily even after the 1990s, despite several periods during which the city’s population declined or grew only marginally. These findings suggest that our hypothesis was correct: there is no clear relationship between the growth of built-up areas and changes in population size, at least for the period between 1990 and 2018. According to CORINE data, industrial and urban areas continued to expand even during periods when population numbers clearly declined. This pattern is consistent not only for Nyíregyháza but also for the other examined cities, Debrecen and Szeged. Our findings are also supported by data available in the international literature. Angel and colleagues examined urban area changes in 120 cities between 1990 and 2000, and in 200 cities between 2000 and 2014. In nearly all cases, they observed an increase in total built-up area (Built-up Area Total), even in cities where population numbers declined—particularly in cases from Europe, Central and East Asia—during the periods under investigation [21,43].
In the case of Nyíregyháza, there has been a nearly continuous decline in the population since 2016; however, the housing stock and the extent of built-up areas have continued to increase during this period. This urban expansion can be largely explained by internal suburbanization, characterized by the migration of residents from the city centre to suburban, single-family residential zones, as well as by the development of industrial parks.
Suburbanization in Europe initially emerged in traditionally developed, highly urbanized, and densely populated regions of Western Europe—such as the Netherlands and the United Kingdom—but since the 1990s, it has also become evident in Central and Eastern European countries [9,10,44]. In Hungary, the earliest examples of urban sprawl were observed in Budapest; however, the phenomenon soon appeared in larger rural towns and county capitals, including Nyíregyháza [12,13,14].
According to data from the European Environment Agency (2006, 2016), urban sprawl is now present across nearly all of Europe, albeit with significant regional variation. Urbanization hotspots include the Benelux countries, the northwestern urban agglomerations of Germany (e.g., the Ruhr area), Ireland, and the Spanish Riviera [15,16]. In these areas, urban expansion typically occurs in parallel with population growth, so the latter could be the only explanation for the increase in built-up areas. However, there are many regions where urban sprawl occurs even as population stagnates or declines. These include the urban areas of the eastern Germany and inland Spain, but also the countries of East-Central Europe, including Hungary [15,16]. In this case, urban expansion can no longer be attributed to population growth and the associated real estate and infrastructure development. It is primarily driven by internal and external suburbanization and, to a lesser extent, by the expansion of industrial and commercial infrastructure.
These findings suggest that suburbanization is not necessarily strongly correlated with population growth. Even in municipalities experiencing demographic decline, internal population redistribution may lead to the growth of certain neighborhoods, which are the main contributors to the expansion of built-up urban areas. This observation has been confirmed not only by the literature but also by our own surveys in Nyíregyháza [11,12,13,14,15,16].
The expansion of built-up areas was also reflected in the general decline of landscape naturalness within the urban environment, as these areas fall into the metahemerobic category—the lowest level of naturalness. Their spread inevitably contributed to the degradation of the overall hemeroby level of the landscape and, ultimately, to the deterioration of its ecosystem services and ecological functions.
5. Conclusions
In general, urban fringe and peripheral areas are increasingly subject to intensive and adverse landscape processes and landscape development trends, driven by intensifying anthropogenic disturbances. Among these processes, the expansion of built-up areas—urban expansion—stands out as the most extensive and intensive phenomenon.
The present study examined the growth of urban areas in the Hungarian city of Nyíregyháza using historical sources and time-series data from the CORINE Land Cover database. The analysis focused on identifying spatial expansion patterns over several decades. In the case of Nyíregyháza, the study revealed that the spatial growth of the city occurred almost continuously from the late 18th century until the 1990s, in parallel with a steady increase in population. However, since the 1990s, several periods of population decline have been observed, while the housing stock—and consequently, the proportion of built-up areas—has continued to grow. This trend is primarily attributable to suburbanization, particularly internal suburbanization, which occurs within the administrative boundaries of the city and is driven by shifting residential preferences.
Since the 1990s, suburban zones characterized by detached, single-family homes have become increasingly preferred over the more densely built-up inner-city districts. This trend is evidenced by data from the Central Statistical Office, which indicate population and housing stock growth in several outer districts of Nyíregyháza (e.g., Oros, Nyír-szőlős, Sóstóhegy), while the inner city experienced a decline in population. Although the number of housing units has also increased in central districts, this did not significantly contribute to urban expansion, as new housing (mostly multi-story apartment buildings) was predominantly constructed on already developed plots, replacing deteriorated single-story buildings. In contrast, the expansion of the housing stock in suburban neighborhoods has involved the conversion of previously undeveloped areas—mainly arable land or orchards—thus contributing to the overall increase in built-up land.
Besides suburbanization, industrial and commercial developments, along with related infrastructure projects—particularly in industrial parks located in peripheral zones—have also played a significant role in urban expansion.
The trends observed in the data suggest that internal suburbanization and industrial growth are likely to continue in the near future, leading to further development of peripheral areas. These changes will almost certainly exert a negative impact on the city’s ecological network and the landscape’s natural integrity in peripheral zones. Further fragmentation and a reduction in the remaining ecological core and buffer zones are expected. The intensification of anthropogenic disturbance appears to be inevitable, even if future development hotspots do not directly affect areas of local conservation significance or Natura 2000 sites.
The authors anticipate that the forthcoming CLC 2024 dataset will enable further insights into the spatial growth trajectories and development intensity of the city. Where feasible, we also intend to validate these data through field surveys in the near future. Moreover, we hope our research will provide valuable input for professionals involved in urban development and spatial planning.
Author Contributions
Conceptualization, D.B., I.F., and T.M.; methodology, D.B.; software, D.B.; validation, T.M. and I.F.; formal analysis, D.B.; investigation, D.B.; resources, I.F. and T.M.; data curation, D.B.; writing—original draft preparation, D.B. and T.M.; writing—review and editing, T.M. and I.F.; visualization, D.B.; supervision, I.F. All authors have read and agreed to the published version of the manuscript.
Funding
This research received no external funding.
Data Availability Statement
The data presented in this study are available on request from the corresponding author.
Conflicts of Interest
The authors declare no conflicts of interest.
References
- Horváth, R.; Magura, T.; Szinetár, C.; Tóthmérész, B. Spiders Are Not Less Diverse in Small and Isolated Grasslands, but Less Diverse in Overgrazed Grasslands: A Field Study (East Hungary, Nyírség). Agric. Ecosyst. Environ. 2009, 130, 16–22. [Google Scholar] [CrossRef]
- Tang, J.; Wang, L.; Yao, Z. Spatio-temporal Urban Landscape Change Analysis Using the Markov Chain Model and a Modified Genetic Algorithm. Int. J. Remote Sens. 2007, 28, 3255–3271. [Google Scholar] [CrossRef]
- Paul, M.J.; Meyer, J.L. Streams in the Urban Landscape. Annu. Rev. Ecol. Syst. 2001, 32, 333–365. [Google Scholar] [CrossRef]
- Walz, U.; Stein, C. Indicators of Hemeroby for the Monitoring of Landscapes in Germany. J. Nat. Conserv. 2014, 22, 279–289. [Google Scholar] [CrossRef]
- Csorba, P.; Szabó, S. Degree of Human Transformation of Landscapes: A Case Study from Hungary. Hung. Geogr. Bull. 2009, 58, 91–99. [Google Scholar]
- Szilassi, P. Tájváltozások Magyarországon 1990–2018 Között: Agroökológiai Háttér, Tájökológiai És Környezeti Követelmények. In Proceedings of the MTA Doktori Értekezés; Szeged, Hungary, 2023; Available online: https://www.google.com/url?sa=t&source=web&rct=j&opi=89978449&url=https://real-d.mtak.hu/1535/9/miklos_laszlo_biralata.pdf&ved=2ahUKEwihr6fv3MKNAxVrslYBHcYnCs0QFnoECBUQAQ&usg=AOvVaw2eG5MRJ3aUk_L-KzV7Yq_H (accessed on 14 May 2025).
- Kassai, P.; Szabó, G.; Tóth, G.; Institute of Advanced Studies—Centre for Agricultural Research; Institute for Soil Sciences. A művelés alól kivont területek és a talajfedés kapcsolatának vizsgálata közigazgatási adatok és távérzékelt információk alapján. Mod. Geogr. 2022, 17, 61–69. [Google Scholar] [CrossRef]
- Ke, X.; Van Vliet, J.; Zhou, T.; Verburg, P.H.; Zheng, W.; Liu, X. Direct and Indirect Loss of Natural Habitat Due to Built-up Area Expansion: A Model-Based Analysis for the City of Wuhan, China. Land Use Policy 2018, 74, 231–239. [Google Scholar] [CrossRef]
- Cocheci, R.-M.; Petrisor, A.-I. Assessing the Negative Effects of Suburbanization: The Urban Sprawl Restrictiveness Index in Romania’s Metropolitan Areas. Land 2023, 12, 966. [Google Scholar] [CrossRef]
- View of Environmental Consequences of the Urban Sprawl in the Suburban Zone of Nitra. Available online: https://aseestant.ceon.rs/index.php/geopan/article/view/25543/15978 (accessed on 14 May 2025).
- Spórna, T.; Krzysztofik, R. ‘Inner’ Suburbanisation—Background of the Phenomenon in a Polycentric, Post-Socialist and Post-Industrial Region. Example from the Katowice Conurbation, Poland. Cities 2020, 104, 102789. [Google Scholar] [CrossRef]
- Nagy, G.; Hegedűs, T. Urban Sprawl or/and Suburbanisation?: The Case of Zalaegerszeg. Belvedere Meridionale 2016, 28, 106–119. [Google Scholar] [CrossRef]
- Hegedűs, L.D.; Túri, Z.; Apáti, N.; Pénzes, J. Analysis of the Intra-Urban Suburbanization with Gis Methods. The Case of Debrecen Since the 1980s. Folia Geogr. 2023, 65, 23. [Google Scholar]
- Pristyák, E.B.; Kókai, S. Az agglomerálódás és a szuburbanizáció jellemzői a nyíregyházi településegyüttesben/szuburbiában. Településföldrajzi Tanulmányok 2012, 1, 97–103. [Google Scholar]
- Urban Sprawl in Europe—Joint EEA-FOEN Report. Available online: https://www.eea.europa.eu/en/analysis/publications/urban-sprawl-in-europe (accessed on 13 May 2025).
- Urban Sprawl in Europe—The Ignored Challenge. Available online: https://www.eea.europa.eu/publications/eea_report_2006_10/eea_report_10_2006.pdf (accessed on 25 March 2025).
- Jiang, H.; Guo, H.; Sun, Z.; Xing, Q.; Zhang, H.; Ma, Y.; Li, S. Projections of Urban Built-up Area Expansion and Urbanization Sustainability in China’s Cities through 2030. J. Clean. Prod. 2022, 367, 133086. [Google Scholar] [CrossRef]
- Liu, W.; Liu, J.; Kuang, W.; Ning, J. Examining the Influence of the Implementation of Major Function-Oriented Zones on Built-up Area Expansion in China. J. Geogr. Sci. 2017, 27, 643–660. [Google Scholar] [CrossRef]
- Seto, K.C.; Güneralp, B.; Hutyra, L.R. Global Forecasts of Urban Expansion to 2030 and Direct Impacts on Biodiversity and Carbon Pools. Proc. Natl. Acad. Sci. USA 2012, 109, 16083–16088. [Google Scholar] [CrossRef]
- Angel, S.; Parent, J.; Civco, D.; Blei, A. Atlas of Urban Expansion 2012; Lincoln Institute of Land Policy: Cambridge, MA, USA, 2012; ISBN 978-1-55844-243-6. [Google Scholar]
- Angel, S.; Sheppard, S.C.; Civco, D.L. The Dynamics of Global Urban Expansion; World Bank: Washington, DC, USA, 2005. [Google Scholar]
- Feranec, J.; Jaffrain, G.; Soukup, T.; Hazeu, G. Determining Changes and Flows in European Landscapes 1990–2000 Using CORINE Land Cover Data. Appl. Geogr. 2010, 30, 19–35. [Google Scholar] [CrossRef]
- Aksoy, T.; Dabanli, A.; Cetin, M.; Senyel Kurkcuoglu, M.A.; Cengiz, A.E.; Cabuk, S.N.; Agacsapan, B.; Cabuk, A. Evaluation of Comparing Urban Area Land Use Change with Urban Atlas and CORINE Data. Environ. Sci. Pollut. Res. 2022, 29, 28995–29015. [Google Scholar] [CrossRef]
- Cieślak, I.; Biłozor, A.; Szuniewicz, K. The Use of the CORINE Land Cover (CLC) Database for Analyzing Urban Sprawl. Remote Sens. 2020, 12, 282. [Google Scholar] [CrossRef]
- Stoica, I.-V.; Vîrghileanu, M.; Zamfir, D.; Mihai, B.-A.; Săvulescu, I. Comparative Assessment of the Built-Up Area Expansion Based on Corine Land Cover and Landsat Datasets: A Case Study of a Post-Socialist City. Remote Sens. 2020, 12, 2137. [Google Scholar] [CrossRef]
- Iváncsics, V.; Filepné Kovács, K. A Városi Növekedés Területhasználati És Morfológiai Aspektusai 12 Hazai Város Példáján. J. Landsc. Ecol. 2024, 22, 36–54. [Google Scholar] [CrossRef]
- Iváncsics, V. Characteristics and Explanation of New Artificial Land Uses on the Example of Hungarian Second-Tier Towns. J. Environ. Geogr. 2023, 16, 72–82. [Google Scholar] [CrossRef]
- Data Viewer—Copernicus Land Monitoring Service. Available online: https://land.copernicus.eu/en/map-viewer?product=130299ac96e54c30a12edd575eff80f7 (accessed on 27 March 2025).
- Geoshop. Available online: https://geoshop.hu/ (accessed on 27 March 2025).
- Habsburg Birodalom (1869-1887)—Harmadik Katonai Felmérés (1:25000) | Arcanum Térképek. Available online: https://maps.arcanum.com/hu/map/thirdsurvey25000/?layers=129&bbox=2114243.425053715%2C6020594.761835113%2C2128776.015056434%2C6025878.471415326 (accessed on 25 March 2025).
- Magyar Királyság (1819–1869)—Második Katonai Felmérés | Arcanum Térképek. Available online: https://maps.arcanum.com/hu/map/secondsurvey-hungary/?layers=5&bbox=2114090.5509972135%2C6021019.156812124%2C2128623.140999933%2C6026302.866392337 (accessed on 26 March 2025).
- Magyarország (1782–1785)—Első Katonai Felmérés | Arcanum Térképek. Available online: https://maps.arcanum.com/hu/map/firstsurvey-hungary/?layers=147&bbox=2114759.374994725%2C6020297.900386775%2C2129291.9649974443%2C6025581.609966988 (accessed on 27 March 2025).
- Jalas, J. Hemeroby and Hemerochore of Plant Species. A Terminological Reform Effort. Acta Soc. Fauna Flora Fenn. 1955, 72, 1. [Google Scholar]
- Alig, R.J.; Healy, R.G. Urban and Built-Up Land Area Changes in the United States: An Empirical Investigation of Determinants. Land Econ. 1987, 63, 215–226. [Google Scholar] [CrossRef]
- Güneralp, B.; Seto, K.C. Futures of Global Urban Expansion: Uncertainties and Implications for Biodiversity Conservation. Environ. Res. Lett. 2013, 8, 014025. [Google Scholar] [CrossRef]
- Couch, C.; Karecha, J.; Nuissl, H.; Rink, D. Decline and Sprawl: An Evolving Type of Urban Development—Observed in Liverpool and Leipzig. Eur. Plan. Stud. 2005, 13, 117–136. [Google Scholar] [CrossRef]
- (PDF) European Urban Sprawl: Sustainability, Cultures of (Anti)Urbanism and »Hybrid Qtyscapes«. Available online: https://www.researchgate.net/publication/272651183_European_urban_sprawl_Sustainability_cultures_of_antiurbanism_and_hybrid_qtyscapes (accessed on 13 May 2025).
- Detailed Gazetteer of Hungary. Available online: https://www.ksh.hu/apps/hntr.kereses?p_lang=EN (accessed on 31 March 2025).
- Sukopp, H. Dynamik Und Konstanz in Der Flora Der Bundesrepublik Deutschland. Schriftenreihe Vegetationskunde 10. 1976. Available online: https://www.google.com/url?sa=t&source=web&rct=j&opi=89978449&url=https://www.conchbooks.de/%3Ft%3D642%26u%3D44392%26bookgroup%3D%26subgroup%3D&ved=2ahUKEwiH7d613cKNAxWvglYBHSlxEdEQFnoECB0QAQ&usg=AOvVaw3bJK_EJKX0ArnnhrQ-dlsc (accessed on 14 May 2025).
- Machado, A. An Index of Naturalness. J. Nat. Conserv. 2004, 12, 95–110. [Google Scholar] [CrossRef]
- Rózsa, P.; Incze, J.; Balogh, S.; Novák, T.J. A Novel Approach to Quantifying the Degree of Anthropogenic Surface Transformation—The Concept of ‘Hemeromorphy’. Erdkunde 2020, 74, 45–58. [Google Scholar] [CrossRef]
- Négyesi, G. Mezővédő fásítások tér- és időbeli változásának vizsgálata a Nyírségben—A szélerózió szemszögéből. Tájökológiai Lapok 2018, 16, 113–128. [Google Scholar] [CrossRef]
- Angel, S.; Blei, A.; Parent, J.; Lamson-Hall, P.; Galarza Sanchez, N.; Civco, D.; Qian Lei, R.; Thom, K. Atlas of Urban Expansion 2016 Volume 1—Areas and Densities; NYU Urban Expansion Program at New York University: New York, NY, USA; UN-Habitat: Nairobi, Kenya; Lincoln Institute of Land Policy: Cambridge, MA, USA, 2016; ISBN 978-0-9981758-0-5. [Google Scholar]
- Kovács, Z.; Tosics, I. Urban Sprawl on the Danube. In Confronting Suburbanization; John Wiley & Sons, Ltd.: Hoboken, NJ, USA, 2014; pp. 33–64. ISBN 978-1-118-29586-1. [Google Scholar]

Disclaimer/Publisher’s Note: The statements, opinions and data contained in all publications are solely those of the individual author(s) and contributor(s) and not of MDPI and/or the editor(s). MDPI and/or the editor(s) disclaim responsibility for any injury to people or property resulting from any ideas, methods, instructions or products referred to in the content. |
© 2025 by the authors. Licensee MDPI, Basel, Switzerland. This article is an open access article distributed under the terms and conditions of the Creative Commons Attribution (CC BY) license (https://creativecommons.org/licenses/by/4.0/).