Article

Characteristics and Forecasting of Rocky Desertification Dynamics in the Pearl River Source Region from 1990 to 2030

1
College of Soil and Water Conservation, Southwest Forestry University, Kunming 650224, China
2
Key Laboratory of Ecological Environment Evolution and Pollution Control in Mountainous & Rural Areas of Yunnan Province, Kunming 650224, China
3
Zhanyi Karst Ecosystem Observation and Research Station, Qujing 655500, China
4
College of Geographical Sciences, Shanxi Normal University, Taiyuan 030031, China
*
Author to whom correspondence should be addressed.
Land 2025, 14(5), 984; https://doi.org/10.3390/land14050984
Submission received: 18 February 2025 / Revised: 27 April 2025 / Accepted: 29 April 2025 / Published: 2 May 2025
(This article belongs to the Section Land, Soil and Water)

Abstract

:
Rocky desertification is a significant ecological issue in the karst regions of Southwest China, severely affecting both the environment and local livelihoods. Accurate extraction and prediction of rocky desertification are critical for its prevention and control, playing a crucial role in advancing ecological civilization and sustainable land management. This study focuses on the Pearl River source area in Yunnan, analyzing dynamic changes in rocky desertification over eight periods from 1990 to 2023, using long-term remote sensing data and multi-source reference data. It also predicts the intensity and trends of rocky desertification for the next decade. The results indicate that: (1) Rocky desertification is widespread and severe in the study area; however, its further intensification has been effectively mitigated through long-term governance efforts. By 2023, an area of 14,896.19 km2 of rocky desertification has been mitigated to varying extents, accounting for 55.77% of the total watershed area. Trend analysis suggests that, under current management conditions, rocky desertification will continue to decline and improve over time. (2) The overall development of rocky desertification in the basin is showing a positive trend, with deep-level rocky desertification gradually transitioning to shallow-level rocky desertification. In future scenarios, the extent of rocky desertification will continue to decrease. (3) The approach of integrating the Google Earth Engine with traditional remote sensing platforms for extracting rocky desertification information has proven to be both fast and efficient. This method retains high extraction accuracy while alleviating the data burden typically associated with exclusive use of local platforms, thereby enhancing processing efficiency.

1. Introduction

Karst rocky desertification refers to the process of land degradation in fragile subtropical karst environments, where unsustainable human socio-economic activities lead to severe soil erosion, large-scale bed rock exposure, a sharp decline in land productivity, and the formation of desert-like landscapes [1]. Intensive agricultural practices, driven by heavy population pressure, have made the southwestern karst region one of China’s primary ecologically vulnerable areas for rocky desertification [2]. Although significant progress has been made in controlling rocky desertification in Southwest China, global warming and increasingly frequent flooding pose risks of re-desertification and further expansion of desertified areas [3]. Moreover, rocky desertification is closely linked to regional ecological security, agricultural productivity, biodiversity conservation, and sustainable economic and social development. Its management and restoration are crucial for enhancing local living conditions and fostering regional ecological balance [4].
Remote sensing, a rapidly advancing technology of the 21st century, has been widely applied in studying rocky desertification [5,6]. Traditional remote sensing techniques have made significant strides in extracting rocky desertification information; however, they face challenges in improving extraction accuracy and efficiency due to factors such as large volumes of long-term data, insufficient imagery in specific years [7], and significant seasonal land cover changes [8,9,10]. The localized nature of small-scale research areas in previous studies has further limited the generalizability of extraction and analysis methods. As a result, numerous scholars have sought to overcome the limitations of traditional methods by conducting extensive research on accurate extraction, classification of rocky desertification data [11], monitoring karst desertification [4,12], and predicting its spatial distribution [13]. Nonetheless, traditional methods remain restricted by small study areas and the heavy workload of processing long-term local data, limiting both their accuracy and broader applicability [14,15]. The advent of the Google Earth Engine (GEE) cloud platform has partially transformed traditional remote sensing data processing, offering massive remote sensing datasets, vast cloud storage, powerful cloud computing capabilities, and an interactive development environment. It offers massive remote sensing datasets, vast cloud storage capacity, powerful cloud computing capabilities, and an interactive development environment, opening up new avenues for large-scale, high-spatial and temporal-resolution remote sensing research [16,17].
Accordingly, this study focuses on the Pearl River source area, a critical ecological security barrier in China. Using Landsat series remote sensing images via the Google Earth Engine (GEE) platform [18] and applying models like CA-Markov and SEN-MK trend tests [7,19], we analyzed rocky desertification distribution and intensity characteristics in the region from 1990 to 2030, along with future intensity changes under natural conditions. This study seeks to solve the following key issues: (1) To develop faster and more efficient rocky desertification inversion techniques, exploring large-scale, long-term information extraction methods while reducing inversion costs and maintaining basic accuracy; (2) To analyze the evolution process of rocky desertification over the past 30 years in the Pearl River source watershed, a typical rocky desertification area, and reveal the evolution rate and characteristics under continuous control efforts; (3) To apply models like CA-Markov and SEN-MK trend tests to predict future rocky desertification intensity under natural conditions, simulating and revealing its future development trends.

2. Study Area Overview and Data Sources

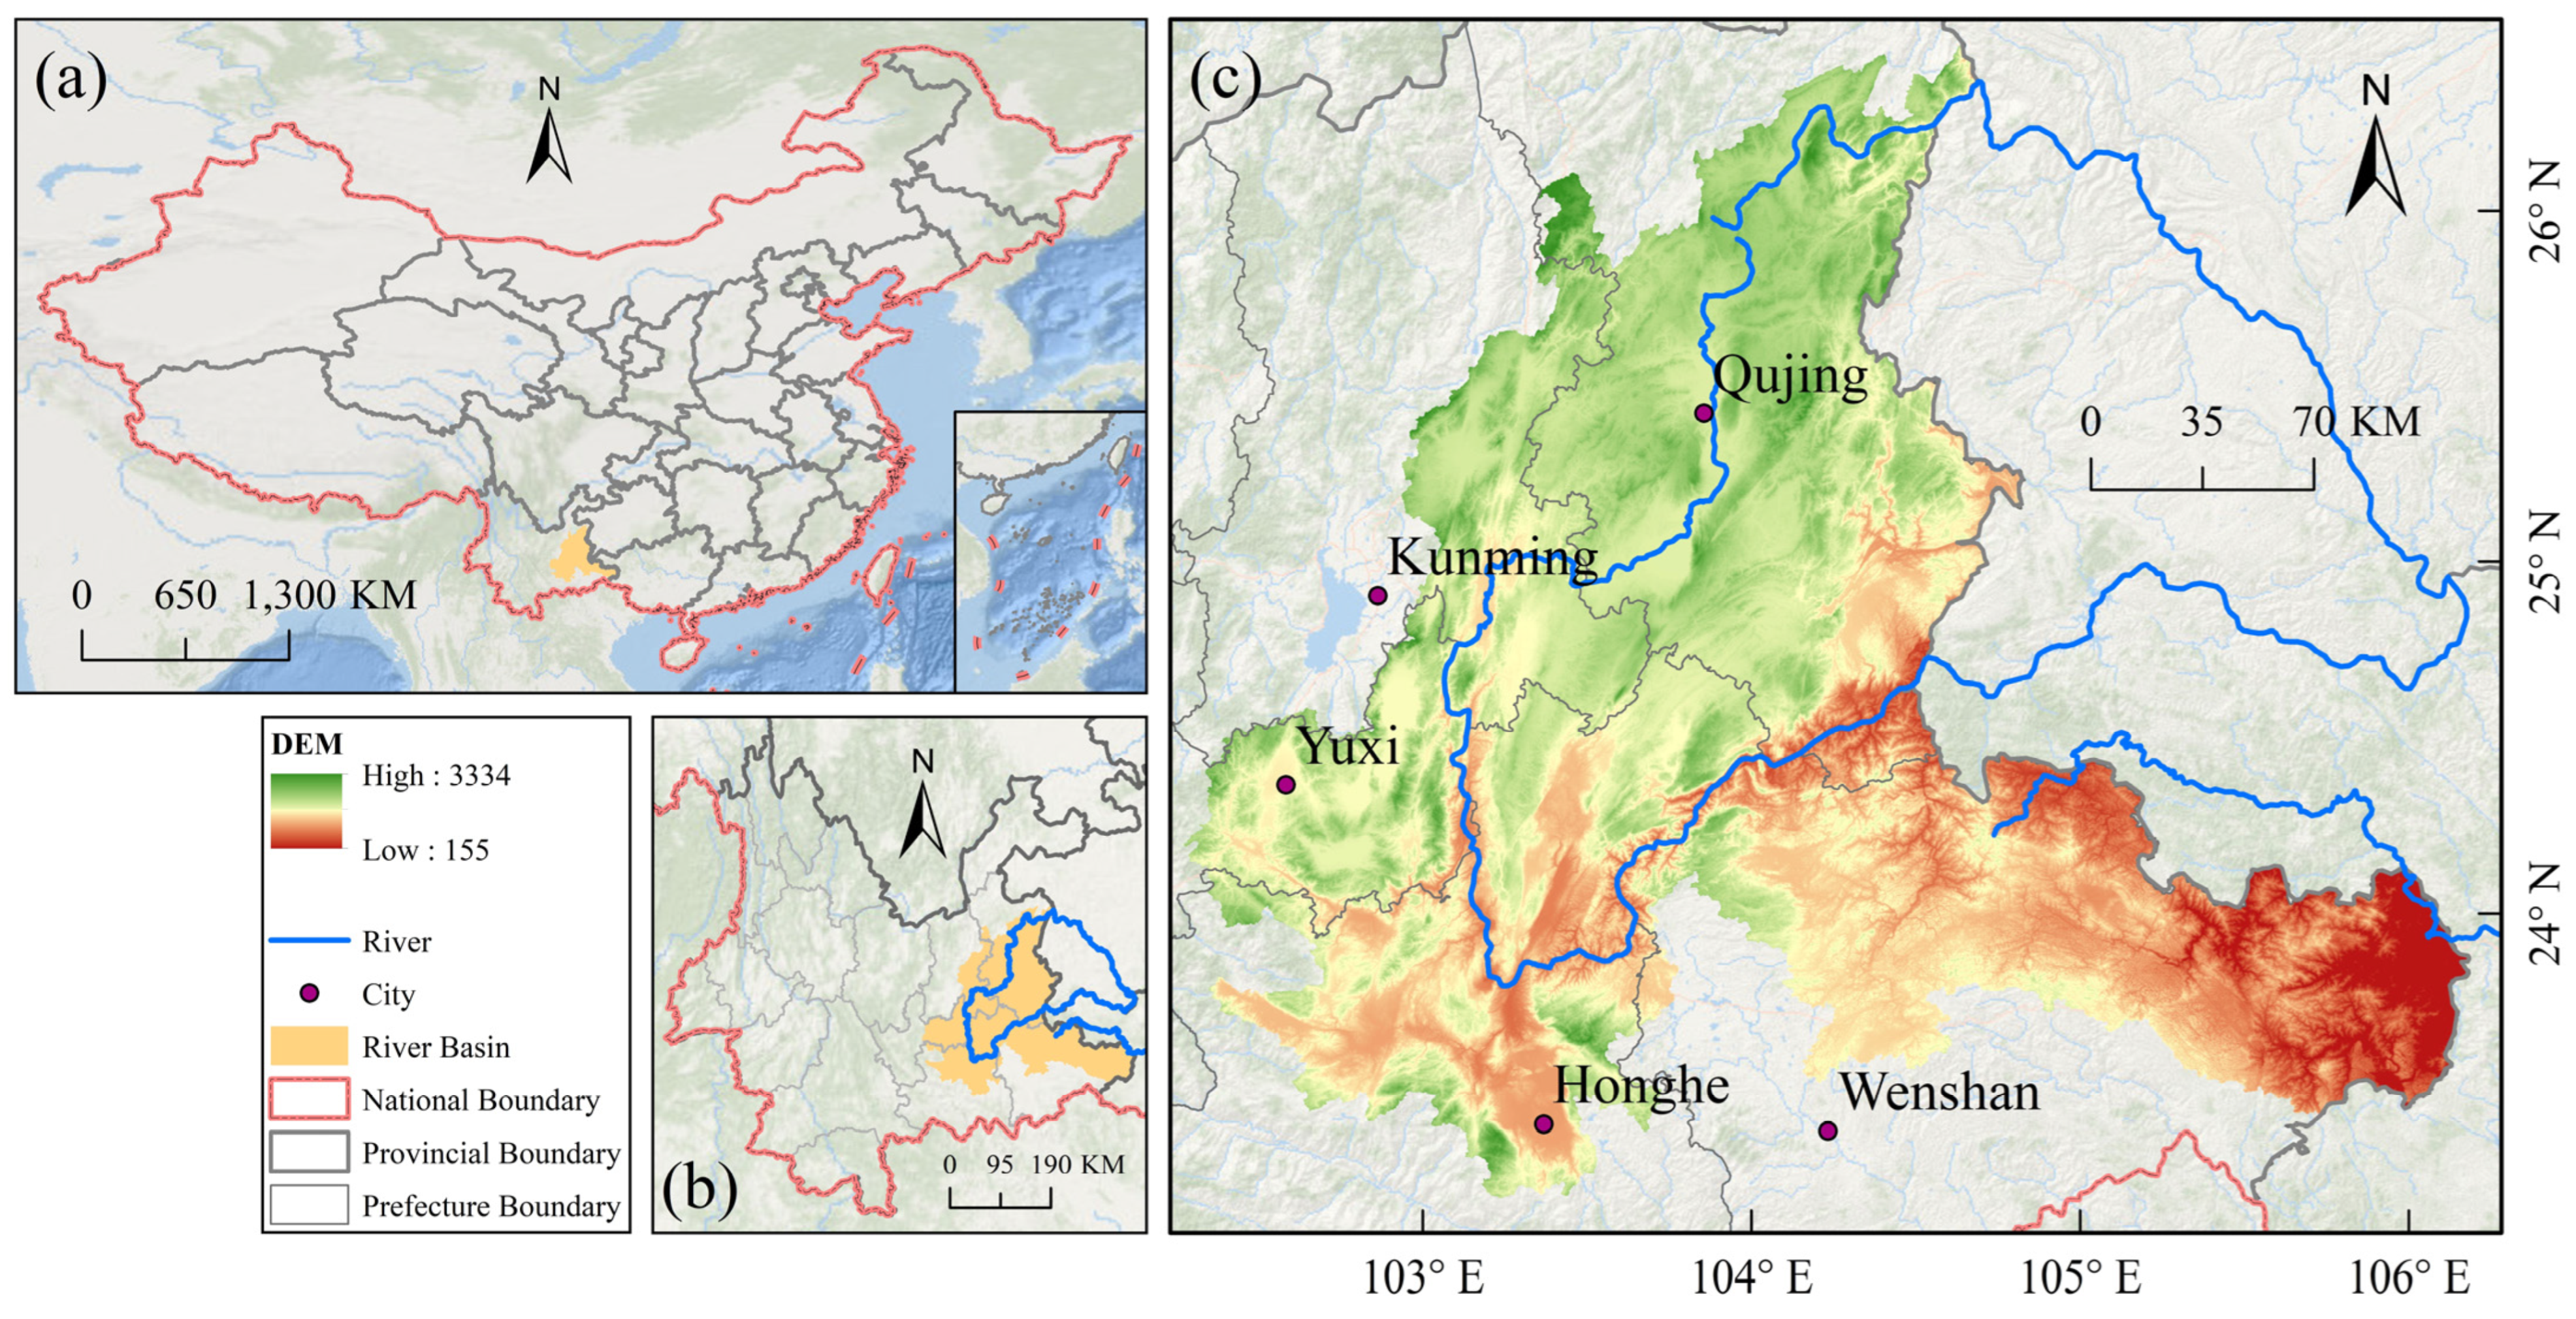
2.1. Study Area Overview

The Pearl River source watershed is located in the central-eastern region of Yunnan Province (103.75–104.383°E, 25.5–26.433°N), with its source in Zhanyi District, Qujing City, Yunnan Province (Figure 1). The Pearl River source watershed in Yunnan Province encompasses three subregions: Beipan River, Nanpan River, and Yujiang River, with rivers in these areas belonging to the Xijiang River system of the Pearl River Basin. The Beipan and Nanpan River basins are primarily situated within Qujing City, while the Yujiang River basin is mainly located in Wenshan Zhuang Autonomous Prefecture. The total watershed area is 61,143.5 km2, with 76.98% covered by karst landscapes. The Pearl River source watershed features a variety of landforms, including karst peak clusters, basins, mountains, and sinkholes. The terrain is highly variable, with elevations generally higher in the northwest and lower in the southeast. The highest point reaches 3358 m, and the lowest is 160 m. The Pearl River source watershed is influenced by the Southwest Monsoon and falls within a subtropical mountain monsoon climate, with distinct four seasons and alternating wet and dry periods. The average annual precipitation ranges from 900 to 1200 mm. Karst processes are intense, and vegetation types vary significantly with changes in soil and altitude, with carbonate rocks widely distributed. This unique natural and climatic context has led to severe soil erosion, making the region highly susceptible to widespread and deep rocky desertification.

2.2. Data Sources

Based on the characteristics and hydrological features of the Pearl River source watershed, this study used the Google Earth Engine (GEE) platform to access long time-series Landsat imagery released by the United States Geological Survey (USGS) (https://landsatlook.usgs.gov/, accessed on 2 February 2024). Given the extensive study area and the substantial seasonal variation in factors such as vegetation cover, along with cloud interference, cloud masking was applied to the time-series remote sensing images on the platform. An annual maximum value composite was also performed to mitigate errors from seasonal vegetation changes. Digital elevation data from ASTER GDEM at 30-m resolution were acquired through the geospatial data cloud platform (https://www.gscloud.cn/, accessed on 3 February 2024), while soil type data from the HWSD, Wuhan University’s CLCD China Land Cover dataset at 30-m resolution (1985–2023) [20], ADDIN China’s multi-year three-level administrative boundary data (https://www.resdc.cn/, accessed on 3 February 2024), Yunnan’s engineering geological maps, and 2015 Eco-Environmental Issues Data of China [21] were collected.
The 2023 administrative division data of cities above the prefecture level in some parts of the country were used for mosaic and other preprocessing of the original ASTER GDEM 30-m resolution DEM data for the study area and its surrounding regions [22]. Considering that some rivers and tributaries in the study area cross neighboring provinces, extracting the river network and watershed range solely within Yunnan Province may result in incomplete extraction, failing to fully reflect the watershed distribution. Therefore, the selected data covered various prefectures in Yunnan Province, as well as adjacent regions such as Liupanshui City in Guizhou Province and Baise City in Guangxi Zhuang Autonomous Region. Based on the above data, hydrological analysis operations such as sink filling, flow direction analysis, and basin extraction were performed on the preprocessed DEM data using the ArcGIS 10.8 platform to obtain watershed distribution within the data range. The watershed data from the previous step were masked with administrative boundary data for Yunnan Province. Combined with river system data, this yielded the distribution of the Pearl River source watershed, encompassing the sub-basin distributions of the Nanpan, Beipan, and Youjiang rivers. Influencing factors like slope were standardized to support subsequent rocky desertification information inversion and extraction.

3. Research Methodology

3.1. Rocky Desertification Indicators

3.1.1. Fractional Vegetation Cover (FVC)

Fractional Vegetation Cover (FVC) is a critical evaluation metric in the ecological restoration and land governance of rocky desertification regions. Remote sensing inversion techniques can provide an accurate evaluation of the proportion of the area covered by vegetation relative to the total surface area in the area [23,24]. Therefore, this study selected the Normalized Difference Vegetation Index (NDVI) to measure Fractional Vegetation Cover in the study area and, leveraging the powerful capabilities of the Google Earth Engine (GEE) platform, calculated the NDVI values for the study area from 1990 to 2023. The calculation formula used in this study is as follows:
NDVI = NIR     RED   NIR + RED
Based on the NDVI obtained from the above equation, Fractional Vegetation Cover (FVC) is calculated using the pixel binary principle:
FVC = NDVI     NDVI min   NDVI max   -   NDVI min
In the calculated NDVI values, the value at a frequency of 95% is designated as NDVIveg, representing pixels that are completely covered by vegetation, while the value at a cumulative frequency of 5% is designated as NDVIsoil, representing pixels that have no vegetation cover [25] (Figure 2).

3.1.2. Rock Exposure Rate (RER)

The extent of the Rock Exposure Rate is an important indicator for assessing the intensity of rocky desertification. The Rock Exposure Rate (RER) is established based on the SWIR2 (shortwave infrared 2) and NIR (near-infrared) bands in remote sensing imagery products. The SWIR2 band is highly sensitive to surface Rock Exposure Rate, and in combination with the NIR band, it can construct a Normalized Difference Rock Index (NDRI) to effectively capture the surface Rock Exposure Rate [24,25,26]. According to this method, the NDRI values in the study area from 1990 to 2023 were computed. The formula is as follows:
NDRI = SWIR 2 NIR   SWIR 2 + NIR
Based on the NDRI obtained from the above formula, and by analogy with the calculation method of Fractional Vegetation Cover (FVC), the Rock Exposure Rate (RER) is derived:
RER = NDRI     NDRI min   NDRI max     NDRI min
In the calculated NDRI values, the value at the 95th percentile is taken as NDRImax, representing pixels where rock is fully exposed, while the value at the 5th percentile is taken as NDRImin, representing pixels where the bedrock is completely unexposed [25] (Figure 3).

3.2. Classification and Interpretation of Rocky Desertification

3.2.1. Classification Standards for Rocky Desertification

Considering the complex geographical environment of the Pearl River source region, and based on previous research results on the classification standards of rocky desertification [27,28], three factors—Rock Exposure Rate, Fractional Vegetation Cover, and slope—were selected as grading indicators [29]. We classify the degree of rocky desertification in the study area into the following six levels (Table 1).

3.2.2. Mapping of Rocky Desertification

The geographical detector is an analytical method widely applied in the study of spatial heterogeneity, capable of effectively quantifying the explanatory power of independent variables on the spatial distribution of a dependent variable [30]. Under the assumption of spatial consistency, the explanatory power of an independent variable for the spatial variation of a dependent variable can be calculated by collecting paired data from sample points. The calculation is expressed by the following formula:
Q x , y = 1 i 1 h N i N δ 2 δ i 2
To obtain the contribution rates, sampling points were uniformly distributed at 1-km intervals within areas where rocky desertification had already occurred, as identified in the 2015 China Ecological Problem Dataset [21]. The values of each factor were derived from Landsat remote sensing imagery and ASTER GDEM data. The results indicate that, among the three selected factors, Fractional Vegetation Cover (FVC) and Rock Exposed Rate (RER) are the dominant drivers of the spatial distribution of rocky desertification. The corresponding contribution rates are as follows: FVC (46%), RER (42%), and slope (12%).
Based on the factor weights derived from the geographic detector analysis during the rocky desertification information extraction process, annual overlay analyses of Fractional Vegetation Cover, Rock Exposure rate, and slope data were conducted for each year within the study period using the Raster Calculator tool in ArcGIS 10.8 [6,23]. Referring to the Engineering Geological Map of Yunnan Province and the 30-m Resolution Land Cover Dataset of China (1985–2023) provided by Wuhan University [20], non-karst areas, urban land, and water bodies—regions where rocky desertification does not occur—were excluded. A mask was created for clipping and integrating the factor layers, resulting in eight phases of spatial distribution maps of rocky desertification from 1990 to 2023 (Figure 4).
To validate the inversion results, within the study area on the ArcGIS 10.8 platform, non-karst areas and regions unlikely to experience rocky desertification were excluded, and 300 random sample points were generated using the random point tool. The inversion results were extracted to these points for validating the accuracy of rocky desertification remote sensing identification [31].The point data were imported into Google Earth, where historical imagery was used for visual interpretation. The results showed that the overall accuracy of rocky desertification remote sensing identification in 2020 was 74%, and the Kappa coefficients for the period from 1990 to 2023 all exceeded 0.72, with an overall accuracy of 70.81%. This rocky desertification inversion method exhibits high accuracy and reliability, and holds value for further enhancement and wider application.

3.3. Transfer and Transformation of Rocky Desertification

3.3.1. Transfer Matrix

During a specific time frame, the evolution direction and scale of rocky desertification tend to be complex and are greatly affected by geographic factors. To accurately depict its evolutionary trends, quantitative analysis is needed to construct a transition change matrix [32].
  S m , n = [ S 1 , 1 S 1 , 2 S 2 , 1 S 2 , 2 S 1 , k S 2 , k S k , 1 S k , 2 S k , k ]
In the above formula, the symbol S represents the area, measured in km2, while m and n denote the levels of rocky desertification at the beginning and end of a given period. Additionally, the symbol Sm,n represents the transfer area of rocky desertification during that period, also measured in km2.

3.3.2. Rate of Rocky Desertification Transformation

Analyzing only the transfer direction and area of rocky desertification does not provide a comprehensive understanding of its development. In-depth research on the evolution rate of rocky desertification is crucial. The evolution rate of rocky desertification reflects the changing development patterns of specific types of rocky desertification in that area and is critical for scientifically evaluating its evolution [33].Establishing appropriate models to explore the evolution rate of rocky desertification will help guide rocky desertification management efforts more effectively and provide scientific basis for relevant decision-making.
P i = S 2 S 1 T
In this formula, the symbol Pi indicates the evolution rate of a specific type of rocky desertification, with units in km2/a; S1 refers to the area at the beginning, and S2 refers to the area at the end of a certain time period, both also measured in km2; T indicates the length of that time period, measured in years.

3.4. Development Trends and Predictions of Rocky Desertification

3.4.1. Sen-MK Trend Analysis

The Sen-MK trend test is a non-parametric statistical method, typically employed to analyze trend changes within time series data [34]. This method assesses the presence of trend changes in the data by comparing the rank relationships of individual data points in the time series. Compared to traditional parametric statistical methods, the Sen-MK test does not rely on distributional assumptions of the data and is suitable for various types of time series data. The formulas for this method are presented below:
β = medium ( X j X i j i ) , j > i
In this context, Xj and Xi refer to the time series data, with β > 0 indicating an upward trend in the time series and β < 0 indicating a downward trend.
S = j = 2 n   i = 1 j 1 sgn ( X j X i )
Here, sgn (Xj−Xi) is the sign function, where sgn = 1 if Xj−Xi > 0, sgn = 0 if Xj − Xi = 0, and sgn = −1 if Xj−Xi < 0.S is the statistic used to determine the significance of the trend in the sequence.
Z = S     1 n ( n 1 ) ( 2 n + 5 ) 18
Here, S is the statistic calculated above, and n is the number of observations. At a given significance level, the trend’s significance can be determined by comparing with the critical values of the standard normal distribution. The research will input the collected data on rocky desertification distribution across 34 periods from 1990 to 2023 into the Sen + MK trend test program within the Python 3.11 environment for execution, and will overlay and reclassify the resulting images using the ArcGIS 10.8 platform.

3.4.2. CA-Markov Forecast

The Markov prediction method is a forecasting technique based on the theory of stochastic processes. The core of this method is the assumption that the state of a system at any given moment depends solely on its state at the previous moment and is independent of earlier historical states [35]; this property is known as “memorylessness” or the “Markov property”. The CA-Markov model treats each grid cell as an independent unit in the spatial distribution of rocky desertification, with the degree of desertification of each unit serving as its state. This model employs Markov chain theory to describe the transitions between different states of desertification, where the area or proportion of transitions between different types of desertification is defined as the transition probability. This model employs Markov chain theory to describe the transitions between different states of desertification, where the area or proportion of transitions between different types of desertification is defined as the transition probability [36].
S   ( T ) = S m , n   *   S   ( T 0 )
In this equation, S (T) and S (T0) denote the state of the desertification pattern at time T and the initial time T0, respectively, with Sm,n representing the Markov transition matrix.
Within the IDRISI 17 platform, standardized rocky desertification data for the years 2000 and 2010 were entered to compute the land use transition matrix, which identifies the transition probabilities between various land use types. Based on the 2010 rocky desertification data and the transition matrix calculated in the previous step, the land use scenario for 2020 was projected and compared with the actual land use data for 2020. An overall accuracy of 0.829 was achieved, suggesting that the model validation was successful and that the transition matrix and model parameters are valid. Subsequently, the transition matrix from 2010 to 2020 was employed to estimate the land use scenario for 2030 using the land use data from 2020 as a foundation.

4. Results and Analysis

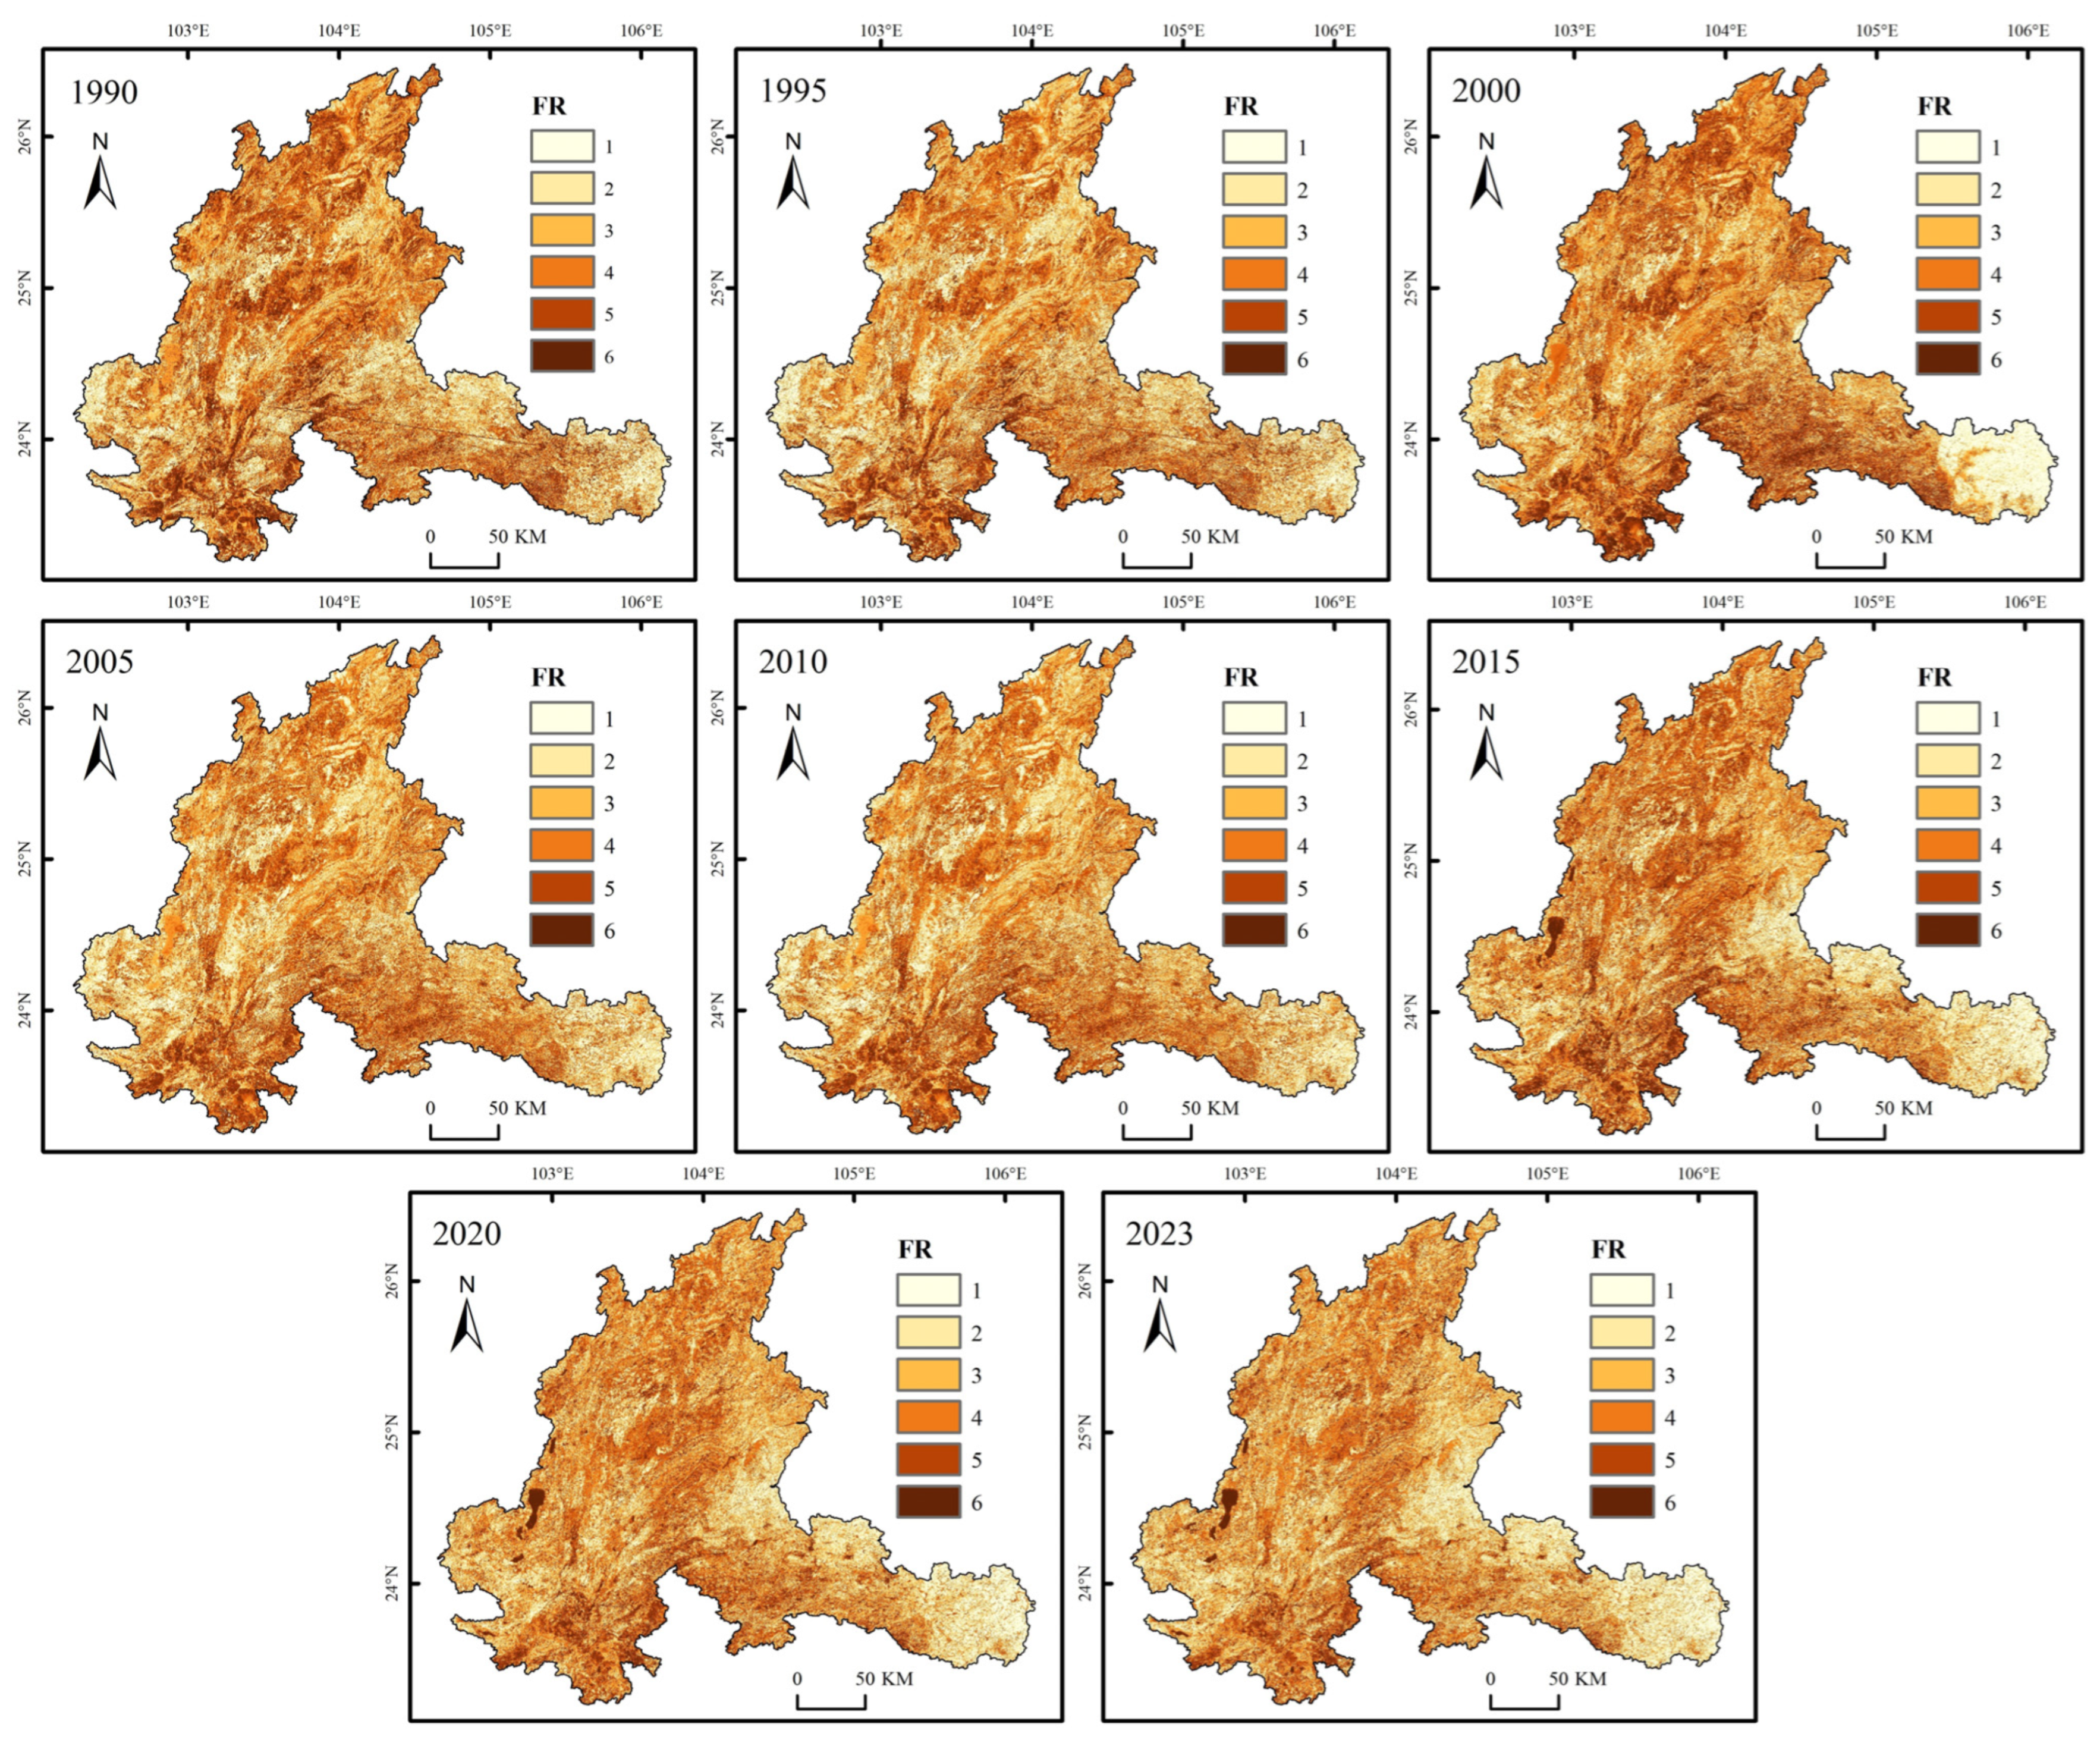
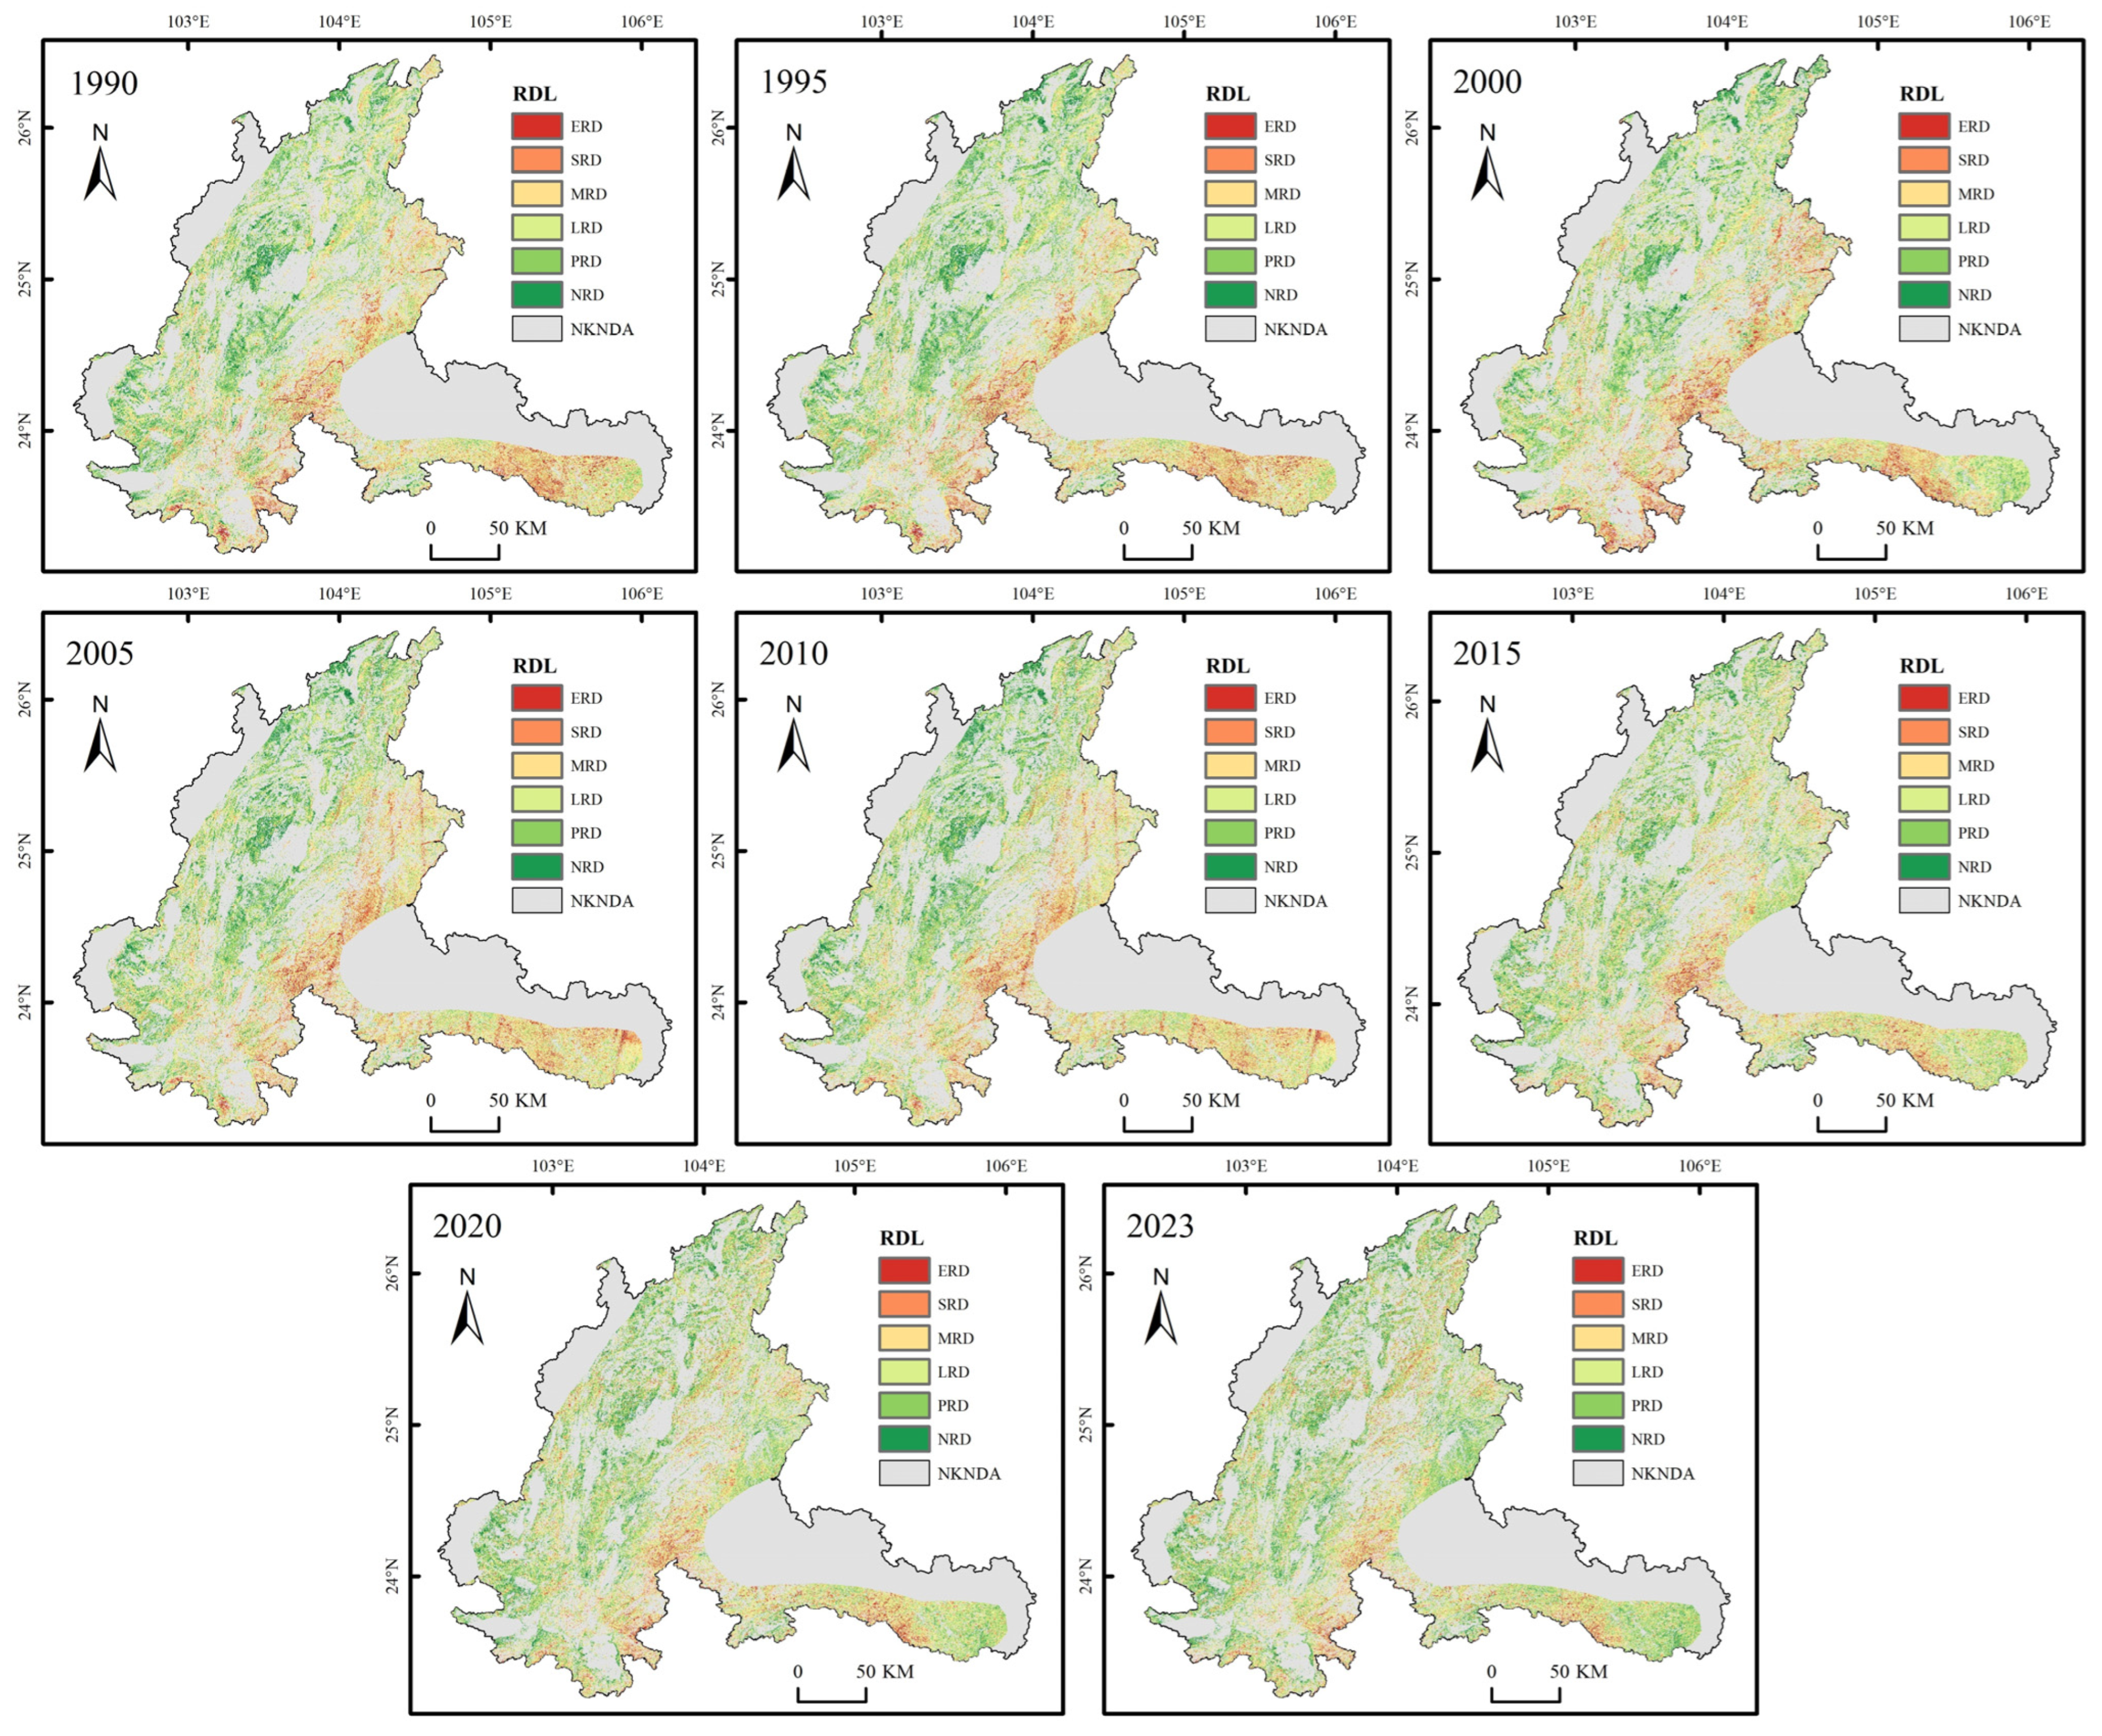
4.1. Spatiotemporal Distribution Characteristics of Rocky Desertification from 1990 to 2023

4.1.1. Overall Characteristics of Rocky Desertification

According to the classification of rocky desertification levels in the Pearl River source region from 1990 to 2023, the rocky desertification area for the years 1990 to 2020 (in five-year intervals) and for 2023 was tabulated, along with the percentage of each desertification level’s area for each year (Figure 5, Table 2). Over the past thirty years, the rocky desertification in the Pearl River source area has primarily been characterized by potential and light desertification. Specifically, the area of significant desertification (including light, moderate, severe, and extreme desertification) has decreased by a total of 2232.13 km2, representing a reduction of 8.65%. This demonstrates that the Pearl River source area has achieved significant results in rocky desertification prevention and control, effectively managing and improving the desertification situation. During the period from 1990 to 2023, rocky desertification in the Pearl River source area has shown a steady trend of improvement. Based on the classification of desertification levels, the area of light desertification has consistently accounted for around 10% throughout the study period; the area of moderate desertification has fluctuated between 5.73% and 7.98%; while the areas of severe and extreme desertification have remained below 4.1%, suggesting that the desertification phenomena in the study area are mainly concentrated at light and moderate levels. Throughout the more than thirty-year time series, the area of mild desertification has demonstrated a relatively stable trend. As a transitional category between non-significant and significant desertification, both the inflow and outflow of light desertification areas have been relatively high, resulting in a stable proportion. Regarding the moderate desertification areas, their extent has shown a notable decreasing trend, dropping from 4438.45 km2 in 1990 to 3501.57 km2 in 2023. The area of severe and extreme desertification has undergone a process of initial increase, followed by decrease, and then another increase, reaching a peak in 2010 before rapidly declining, reflecting a gradual improvement in deeper levels of desertification in the study area.

4.1.2. Results of the Transition Matrix

By establishing seven transition matrices from 1990 to 2023 in five-year intervals and mapping them, it can be seen that: (1) Between 1990 and 1995, the most significant transition was from moderate rocky desertification to light rocky desertification, covering an area of 1465.09 square kilometers; the second most significant was the transition from potential rocky desertification to light rocky desertification, covering 1362.86 square kilometers; overall, there was a positive trend in rocky desertification. (2) From 1995 to 2000, the transition from potential rocky desertification to no rocky desertification was the most significant, covering an area of 1807.89 square kilometers; the transition from light rocky desertification to potential rocky desertification was second, covering 1702.03 square kilometers; areas transitioning from other levels to lower levels also increased, reflecting the phased success of rocky desertification management efforts. (3) Between 2000 and 2005, there was a significant increase in the area transitioning from insignificant rocky desertification to significant rocky desertification, while there was also a moderate transition from light and higher levels of rocky desertification to no rocky desertification; rocky desertification management efforts aimed at restoring and improving deep-seated rocky desertification but overlooked areas with no significant rocky desertification, causing some of these areas to transition to significant rocky desertification. (4) From 2005 to 2010, potential, light, moderate, and severe rocky desertification all transitioned to no rocky desertification, with a total increase of 955.05 square kilometers; by 2010, the area of no rocky desertification in the Pearl River source area reached 46,789.89 square kilometers. (5) Between 2010 and 2015, the most significant transition was from moderate rocky desertification to light rocky desertification, covering an area of 1514.83 square kilometers; the area transitioning from potential rocky desertification to light rocky desertification was 1998.49 square kilometers, indicating significant degradation of potential rocky desertification areas into light rocky desertification during this period; although the transition from moderate to light indicates a reduction in degradation, the large area transitioning from potential to light still carries a risk of worsening rocky desertification. (6) From 2015 to 2020, the area transitioning from potential rocky desertification to no rocky desertification was 1644.29 square kilometers; the area transitioning from light rocky desertification to potential rocky desertification was 2276.03 square kilometers; and the area transitioning from moderate rocky desertification to light rocky desertification was 1650.51 square kilometers, with these three transitions being the most significant overall, indicating continued improvement across all levels of rocky desertification. (7) From 2020 to 2023, there has been a rising trend of transition from shallow to deep rocky desertification, specifically reflected in the increased area transitioning from no rocky desertification to potential rocky desertification, from potential rocky desertification to light rocky desertification, and from light rocky desertification to moderate rocky desertification; the increase in abandoned farmland in the Pearl River source area may be one of the reasons for the rising rocky desertification issues (Figure 6).

4.1.3. Rock Desertification Transfer Rate

Using the Raster Calculator in ArcGIS, the rock desertification transfer rate change map of the Pearl River source area was obtained. Between 1990 and 1995, the change rate of rock desertification area was the lowest, at 36.83 km2/a, showing an increasing trend; From 2015 to 2020, the change rate of rock desertification was the highest, at −232.24 km2/a, reflecting a gradual reduction and improvement in rock desertification during the management efforts. Between 2010 and 2020, the change rate of rock desertification displayed a continuous downward trend, with an average change rate of −183.24 km2/a. In all periods, moderate and higher rock desertification showed an overall improvement trend, while below moderate rock desertification exhibited erratic characteristics. Especially for potential rock desertification, the improvement rate is very low, while the deterioration rate is quite rapid, indicating a need for enhanced monitoring and protection of levels below moderate desertification.

4.2. Spatiotemporal Distribution Features of Rock Desertification

The results of the Sen-MK trend test indicate that the area with a significant decreasing trend in rock desertification is 3219.97 km2, accounting for 12.49% of the desertification area; the area with an insignificant decreasing trend is 11,676.22 km2, making up 45.28% of the region; the area with no significant change trend is 118.08 km2, representing a very low proportion of only 0.46%; for the area with an insignificant increasing trend, the area is 9385.91 km2, which accounts for 36.40%; the area with a significant increasing trend in rock desertification is 1388.74 km2, accounting for 5.39%. Overall, the trend of rock desertification in the study area shows a positive trend, with the area showing a decreasing trend accounting for about 57.76% of the total area of desertification distribution, the area with no significant change accounting for approximately 0.46%, and the area showing an increasing trend accounting for 41.78%. This, to some extent, confirms the overall positive trend of rock desertification in the Pearl River source region under the continued promotion of prevention and control efforts (Figure 7a).
Based on the CA-Markov model prediction results, it is observed that, by 2030, the areas of non-desertification and potential desertification will show slight increases, reaching 5973.48 km2 and 8990.81 km2, respectively. Together, these areas represent an overall increase of 56.06 km2 compared to 2023. Additionally, deep desertification continues to transition towards shallow desertification, while the areas of extreme and severe desertification continue to decline (Figure 7b).

5. Discussion

5.1. Desertification Spatial–Temporal Distribution and Its Evolutionary Characteristics

This study uses long-term Landsat imagery to extract desertification information, revealing the widespread occurrence of desertification in the Pearl River source basin and the effectiveness of management efforts, which indicate a positive trend in desertification improvement following years of management. Abandoned farmland in varying degrees is a notable phenomenon in the study area, leading to severe soil erosion, frequent landslides, and debris flows, thereby exacerbating desertification [9]. As shown in Figure 4, desertification is widespread across most parts of the study area, particularly in Qujing City and Wenshan Zhuang Autonomous Prefecture. The areas with significant desertification have steep slopes, sparse Fractional Vegetation Cover, severe soil erosion, frequent landslide events, and unsustainable farming activities that severely damage the regional vegetation ecosystem [15,37]. The areas transitioning toward mild desertification are predominantly located in the central region of the study area. These areas have less or sparse distribution of carbonate rocks, and the relatively higher vegetation coverage effectively reduces the intensity of soil erosion, which is not conducive to the formation of desertification [38]. The findings of this study generally align with previous research. Against the backdrop of continuous management over the years, the evolutionary characteristics within the study area are similar to the research results on desertification in the typical karst areas of Southwest China [23], both showing a positive shift towards mild and non-desertification directions under management measures.

5.2. Discussion of the Accuracy of Desertification Prediction Results

This study leverages the Google Earth Engine (GEE) platform, which is capable of processing large-scale and long-term remote sensing data in conjunction with traditional remote sensing and Geographic Information System (GIS) technologies, thereby enhancing data processing efficiency and accuracy. Compared to traditional local processing methods, the cloud computing capability of the GEE platform significantly reduces the challenges posed by large data volumes, ensuring high extraction precision [16]. The study validates the method for extracting and inverting vegetation degradation based on the GEE platform, confirming the effectiveness of the research method and the accuracy of the predictive results. The Cellular Automata (CA)-Markov model and the Sen’s Slope (Sen + MK) trend test method both indicate that the phenomenon of desertification is expected to continue to decrease in the future, which is consistent with previous research findings [36]. The predictive results of the models provide a scientific basis for desertification management, pointing out the possible changes in the intensity of desertification in the future. The study improves the monitoring of karst desertification through high-frequency Landsat observations [4] and analyzes the spatiotemporal evolution of desertification and soil erosion in the southwestern karst region [7], as well as their driving factors. The conclusions of both support the predictive results of this study to a certain extent. Compared with previous studies [14], this study further integrates GIS technology based on the GEE platform for more detailed spatial analysis and future scenario prediction. In analyzing the spatiotemporal evolution and development trends of desertification and soil erosion, the study employs a more systematic Sen + MK trend test and CA-Markov model. Although previous studies also focused on these factors [35], this study, by combining the GEE platform, is able to handle larger datasets, thus providing a more comprehensive and in-depth analysis.

5.3. Limitations and Future Prospects

The study area is located in the karst mountainous region of Southwest China, where land degradation is most severe. The uneven terrain and complex topographic conditions increase the difficulty of accurately extracting karst desertification information [39,40]. Currently, there are three main challenges in extracting desertification information: First, due to the very similar spectral characteristics of soil and rock, it is easy to confuse rock and soil on remote sensing images. The presence of soil directly affects the accuracy of desertification information extraction. Additionally, due to significant topographical changes, there are some backlit areas that are also affected by the reflected radiation from adjacent objects, resulting in a certain number of shadow areas in the satellite images. These shadows may also lead to uncertainties in the estimation of desertification [41]. Remote sensing information inversion based on the Google Earth Engine platform is widely used in various fields, but due to differences in computational methods, data sources, and spatial resolution, the inversion results may also vary [16,42]. This study has not yet fully incorporated the influence of climate drivers and extreme weather events in karst regions, nor has it thoroughly examined the geomorphological and lithological characteristics of typical rocky desertification areas, which may result in deviations between the estimated and actual soil erosion [43]. Incorporating relevant climatic variables in future research would help improve estimation accuracy and enhance understanding of the underlying mechanisms. Despite these limitations, this study combines field research and long-term monitoring to strengthen the analysis of their interactions, in order to enhance the precision of research and management effects. It emphasizes the surveillance and protection of desertification below the mild level to prevent a situation of “degrading while managing”. Through continuous monitoring and scientific management, it is anticipated that further improvements can be achieved in addressing the desertification issues in the Pearl River source basin. The research still holds significant reference value for revealing the spatiotemporal change trends and spatial distribution of desertification within the study area.

6. Conclusions

This study, based on 34 years of remote sensing data and utilizing the Google Earth Engine (GEE) platform, conducted a comprehensive analysis of the spatial distribution characteristics and temporal patterns of rocky desertification in the Pearl River source basin.
(1)
Over three decades, rocky desertification in the Pearl River source basin of Yunnan Province was found to be distributed to varying extents across the study area, with significant desertification primarily occurring in Qujing City and Wenshan Zhuang Autonomous Prefecture. The area of mildly desertified regions remained relatively stable, while the areas with moderate and severe desertification showed a significant decreasing trend, with the transition from moderate to mild desertification being the most pronounced. The total desertified area within the study area decreased from 14,272.65 km2 in 1990 to 12,040.52 km2 in 2023, a reduction of 2232.13 km2, indicating a significant decline in the total area affected by desertification.
(2)
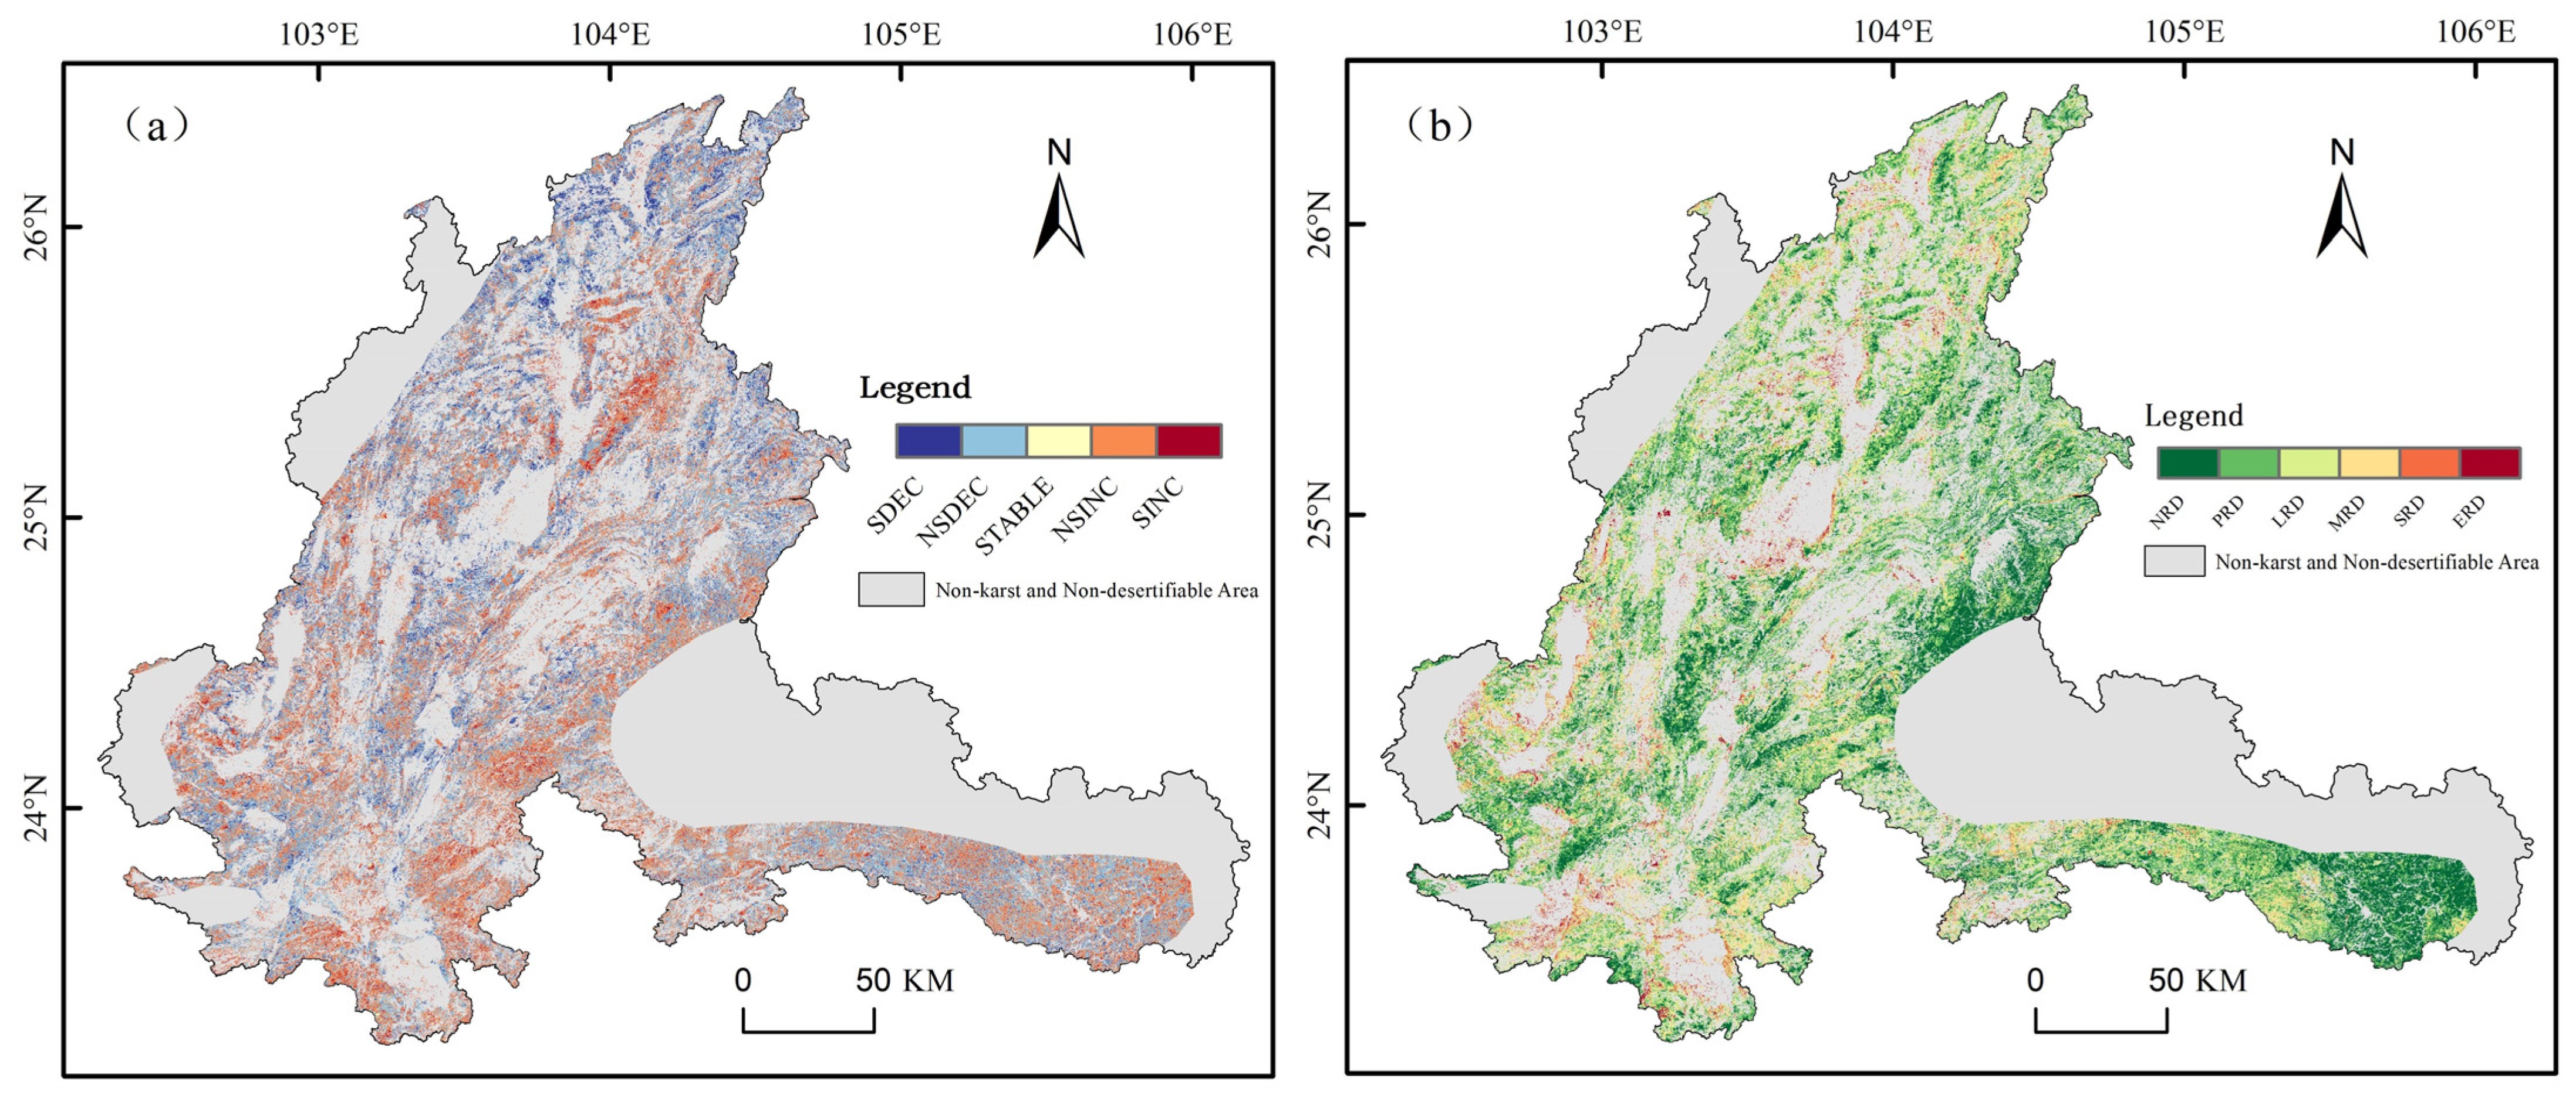
Using the Sen + MK trend test and the CA-Markov model, predictions were made regarding the future development of rocky desertification in the Pearl River source basin. The forecast suggests that, if current management efforts are maintained, the area affected by desertification will continue to decrease by 2030, with a slight increase in the area of non-desertified and potentially desertified land, and a continued trend of deep-level desertification transitioning to shallow-level desertification.
(3)
The study confirmed the effectiveness of the method combining the Google Earth Engine platform with traditional remote sensing and Geographic Information System (GIS) technologies for extracting and analyzing desertification information. This approach enhanced data processing efficiency, reduced the challenges associated with handling large volumes of data, and ensured the reliability of extraction accuracy. The accuracy of the study’s results was corroborated by previous literature, indicating that this method holds promising application prospects and significant potential for future research in the field of desertification. However, the uncertainty of the predictive models and regional differences remain areas for further investigation in future studies, to improve the precision and applicability of the predictions. This study provides a scientific foundation and technical support for desertification prevention and ecological restoration efforts in the Pearl River source basin and similar regions, offering new insights into the efficient extraction of desertification data.

Author Contributions

S.Z. constructed and conceived the project. H.S. and S.Z. designed the research. H.S., S.Z. and S.H. performed the research. H.S. and Z.L. analyzed the data. H.S. and S.Z. wrote the paper. All authors have read and agreed to the published version of the manuscript.

Funding

This research was supported by The Open Fund of Yunnan First-Class Discipline in Soil and Water Conservation and Desertification Control (SBK20240008), Yunnan Fundamental Research Projects Special Fund (202401CF070079) and the Innovation and Entrepreneurship Training Program for Undergraduates of Yunnan Province (S202410677042).

Data Availability Statement

Data are available upon request from the corresponding author.

Acknowledgments

We wish to thank the editor of this journal and the anonymous reviewers during the revision process.

Conflicts of Interest

The authors declare no conflicts of interest.

References

  1. Wang, S.J. Concept deduction and its connotation of karst rocky desertification. Carsologica Sin. 2002, 21, 101–105. [Google Scholar]
  2. Wang, K.L.; Zhang, C.H.; Chen, H.S.; Yue, Y.M.; Zhang, W.; Zhang, M.Y.; Qi, X.K.; Fu, Z.Y. Karst landscapes of China: Patterns, ecosystem processes and services. Landsc. Ecol. 2019, 34, 2743–2763. [Google Scholar] [CrossRef]
  3. Huang, M.T.; Zhai, P.M. Desertification dynamics in China’s drylands under climate change. Adv. Clim. Chang. Res. 2023, 14, 429–436. [Google Scholar] [CrossRef]
  4. Bi, X.; Yao, Y.; Wang, Z.C.; Li, C.H.; Cao, D.; Wen, L.; Jing, L.; Sun, B. Improving monitoring Karst rocky desertification using high-frequency Landsat observations: A generalized framework and its application to a typical karst region in southeast China. Catena 2024, 241, 16. [Google Scholar] [CrossRef]
  5. Huang, X.F.; Zhou, Y.C.; Wang, S.J.; Zhang, Z.M. Occurrence mechanism and prediction of rocky land degradation in karst mountainous basins with the aid of GIS technology, a study case in Houzhai River Basin in southwestern China. Environ. Earth Sci. 2019, 78, 13. [Google Scholar] [CrossRef]
  6. Zhu, Z.; Zhu, T.; Huang, J.; Gu, J.; Yang, L. Dynamic variation analysis of rocky desertification in Xijiang River Basin of Guangxi based on GIS. Sci. Soil Water Conserv. 2018, 16, 19–55. [Google Scholar]
  7. Chen, S.D.; Wei, X.P.; Cai, Y.L.; Li, H.; Li, L.X.; Pu, J.B. Spatiotemporal evolution of rocky desertification and soil erosion in karst area of Chongqing and its driving factors. Catena 2024, 242, 13. [Google Scholar] [CrossRef]
  8. Chen, Q.; Zhang, C.; Tian, X.; Shi, X.; Zhang, Y.; Fang, P. Analysis of Spatio-temporal Evolution Process of Rocky Desertification in Qujing Based on Google Earth Engine. J. Southwest For. Univ. 2023, 43, 146–155. [Google Scholar]
  9. Zhang, S.W.; Wang, Y.; Wang, X.H.; Wu, Y.; Li, C.R.; Zhang, C.; Yin, Y.H. Ecological Quality Evolution and Its Driving Factors in Yunnan Karst Rocky Desertification Areas. Int. J. Environ. Res. Public Health 2022, 19, 16904. [Google Scholar] [CrossRef]
  10. Zhao, X.; Zhou, Z.; Wang, L.; Luo, J.; Sun, Y.; Liu, W.; Wu, T. Extraction and analysis of cultivated land experiencing rocky desertification in Karst mountain areas based on remote sensing—A case study of Beipanjiang town and Huajiang town in Guizhou Province. Trop. Geogr. 2020, 40, 289–302. [Google Scholar]
  11. Luo, J.; Liu, S.H.; Ruan, O.; Hu, H.T. Extraction of rocky desertification information using NDVI-Albedo feature space. Bull. Surv. Mapp. 2022, 56. [Google Scholar] [CrossRef]
  12. Dai, Q.H.; Peng, X.D.; Yang, Z.; Zhao, L.S. Runoff and erosion processes on bare slopes in the Karst Rocky Desertification Area. Catena 2017, 152, 218–226. [Google Scholar] [CrossRef]
  13. Guo, L.; Zhao, Z.; Dai, Q.; Liang, M.; Fu, X.; Chen, B. Temporal and spatial evolution and genesis of rocky desertification based on RS and GIS in Wenshan Prefecture. Remote Sens. Nat. Resour. 2017, 106–113. [Google Scholar] [CrossRef]
  14. Cao, J.J.; Wen, X.P.; Zhang, M.M.; Luo, D.Y.; Tan, Y.L. Information Extraction and Prediction of Rocky Desertification Based on Remote Sensing Data. Sustainability 2022, 14, 15. [Google Scholar] [CrossRef]
  15. Xu, H.; Wang, Y.; Su, Q.; Li, Z.; Jia, Y. Evolution of Rocky Desertification and Driving Factors in Typical Karst Areas of Yunnan Province. J. Arid. Land Resour. Environ. 2022, 36, 94–101. [Google Scholar]
  16. He, Y.H.Z.; Wang, L.; Niu, Z.; Nath, B. Vegetation recovery and recent degradation in different karst landforms of southwest China over the past two decades using GEE satellite archives. Ecol. Inform. 2022, 68, 11. [Google Scholar] [CrossRef]
  17. Ying, B.; Xiao, S.Z.; Xiong, K.N.; Chen, Q.W.; Luo, J.S. The Distribution Characteristics of Rocky Desertification and Land Use/Land Cover in Karst Gorge Area. In Proceedings of the 1st International Conference on Energy and Environmental Protection (ICEEP 2012), Hohhot, China, 23–24 June 2012; pp. 4661–4669. [Google Scholar]
  18. Guo, B.; Yang, F.; Li, J.L.; Lu, Y.F. A novel-optimal monitoring index of rocky desertification based on feature space model and red edge indices that derived from sentinel-2 MSI image. Geomat. Nat. Hazards Risk 2022, 13, 1571–1592. [Google Scholar] [CrossRef]
  19. Liang, X.; Guan, Q.F.; Clarke, K.C.; Liu, S.S.; Wang, B.Y.; Yao, Y. Understanding the drivers of sustainable land expansion using a patch-generating land use simulation (PLUS) model: A case study in Wuhan, China. Comput. Environ. Urban Syst. 2021, 85, 14. [Google Scholar] [CrossRef]
  20. Yang, J.; Huang, X. The 30 m annual land cover dataset and its dynamics in China from 1990 to 2019. Earth Syst. Sci. Data 2021, 13, 3907–3925. [Google Scholar] [CrossRef]
  21. Research Center for Eco-Environmental Sciences, Chinese Academy of Sciences. 2015 Eco-Environmental Issues Data of China (Soil Erosion, Desertification, and Rocky Desertification). 2020. Available online: https://data.casearth.cn/dataset/653f5366819aec161b3b4687 (accessed on 3 February 2024).
  22. Li, L.L.; Yang, J.T.; Wu, J. A Method of Watershed Delineation for Flat Terrain Using Sentinel-2A Imagery and DEM: A Case Study of the Taihu Basin. ISPRS Int. Geo-Inf. 2019, 8, 528. [Google Scholar] [CrossRef]
  23. Xi, H.; Wang, S.; Bai, X.; Tang, H.; Wu, L.; Chen, F.; Xiao, J.; Wang, M.; Li, H.; Cao, Y. Spatio-temporal characteristics of rocky desertification in typical Karst areas of Southwest China: A case study of Puding County, Guizhou Province. Acta Ecol. Sin. 2018, 38, 8919–8933. [Google Scholar]
  24. Zhou, Q.L.; Chen, W.; Wang, H.T.; Wang, D.L. Spatiotemporal evolution and driving factors analysis of fractional vegetation coverage in the arid region of northwest China. Sci. Total Environ. 2024, 954, 16. [Google Scholar] [CrossRef]
  25. Yan, F.; Guo, X.Y.; Zhang, Y.W.; Shan, J.; Miao, Z.H.; Li, C.Y.; Huang, X.H.; Pang, J.; Chen, Y.H. Analysis of the multiple drivers of vegetation cover evolution in the Taihangshan-Yanshan region. Sci. Rep. 2024, 14, 21. [Google Scholar] [CrossRef] [PubMed]
  26. Zhang, X.; Gan, S. Research on extracting rocky desertification information based on NDRI dimidiate pixel model. New Technol. New Process 2014, 1, 72–75. [Google Scholar]
  27. Wang, S.; Li, Y. Discussion on the classification of karst rocky desertification in ecological constructions. Carsologica Sin. 2005, 24, 192–195. [Google Scholar]
  28. Wang, J.-H.; Li, S.; Li, H.-X.; Luo, H.-B.; Wang, M.-G. Classifying indices and remote sensing image characters of rocky desertification lands: A case of karst region in Northern Guangdong Province. J. Desert Res. 2007, 27, 765–770. [Google Scholar]
  29. Zhou, Z. Application of remote sensing and GIS technology for land desertification in Guizhou karst region. Bull. Soil Water Conserv. 2001, 21, 52–63. [Google Scholar]
  30. Xu, E.Q.; Zhang, H.Q. Characterization and interaction of driving factors in karst rocky desertification: A case study from Changshun, China. Solid Earth 2014, 5, 1329–1340. [Google Scholar] [CrossRef]
  31. Zhang, Z.M.; Zhou, Y.C.; Wang, S.J.; Huang, X.F. Spatial Distribution of Stony Desertification and Key Influencing Factors on Different Sampling Scales in Small Karst Watersheds. Int. J. Environ. Res. Public Health 2018, 15, 743. [Google Scholar] [CrossRef]
  32. Han, X.Y.; Jia, G.P.; Yang, G.; Wang, N.; Liu, F.; Chen, H.Y.; Guo, X.Y.; Yang, W.B.; Liu, J. Spatiotemporal dynamic evolution and driving factors of desertification in the Mu Us Sandy Land in 30 years. Sci. Rep. 2020, 10, 15. [Google Scholar] [CrossRef]
  33. Wang, J.F.; Wang, Y.Q.; Xu, D.Y. Desertification in northern China from 2000 to 2020: The spatial-temporal processes and driving mechanisms. Ecol. Inform. 2024, 82, 12. [Google Scholar] [CrossRef]
  34. Jiang, Z.L.; Ni, X.L.; Xing, M.F. A Study on Spatial and Temporal Dynamic Changes of Desertification in Northern China from 2000 to 2020. Remote Sens. 2023, 15, 1368. [Google Scholar] [CrossRef]
  35. Chen, F.; Wang, S.; Bai, X.; Liu, F.; Tian, Y.; Luo, G.; Li, Q.; Wang, J.; Wu, L.; Cao, Y. Spatio-temporal evolution and future scenario prediction of karst rocky desertification based on CA–Markov model. Arab. J. Geosci. 2021, 14, 1262. [Google Scholar] [CrossRef]
  36. Zhang, Y.-R.; Zhou, Z.-F.; Ma, S.-B.; Yang, Q. Analysis and Forecast of the Evolution Features of RockyDesertification Landscape by Markov Model. J. Yangtze River Sci. Res. Inst. 2015, 32, 52. [Google Scholar]
  37. Dai, G.H.; Sun, H.; Wang, B.; Huang, C.H.; Wang, W.L.; Yao, Y.; Li, N.; Ou, X.K.; Zhang, Z.M. Assessment of karst rocky desertification from the local to regional scale based on unmanned aerial vehicle images: A case-study of Shilin County, Yunnan Province, China. Land Degrad. Dev. 2021, 32, 5253–5266. [Google Scholar] [CrossRef]
  38. Wu, Q.; Zheng, W.; Rao, C.J.; Wang, E.W.; Yan, W.D. Soil Quality Assessment and Management in Karst Rocky Desertification Ecosystem of Southwest China. Forests 2022, 13, 1513. [Google Scholar] [CrossRef]
  39. Li, Y.B.; Yu, M.; Zhang, H.; Xie, Y.X. From expansion to shrinkage: Exploring the evolution and transition of karst rocky desertification in karst mountainous areas of Southwest China. Land Degrad. Dev. 2023, 34, 5662–5672. [Google Scholar] [CrossRef]
  40. Chang, J.Y.; Li, Q.; Zhai, L.; Liao, C.J.; Qi, X.K.; Zhang, Y.; Wang, K.L. Comprehensive assessment of rocky desertification treatment in Southwest China karst. Land Degrad. Dev. 2024, 35, 3461–3476. [Google Scholar] [CrossRef]
  41. Cai, J.; Yu, W.Y.; Fang, Q.; Zi, R.Y.; Fang, F.Y.; Zhao, L.S. Extraction of Rocky Desertification Information in the Karst Area Based on the Red-NIR-SWIR Spectral Feature Space. Remote Sens. 2023, 15, 3056. [Google Scholar] [CrossRef]
  42. Callejas, I.A.; Osborn, K.; Lee, C.S.E.; Mishra, D.R.; Gomez, N.A.; Carrias, A.; Cherrington, E.A.; Griffin, R.; Rosado, A.; Rosado, S.; et al. A GEE toolkit for water quality monitoring from 2002 to 2022 in support of SDG 14 and coral health in marine protected areas in Belize. Front. Remote Sens. 2022, 3, 13. [Google Scholar] [CrossRef]
  43. Guo, B.; Yang, F.; Fan, J.F.; Lu, Y.F. The Changes of Spatiotemporal Pattern of Rocky Desertification and Its Dominant Driving Factors in Typical Karst Mountainous Areas under the Background of Global Change. Remote Sens. 2022, 14, 2351. [Google Scholar] [CrossRef]
Figure 1. Location of the study area. (a) China; (b) Yunnan Province; (c) The Pearl River source watershed.
Land 14 00984 g001
Figure 2. Spatial distribution of Fractional Vegetation Cover.
Land 14 00984 g002
Figure 3. Distribution of Rock Exposure Rate.
Land 14 00984 g003
Figure 4. Spatial distribution map of rocky desertification.
Land 14 00984 g004
Figure 5. Rocky desertification area changes in the Pearl River source basin (1990–2023). No Rocky Desertification (NRD); Potential Rocky Desertification (PRD); Light Rocky Desertification (LRD); Moderate Rocky Desertification (MRD); Severe Rocky Desertification (SRD); Extreme Rocky Desertification (ERD).
Land 14 00984 g005
Figure 6. Chord chart of 5-year interval transfer matrix, 1990–2023.No Rocky Desertification (NRD); Potential Rocky Desertification (PRD); Light Rocky Desertification (LRD); Moderate Rocky Desertification (MRD); Severe Rocky Desertification (SRD); Extreme Rocky Desertification (ERD).
Land 14 00984 g006
Figure 7. (a) Sen-MK trend test map of desertification information; (b) CA-Markov model prediction map of desertification. (a): Significant Decrease (SDEC); Non-Significant Decrease (NSDEC); Stable (STABLE); Non-Significant Increase (NSINC); Significant Increase (SINC).
Land 14 00984 g007
Table 1. Classification criteria for rocky desertification.
NumberRankRock Exposure Rate
(%)
Fractional Vegetation Cover
(%)
Slope
(°)
1NRD<20>70<5°
2PRD20–3050–705–8°
3LRD30–5030–508–15°
4MRD50–7020–3015–25°
5SRD70–9010–2025–35°
6ERD>90<10>35°
No Rocky Desertification (NRD); Potential Rocky Desertification (PRD); Light Rocky Desertification (LRD); Moderate Rocky Desertification (MRD); Severe Rocky Desertification (SRD); Extreme Rocky Desertification (ERD); The abbreviations for rocky desertification levels in the following tables and figures are consistent with this standard.
Table 2. Area of rocky desertification in the headwaters of the Pearl River from 1990 to 2023.
Year NRDPRDLRDMRDSRDERDTRD
1990Area (km2)4687.97 6925.14 6077.86 4438.45 2364.72 1391.62 14,272.65
Percentage (%)7.67%11.33%9.94%7.26%3.87%2.28%23.34%
1995Area (km2)4696.04 6732.92 5550.45 4880.53 2456.39 1569.43 14,456.79
Percentage (%)7.68%11.01%9.08%7.98%4.02%2.57%23.64%
2000Area (km2)4375.35 7537.88 6059.10 4254.62 2411.58 1247.23 13,972.52
Percentage (%)7.16%12.33%9.91%6.96%3.94%2.04%22.85%
2005Area (km2)5128.26 6362.35 6557.32 4032.03 2447.68 1329.60 14,366.62
Percentage (%)8.39%10.41%10.72%6.59%4.00%2.17%23.50%
2010Area (km2)5306.17 6495.09 5671.48 4227.53 2687.18 1461.85 14,048.05
Percentage (%)8.68%10.62%9.28%6.91%4.39%2.39%22.98%
2015Area (km2)5221.05 7777.84 5919.41 4162.38 1770.16 1034.92 12,886.87
Percentage (%)8.54%12.72%9.68%6.81%2.90%1.69%21.08%
2020Area (km2)5487.81 8413.48 6124.33 3473.35 1614.51 772.28 11,984.46
Percentage (%)8.98%13.76%10.02%5.68%2.64%1.26%19.60%
2023Area (km2)5492.66 8352.58 6102.96 3501.57 1716.50 719.48 12,040.52
Percentage (%)8.98%13.66%9.98%5.73%2.81%1.18%19.69%
No Rocky Desertification (NRD); Potential Rocky Desertification (PRD); Light Rocky Desertification (LRD); Moderate Rocky Desertification (MRD); Severe Rocky Desertification (SRD); Extreme Rocky Desertification (ERD); Territorial Non-Rocky Desertification Zone (TRD).
Disclaimer/Publisher’s Note: The statements, opinions and data contained in all publications are solely those of the individual author(s) and contributor(s) and not of MDPI and/or the editor(s). MDPI and/or the editor(s) disclaim responsibility for any injury to people or property resulting from any ideas, methods, instructions or products referred to in the content.

