Article

Changing Trends in Utilization Preference of Urban Green Space and Heterogeneous Effects on Ecological Well-Being Pre- and Post-Pandemic in Beijing

1
School of Economics and Management, Beijing Forestry University, Beijing 100083, China
2
State Key Laboratory of Environmental Criteria and Risk Assessment, Chinese Research Academy of Environmental Sciences, Beijing 100012, China
3
State Environmental Protection Key Laboratory of Regional Ecological Process and Functions Assessment, Chinese Research Academy of Environmental Sciences, Beijing 100012, China
*
Authors to whom correspondence should be addressed.
Land 2025, 14(5), 983; https://doi.org/10.3390/land14050983
Submission received: 6 April 2025 / Revised: 1 May 2025 / Accepted: 1 May 2025 / Published: 2 May 2025

Abstract

:
Major public health events pose a huge challenge to the sustainable improvement of city dwellers’ ecological well-being, hindering the achievement of urban ecological construction goals. In the context of resilient city and all-aged friendly city construction, age factor is given special consideration in urban green space management to meet the heterogeneous demands and preferences of city dwellers for urban ecological benefit. However, young, middle-age and elderly city dwellers’ utilization of urban green spaces during different periods of pandemic are poorly known. Meanwhile, insufficient discussion on the differences in ecological well-being contributions of different types of urban green spaces has led to difficulties in effectively connecting urban green space management planning with the city dwellers’ demands for ecological well-being. To help fill this gap, this study utilizes field study data on urban ecological construction and urban landscape and greening in Beijing from 2019 to 2023 to analyze the evolution and differences in utilization behaviors of urban green space among different age group city dwellers. Furthermore, this study applies the ordinary least square regression model (OLS) to explore the differences in the impact of various types of urban green space on the ecological well-being of city dwellers. The results revealed significant age effects in the utilization of urban green space during 2019–2023. It outlines the increased time spent in urban green space by younger city dwellers. In addition, the results demonstrated that the utilization behavior of park green space has a significant positive impact on the ecological well-being level of city dwellers, and the impact of utilization behavior on the ecological well-being level of city dwellers varies depending on the type of green space. Compared with community green space, the impact of park green space utilization behavior on the ecological well-being level of city dwellers is more significant. The conclusion from the main urban area of this Beijing case study contributes to the international discussion on urban green space management and urban green resilience governance in metropolitan areas worldwide as they add additional insights on the change and difference in the utilization behavior of urban green spaces, particularly looking at elderly, middle-aged and young city dwellers as well as the importance of a timely response to the heterogeneity preference of city dwellers’ ecological well-being demand.

1. Introduction

As an important space carrier for improving the quality of the living environment, urban green spaces are planned and constructed with the major goal of meeting the growing ecological well-being demands of the city dwellers through the supply of high-quality ecological products [1]. The regulating service, supporting services and cultural services provided by urban green spaces (e.g., microclimate regulation, air purification, biodiversity conservation, leisure and recreation, etc.) significantly affect public health and ecological security levels by optimizing the quality of the living environment and are irreplaceable for achieving ecological well-being [2,3,4,5,6]. This development orientation strengthens the correlation between urban green space ecosystem planning and ecological well-being [7,8,9,10,11]. As a multidimensional composite concept, the human well-being system integrates the dual dimensions of objective material basis and subjective psychological cognition, and it shares similarities with evaluation indicators such as the satisfaction and subjective well-being of city dwellers. Ecosystem services are ecological features, functions, or processes that directly or indirectly contribute to human well-being. For improving the ecological well-being level of city dwellers, it is of great significance for clarifying the changing trends in city dwellers’ utilization behavior of urban green space ecosystem services and the heterogeneous sources of ecological well-being impacts [12,13].
In recent years, major public health incidents have occurred frequently, posing a serious threat to the sustainable improvement of city dwellers’ ecological well-being. As an important component of urban ecological construction, urban green space management is increasingly regarded as a key factor in fostering urban green resilience [14,15,16]. In the context of resilient city and all-aged friendly city construction, age factor is given special consideration in urban green space management to meet the heterogeneous demands and preferences of city dwellers for urban ecological benefit. Providing a resilient, livable and inclusive urban ecological environment for city dwellers among different age groups is therefore essential. However, young, middle-age and elderly city dwellers’ utilization of urban green spaces during different periods of pandemic is poorly known [17,18]. Meanwhile, the previous research on city dwellers’ utilization behavior of urban green space ecosystem services often starts from a static scale, lacking dynamic empirical research on the changing in city dwellers’ utilization behavior preferences. This makes it difficult for urban green space ecosystem planning to form an effective connection with the realization of city dwellers’ ecological well-being. Therefore, in order to promote the timely response of urban green space ecosystem planning and ecosystem service management decisions to the growing ecological well-being demands of city dwellers, it is crucial and necessary to conduct empirical research on the changing trends in city dwellers’ utilization behavior preferences for urban green space ecosystem services and the differences in contributions of different green space types on city dwellers’ ecological well-being based on cross-period and large-sample field research data [19,20,21].
Ecosystem services are a series of conditions and processes provided by natural ecosystems and their species to sustain human life [22], and they are the benefits that humans directly or indirectly obtain from ecosystems [23]. As a fundamental element for maintaining human well-being, ecosystem services have become an important interdisciplinary research topic after their analytical framework was systematically integrated through the United Nations Millennium Ecosystem Assessment (MA). Haines Y and Potschin Y proposed the Ecosystem Services Cascade (ESC) framework in 2010 based on the analysis framework of ecosystem services and human well-being constructed through the MA [24]. The ESC framework connects ecosystem structural processes with human well-being in a chain-like structure, providing a bridge for interdisciplinary research on ecosystem services, and has been widely discussed and applied by scholars worldwide [25,26,27,28]. This framework reveals the corresponding relationship between the structure and processes of natural ecosystems and ecological well-being, providing a theoretical basis for the construction of the research framework of this study. Based on the ESC framework, the theoretical analysis framework of this study is constructed as shown in Figure 1. The first part of the theoretical analysis framework is the urban green space ecosystem, whose components, structure and the processes and functions formed by their interactions are the starting point for the formation of ecosystem services. The second part of the framework is the socio-economic system, which refers to the ecological well-being generated by city dwellers’ utilization of ecosystem services of urban green space. The third part of the framework is governance decision making, based on the flow characteristics of ecosystem services of urban green space. Governance policies and management measures change the regional urban green space ecosystem structure, thereby triggering changes in ecosystem services. Among them, the intangible well-being provided by cultural service meets the deep demand of human beings for spiritual comfort and aesthetic experience. Its role in improving the quality of life of city dwellers has been widely recognized.
Urban parks and community green spaces, as the only vibrant green infrastructure in cities, can provide diverse ecosystem cultural services for city dwellers [29,30,31]. By utilizing ecosystem cultural services such as landscape recreation, aesthetic appreciation, leisure and entertainment and natural education, they can significantly enhance the ecological well-being of city dwellers. However, existing studies often evaluate the city dwellers’ utilization behavior and the heterogeneity effects of urban green space on ecological well-being through “screenshot style” and “snapshot style” approaches. There is a serious lack of research on the changing trends of city dwellers’ utilization preferences for urban green space ecosystem services from a dynamic development perspective, using long-term and large-sample field research data and comparing multiple periods of data. This leads to difficulties in timely responses to city dwellers’ ecological well-being demands in urban green space ecosystem service management decisions and also hinders the sustainable improvement of city dwellers’ ecological well-being levels.
Based on this, combining the background of all-aged friendly city construction, this study utilizes field study data on urban ecological construction and urban landscape and greening in Beijing from 2019 to 2023 to analyze the evolution and differences in the utilization behaviors of urban green space among different age group city dwellers. Furthermore, this study applies the ordinary least square regression model (OLS) to explore the differences in the impact of various types of urban green space on the ecological well-being of city dwellers. This study aims at identifying changing trends in the utilization preferences of citizens, analyzing the differences in the impact of different types of green spaces on the ecological well-being of city dwellers and promoting the dynamic balance between the supply of urban green space ecosystem services and the ecological well-being demands of city dwellers. This study breaks through the limitations of existing research that only focuses on city dwellers’ utilization behavior preferences that are at a certain point in time or relatively short-term. Meanwhile, this study identifies the ecological well-being demands of city dwellers at different periods of the COVID-19 pandemic, which has filled the problem of “static surplus but dynamic deficiency” in long-term research on urban green space ecosystem service management. The remainder of this paper is organized as follows: Section 2 introduces the study area, questionnaire development, data collection and sample representation. Section 3 describes changing trends in the utilization preference of urban green space and heterogeneous effects on ecological well-being from 2019 to 2023. Finally, the conclusions and limitations of this study are provided in Section 4 and Section 5.

2. Material and Methods

2.1. Study Area

The presented findings are based on a case study carried out in the main urban area of Beijing, including Dongcheng, Xicheng, Chaoyang, Fengtai, Shijingshan and Haidian district. Since 2017, Beijing has successively built near-natural green spaces in the main urban area for reshaping urban forest to improve the living environment. And the functions of urban ecosystems in ecological regulation and biodiversity conservation have been significantly improved. However, as a concentrated carrier of China’s politics, culture, international exchanges and technological innovation, the main urban area of Beijing has a high concentration of population and human activities. The contradiction between resource supply and demand is prominent, and the regional ecological pressure is significant.

2.2. Questionnaire Development and Data Collection

To analyze the changing trends in utilization behaviors and ecological well-being level among city dwellers, this study conducted field surveys in the main urban area of Beijing from July to November 2019, 2021 and 2023. Random paper questionnaires were distributed to the respondents for face-to-face interviews [32]. A pre-survey was conducted before the formal survey for adjusting the questionnaire items to be more in line with the field research situation. The adjusted questionnaire included the personal information about gender, education level, income, self-reported health and age group (18–39, 40–59, ≥60) in part 1. Part 2 inquired regarding respondents’ utilization behaviors towards ecosystem cultural services among city dwellers. Part 3 inquired regarding respondent’s satisfaction evaluation of ecological well-being. The time spent of ecosystem cultural services of urban green space and ecological well-being evaluation in the questionnaire were characterized using the Likert five-point scale. Prior to conducting on-site research, three experts in urban ecological construction provided training to volunteers to enhance their understanding of questionnaire items and face-to-face interview skills, thereby ensuring that respondents can better understand the questionnaire content. Field survey was conducted from 9 am to 6 pm on weekdays and weekends, and questionnaires were distributed through random communication interviews. In order to maximize the representativeness of the sample, paper questionnaires were distributed in various types of urban green spaces to avoid recording in a centralized location or focusing on specific age groups. The interview duration for each sample is between 20 and 40 min. After the daily survey was completed, the survey team leader checked the quality of the questionnaires and eliminated those with a completion rate below 80%. After the formal on-site survey, a total of 8130 valid questionnaires were collected.

2.3. Sample Representation

In terms of space, the questionnaire data were distributed in the six central urban areas of Beijing, and the sample size of the central urban area remained basically the same in the three time periods (Table 1). Only Chaoyang District had a significant difference in proportion during these three time periods, exceeding 10%. The reason is that the COVID-19 pandemic in 2021 seriously affected this field study and questionnaire collection, resulting in inevitable errors. From the demographic characteristics, it can be seen that the gender ratio remained relatively balanced during the questionnaire data collection process at different times (Table 2). During the three time periods, the age distribution of the respondents was mostly between 18–49 years old and 60 years old and above. This study uses SPSS 27.0 to analyze the reliability and validity of the Likert scale on city dwellers’ utilization behavior of urban green spaces in the questionnaire. The results showed that the Cronbach Alpha = 0.868, the KMO = 0.908 and the significance of the Bartlett sphericity test was <0.001, indicating that the reliability and validity of the questionnaire were good and could be further analyzed.

2.4. Statistical Analysis

2.4.1. Variable Declaration

Ecological well-being satisfaction is the dependent variable. Referring to relevant research [8,33,34,35], the measurement question used is the following: How satisfied are you with the degree of ecological well-being achievement? Regarding the inquiry about city dwellers’ satisfaction of ecological well-being, “1 → 5” indicates “very dissatisfied → very satisfied”. The utilization behavior of ecosystem services of urban green space is the independent variable. Referring to relevant research [36,37,38,39], the measurement question used is the following: How often do you engage in recreational activities, physical exercise, parent–child activities, leisure and aesthetic activities, public outreach and social activities in urban green spaces? Regarding the inquiry about city dwellers’ utilization behaviors of urban green space, “1 → 5” indicates “very low frequency → very high frequency”. Personal family and external factors were chosen as control variables based on the existent literature [40,41,42,43]. Among them, personal factors include gender, age, education level, monthly disposable income, and self-reported health. Family factors include the number of family members. External factors include the distance to urban green spaces.

2.4.2. Model Settings

To analyze the impact of utilization behavior of ecosystem cultural services of urban green space on city dwellers’ satisfaction with ecological well-being, this section constructs the following least squares regression model:
e w p = β 0 + β 1 b e h p + β 2 C o n t r o l 1 + + β p C o n t r o l p + ϵ 1
Among them, e w p is the dependent variable, representing the ecological well-being level of individual city dwellers, b e h p is the frequency of urban green space utilization behavior of individual city dwellers, C o n t r o l is the control variable and ϵ 1 is the random error term.

2.4.3. Descriptive Statistic and Correlation Analysis

Park green spaces and community green spaces are important spatial carriers for residents to carry out urban green space ecosystem service utilization behavior. According to the ESC framework, the benefits generated by residents’ green space ecosystem service utilization behavior directly affect their ecological well-being level. Meanwhile, personal factors such as gender, age, education level, monthly disposable income and self-reported health, as well as family factors such as the number of family members, are closely related to the ecological well-being level of residents. In addition, the accessibility of urban green spaces is also a key factor affecting the ecological well-being of residents. Therefore, a correlation analysis was conducted on 6 demographic characteristics and the satisfaction of city dwellers with ecological well-being to explore possible factors that affect the level of ecological well-being of city dwellers. Table 3 presents the descriptive analysis results of the main variables.

3. Results

3.1. Utilization Behavior Preference of City Dwellers

3.1.1. Changing Trends in Time Spent

The results show that there are significant differences in the recreational times in urban green space among different age groups in the time period 2019–2023. Age effects were observed in the changes in utilization pattern in urban green space in different periods. Figure 2 summarizes the changes in recreational time in urban green space among different age groups of city dwellers in the main urban area of Beijing. In the pre-pandemic period, the elder group, middle-aged and young groups separately spent an average of 2.10, 2.08 and 2.04 h each time in the urban green space. During the pandemic, the elder group, middle-aged and young groups separately spent an average of 2.16, 2.21 and 2.15 h each time in the urban green space. In the post-pandemic period, the elder group, middle-aged and young groups separately spent an average of 2.32, 2.22 and 2.17 h each time on the urban green space. Obviously, as the pandemic evolved, the recreational times in urban green space among different age groups showed an increasing trend. In the comparison of the same age group, there were significant changes in recreational time in the middle-aged group and young group, while there was no significant change in the elderly group during different stages of pandemic. Figure 2 shows that, as the scope of the pandemic expanded, the recreational times of the middle-aged group and young group in urban green space increased significantly, and this trend continued until 2023. It can be seen that the pandemic has had a profound impact on the public health safety of residents, which is reflected in the increasing attention of residents to the impact and benefits of urban green space ecosystem services on their physical and mental health, resulting in an increase in their time spent in urban green spaces. This trend of change is more prominent in the young and middle-aged groups, mainly because the daily green space recreation time of the older adults is relatively fixed, while the young and middle-aged groups are busy with work and have shorter green space recreation time. Under the impact of the pandemic, the emphasis on physical and mental health among the young and middle-aged groups has increased, promoting a significant increase in their time spent in urban green space.
The Kruskal–Wallis test was applied to identify differences in recreational time in urban green space among different age groups. In the pre-pandemic period (p = 0.472) and during the pandemic (p = 0.664), no significant differences were found in the recreational time in urban green space among different age groups. However, post-pandemic, a significant difference was observed in the recreational time in urban green space between the young group and the elderly group (p = 0.001).

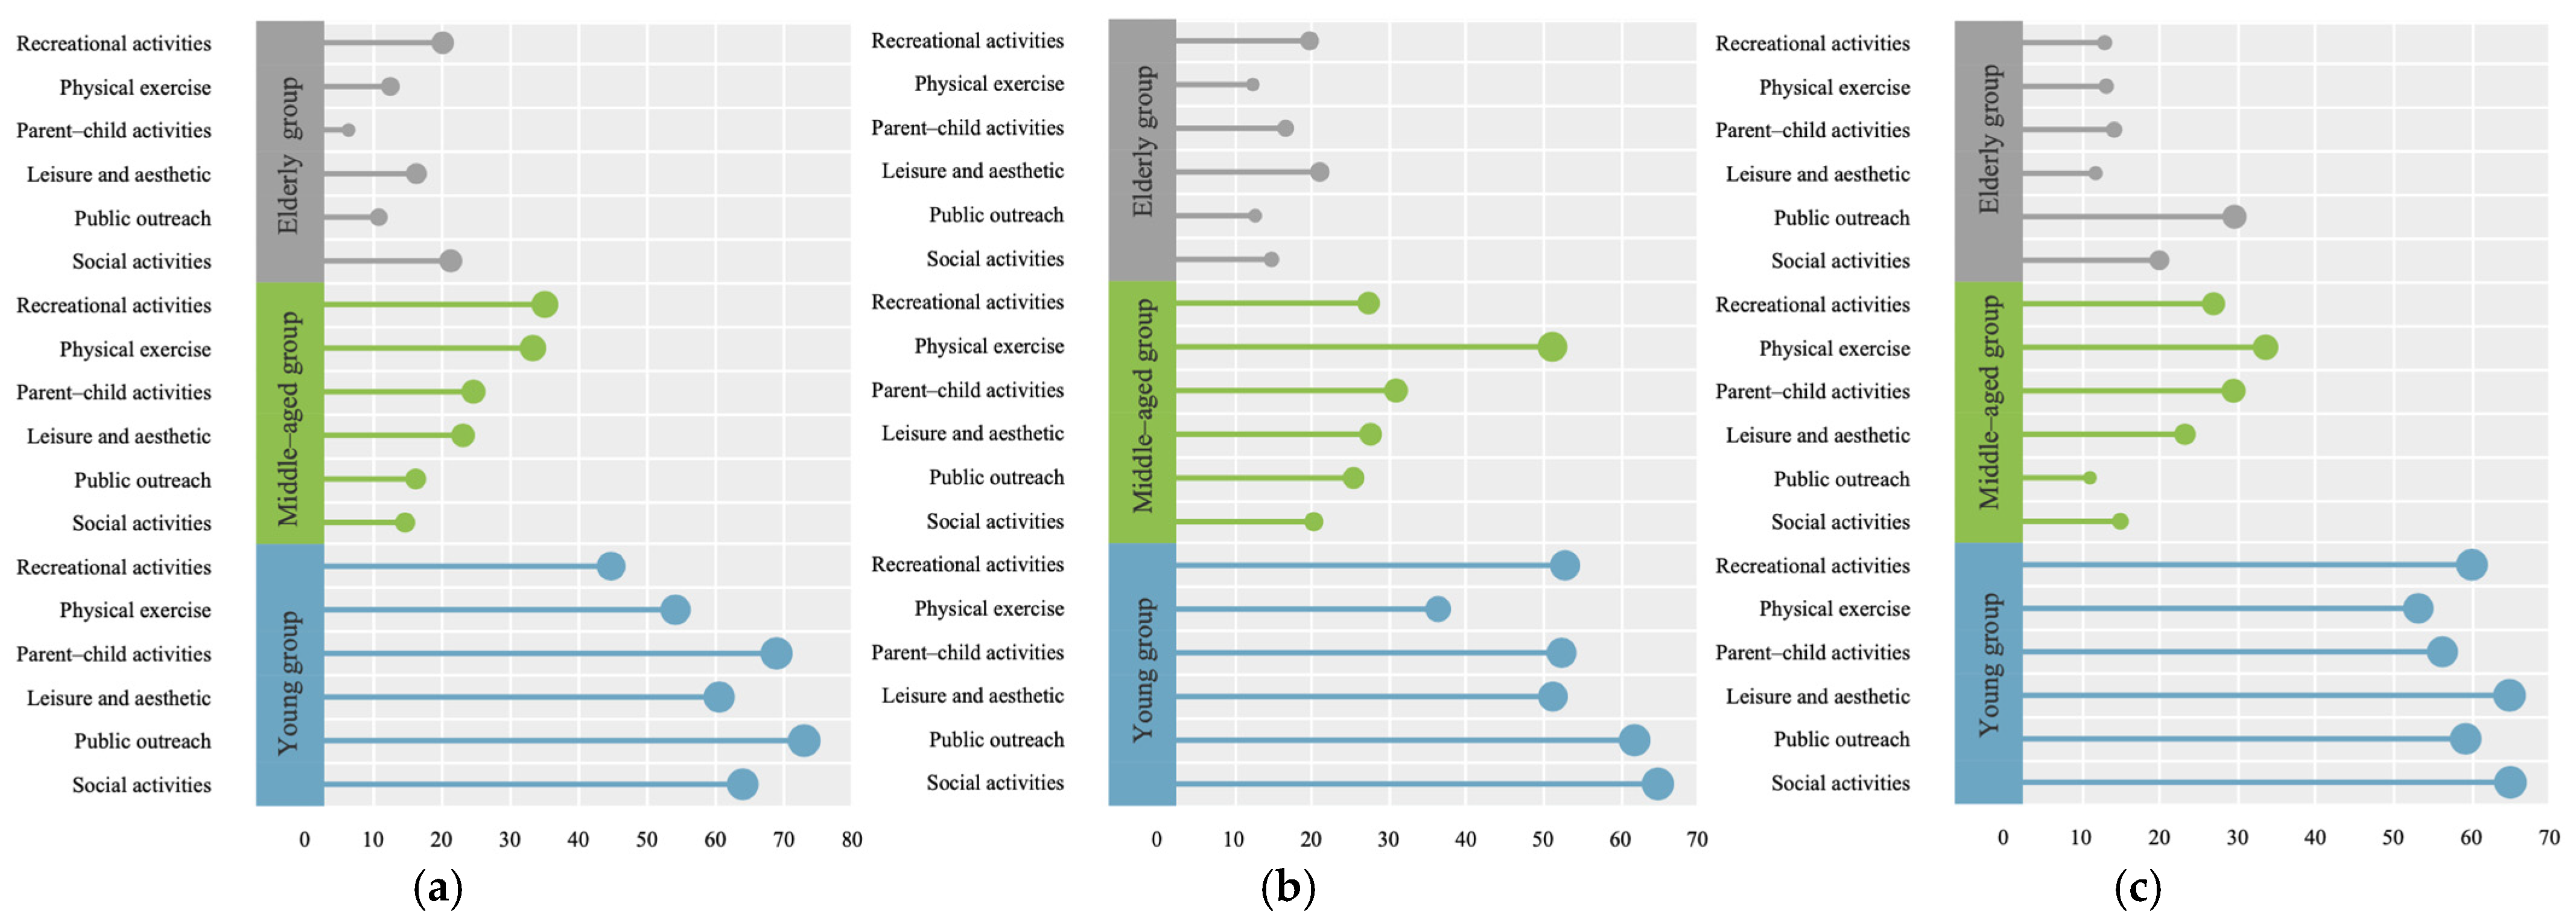
3.1.2. Changing Trends in Utilization Behavior

The age effect of recreational behaviors in urban green space and behavior preferences of specific age groups during different stages of the pandemic is shown in Figure 3. In the pre-pandemic period and during the pandemic, the elderly group tended to engage in recreational activities in urban green space, while, in the post-pandemic period, the elderly group showed a preference for public outreach. The possible reason is that Beijing is gradually promoting community participation in urban green space management, strengthening publicity and guiding residents to jointly build and govern urban green space, and the older adults have higher enthusiasm involved in suggesting urban landscaping and greening issues. During the pandemic, physical exercise had become the most preferred recreational behavior in urban green space for the middle-aged group. The possible reason is that, compared with the older and young adults, the middle-aged groups bear more pressure from work, life and family. Physical exercise, as a simple and effective way to improve fitness levels, has become one of the most popular exercise methods among the middle-aged group. Especially under the impact of the pandemic, the middle-aged group paid more attention to improving their physical and mental health, which promotes the preference for physical exercise behavior. During all stages of the pandemic, the young group’s preferences for recreational activities and leisure and aesthetic activities increased, while their preferences for public outreach showed a downward trend. During the peak of the pandemic, the young group’s preferences for physical exercise and parent–child activities sharply decreased, and their preferences for these two types of activities have recovered in the post-pandemic period. A possible reason is that the impact of lockdown has led to a decrease in the frequency of parent–child activities among the young group. In the post-pandemic period and during the pandemic, the preference and demand for parent–child activities among the young group have returned to pre-pandemic levels.
Table 4 shows the frequency differences in recreational behavior in urban green space among different age groups in different stages of COVID-19. In the pre-pandemic period, except for parent–child activities, there were significant frequency differences in all utilization behaviors of urban green space among different age groups. During the pandemic, there were significant differences in the frequency of recreational activities as well as leisure and aesthetic activities between the elder group and young group. Furthermore, in the frequency of physical exercise, there was a significant difference between the middle-aged group and young group. In the post-pandemic period, except for public outreach activities, there were significant differences in the utilization frequency of the other recreational behaviors in urban green space. Based on this, it confirmed that the pandemic lockdown has led to a tendency for city dwellers in the main urban area to have a single type of utilization of urban green space functions. However, in the post-pandemic period, the utilization types and preferences for urban green space function have become more diverse, and city dwellers’ demand for ecosystem services of urban green space has also become more diversified.

3.2. Influence Factor of Ecological Well-Being

3.2.1. The Relationship Between Various Factors and Ecological Well-Being

The correlation analysis results between the demographic characteristics of the respondents and the level of ecological well-being are shown in Table 5.
Overall, there is a significant positive correlation between the ecological well-being and the utilization behavior of park and green space ecosystem services (n = 8130, p < 0.01), a significant positive correlation with age (n = 8130, p < 0.01), a significant negative correlation with education level (n = 8130, p < 0.01), a significant positive correlation with income (n = 8130, p < 0.1), a significant positive correlation with family members (n = 8130, p < 0.1) and a significant positive correlation with self-reported health (n = 8130, p < 0.01).

3.2.2. Baseline Regression

To evaluate the specific impact of utilization behavior of urban green space ecosystem cultural services on the ecological well-being of city dwellers, this study constructed two ordinary least squares regression (OLS) models, and the results are shown in Table 6. No any control variables were included in model (1), and the coefficient of utilization behavior of urban green space ecosystem cultural services was 0.094, showing statistical significance (p < 0.01). After introducing relevant control variables, model (2) showed that the utilization behavior of urban green space ecosystem cultural services decreased to 0.077, which was also verified at the significance level of 0.01. This means that, for every unit increase in the utilization behavior of urban green space ecosystem cultural services, the ecological well-being level of city dwellers will increase by 0.077 units. Both model (1) and model (2) indicate that the utilization behavior of urban green space ecosystem cultural services has a significant positive impact on the ecological well-being level of citizens.

3.3. Heterogeneous Effects of Urban Green Space Category on Ecological Well-Being

3.3.1. Heterogeneous Analysis

Different categories of urban green spaces may have varying impacts on the ecological well-being of city dwellers [44,45,46], and there are also differences in the frequency of ecosystem cultural service utilization behavior among city dwellers towards different categories of urban green spaces. Therefore, it is necessary to further conduct heterogeneity analysis based on the basic regression analysis. As shown in Table 7, model (4) shows that the coefficient of utilization behavior of community green space is 0.040, and a significance test at the 1% level indicates that the utilization behavior of ecosystem cultural services of community green space has a significant positive impact on the ecological well-being level of city dwellers. The coefficient of the utilization behavior of park green space ecosystem cultural services in model (3) is 0.077, indicating that the impact of utilization behavior of park green space ecosystem cultural services on the ecological well-being level of city dwellers varies depending on the type of green space, and the impact of the utilization behavior of park green space on the ecological well-being level of city dwellers is more significant.

3.3.2. Robust Test

To further verify the robustness of the utilization behavior of urban green space ecosystem cultural services on the ecological well-being of city dwellers, this section uses the method of adding control variables to test the robustness of the above conclusions. The level of ecological well-being of city dwellers is also influenced by many other factors. In addition to the existing control variables, this section adds the control variable of distance to community green space to verify the robustness of the results. The results showed that, by adding control variables, the coefficient of utilization behavior of urban green space ecosystem cultural services was 0.040, and a significance test at the 1% level further confirmed the positive impact of utilization behavior of urban green space ecosystem cultural services on the ecological well-being level of city dwellers. The robustness test results are shown in Table 8.

4. Discussion

Overall, this study confirms significant differences in the utilization behavior preference of urban green space among the elderly, middle-aged and young groups in 2019–2023. Meanwhile, there are differences in the contribution of different categories of green spaces to the ecological well-being of city dwellers. The data analyzed on the main urban area of Beijing reveal significant changes in time spent outside looking at 2021 and 2023 for the middle-aged group and young group, while no significant changes were observed in the elderly group regarding the recreation time in urban green space during 2019–2023. When a closer look is taken at the present study’s age groups, the middle-aged group and young group spent significantly more time in urban green spaces. This confirms those studies outlining that young people visited greenspaces more often than older people when under external pressure [47,48]. Also, this survey confirms that there have been significant changes in the preferences of city dwellers of all age groups of urban green space recreational behavior types from 2019 to 2023. Especially in 2021 and 2023, the middle-aged group showed a significant increase in frequency and preference for physical exercise activities. This is in line with other studies that show significant benefits for physical and mental health from exercising in urban green spaces during the pandemic [49].
Based on the research results, this study can provide useful insights for urban green space management planning. In the future, the management of green spaces in the main urban area of Beijing should fully tap into and utilize the city’s natural and ecological cultural resources, actively advocate the participation of social forces in the integration of cultural service resources, expand the forms of cultural service activities, improve landscape theme characteristics, enhance residents’ recognition and satisfaction with urban ecological construction and cultural service value and promote the enhancement of the non-use value of urban green spaces. At the same time, it still needs to pay attention to the value of urban green spaces, continuously improve the completeness of urban green space tourism guidance signs, signage, rest benches, fitness and children’s recreation facilities, and use modern technology to accelerate digital empowerment to enhance the recreational experience of residents of different age groups. At the same time, providing activity venues and corresponding green space service facilities for the elderly, middle-aged and young groups and creating all-aged friendly park and community green spaces are important issues that cannot be ignored in urban green space planning and construction. By fully integrating the main roles of government, community and residents, enriching the diversity of urban green space activities, increasing urban green space supporting facilities, continuously improving the grid management mechanism of communities at all levels, and facilitating residents’ participation in urban landscaping management, residents’ sense of green gain and promotion of the sustainable improvement of ecological well-being can be further enhanced.
This study provides a reasonable basis for the formulation of policies related to urban green space ecosystem management planning aimed at improving city dwellers’ ecological well-being. However, this study still has some limitations. The process of flowing from urban green space ecosystem services to the ecological well-being of city dwellers is very complex. This study only analyzes the impact of utilization behavior of urban green space ecosystem services on ecological well-being from the perspective of city dwellers’ perception and evaluation, it but cannot infer its specific pathway of action. In addition, this study only considered the impact of utilization behavior of park green spaces and community green space ecosystem services on city dwellers’ ecological well-being. The study of different categories of urban green spaces (such as square green spaces, public green spaces, etc.) will provide a more accurate understanding for urban green space ecosystem management planning [50,51]. Finally, the results of this study may be confined to mega-cities such as Beijing. Future research should consider confirming and clarifying these findings in different urban environments, such as small and medium-sized cities or coastal cities. Follow-up studies on the maintenance of these changes in age effects on recreational behaviors preference could be particularly interesting to survey the city dwellers’ attitude among all age groups towards urban greening management in main urban areas [52].

5. Conclusions

The findings from this representative survey for the main urban area of Beijing showed strong significant differences between age groups looking at the utilization of urban greening management. This study highlights age differences in the utilization of urban green spaces from 2019 to 2023. Our study also revealed significant age effects in the utilization behavior of ecosystem cultural services of urban green space at different stages of urban ecological construction. It outlines the increased time spent in urban green areas by younger city dwellers. However, no significant changes were observed in recreation time in the elderly group during 2019–2023. Meanwhile, there are differences in the impact of different categories of urban green spaces on the ecological well-being of city dwellers. Compared to community green spaces, the utilization of ecosystem cultural services in park green spaces has a more significant impact on the improvement of city dwellers’ ecological well-being. Overall, our research emphasizes the necessity of considering age factors in urban greening management practice, in order to meet the heterogeneous demands, preferences and expectations of different age groups for urban living environment quality and provide a resilient and inclusive living environment under the background of all-age friendly city construction. Altogether, the results from the main urban area of Beijing case study contribute to the international discussion on urban green space management and urban green resilience governance in metropolitan areas worldwide as they add additional insights on the changed utilization of urban green spaces, particularly looking at elderly, middle-aged and young city dwellers as well as the importance of timely response heterogeneity preferences of city dwellers’ ecological well-being demand.

Author Contributions

Conceptualization, H.G. and Y.W.; methodology, H.G. and J.F.; software, H.G.; validation, Y.W., J.F. and S.L.; formal analysis, H.G.; investigation, H.G. and S.W.; resource, H.G.; data curation, H.G. and Y.W.; writing—original draft preparation, H.G. and Y.W.; writing—review and editing, H.G., J.F., S.L. and S.W.; visualization, H.G.; supervision, Y.W.; project administration, Y.W.; funding acquisition, Y.W. All authors have read and agreed to the published version of the manuscript.

Funding

This research was funded by the Key Project of Social Science Foundation of Beijing, China (grant number 19GLA005).

Data Availability Statement

The original contributions presented in this study are included in this article; further inquiries can be directed to the corresponding author.

Acknowledgments

We are grateful to the Key Project of Social Science Foundation of Beijing, China, for granting this research. We are thankful for the expert group and reviewers for sharing their knowledge and comments on the questionnaires and the research. We are also grateful for the editorial team for presenting this research in a clear and unified form. We are also thankful for the efforts of the field study team receiving the available data to support this research. Last but not least, our great gratitude is extended to all respondents of this survey for sharing their opinions with us.

Conflicts of Interest

The authors declare no conflicts of interest.

References

  1. Liu, H.; Ren, H.; Remme, R.P.; Nong, H.; Sui, C. The Effect of Urban Nature Exposure on Mental Health—A Case Study of Guangzhou. J. Clean. Prod. 2021, 304, 127100. [Google Scholar] [CrossRef]
  2. Yan, Y.; Jian, W.; Wang, B.; Liu, Z. Multi-Scale Effects of LCZ and Urban Green Infrastructure on Diurnal Land Surface Temperature Dynamics. Sustain. Cities Soc. 2024, 117, 105945. [Google Scholar] [CrossRef]
  3. Costanza, R. Valuing Natural Capital and Ecosystem Services toward the Goals of Efficiency, Fairness, and Sustainability. Ecosyst. Serv. 2020, 43, 101096. [Google Scholar] [CrossRef]
  4. Dang, H.; Li, J.; Zhang, Y.; Zhou, Z. Evaluation of the Equity and Regional Management of Some Urban Green Space Ecosystem Services: A Case Study of Main Urban Area of Xi’an City. Forests 2021, 12, 813. [Google Scholar] [CrossRef]
  5. Chen, W.Y. The Role of Urban Green Infrastructure in Offsetting Carbon Emissions in 35 Major Chinese Cities: A Nationwide Estimate. Cities 2015, 44, 112–120. [Google Scholar] [CrossRef]
  6. Nowak, D.J.; Greenfield, E.J.; Hoehn, R.E.; Lapoint, E. Carbon Storage and Sequestration by Trees in Urban and Community Areas of the United States. Environ. Pollut. 2013, 178, 229–236. [Google Scholar] [CrossRef]
  7. Fomba, M.; Osunde, Z.D.; Traore, S.S.; Okhimamhe, A.; Kleemann, J.; Fuerst, C. Urban Green Spaces in Bamako and Sikasso, Mali: Land Use Changes and Perceptions. Land 2024, 13, 59. [Google Scholar] [CrossRef]
  8. Takahashi, T.; Uchida, Y.; Ishibashi, H.; Okuda, N. Subjective Well-Being as a Potential Policy Indicator in the Context of Urbanization and Forest Restoration. Sustainability 2021, 13, 3211. [Google Scholar] [CrossRef]
  9. Krols, J.; Aerts, R.; Vanlessen, N.; Dewaelheyns, V.; Dujardin, S.; Somers, B. Residential Green Space, Gardening, and Subjective Well-Being: A Cross-Sectional Study of Garden Owners in Northern Belgium. Landsc. Urban Plan. 2022, 223, 104414. [Google Scholar] [CrossRef]
  10. Chen, Y.; Yue, W.; La Rosa, D. Which Communities Have Better Accessibility to Green Space? An Investigation into Environmental Inequality Using Big Data. Landsc. Urban Plan. 2020, 204, 103919. [Google Scholar] [CrossRef]
  11. Li, D.; Wang, Y.; Chen, Y.; Huang, D.; Dai, C. Research on Subjective Well-being Detection and Pro-tourism Behavior of Residents in Community Embedded Destination: The Conditional Effect of Positive and Negative Perception. Area Res. Dev. 2020, 39, 109–114. (In Chinese) [Google Scholar]
  12. Colbert, J.; Chuang, I.-T.; Sila-Nowicka, K. Measuring Spatial Inequality of Urban Park Accessibility and Utilisation: A Case Study of Public Housing Developments in Auckland, New Zealand. Landsc. Urban Plan. 2024, 247, 105070. [Google Scholar] [CrossRef]
  13. Jiang, N.; Ao, C.; Long, Y.; Wei, Y.; Xu, L.; Lei, B.; Mao, B. Exploring the Change in the Heterogeneity of Public Preferences for Air Quality Improvement Policies before and after the COVID-19 Pandemic: Comparative Results from Latent Class Model Analysis. Environ. Dev. Sustain. 2024, 26, 31121–31145. [Google Scholar] [CrossRef]
  14. Baxevani, M.; Tsiotas, D.; Kolkos, G.; Zafeiriou, E.; Arabatzis, G. Peri-Urban and Urban Green Space Management and Planning: The Case of Thessaloniki, Greece. Land 2024, 13, 1235. [Google Scholar] [CrossRef]
  15. Suárez, M.; Rieiro-Díaz, A.M.; Alba, D.; Langemeyer, J.; Gómez-Baggethun, E.; Ametzaga-Arregi, I. Urban Resilience through Green Infrastructure: A Framework for Policy Analysis Applied to Madrid, Spain. Landsc. Urban Plan. 2024, 241, 104923. [Google Scholar] [CrossRef]
  16. Rogatka, K.; Starczewski, T.; Kowalski, M. Urban Resilience in Spatial Planning of Polish Cities—True or False? Transformational Perspective. Land Use Policy 2021, 101, 105172. [Google Scholar] [CrossRef]
  17. Hegetschweiler, K.T.; Wartmann, F.M.; Dubernet, I.; Fischer, C.; Hunziker, M. Urban Forest Usage and Perception of Ecosystem Services—A Comparison between Teenagers and Adults. Urban For. Urban Green. 2022, 74, 127624. [Google Scholar] [CrossRef]
  18. Enssle, F.; Kabisch, N. Urban Green Spaces for the Social Interaction, Health and Well-Being of Older People-An Integrated View of Urban Ecosystem Services and Socio-Environmental Justice. Environ. Sci. Policy 2020, 109, 36–44. [Google Scholar] [CrossRef]
  19. Zhou, K.; Tan, R. Understanding the Structure of Public Perceptions towards Urban Green Spaces: A Mixed-Method Investigation. Urban For. Urban Green. 2024, 101, 128496. [Google Scholar] [CrossRef]
  20. Stepniewska, M. The Capacity of Urban Parks for Providing Regulating and Cultural Ecosystem Services versus Their Social Perception. Land Use Policy 2021, 111, 105778. [Google Scholar] [CrossRef]
  21. Chen, C.; Deng, W.; Ignatieva, M.; Bi, L.; Du, A.; Yang, L. Synergy of Urban Green Space Planning and Ecosystem Services Provision: A Longitudinal Exploration of China’s Development. Urban For. Urban Green. 2023, 86, 127997. [Google Scholar] [CrossRef]
  22. Daily, G.C. Nature’s Services: Societal Dependence on Natural Ecosystems (1997). In Nature’s Services: Societal Dependence on Natural Ecosystems (1997); Yale University Press: London, UK, 2013; pp. 454–464. ISBN 978-0-300-18847-9. [Google Scholar]
  23. Costanza, R.; d’Arge, R.; de Groot, R.; Farber, S.; Grasso, M.; Hannon, B.; Limburg, K.; Naeem, S.; O’Neill, R.V.; Paruelo, J.; et al. The Value of the World’s Ecosystem Services and Natural Capital. Nature 1997, 387, 253–260. [Google Scholar] [CrossRef]
  24. Haines-Young, R.; Potschin-Young, M. The Links between Biodiversity, Ecosystem Service and Human Well-Being. In Ecosystem Ecology: A New Synthesis; Cambridge University Press: Cambridge, UK, 2010; pp. 110–139. ISBN 978-0-521-51349-4. [Google Scholar]
  25. Cortinovis, C.; Geneletti, D. A Framework to Explore the Effects of Urban Planning Decisions on Regulating Ecosystem Services in Cities. Ecosyst. Serv. 2019, 38, 100946. [Google Scholar] [CrossRef]
  26. Langemeyer, J.; Connolly, J.J.T. Weaving Notions of Justice into Urban Ecosystem Services Research and Practice. Environ. Sci. Policy 2020, 109, 1–14. [Google Scholar] [CrossRef]
  27. Dick, J.; Turkelboom, F.; Woods, H.; Iniesta-Arandia, I.; Primmer, E.; Saarela, S.-R.; Bezák, P.; Mederly, P.; Leone, M.; Verheyden, W.; et al. Stakeholders’ Perspectives on the Operationalisation of the Ecosystem Service Concept: Results from 27 Case Studies. Ecosyst. Serv. 2018, 29, 552–565. [Google Scholar] [CrossRef]
  28. Valencia Torres, A.; Tiwari, C.; Atkinson, S.F. Progress in Ecosystem Services Research: A Guide for Scholars and Practitioners. Ecosyst. Serv. 2021, 49, 101267. [Google Scholar] [CrossRef]
  29. Sun, Y.; Liu, D.; Wang, P. Urban Simulation Incorporating Coordination Relationships of Multiple Ecosystem Services. Sustain. Cities Soc. 2022, 76, 103432. [Google Scholar] [CrossRef]
  30. Syrbe, R.-U.; Neumann, I.; Grunewald, K.; Brzoska, P.; Louda, J.; Kochan, B.; Machac, J.; Dubova, L.; Meyer, P.; Brabec, J.; et al. The Value of Urban Nature in Terms of Providing Ecosystem Services Related to Health and Well-Being: An Empirical Comparative Pilot Study of Cities in Germany and the Czech Republic. Land 2021, 10, 341. [Google Scholar] [CrossRef]
  31. Hu, Z.; Yang, X.; Yang, J.; Yuan, J.; Zhang, Z. Linking Landscape Pattern, Ecosystem Service Value, and Human Well-Being in Xishuangbanna, Southwest China: Insights from a Coupling Coordination Model. Glob. Ecol. Conserv. 2021, 27, e01583. [Google Scholar] [CrossRef]
  32. Kelfve, S.; Kivi, M.; Johansson, B.; Lindwall, M. Going Web or Staying Paper? The Use of Web-Surveys among Older People. BMC Med. Res. Methodol. 2020, 20, 252. [Google Scholar] [CrossRef]
  33. Knight, S.J.; McClean, C.J.; White, P.C.L. The Importance of Ecological Quality of Public Green and Blue Spaces for Subjective Well-Being. Landsc. Urban Plan. 2022, 226, 104510. [Google Scholar] [CrossRef]
  34. Fagerholm, N.; Eilola, S.; Arki, V. Outdoor Recreation and Nature’s Contribution to Well-Being in a Pandemic Situation—Case Turku, Finland. Urban For. Urban Green. 2021, 64, 127257. [Google Scholar] [CrossRef] [PubMed]
  35. Xia, T.; Zhao, B.; Yu, J.; Gao, Y.; Wang, X.; Mao, Y.; Zhang, J. Original Making Residential Green Space Exposure Evaluation More Accurate: A Composite Assessment Framework That Integrates Objective and Subjective Indicators. Urban For. Urban Green. 2024, 95, 128290. [Google Scholar] [CrossRef]
  36. Kukulska-Koziel, A.; Noszczyk, T.; Gorzelany, J.; Mlocek, W. Greenery in Times of Crisis: Accessibility, Residents ’ Travel Preferences and the Impact of Travel Time. Land Use Pol. 2024, 141, 107130. [Google Scholar] [CrossRef]
  37. Ke, Y.; Bai, Y.; Ali, M.; Ashraf, A.; Li, M.; Li, B. Exploring Residents’ Perceptions of Ecosystem Services in Nature Reserves to Guide Protection and Management. Ecol. Indic. 2024, 158, 111535. [Google Scholar] [CrossRef]
  38. Wales, M.; Hoff, E.; Mårtensson, F.; Englund, J.-E. The Quality of Swedish Adolescents’ Outdoor Life and Its Relationship with Self-Esteem and Well-Being. Landsc. Urban Plan. 2024, 246, 105023. [Google Scholar] [CrossRef]
  39. Isabella, D.M.; Claudia, B.; Giulia, C.M.; Alessandro, C.; Alessandro, P. Citizens? Use of Public Urban Green Spaces at the Time of the COVID-19 Pandemic in Italy. Urban For. Urban Green. 2022, 77, 127739. [Google Scholar] [CrossRef]
  40. Lin, D.; Sun, Y.; Yang, Y.; Han, Y.; Xu, C. Urban Park Use and Self-Reported Physical, Mental, and Social Health during the COVID-19 Pandemic: An on-Site Survey in Beijing, China. Urban For. Urban Green. 2023, 79, 127804. [Google Scholar] [CrossRef]
  41. Yin, C.; Yang, C. The Moderating Effects of Mobile Applications on the Use of Urban Green Space and Mental Health of Older People: A Mixed-Method Investigation in Hong Kong. Urban For. Urban Green. 2024, 91, 128182. [Google Scholar] [CrossRef]
  42. Liu, K.; Liu, Y.; Kou, Y. Study on Construction Safety Management in Megaprojects from the Perspective of Resilient Governance. Saf. Sci. 2024, 173, 106442. [Google Scholar] [CrossRef]
  43. Bustamante, G.; Guzman, V.; Kobayashi, L.C.; Finlay, J. Mental Health and Well-Being in Times of COVID-19: A Mixed-Methods Study of the Role of Neighborhood Parks, Outdoor Spaces, and Nature among US Older Adults. Health Place 2022, 76, 102813. [Google Scholar] [CrossRef]
  44. Collins, C.M.T.; Cook-Monie, I.; Raum, S. What Do People Know? Ecosystem Services, Public Perception and Sustainable Management of Urban Park Trees in London, U.K. Urban For. Urban Green. 2019, 43, 126362. [Google Scholar] [CrossRef]
  45. Xu, T.; Aini, A.M.; Nordin, N.A. Utilizing Regression Model to Characterize the Impact of Urban Green Space Features on the Subjective Well-Being of Older Adults. Heliyon 2024, 10, e35567. [Google Scholar] [CrossRef] [PubMed]
  46. Egea-Cariñanos, P.; Calaza-Martínez, P.; López Roche, D.; Cariñanos, P. Uses, Attitudes and Perceptions of Urban Green Spaces According to the Sociodemographic Profile: An Exploratory Analysis in Spain. Cities 2024, 150, 104996. [Google Scholar] [CrossRef]
  47. Roe, J.J.; Aspinall, P.A.; Ward Thompson, C. Coping with Stress in Deprived Urban Neighborhoods: What Is the Role of Green Space According to Life Stage? Front. Psychol. 2017, 8, 1760. [Google Scholar] [CrossRef] [PubMed]
  48. Uchiyama, Y.; Kohsaka, R. Access and Use of Green Areas during the COVID-19 Pandemic: Green Infrastructure Management in the “New Normal”. Sustainability 2020, 12, 9842. [Google Scholar] [CrossRef]
  49. Venter, Z.S.; Barton, D.N.; Gundersen, V.; Figari, H.; Nowell, M. Urban Nature in a Time of Crisis: Recreational Use of Green Space Increases during the COVID-19 Outbreak in Oslo, Norway. Environ. Res. Lett. 2020, 15, 104075. [Google Scholar] [CrossRef]
  50. Odhengo, P.; Lutta, A.I.; Osano, P.; Opiyo, R. Urban Green Spaces in Rapidly Urbanizing Cities: A Socio-Economic Valuation of Nairobi City, Kenya. Cities 2024, 155, 105430. [Google Scholar] [CrossRef]
  51. Starczewski, T.; Rogatka, K.; Kukulska-Kozieł, A.; Noszczyk, T.; Cegielska, K. Urban Green Resilience: Experience from Post-Industrial Cities in Poland. Geosci. Front. 2023, 14, 101560. [Google Scholar] [CrossRef]
  52. Ode Sang, Å.; Sang, N.; Hedblom, M.; Sevelin, G.; Knez, I.; Gunnarsson, B. Are Path Choices of People Moving through Urban Green Spaces Explained by Gender and Age? Implications for Planning and Management. Urban For. Urban Green. 2020, 49, 126628. [Google Scholar] [CrossRef]
Figure 1. Theoretical analysis framework based on the Ecosystem Services Cascade Framework.
Land 14 00983 g001
Figure 2. Time spent in park green space in 2019–2023: comparison of different age groups of city dwellers.
Land 14 00983 g002
Figure 3. Different utilization behaviors grouped by age category: S-comparison between 2019 (a), 2021 (b) and 2023 (c).
Land 14 00983 g003
Table 1. Percentage of sample size obtained from main urban area of Beijing in 2019–2023.
Main Urban AreaNumber of Respondents (2019)Proportion
(2019)
Number of Respondents (2021)Proportion
(2021)
Number of Respondents (2023)Proportion
(2023)
Dongcheng5206.4%4225.2%2523.1%
Xicheng5046.4%6668.2%5046.2%
Chaoyang5046.2%101612.5%2843.5%
Fengtai5606.9%3334.1%1862.3%
Shijingshan4956.1%1782.2%1782.1%
Haidian4395.4%5857.2%5046.2%
Table 2. Demographic characteristics of respondents in 2019–2023.
Frequency201920212023Frequency201920212023
Gender Age
Male1308136981017 years old and below11813932
Female13951582111818–29 years old795644557
Education level101 30–39 years old747792478
Primary school and below36840440–49 years old387540261
Middle school649203650–59 years old298291162
High school10654816960 years old and above374445187
Bachelor degree5241234880
Master degree and above101453468
Table 3. Descriptive analysis.
VariablesMeanMinMaxSD
Ecological well-being (ew_p)3.932150.933
Utilization behaviors (beh_p)2.653171.396
Gender (gen)1.525150.501
Age (age)3.345191.449
Education level (edu)3.792181.371
Monthly disposable income (inc)2.9201102.013
Number of family members (hou)3.118191.179
Self-reported health (hea)3.816160.803
Distance from park green spaces (dis_p)2.573151.242
Table 4. Pairwise comparison of utilization frequency among various age groups from 2019–2023.
2019
Age Group<=>Age GroupRecreational ActivitiesPhysical ExerciseParent–Child ActivitiesLeisure and AestheticPublic OutreachSocial Activities
Young group Middle-aged group0.007 **-----
Young group Elderly group0.000 ***0.002 **-0.000 ***0.042 *0.000 ***
Middle-aged group Elderly group0.001 **--0.000 ***-0.000 ***
2021
Elderly group Middle-aged group------
Elderly group Young group0.027 *--0.037 *--
Middle-aged group Young group-0.025 *----
2023
Elderly group Middle-aged group-0.001 **----
Elderly group Young group0.000 ***0.001 **0.000 ***0.000 ***-0.015 *
Middle-aged group Young group0.000 ***-0.0640.001 **--
*** p < 0.01, ** p < 0.05, * p < 0.1.
Table 5. Results of correlation analysis between respondents’ demographic characteristics and ecological well-being.
ew_pbeh_pgenageeduinchouheadis_p
ew_p1.000
beh_p0.123 ***1.000
gen0.015−0.041 ***1.000
age0.040 ***0.235 ***−0.063 ***1.000
edu−0.031 ***−0.061 ***−0.037 ***−0.151 ***1.000
inc0.021 *−0.002−0.082 ***0.0120.248 ***1.000
hou0.022 *0.034 ***0.000−0.036 ***0.068 ***0.113 ***1.000
hea0.100 ***0.031 ***−0.050 ***−0.116 ***0.037 ***0.048 ***0.085 ***1.000
dis_p−0.005−0.003−0.010−0.053 ***0.0140.0080.019 *0.0051.000
*** p < 0.01, * p < 0.1.
Table 6. Regression results of the utilization behavior of urban green space ecosystem cultural services on the ecological well-being of city dwellers.
VariablesOLS (1)OLS (2)
Ecological well-beingEcological well-being
Utilization behavior0.094 ***0.077 ***
Gender 0.050 ***
Age 0.0141 *
Education level −0.021 ***
Monthly disposable income 0.0122 **
Number of family members 0.007
Self-reported health 0.116 ***
Distance for urban green space −0.002
N81308130
Adj.R20.2940.027
*** p < 0.01, ** p < 0.05, * p < 0.1.
Table 7. Heterogeneity analysis results.
Park Green SpaceCommunity Green Space
VariablesOLS (3)OLS (4)
Ecological well-beingEcological well-being
Utilization behavior0.077 ***0.040 ***
Gender0.050 ***0.023
Age0.0141 *−0.009
Education level−0.021 ***−0.021 **
Monthly disposable income0.0122 **−0.002
Number of family members0.0070.001
Self-reported health0.116 ***0.063 ***
Distance to urban green space−0.002−0.001
YearYESYES
CodeYESYES
N81308130
Adj.R20.0270.280
*** p < 0.01, ** p < 0.05, * p < 0.1.
Table 8. Robustness test result based on adding control variables.
VariablesOLS (3)
Ecological well-being
Utilization behavior0.088 ***
Gender0.062 ***
Age0.012
Education level−0.047 ***
Monthly disposable income0.018 ***
Number of family members0.003
Self-reported health0.102 ***
Distance to park green space0.029 ***
Distance to community green space−0.100 ***
YearYES
CodeYES
N8130
Adj.R20.027
*** p < 0.01.
Disclaimer/Publisher’s Note: The statements, opinions and data contained in all publications are solely those of the individual author(s) and contributor(s) and not of MDPI and/or the editor(s). MDPI and/or the editor(s) disclaim responsibility for any injury to people or property resulting from any ideas, methods, instructions or products referred to in the content.

