
Enhancing Urban Resilience: Stormwater Retention and Evapotranspiration Performance of Green Roofs Under Extreme Rainfall Events


Abstract
1. Introduction
2. Materials and Methods
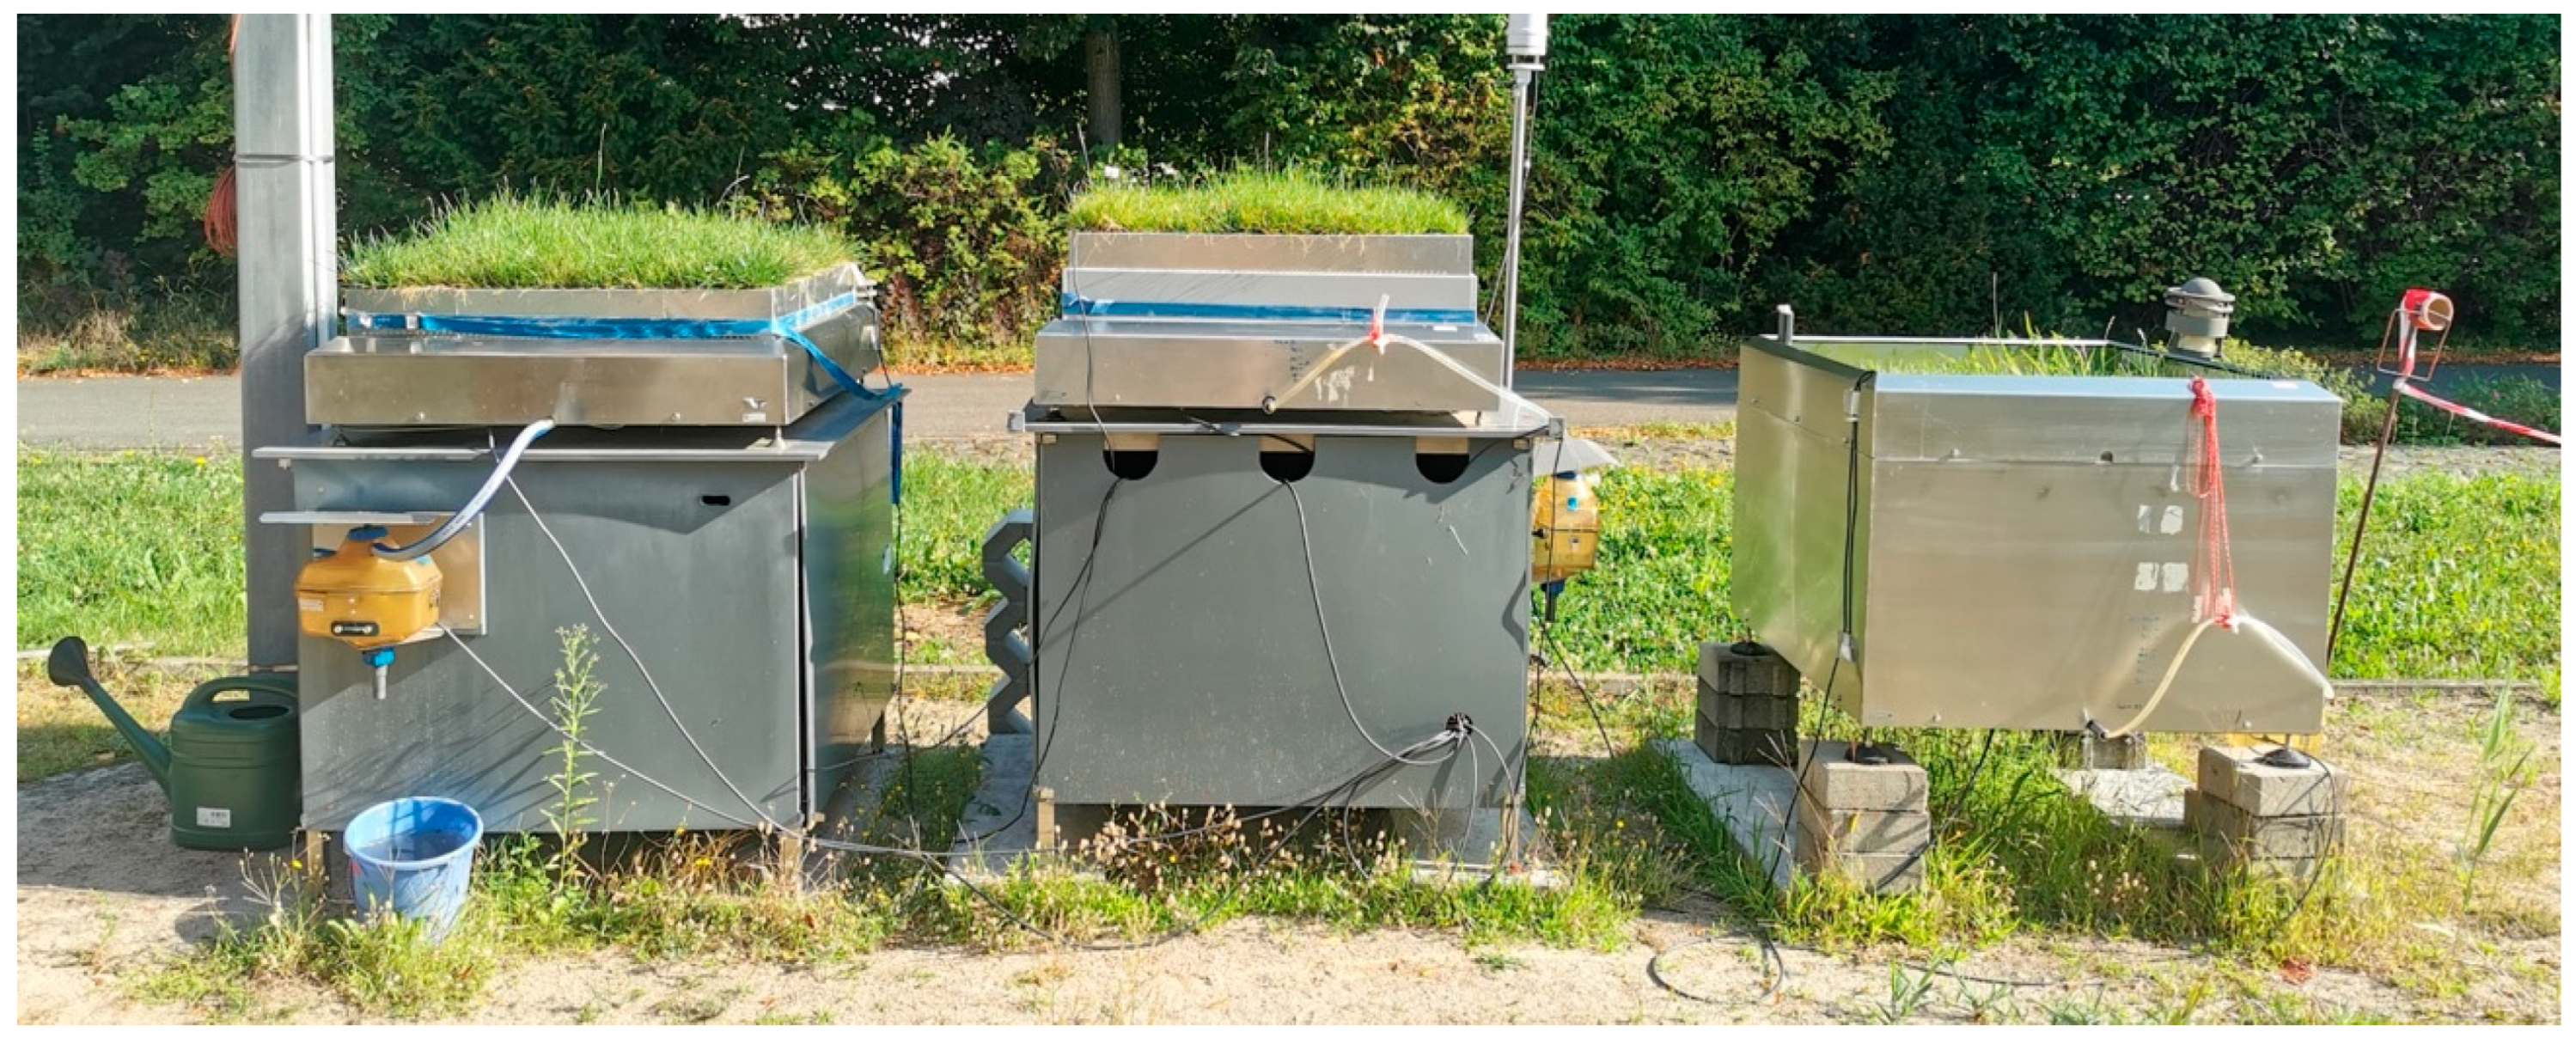
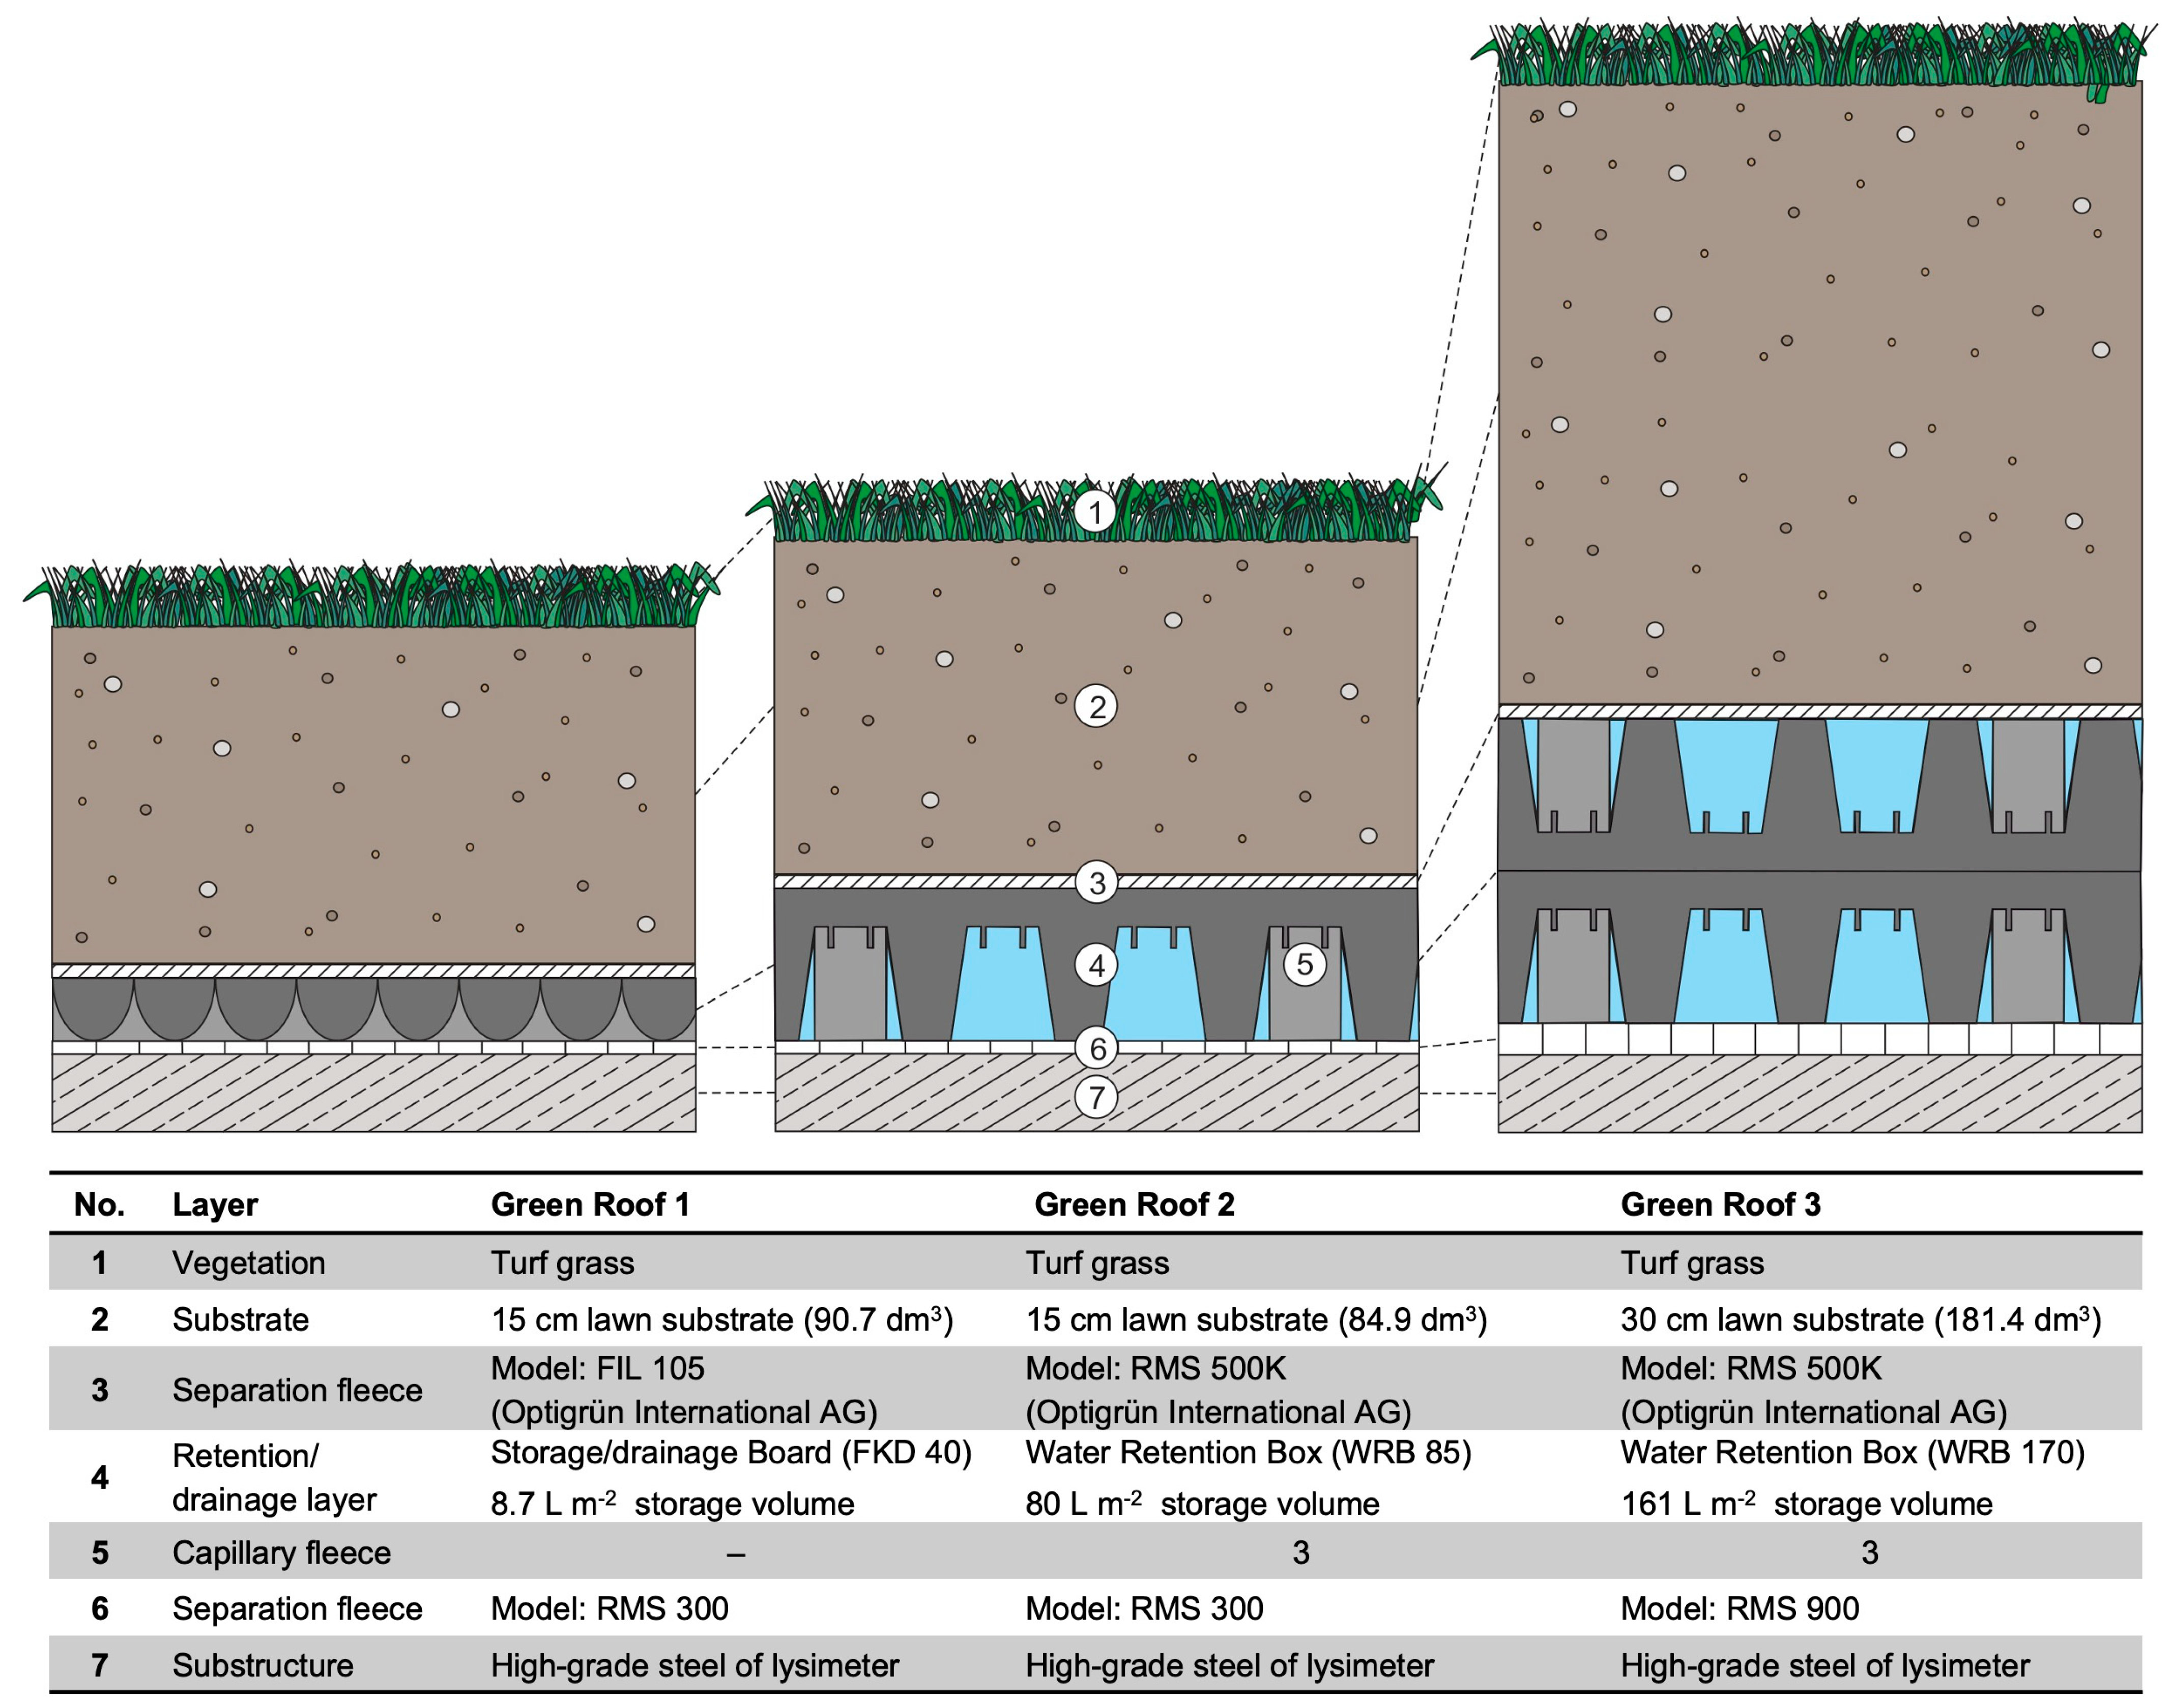
2.1. Experimental Setup
2.2. Experimental Site Conditions
2.3. Experimental Set-Up
2.3.1. Natural Heavy Rainfall Event
2.3.2. Simulated Heavy Rainfall Events
2.4. Data Analysis
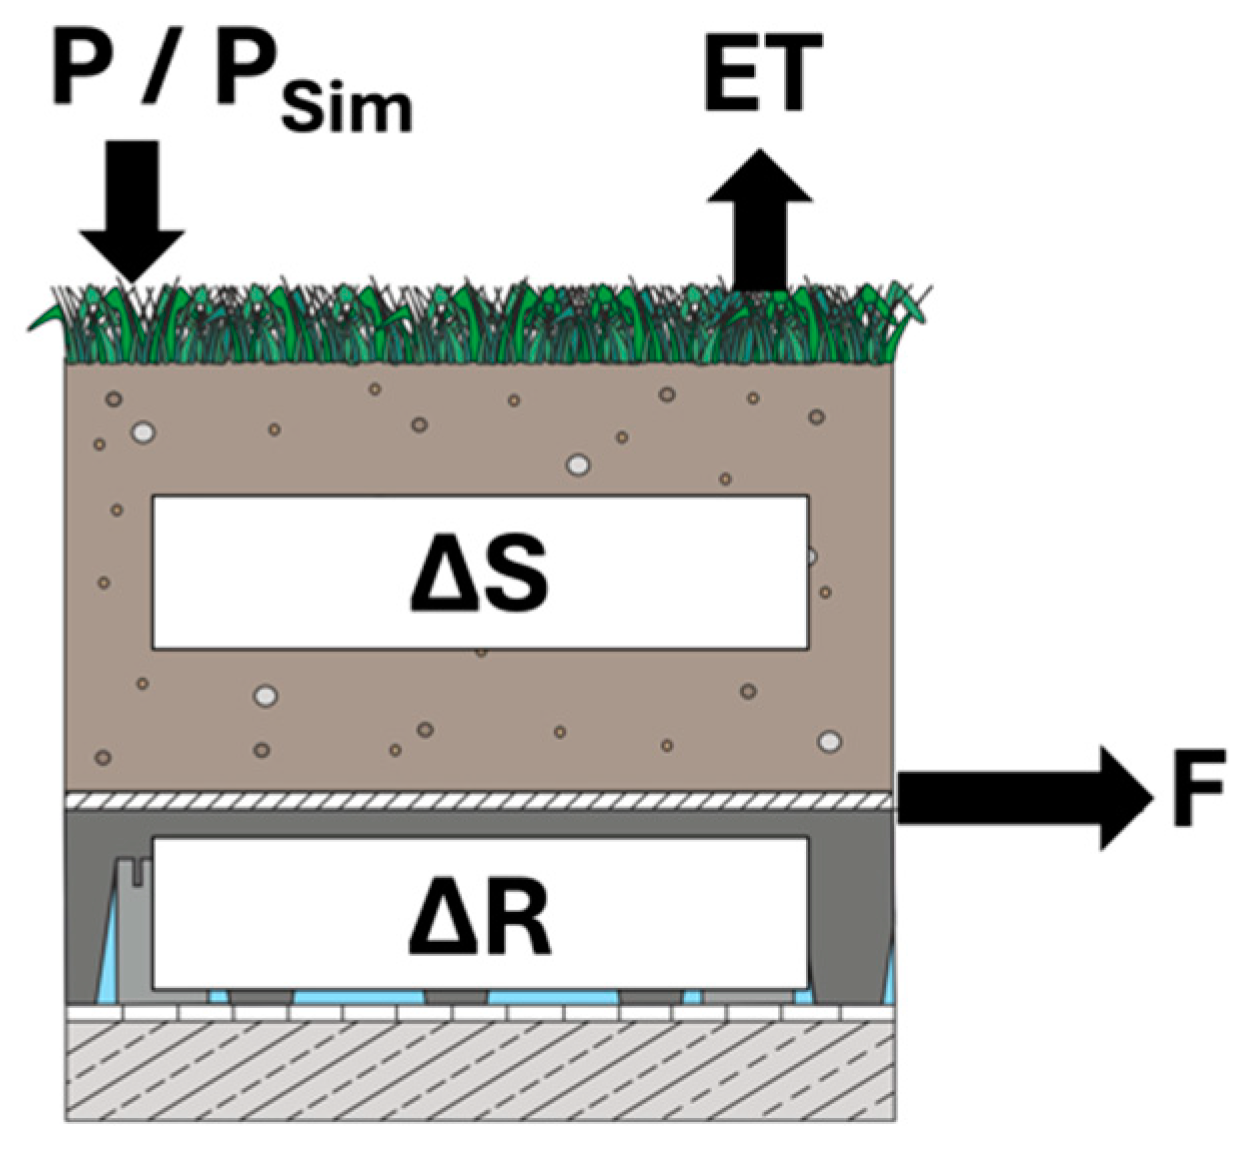
Determining Water Balance Parameters
3. Results and Discussion
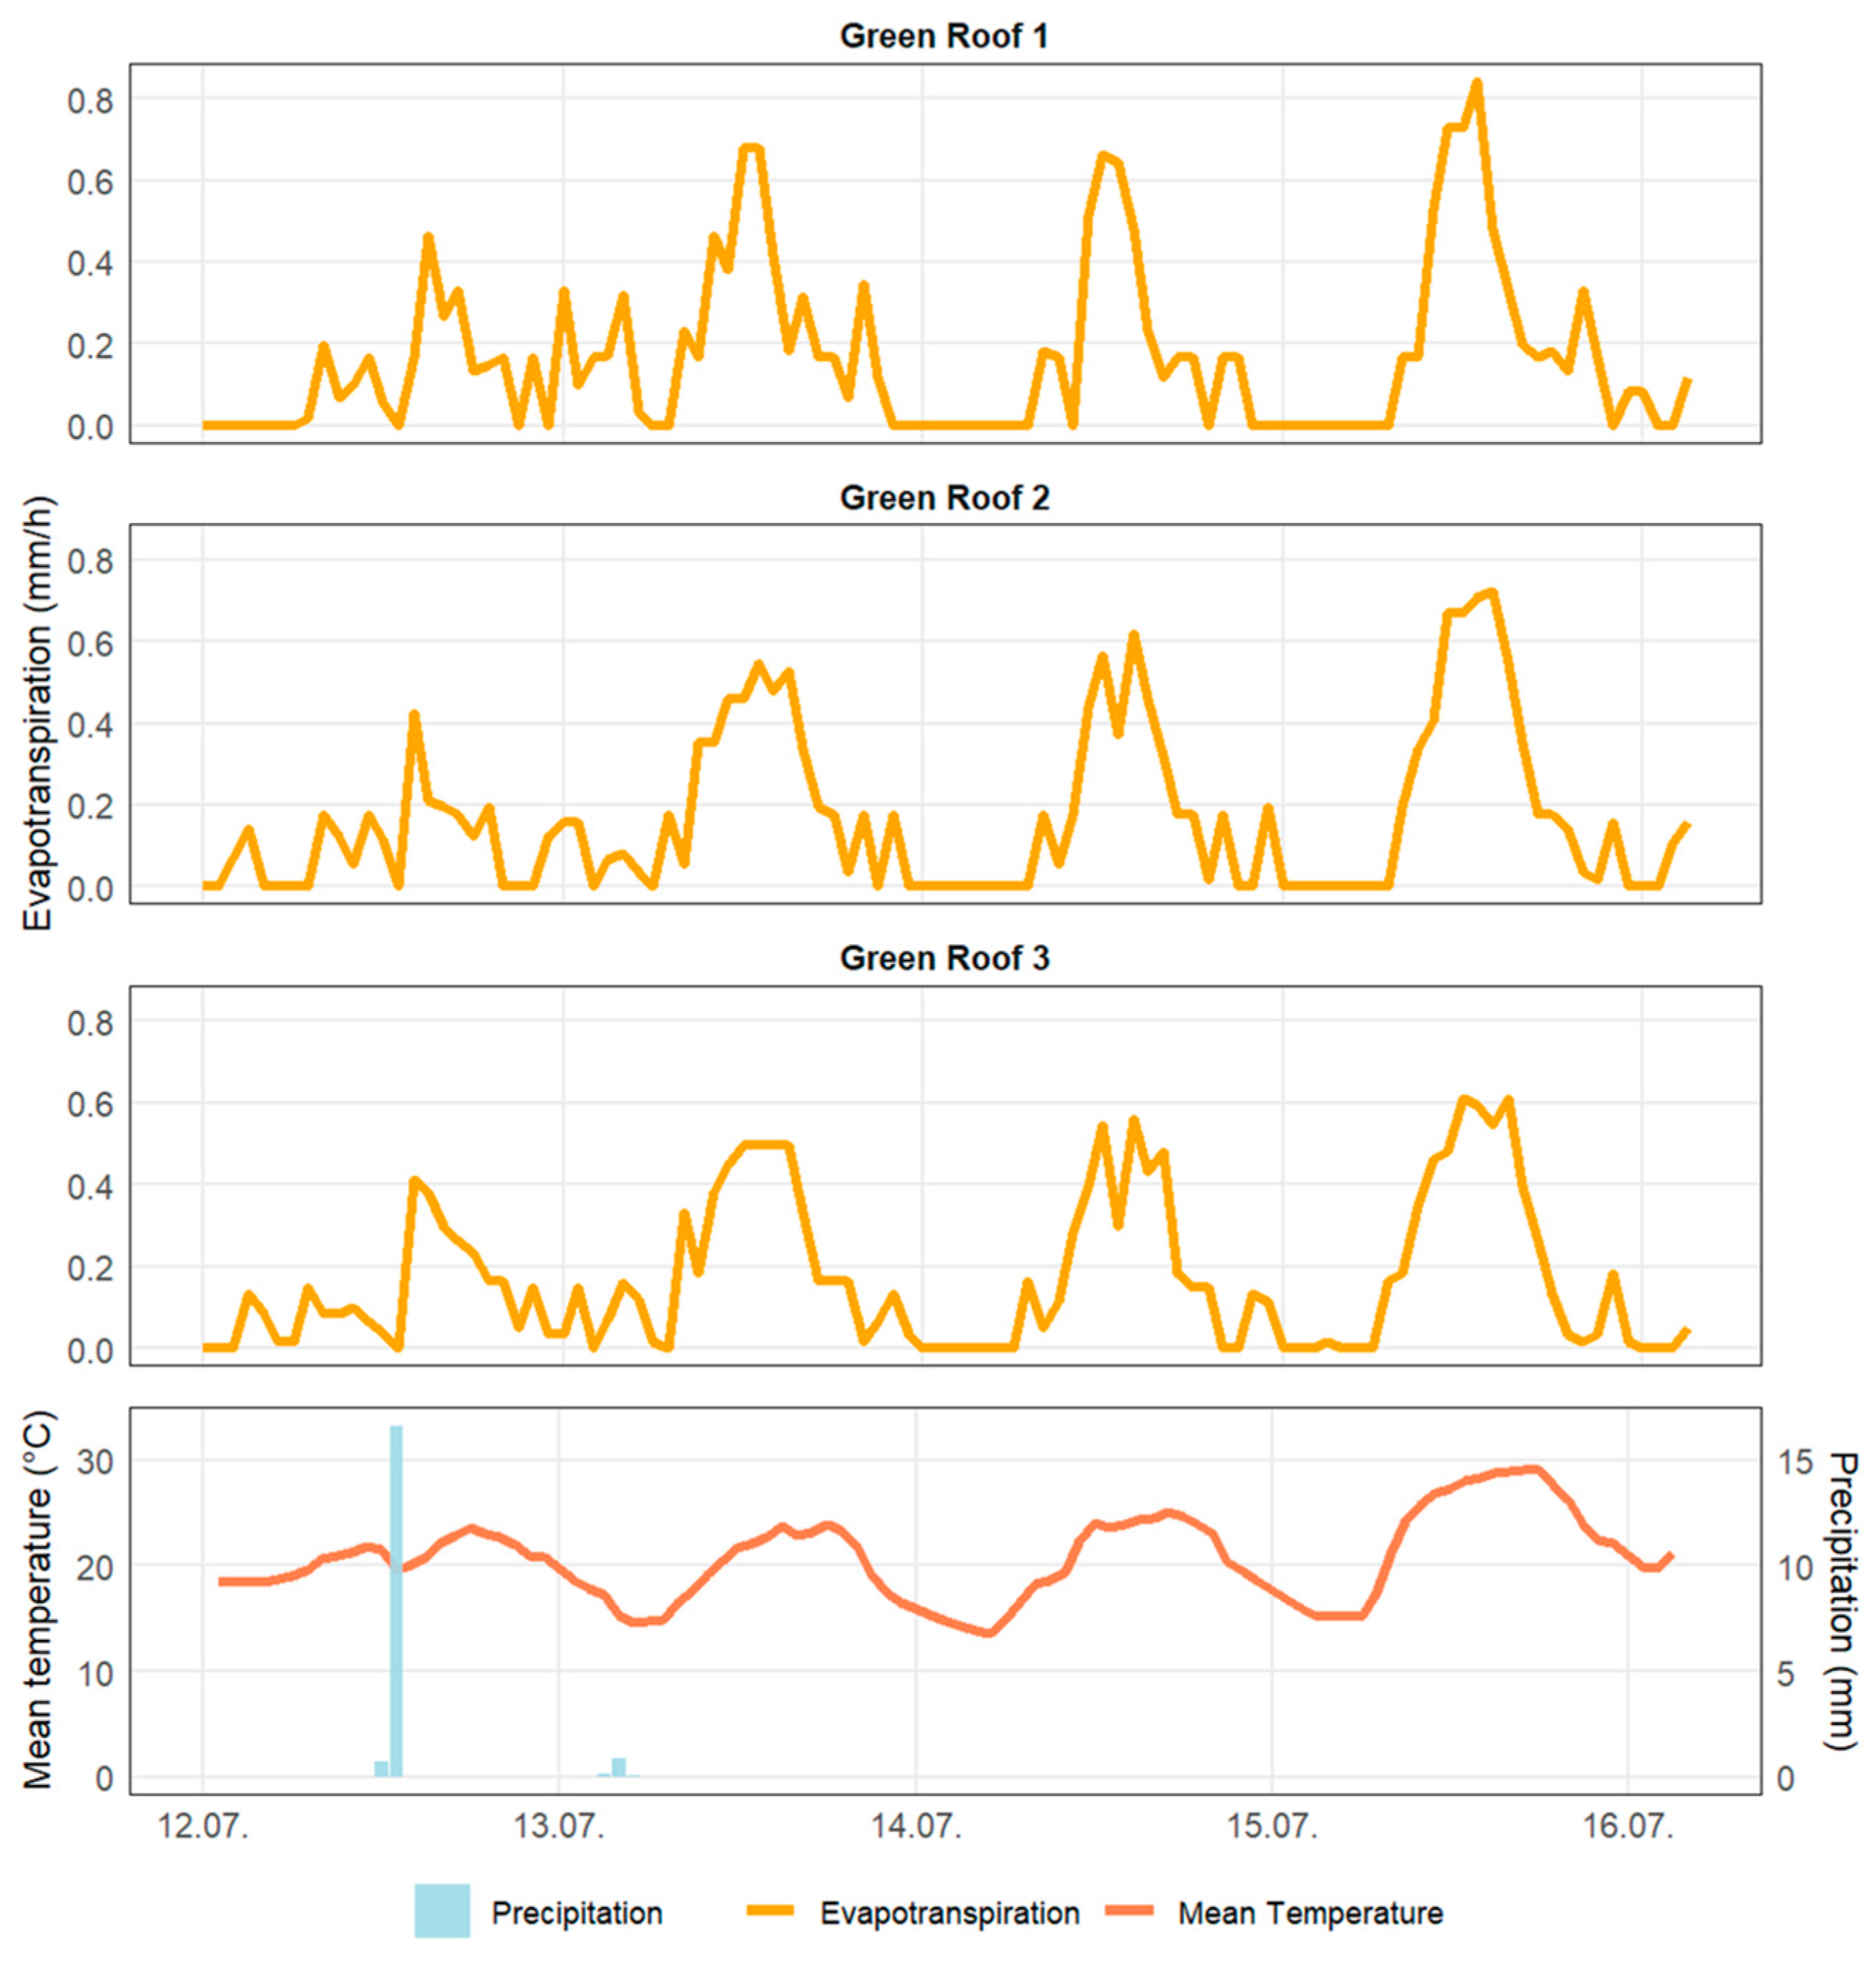
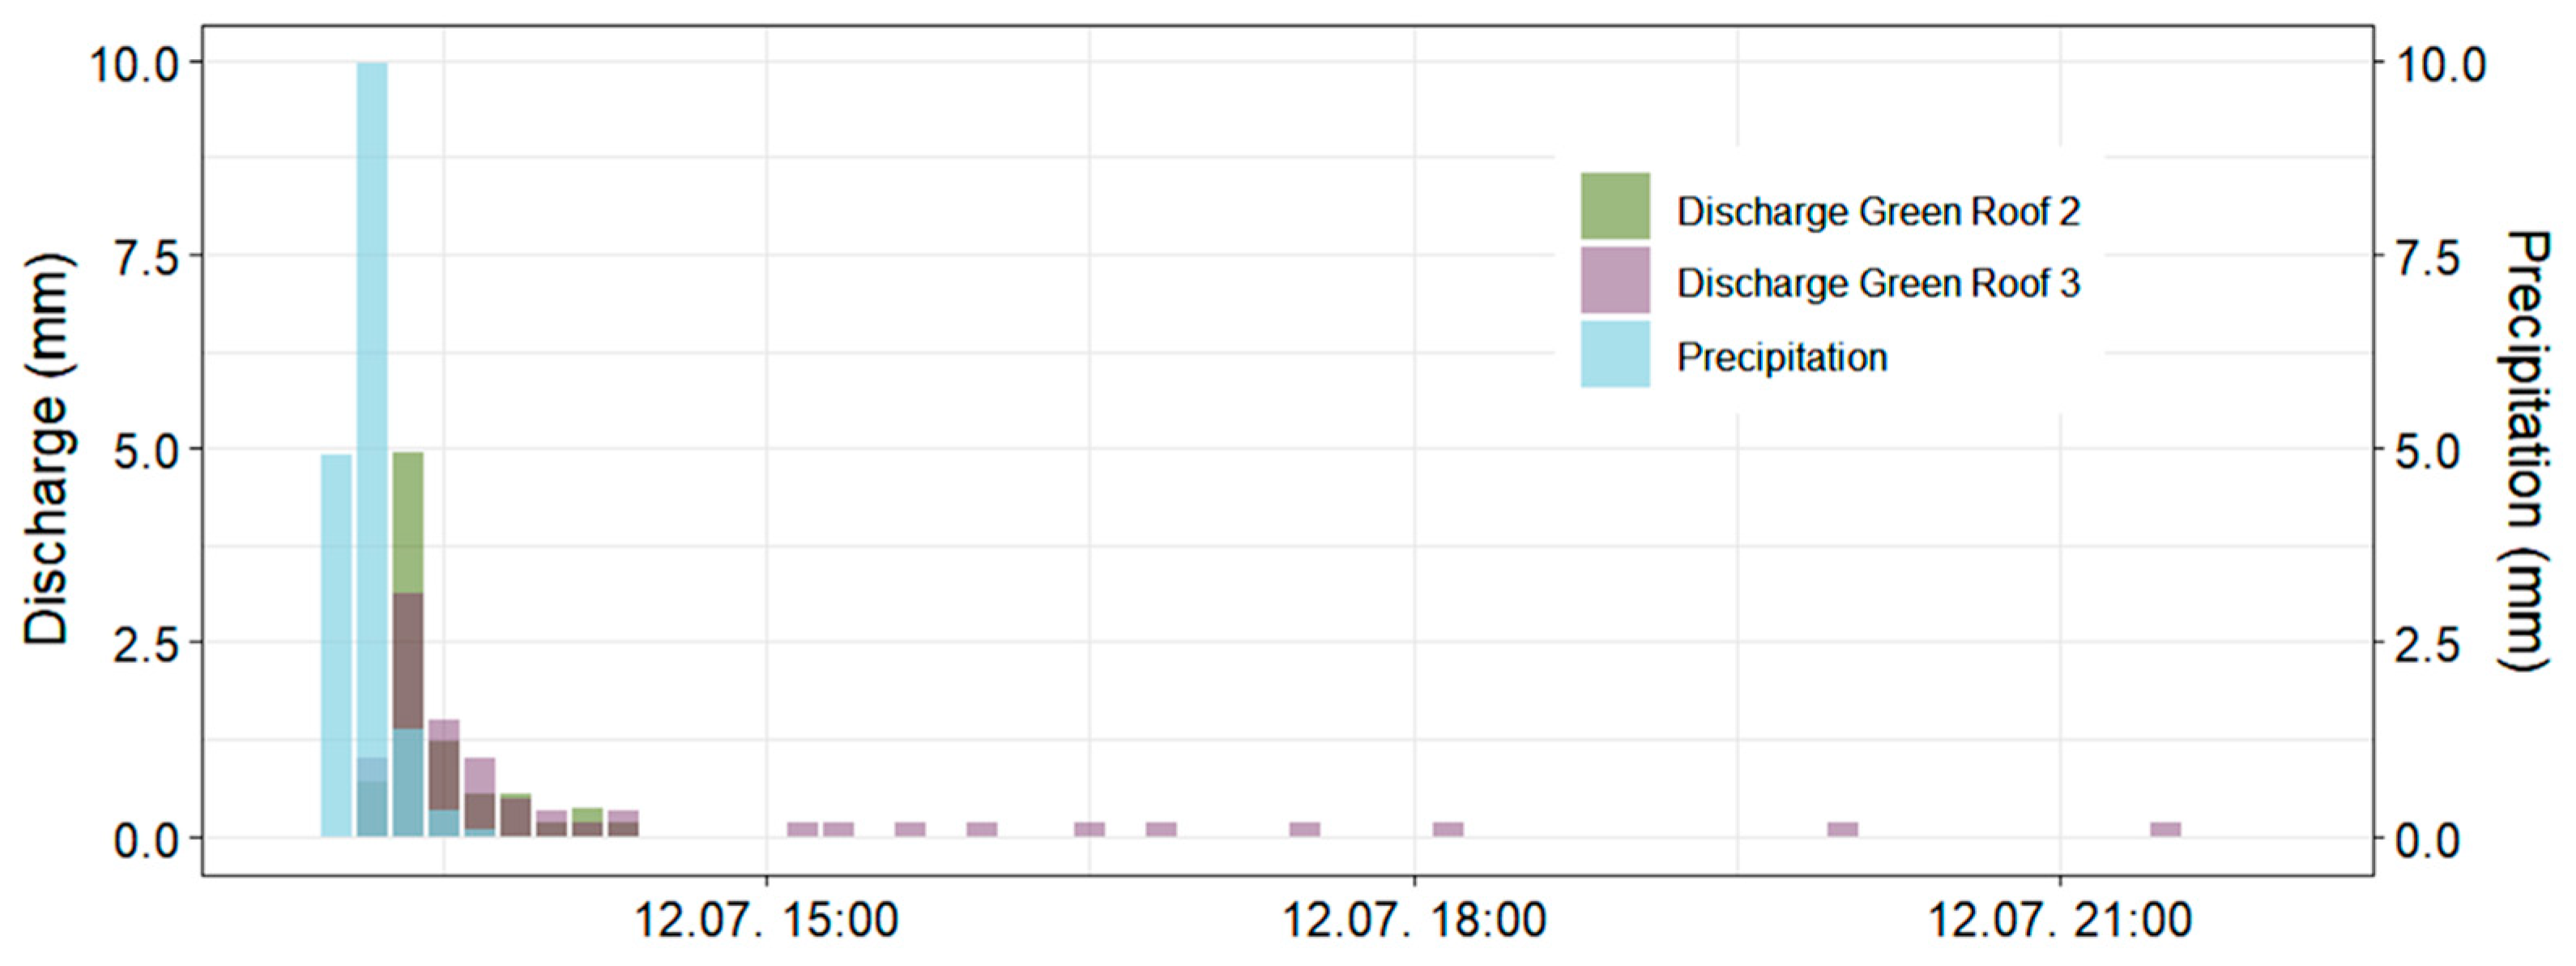
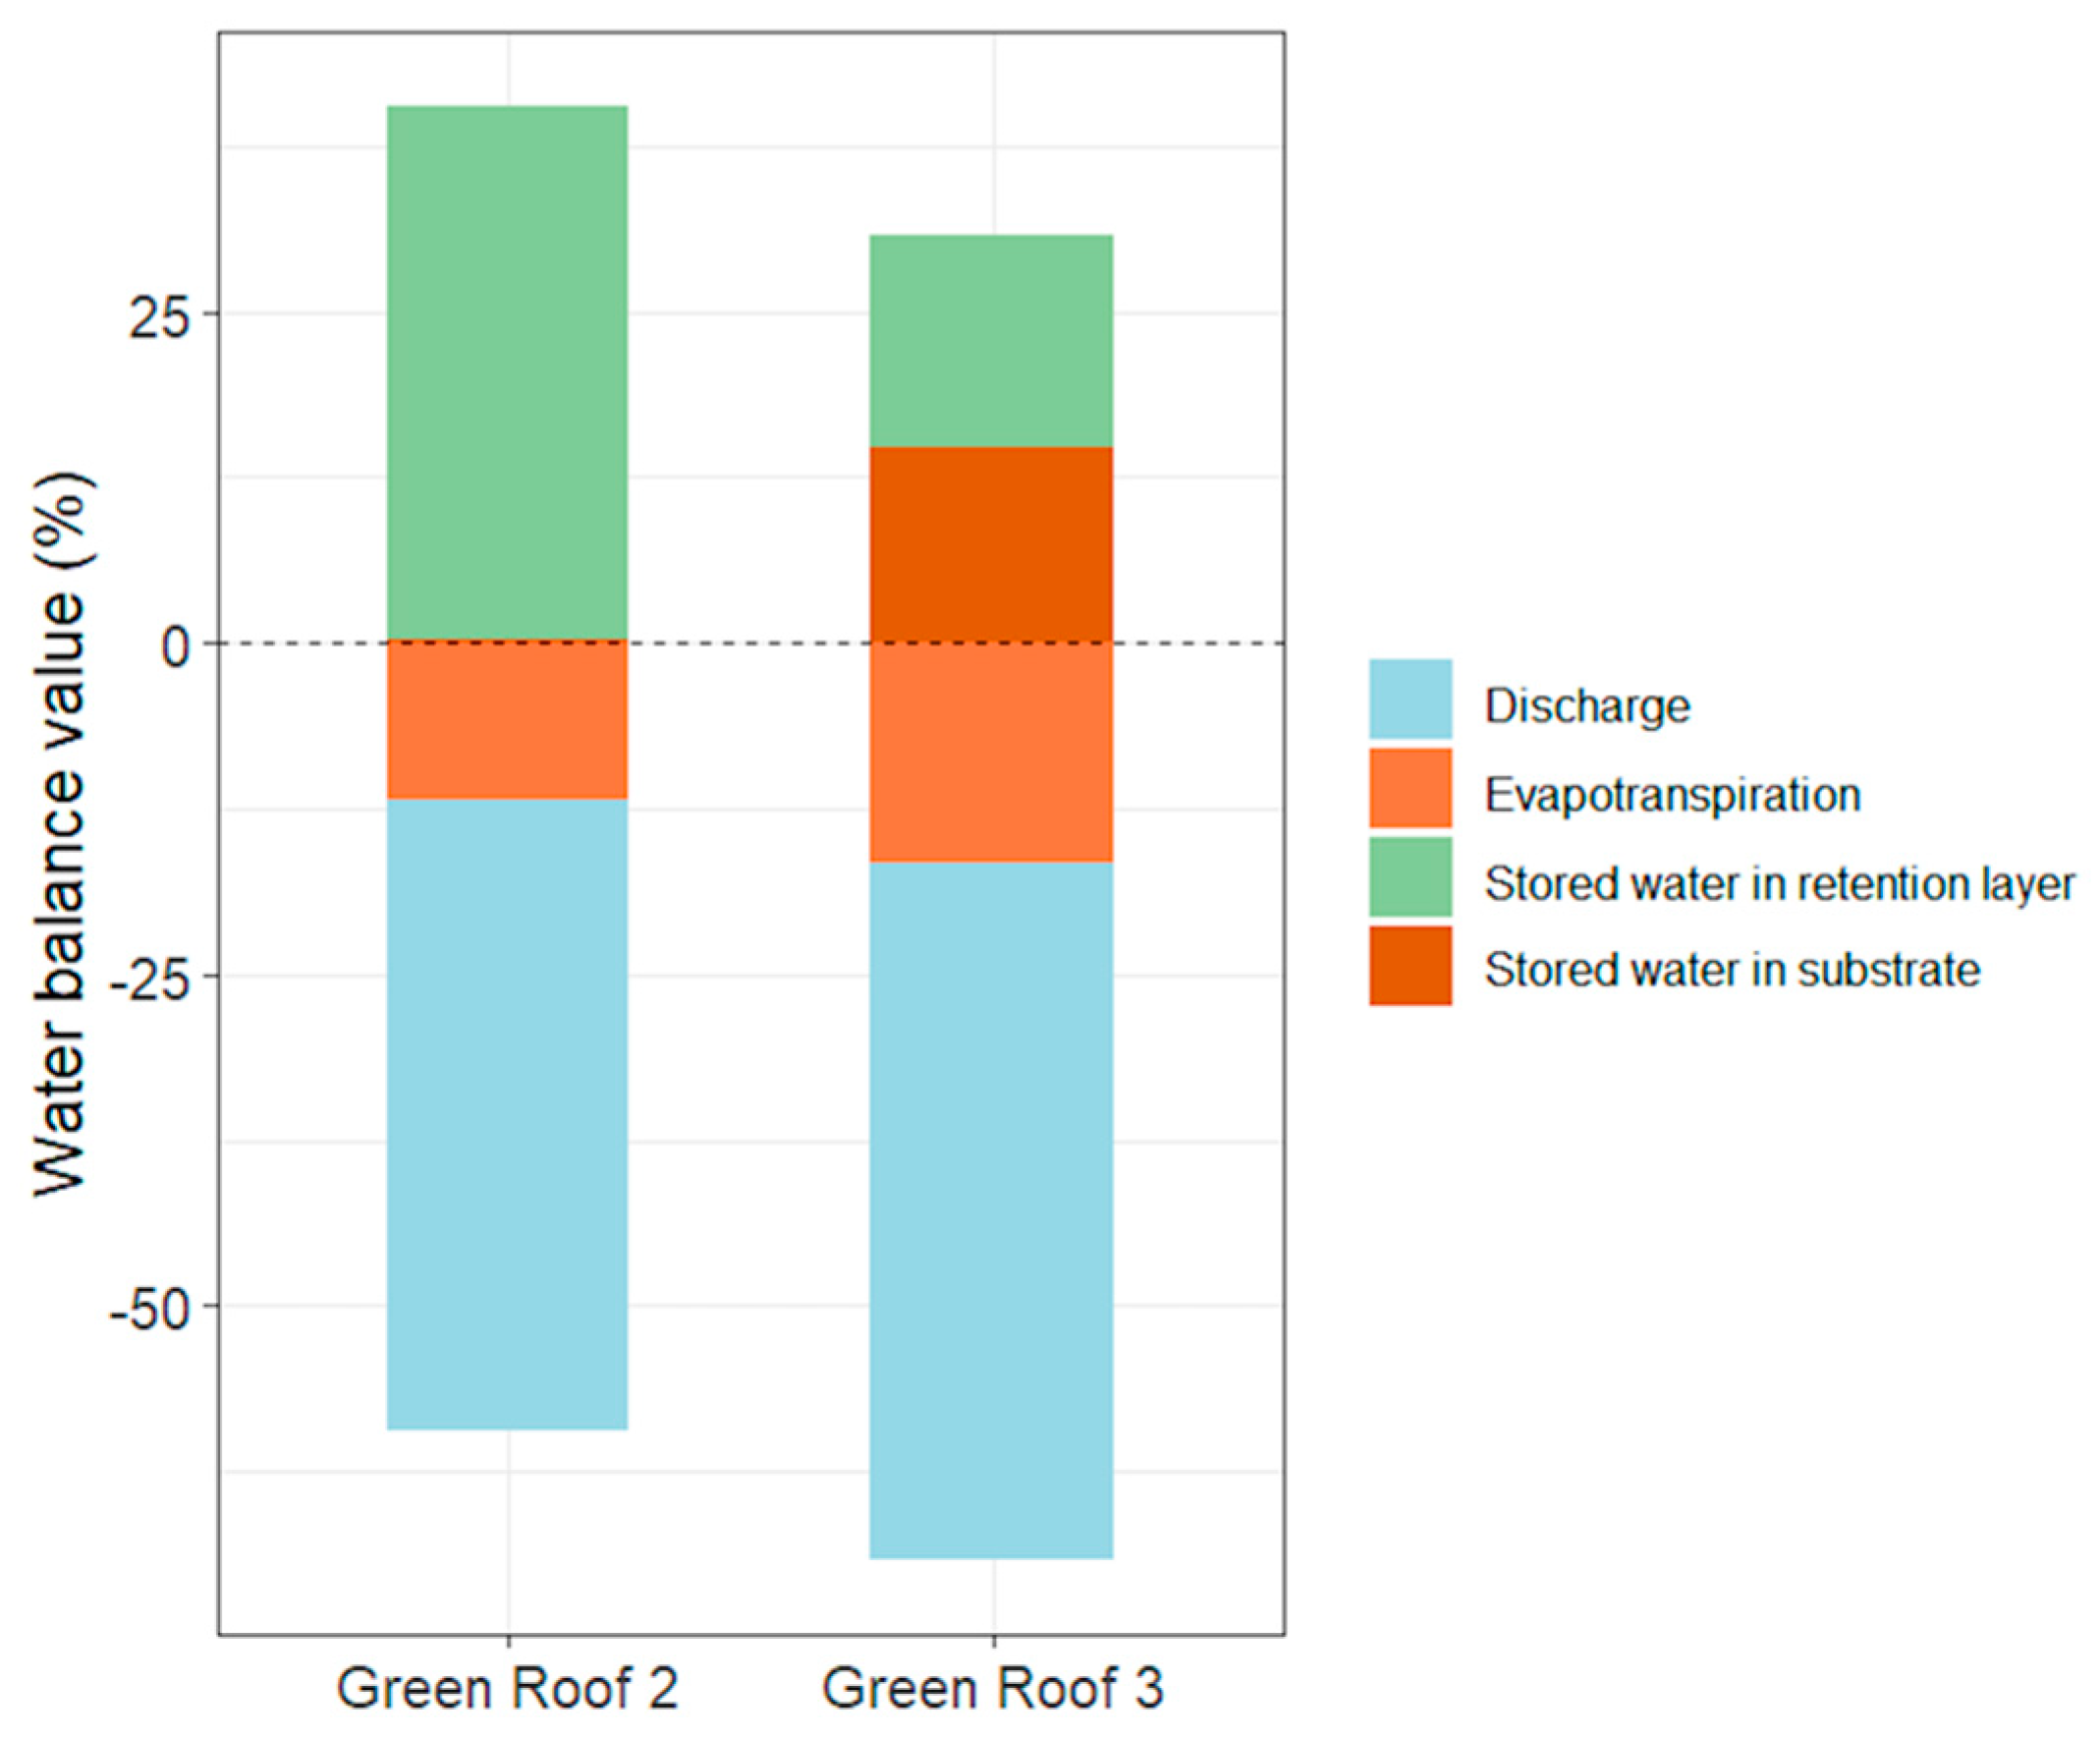
3.1. Natural Heavy Rainfall Event
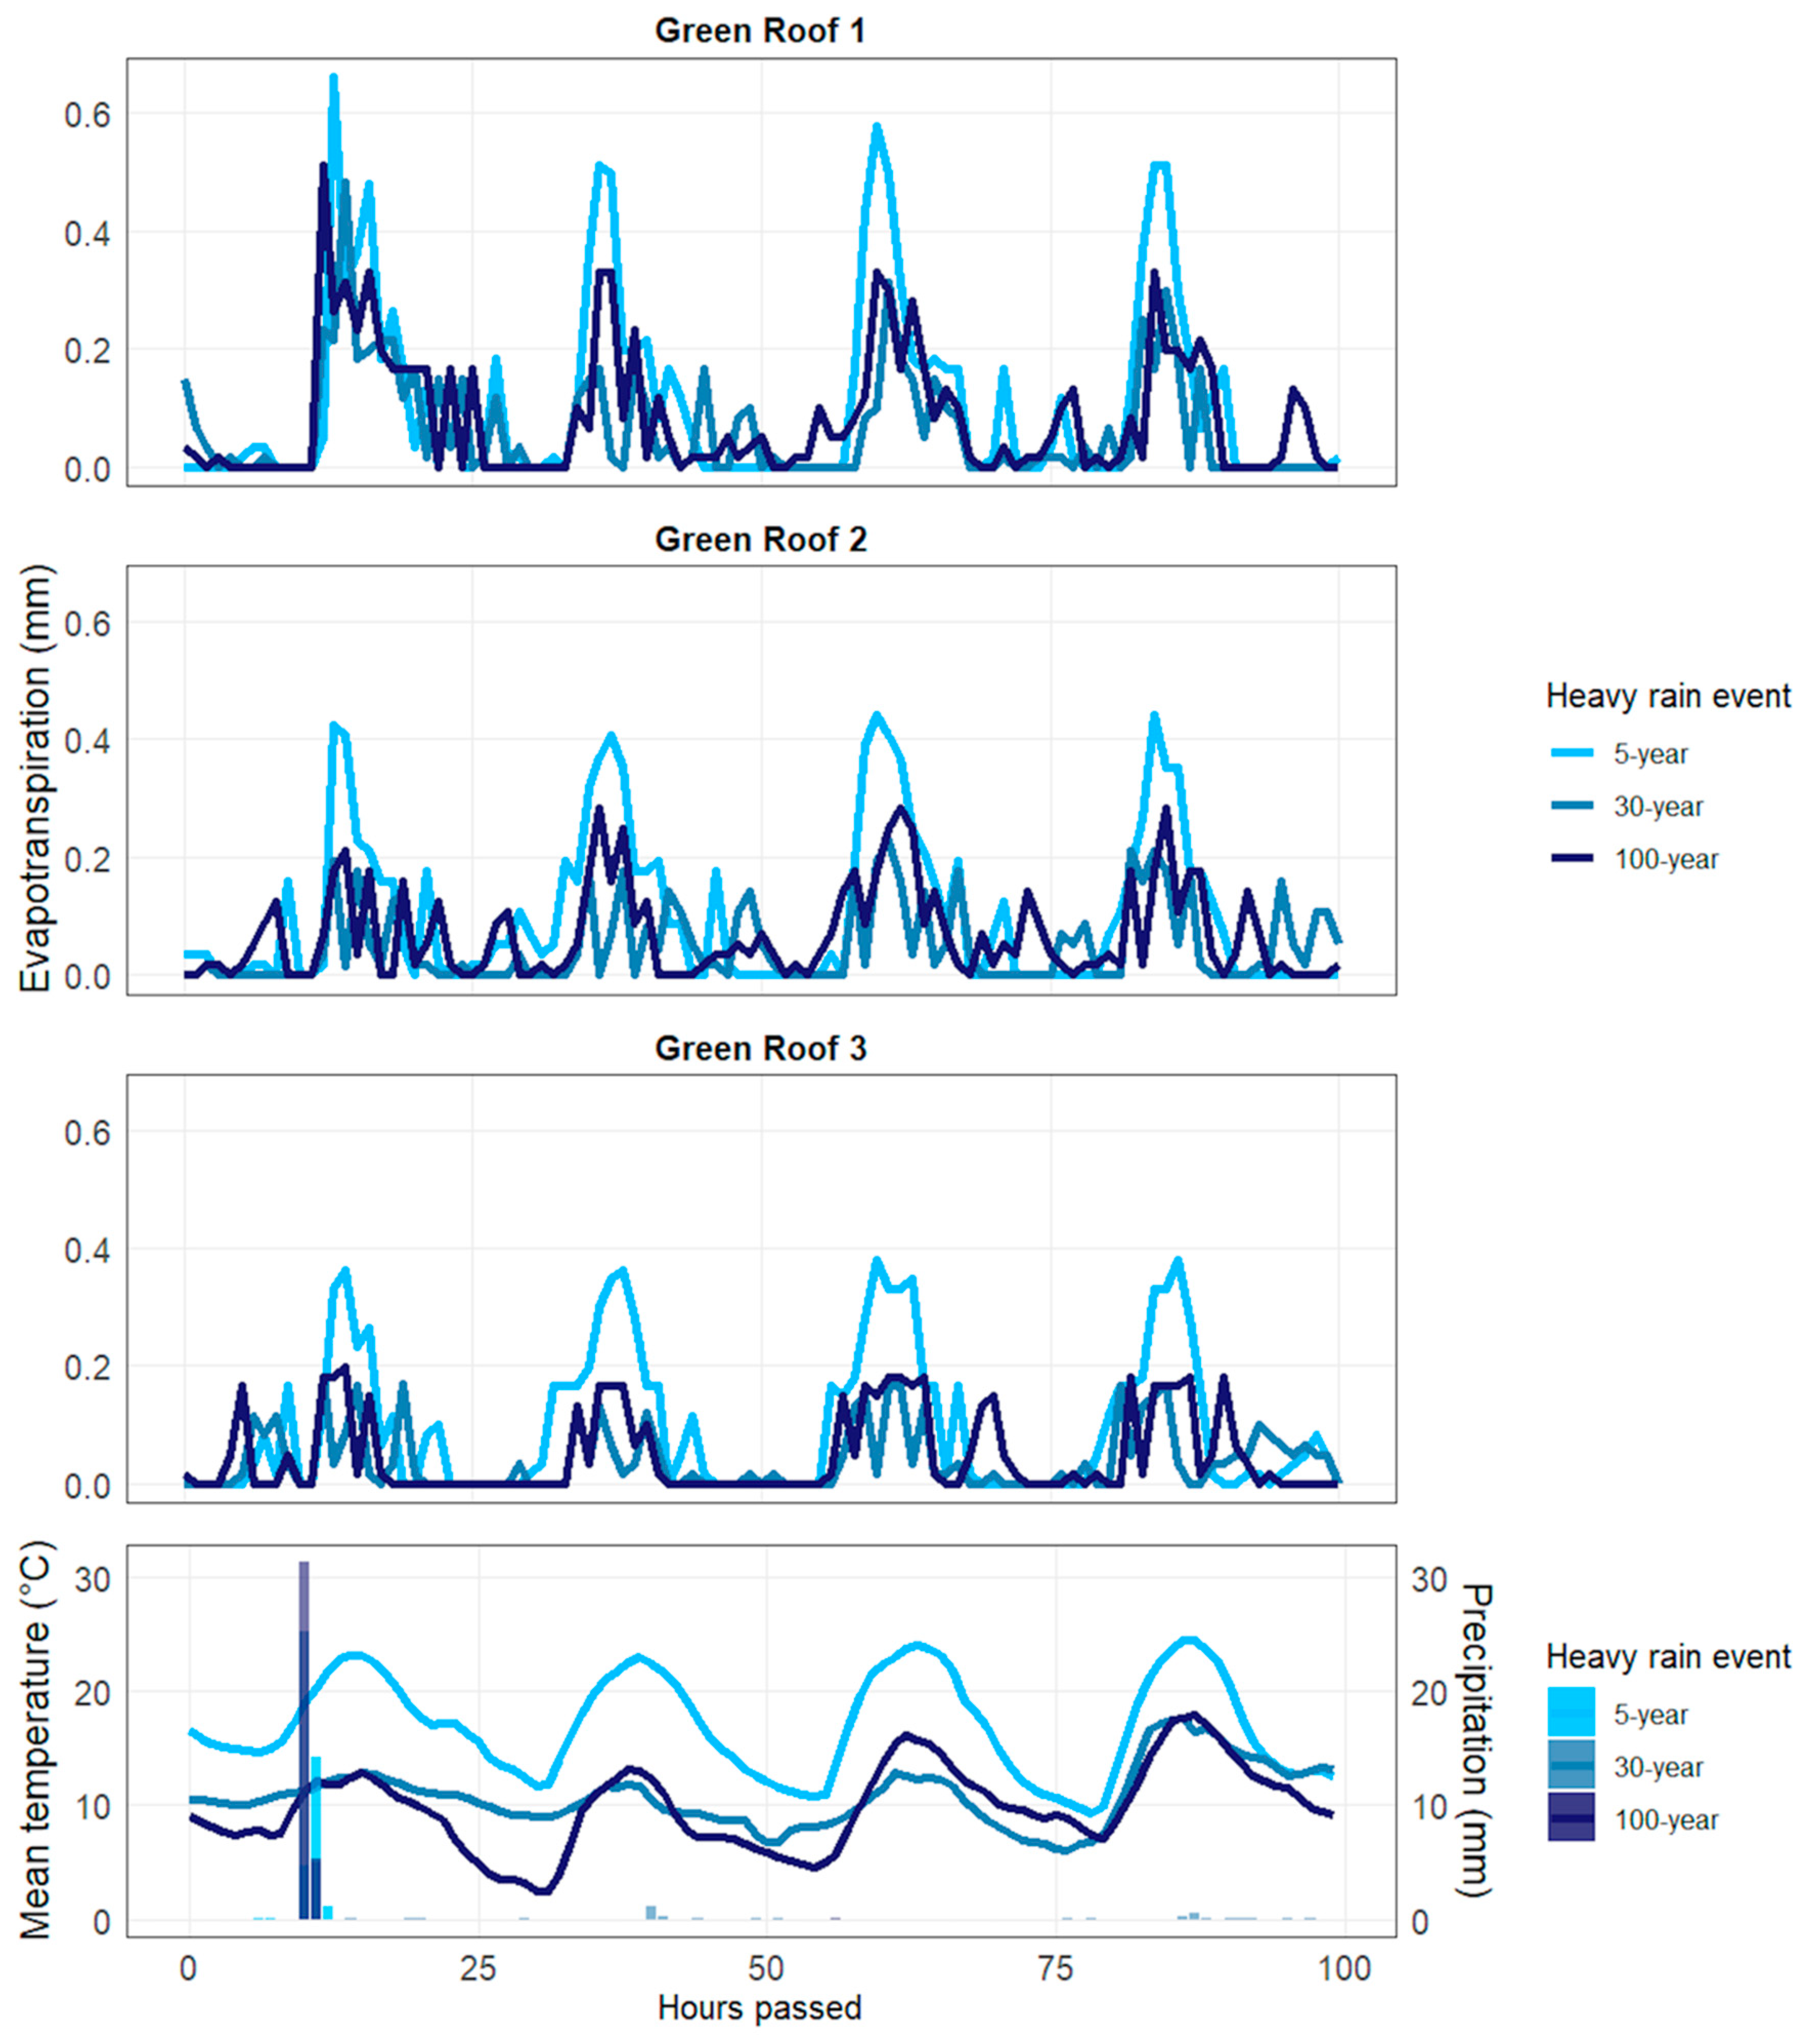
3.2. Simulated Heavy Rainfall Events
3.2.1. Simulation of the 5-Year Event
3.2.2. Simulation of the 30-Year Event
3.2.3. Simulation of the 100-Year Event
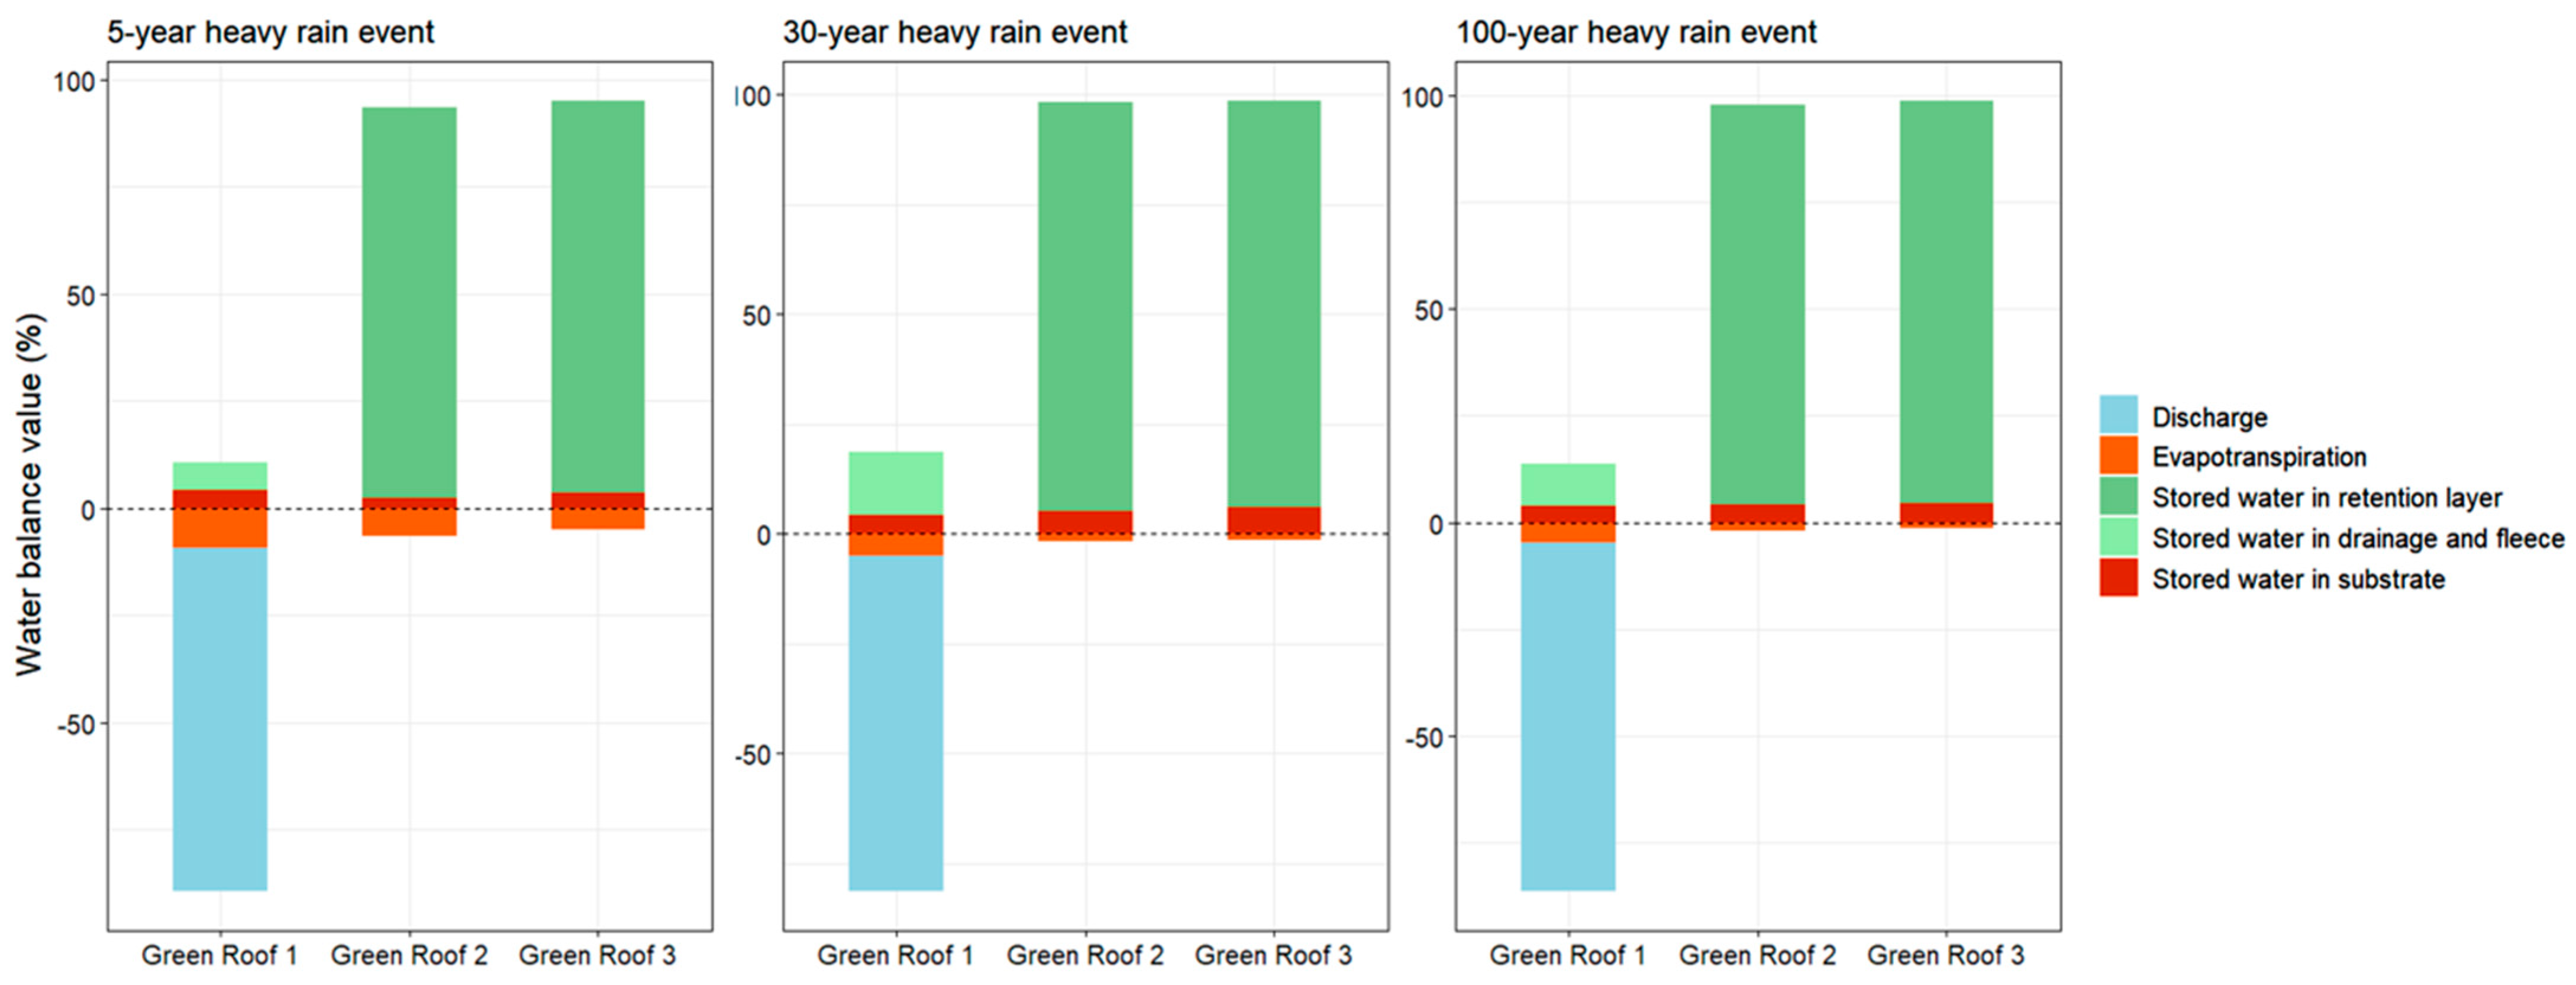
3.2.4. Summary and Comparison of Heavy Rainfall Events
4. Conclusions
Supplementary Materials
Author Contributions
Funding
Data Availability Statement
Conflicts of Interest
References
- He, C.; Liu, Z.; Wu, J.; Pan, X.; Fang, Z.; Li, J.; Bryan, B.A. Future global urban water scarcity and potential solutions. Nat. Commun. 2021, 12, 4667. [Google Scholar] [CrossRef] [PubMed]
- IPCC. Climate Change 2023: Synthesis Report. Contribution of Working Groups I, II and III to the Sixth Assessment Report of the Intergovernmental Panel on Climate Change; IPCC: Geneva, Switzerland, 2023. [Google Scholar]
- Skougaard Kaspersen, P.; Høegh Ravn, N.; Arnbjerg-Nielsen, K.; Madsen, H.; Drews, M. Comparison of the impacts of urban development and climate change on exposing European cities to pluvial flooding. Hydrol. Earth Syst. Sci. 2017, 21, 4131–4147. [Google Scholar] [CrossRef]
- Larsen, T.A.; Hoffmann, S.; Luthi, C.; Truffer, B.; Maurer, M. Emerging solutions to the water challenges of an urbanizing world. Science 2016, 352, 928–933. [Google Scholar] [CrossRef] [PubMed]
- Ariyarathna, I.S.; Abeyrathna, W.P.; Jamei, E.; Chau, H.-W. A Review of the Application of Blue–Green Infrastructure (BGI) as an Effective Urban Flood Mitigation Strategy for Livable and Healthy Cities in Australia. Architecture 2023, 3, 461–476. [Google Scholar] [CrossRef]
- Kaur, R.; Gupta, K. Blue-Green Infrastructure (BGI) network in urban areas for sustainable storm water management: A geospatial approach. City Environ. Interact. 2022, 16, 100087. [Google Scholar] [CrossRef]
- Almaaitah, T.; Appleby, M.; Rosenblat, H.; Drake, J.; Joksimovic, D. The potential of Blue-Green infrastructure as a climate change adaptation strategy: A systematic literature review. Blue-Green Syst. 2021, 3, 223–248. [Google Scholar] [CrossRef]
- Choi, S.H.; Shin, E.; Kim, D.; Song, Y.; Zandaryaa, S.; Makarigakis, A.K.; Kim, J.-y.; Sohn, O.; Clench, C.; Trudeau, M. Water Security and Cities: Integrated Urban Water Management; United Nations Educational, Scientific and Cultural Organization (UNESCO), International Centre for Water Security and Sustainable Management: Paris, France, 2023; Volume 4. [Google Scholar]
- Stoker, P.; Chang, H.; Wentz, E.; Crow-Miller, B.; Jehle, G.; Bonnette, M. Building Water-Efficient Cities. J. Am. Plan. Assoc. 2019, 85, 511–524. [Google Scholar] [CrossRef]
- Nieuwenhuis, E.; Cuppen, E.; Langeveld, J.; de Bruijn, H. Towards the integrated management of urban water systems: Conceptualizing integration and its uncertainties. J. Clean. Prod. 2021, 280, 124977. [Google Scholar] [CrossRef]
- Furlong, C.; Brotchie, R.; Considine, R.; Finlayson, G.; Guthrie, L. Key concepts for Integrated Urban Water Management infrastructure planning: Lessons from Melbourne. Util. Policy 2017, 45, 84–96. [Google Scholar] [CrossRef]
- United Nations. General Assembly, Transforming Our World: The 2030 Agenda for Sustainable Development. 2015. Available online: https://sdgs.un.org/2030agenda (accessed on 17 February 2025).
- Breulmann, M.; Müller, R.A.; van Afferden, M. Modelling urban stormwater and irrigation management with coupled blue-green infrastructure in the context of climate change. Blue-Green Syst. 2024, 6, 100–113. [Google Scholar] [CrossRef]
- Almeida, A.P.; Liberalesso, T.; Silva, C.M.; Sousa, V. Dynamic modelling of rainwater harvesting with green roofs in university buildings. J. Clean. Prod. 2021, 312, 127655. [Google Scholar] [CrossRef]
- Moeller, L.; Knapp, S.; Schmauck, S.; Otto, P.; Schlosser, D.; Wick, L.Y.; Georgi, A.; Friesen, J.; Ueberham, M.; Trabitzsch, R.; et al. Gründächer im urbanen Raum und ihre Ökosystemleistungen. In Die Resiliente Stadt; Kabisch, S., Rink, D., Banzhaf, E., Eds.; Springer: Berlin/Heidelberg, Germany, 2024; pp. 165–180. [Google Scholar]
- Santamouris, M. Cooling the cities—A review of reflective and green roof mitigation technologies to fight heat island and improve comfort in urban environments. Sol. Energy 2014, 103, 682–703. [Google Scholar] [CrossRef]
- Donati, G.F.A.; Bolliger, J.; Psomas, A.; Maurer, M.; Bach, P.M. Reconciling cities with nature: Identifying local Blue-Green Infrastructure interventions for regional biodiversity enhancement. J. Environ. Manag. 2022, 316, 115254. [Google Scholar] [CrossRef] [PubMed]
- Rowe, D.B. Green roofs as a means of pollution abatement. Environ. Pollut. 2011, 159, 2100–2110. [Google Scholar] [CrossRef]
- Akther, M.; He, J.; Chu, A.; Huang, J.; Van Duin, B. A Review of Green Roof Applications for Managing Urban Stormwater in Different Climatic Zones. Sustainability 2018, 10, 2864. [Google Scholar] [CrossRef]
- Twohig, C.; Casali, Y.; Aydin, N.Y. Can green roofs help with stormwater floods? A geospatial planning approach. Urban For. Urban Green. 2022, 76, 127724. [Google Scholar] [CrossRef]
- Zheng, X.; Yang, Z.; Yang, J.; Tang, M.; Feng, C. An experimental study on the thermal and energy performance of self-sustaining green roofs under severe drought conditions in summer. Energy Build. 2022, 261, 111953. [Google Scholar] [CrossRef]
- Wollschlager, N.; Schlink, U.; Trabitzsch, R.; Moeller, L. Weather dynamics affect the long-term thermal and hydrological performance of different green roof designs. Sci. Total Environ. 2024, 957, 177376. [Google Scholar] [CrossRef]
- Feng, Y.; Burian, S.; Pardyjak, E. Observation and Estimation of Evapotranspiration from an Irrigated Green Roof in a Rain-Scarce Environment. Water 2018, 10, 262. [Google Scholar] [CrossRef]
- Czemiel Berndtsson, J. Green roof performance towards management of runoff water quantity and quality: A review. Ecol. Eng. 2010, 36, 351–360. [Google Scholar] [CrossRef]
- Chen, P.-Y.; Hong, X.-F.; Lo, W.-H. Evaluating the stormwater reduction of a green roof under different rainfall events and antecedent water contents with a modified hydrological model. Ecohydrol. Hydrobiol. 2024, 24, 112–127. [Google Scholar] [CrossRef]
- Gong, Y.; Yin, D.; Li, J.; Zhang, X.; Wang, W.; Fang, X.; Shi, H.; Wang, Q. Performance assessment of extensive green roof runoff flow and quality control capacity based on pilot experiments. Sci. Total Environ. 2019, 687, 505–515. [Google Scholar] [CrossRef] [PubMed]
- Lee, J.Y.; Lee, M.J.; Han, M. A pilot study to evaluate runoff quantity from green roofs. J. Environ. Manag. 2015, 152, 171–176. [Google Scholar] [CrossRef] [PubMed]
- Cook, L.M.; Larsen, T.A. Towards a performance-based approach for multifunctional green roofs: An interdisciplinary review. Build. Environ. 2021, 188, 107489. [Google Scholar] [CrossRef]
- Eksi, M.; Rowe, D.B. Effect of Substrate Depth and Type on Plant Growth for Extensive Green Roofs in a Mediterranean Climate. J. Green Build. 2019, 14, 29–44. [Google Scholar] [CrossRef]
- Mentens, J.; Raes, D.; Hermy, M. Green roofs as a tool for solving the rainwater runoff problem in the urbanized 21st century? Landsc. Urban Plan. 2006, 77, 217–226. [Google Scholar] [CrossRef]
- Fernandez-Canero, R.; Emilsson, T.; Fernandez-Barba, C.; Herrera Machuca, M.A. Green roof systems: A study of public attitudes and preferences in southern Spain. J. Environ. Manag. 2013, 128, 106–115. [Google Scholar] [CrossRef]
- Kaiser, D.; Köhler, M.; Schmidt, M.; Wolff, F. Increasing Evapotranspiration on Extensive Green Roofs by Changing Substrate Depths, Construction, and Additional Irrigation. Buildings 2019, 9, 173. [Google Scholar] [CrossRef]
- Richter, M.; Dickhaut, W. Long-Term Performance of Blue-Green Roof Systems—Results of a Building-Scale Monitoring Study in Hamburg, Germany. Water 2023, 15, 2806. [Google Scholar] [CrossRef]
- Busker, T.; de Moel, H.; Haer, T.; Schmeits, M.; van den Hurk, B.; Myers, K.; Cirkel, D.G.; Aerts, J. Blue-green roofs with forecast-based operation to reduce the impact of weather extremes. J. Environ. Manag. 2022, 301, 113750. [Google Scholar] [CrossRef]
- Knappe, J.; van Afferden, M.; Friesen, J. GR2L: A robust dual-layer green roof water balance model to assess multifunctionality aspects under climate variability. Front. Clim. 2023, 5, 1–13. [Google Scholar] [CrossRef]
- Ouedraogo, A.A.; Berthier, E.; Ramier, D.; Tan, Y.; Gromaire, M.C. Quantifying evapotranspiration fluxes on green roofs: A comparative analysis of observational methods. Sci. Total Environ. 2023, 902, 166135. [Google Scholar] [CrossRef] [PubMed]
- Muerdter, C.P.; Wong, C.K.; LeFevre, G.H. Emerging investigator series: The role of vegetation in bioretention for stormwater treatment in the built environment: Pollutant removal, hydrologic function, and ancillary benefits. Environ. Sci. Water Res. Technol. 2018, 4, 592–612. [Google Scholar] [CrossRef]
- Ebrahimian, A.; Wadzuk, B.; Traver, R. Evapotranspiration in green stormwater infrastructure systems. Sci. Total Environ. 2019, 688, 797–810. [Google Scholar] [CrossRef] [PubMed]
- Zhang, Z.; Szota, C.; Fletcher, T.D.; Williams, N.S.G.; Farrell, C. Green roof storage capacity can be more important than evapotranspiration for retention performance. J. Environ. Manag. 2019, 232, 404–412. [Google Scholar] [CrossRef]
- McPhillips, L.E.; Matsler, M.; Rosenzweig, B.R.; Kim, Y. What is the role of green stormwater infrastructure in managing extreme precipitation events? Sustain. Resilient Infrastruct. 2020, 6, 133–142. [Google Scholar] [CrossRef]
- Neumann, J.; Scheid, C.; Dittmer, U. Potential of Decentral Nature-Based Solutions for Mitigation of Pluvial Floods in Urban Areas—A Simulation Study Based on 1D/2D Coupled Modeling. Water 2024, 16, 811. [Google Scholar] [CrossRef]
- DWA (DWA Deutsche Vereinigung für Wasserwirtschaft, Abwasser und Abfall e.V.). Arbeitsblatt DWA-A 118: Hydraulische Bemessung und Nachweis von Entwässerungssystemen, März 2006, korrigierte Fassung vom September 2011; DWA Deutsche Vereinigung für Wasserwirtschaft, Abwasser und Abfall e.V.: Hennef, Germany, 2006; p. 35. [Google Scholar]
- Arbeitsblatt DWA-A 117; Bemessung von Regenrückhalteräumen. Deutsche Vereinigung für Wasserwirtschaft, Abwasser und Abfall e.V.: Hennef, Germany, 2013.
- ATV-DVWK-A 198; Vereinheitlichung und Herleitung von Bemessungswerten für Abwasseranlagen. Deutsche Vereinigung für Wasserwirtschaft, Abwasser und Abfall e.V.: Hennef, Germany, 2003.
- Xu, H.; Chen, H.; Qian, C.; Li, J. The Evapotranspiration Characteristics and Evaporative Cooling Effects of Different Vegetation Types on an Intensive Green Roof: Dynamic Performance Under Different Weather Conditions. Sustainability 2024, 16, 10812. [Google Scholar] [CrossRef]
- Juras, P. Rainwater Retention Test of Various Green Roofs: Influence on Membrane Temperatures and Evapotranspiration. Buildings 2023, 13, 2058. [Google Scholar] [CrossRef]
- Palla, A.; Gnecco, I.; Lanza, L. Hydrologic Restoration in the Urban Environment Using Green Roofs. Water 2010, 2, 140–154. [Google Scholar] [CrossRef]
- Zhang, S.; Lin, Z.; Zhang, S.; Ge, D. Stormwater retention and detention performance of green roofs with different substrates: Observational data and hydrological simulations. J. Environ. Manag. 2021, 291, 112682. [Google Scholar] [CrossRef] [PubMed]
- Wang, J.; Garg, A.; Huang, S.; Mei, G.; Liu, J.; Zhang, K.; Gan, L. The rainwater retention mechanisms in extensive green roofs with ten different structural configurations. Water Sci. Technol. 2021, 84, 1839–1857. [Google Scholar] [CrossRef] [PubMed]
- Raimondi, A.; Becciu, G. Performance of Green Roofs for Rainwater Control. Water Resour. Manag. 2020, 35, 99–111. [Google Scholar] [CrossRef]
- Soulis, K.X.; Valiantzas, J.D.; Ntoulas, N.; Kargas, G.; Nektarios, P.A. Simulation of green roof runoff under different substrate depths and vegetation covers by coupling a simple conceptual and a physically based hydrological model. J. Environ. Manag. 2017, 200, 434–445. [Google Scholar] [CrossRef]
- Gößner, D.; Mohri, M.; Krespach, J.J. Evapotranspiration Measurements and Assessment of Driving Factors: A Comparison of Different Green Roof Systems during Summer in Germany. Land 2021, 10, 1334. [Google Scholar] [CrossRef]
- Wang, J.; Garg, A.; Liu, N.; Chen, D.; Mei, G. Experimental and numerical investigation on hydrological characteristics of extensive green roofs under the influence of rainstorms. Environ. Sci. Pollut. Res. Int. 2022, 29, 53121–53136. [Google Scholar] [CrossRef]
- Li, S.-x.; Qin, H.-p.; Peng, Y.-n.; Khu, S.T. Modelling the combined effects of runoff reduction and increase in evapotranspiration for green roofs with a storage layer. Ecol. Eng. 2019, 127, 302–311. [Google Scholar] [CrossRef]
- Jahanfar, A.; Drake, J.; Sleep, B.; Gharabaghi, B. A modified FAO evapotranspiration model for refined water budget analysis for Green Roof systems. Ecol. Eng. 2018, 119, 45–53. [Google Scholar] [CrossRef]
- Gan, L.; Garg, A.; Wang, H.; Mei, G.; Liu, J. Influence of biochar amendment on stormwater management in green roofs: Experiment with numerical investigation. Acta Geophys. 2021, 69, 2417–2426. [Google Scholar] [CrossRef]
- Silva, M.d.; Najjar, M.K.; WA Hammad, A.; Haddad, A.; Vazquez, E. Assessing the Retention Capacity of an Experimental Green Roof Prototype. Water 2019, 12, 90. [Google Scholar] [CrossRef]
- DIN 1986-100; Technische Regeln für Trinkwasser-Installationen—Teil 100: Schutz des Trinkwassers, Erhaltung der Trinkwassergüte; Technische Regel des DVGW (Deutsche Verein des Gas- und Wasserfaches e. V.). DVGW: Bonn, Germany, 2016.
- FLL. Dachbegrünungsrichtlinien—Richtlinien für Planung, Bau und Instandhaltung von Dachbegrünungen; Forschungsgesellschaft Landschaftsentwicklung Landschaftsbau e.V. (FLL): Bonn, Germany, 2018. [Google Scholar]
- Raimondi, A.; Marchioni, M.; Sanfilippo, U.; Becciu, G. Vegetation Survival in Green Roofs without Irrigation. Water 2021, 13, 136. [Google Scholar] [CrossRef]
- Voyde, E.; Fassman, E.; Simcock, R. Hydrology of an extensive living roof under sub-tropical climate conditions in Auckland, New Zealand. J. Hydrol. 2010, 394, 384–395. [Google Scholar] [CrossRef]
- Li, Y.; Babcock, R.W., Jr. Green roof hydrologic performance and modeling: A review. Water Sci. Technol. 2014, 69, 727–738. [Google Scholar] [CrossRef] [PubMed]
- Silva, J.; Paço, T.A.; Sousa, V.; Silva, C.M. Hydrological Performance of Green Roofs in Mediterranean Climates: A Review and Evaluation of Patterns. Water 2021, 13, 2600. [Google Scholar] [CrossRef]


| Performance Parameter | Unit | Definition | Evaluation |
|---|---|---|---|
| Peak evapotranspiration ETp | Highest hourly ET performance in a certain time frame (absolute value) | ||
| Daily evapotranspiration ETd | Sum of the hourly ET values over 24 h | ||
| Mean runoff coefficient Cm according to DWA [43] | - | Ratio between the total runoff and total precipitation of a rainfall event | |
| Peak runoff coefficient CS according to DWA [44] | - | Ratio between maximum runoff and precipitation intensity | |
| Stormwater retention rate RR | % | Percentage of stormwater retained in the system | |
| Runoff delay tlag | Time difference between the start of the rain event and the first runoff event |
| Green Roof | ETP (mm h−1) | ETd (mm d−1) | tlag (min) | Cm | CS | RR (%) |
|---|---|---|---|---|---|---|
| Natural heavy rain event | ||||||
| 1 | 0.8 | 4.2 | n.a. | n.a. | n.a. | 54 |
| 2 | 0.7 | 4.1 | 22 | 0.49 | 0.49 | 41 |
| 3 | 0.6 | 4.3 | 19 | 0.54 | 0.31 | 31 |
| Simulated 5-year heavy rain event | ||||||
| 1 | 0.7 | 2.8 | 18 | 0.80 | 0.61 | 11 |
| 2 | 0.4 | 2.6 | - | - | - | 93 |
| 3 | 0.4 | 2.4 | - | - | - | 95 |
| Simulated 30-year heavy rain event | ||||||
| 1 | 0.5 | 1.6 | 12 | 0.77 | 0.46 | 19 |
| 2 | 0.2 | 1.2 | - | - | - | 98 |
| 3 | 0.2 | 1.0 | - | - | - | 99 |
| Simulated 100-year heavy rain event | ||||||
| 1 | 0.5 | 2.1 | 11 | 0.82 | 0.42 | 14 |
| 2 | 0.3 | 1.7 | - | - | - | 98 |
| 3 | 0.2 | 1.2 | - | - | - | 99 |
Disclaimer/Publisher’s Note: The statements, opinions and data contained in all publications are solely those of the individual author(s) and contributor(s) and not of MDPI and/or the editor(s). MDPI and/or the editor(s) disclaim responsibility for any injury to people or property resulting from any ideas, methods, instructions or products referred to in the content. |
© 2025 by the authors. Licensee MDPI, Basel, Switzerland. This article is an open access article distributed under the terms and conditions of the Creative Commons Attribution (CC BY) license (https://creativecommons.org/licenses/by/4.0/).
Share and Cite
Breulmann, M.; Merbach, A.; Bernhard, K.; Moeller, L. Enhancing Urban Resilience: Stormwater Retention and Evapotranspiration Performance of Green Roofs Under Extreme Rainfall Events. Land 2025, 14, 977. https://doi.org/10.3390/land14050977
Breulmann M, Merbach A, Bernhard K, Moeller L. Enhancing Urban Resilience: Stormwater Retention and Evapotranspiration Performance of Green Roofs Under Extreme Rainfall Events. Land. 2025; 14(5):977. https://doi.org/10.3390/land14050977
Chicago/Turabian StyleBreulmann, Marc, Amelie Merbach, Katy Bernhard, and Lucie Moeller. 2025. "Enhancing Urban Resilience: Stormwater Retention and Evapotranspiration Performance of Green Roofs Under Extreme Rainfall Events" Land 14, no. 5: 977. https://doi.org/10.3390/land14050977
APA StyleBreulmann, M., Merbach, A., Bernhard, K., & Moeller, L. (2025). Enhancing Urban Resilience: Stormwater Retention and Evapotranspiration Performance of Green Roofs Under Extreme Rainfall Events. Land, 14(5), 977. https://doi.org/10.3390/land14050977