Article

Spatial Patterns of Land Take in a Mediterranean City: An Assessment of the SDG Indicator 11.3.1 in the Peri-Urban Area of Thessaloniki

School of Spatial Planning and Development, Aristotle University of Thessaloniki, 541 24 Thessaloniki, Greece
*
Author to whom correspondence should be addressed.
Land 2025, 14(5), 965; https://doi.org/10.3390/land14050965
Submission received: 18 February 2025 / Revised: 24 April 2025 / Accepted: 27 April 2025 / Published: 30 April 2025

Abstract

:
Urban sprawl, characterized by continuous or discontinuous spatial patterns of artificial surface expansion, has been a common trend in most cities, even in those with longstanding compact features, such as cities in the northern Mediterranean region. This paper assesses the land take patterns in the peri-urban area of a typical compact city that experienced significant sprawl trends after the mid-1990s, which are closely linked to the specificities of planning regulations regarding the development in peri-urban settlements as well as outside planned areas. Using the rapidly suburbanized southern peri-urban area of Thessaloniki, Greece, as a case study, the paper analyzes the factors influencing the land cover change in the middle-class-led peri-urbanization during the period 2000–2018 and provides an estimate of the SDG indicator 11.3.1 “ratio of land consumption rate to population growth rate”, a suitable indicator for monitoring spatial changes. The main conclusions of the study indicate that, during the period examined, the peri-urban zone investigated in the case study exhibited a higher rate of population growth compared to that of artificial surfaces, with the latter showing a higher change during 2006–2012. However, the spatial pattern of urban expansion displays a fragmented yet linear form, creating fragmented enclaves of agricultural land.

1. Introduction

The rapid expansion of urban areas and their associated infrastructure presents a global challenge with significant environmental, economic, and social implications. Environmental degradation and increased carbon dioxide emissions are linked to the urbanization and urban sprawl processes, which result in the loss of agricultural, forest, and natural land to urban and essentially artificial land. This latter refers to the areas sealed off by construction and urban infrastructure, green spaces, and sports and leisure facilities [1,2,3,4,5,6]. Urban sprawl is generally characterized by a decrease in the urban density, the decentralization of urban functions, and the transformation of a compact urban form into an irregular, discontinuous, and scattered pattern. In addition to population growth that drives land consumption, built-up areas are expanding faster than the population even where the population is declining [4,5,7].
Urban sprawl is often associated with unplanned urban development characterized by a mix of land uses—including residential and typically large-scale commercial, office, service, and leisure functions—as well as low-density building in peri-urban areas [4], thereby indicating limited urban planning control, particularly in relation to land subdivision. Sprawling cities, in contrast to compact or cohesive cities, are characterized by fragmented and empty spaces, which demonstrate inadequacy in controlling urban growth and highlight the consequences of unplanned development [4]. Urban sprawl is caused by various factors. Economic geographers consider urban sprawl to result from population growth, income growth, and reduced travel costs [8]. The literature acknowledges the significant variations in this theory, noting the increasing complexity of the factors contributing to urban sprawl. Among the factors contributing to urban sprawl, the implementation of land use policies and urban planning is particularly significant, especially concerning the access to land, housing ownership, building processes, and policies influencing urban and residential development, resulting in substantial variations in the urban sprawl across countries [9].
The conversion of undeveloped, usually natural land, into residential urban areas, industrial sites, or transportation infrastructure is closely linked to low-density and/or dispersed urban development [2,10]. “Land take” is the official term used in the EU for this conversion phenomenon after the introduction of the “no net land take by 2050” target, an ambitious, in many respects, target of reaching land take neutrality by 2050 [2]. Land take is recognized as a sustainability problem. The substantial loss of soil functions and ecosystem services associated with land take is regarded as a major environmental challenge both in the European Union and globally, particularly where quantitative estimations regarding land-cover changes show that urban area expansion is strongly negatively correlated with changes in forest, cropland, and grassland. It is also considered as a factor that affects socio-economic parameters [11,12,13]. It is worth noting that land take does not coincide with urban sprawl. Despite the wide range of definitions regarding urban sprawl, there is a broad consensus that this phenomenon occurs on the urban fringe in rapidly growing areas and that it designates a form of urban development that consumes large amounts of land, usually taking the form of low-density or dispersed development [2,3].
The wide variety of the terms used in official reports and the literature, such as land take, land consumption, soil sealing, artificialization, and their specificity has been thoroughly studied by Marquard et al. [10]. Here, “land take” is regarded as a process that converts, and thereby diminishes, natural, semi-natural, forest, or agricultural land. A “land take indicator” therefore addresses the change in the area of agricultural, forest, and other semi-natural and natural areas that are converted to artificial surfaces and sealed by construction and urban infrastructure as well as sports and leisure facilities and urban greening [10,12]. Artificial surfaces as defined by [10] to refer to land that is assigned to one of the following classes: urban fabric (continuous and discontinuous); industrial, commercial, and transport units; mine, dump, and construction sites; artificial, non-agricultural vegetated areas (green urban areas, sport and leisure facilities). The conversion of natural, semi-natural, forest, or agricultural land to artificial surfaces impairs the land’s ecological functions and reduces the ecosystem resilience [12], thereby undermining the urban resilience and sustainability. The related and additionally used term “land consumption” includes three aspects, the expansion of built-up area which can be directly measured, the total land area used for agriculture, forestry, or other economic activities, and the over-intensive exploitation of land used for agriculture and forestry [10]. Additionally, land consumption can be defined as the rate at which land is annually consumed by cities for urban purposes, including open spaces [14].
These different definitions highlight the complexity of the activities in space and the challenge of observing and interpreting the spatial changes, with implications for spatial planning [15]. It also highlights the need for a clear, coherent, multi-scalar, and legally anchored framework to elaborate on indicators, taking into consideration the concepts of credibility, relevance, and legitimacy used at the science–policy interface [16]. It is also worth noting here that in various European countries such as Romania, Greece, Italy, Portugal, and Estonia, legally or otherwise binding definitions for the term “land take” do not seem to exist [17].
Urban development patterns vary from region to region, and consequently, urban land cover changes also vary due to the socioeconomic, cultural, historical, and environmental disparities [13]. Regarding the urbanization and urban sprawl trends in the Mediterranean region, in particular, it has been argued that they are characterized by informality, deregulated planning, and weak public policies [18]. Since the 1980s, several Mediterranean cities—and, in some cases, since the 1990s—have undergone a rapid transition from the traditional “compact” model to more dispersed forms of suburban and other types of urban sprawl in their outskirts, as well as tourism-driven urbanization along the coastal areas. Studies have revealed considerable differences in the urban growth trends across Mediterranean cities regarding the different urban forms, the degree of compactness and dispersal, and the fragmentation patterns and hence regarding the land take patterns [19,20]. Most of the relevant studies concerning Mediterranean cities, particularly those focusing on Italian and Greek urban contexts, primarily address the urban sprawl processes, highlighting the significant transformations in the traditional compact urban form that characterized these cities in the past [18,19,20,21]. Other important studies place particular emphasis on developing methods to estimate the land take within the context of Mediterranean urbanization [22,23]. However, there remains a considerable scope for further research, especially regarding how the critical drivers of urban sprawl—such as specific features of the development process and regulatory frameworks—are interrelated with the land take patterns.
In Greece, there were three main drivers of land take since the 1980s. The first was urban sprawl with all the forms of development (housing, commercial, service, leisure, and a widespread road network needed to connect all these areas), characterized by continuous, suburban, and dispersed patterns in the outskirts of both larger and smaller cities. These processes were more intense up until 2010 and the outbreak of the financial crisis, followed by the subsequent recession that halted the construction activity in urban centers for almost the entire 2010s. Second, tourist and secondary residence development with dispersed patterns, accompanied by a widespread road network needed to connect all these areas, occurred throughout the coastal areas. The third was the construction of transport infrastructure, especially large motorways [21,22].
The main goal of this paper is to advance the understanding of land take by examining it from the perspective of a city in the northern Mediterranean region with a long-standing tradition of compact urban form. In particular, the paper delves more deeply into areas that have experienced middle-class-led peri-urbanization since the mid-1990s, a process drastically facilitated by national legislation concerning the development in small, formerly rural settlements, and areas outside the official urban plan. These provisions have, in turn, facilitated certain types of development while undermining the formal spatial planning. In this context, the paper estimates Sustainable Development Goal (SDG) indicator 11.3.1, which measures the ratio of land consumption rate to population growth rate, in order to highlight the importance of using indicators to quantify the land cover and land use changes over time and to analyze the specific spatial patterns of urban sprawl and land take.

2. Materials and Methods

2.1. Methodological Framework and Calculation Steps for SDG 11.3.1

From a methodological point of view, a mixed-methods approach comprising both qualitative and quantitative analyses was applied. This approach is structured as presented in Figure 1 and is further examined in the following paragraphs.
First, a primarily qualitative analysis provides an overview of the spatial patterns of the urban development and sprawl trends in Thessaloniki. This analysis focuses on the Greater Thessaloniki Area (GTA), encompassing its compact urban core and a broader peri-urban zone, which includes several suburban settlements experiencing significant development beyond the planned areas. It incorporates population census data, yearly statistical surveys on the legal building activity, and observations from multiple on-site surveys conducted during the preparation of General Urban Plans, as well as other previous research in Thessaloniki by one of the authors. Here, the authors’ expert opinion, derived from long-term professional planning experience, contributes essentially to this analysis.
Second, the study elaborates a quantitative estimation of the land take in the southern peri-urban zone of Thessaloniki that exhibited the most intense urban sprawl trends after 1990.
In terms of measurement, the United Nations has established SDG 11, which focuses on creating inclusive, safe, resilient, and sustainable cities and human settlements. One of its key sub-targets, 11.3, aims by 2030, to improve inclusive and sustainable urbanization for all, as well as enhance the capacities for the participatory, integrated, and sustainable planning and management of human settlements in all countries. The proposed indicator for this target, 11.3.1, is defined as the “the ratio of land consumption rate to population growth rate” [14].
To calculate this indicator, two parameters are required: population growth and the rate of land consumption. While the population growth rate is relatively simple to calculate, widely available, and easier to interpret, determining the rate of land consumption necessitates the adoption of innovative methodologies and the establishment of a well-defined analytical framework. Our calculation is based on the UN-approved metadata [24].
In addition to the SDG 11.3.1 (LCRPGR) indicator, we also included the Urban Infill indicator, a sub-indicator suggested by [24]. This indicator captures the complementary aspects of spatial development dynamics. Whereas LCR measures the expansion of artificial surfaces relative to the PGR, the Urban Infill indicator estimates the internal densification within the study area. This facilitates a more thorough understanding of the land take patterns and spatial fragmentation in peri-urban areas.
The calculation of SDG indicator 11.3.1 involved six key steps:
  • Determination of the analysis period: The years 2001, 2006, 2012, and 2018 were selected as the reference points for the analysis.
  • Delimitation of the study area: The spatial extent of the study area was defined to ensure the consistency and relevance to the research objectives.
  • Spatial analysis and calculation of the land consumption rate (LCR): The extent of land consumption over the selected time periods was quantified through spatial data analysis. The LCR is calculated using the following formula:
L C R = l n U r b t + n U r b t γ
4.
Spatial analysis and calculation of the population growth rate (PGR): Population growth rates were calculated for the same periods using demographic data. The PGR is calculated using the following formula:
P G R = l n P o p t + n P o p t γ
5.
Calculation of the LCRPGR ratio: The ratio of land consumption rate to population growth rate was computed as the primary indicator (SDG 11.3.1). The LCRPGR indicator is calculated using the following formula:
L C R P G R = L a n d   C o n s u m p t i o n   R a t e / P o p u l a t i o n   G r o w t h   R a t e
6.
Calculation of the Urban Infill indicator: A secondary indicator, the Urban Infill indicator, was calculated to provide a deeper insight into the spatial patterns of the land take within the case study area. The Urban Infill indicator is calculated using the following formula:
T o t a l c h a n g e b u i l d u p a r e a ( % ) = U r B U t + n U r B U t U r B U t
The methodology for calculating each rate and indicator is analytically presented in the Section 3, where each computational step is explained in detail. It is worth commenting here that from a research perspective, the assessment of the 11.3.1 indicator remains relatively limited. Notable studies utilizing this indicator to analyze urban sprawl include a study that focuses on the North Rhine-Westphalia region [25], and one that examines urbanization in China [26].

2.2. Case Study Area and the Spatial Data Sources

This part of the study was conducted in the Municipality of Thermi in the peri-urban zone of Thessaloniki, with a specific focus on the Thermi Municipal Unit (M.U.), an area characterized by rapid population growth and significant residential expansion within as well as outside the planned areas. These trends have shaped a distinctive spatial pattern of suburban development, encompassing a large suburban settlement, Thermi, that today functions as a small urban center, a number of smaller suburban settlements, and extensive unplanned developments scattered throughout the entire territory of Thermi M.U. Therefore, Thermi M.U. serves as a representative example of middle-class-led peri-urbanization and provides substantial material for examining how the specific features of the development process and regulatory frameworks are interrelated with the land take patterns.
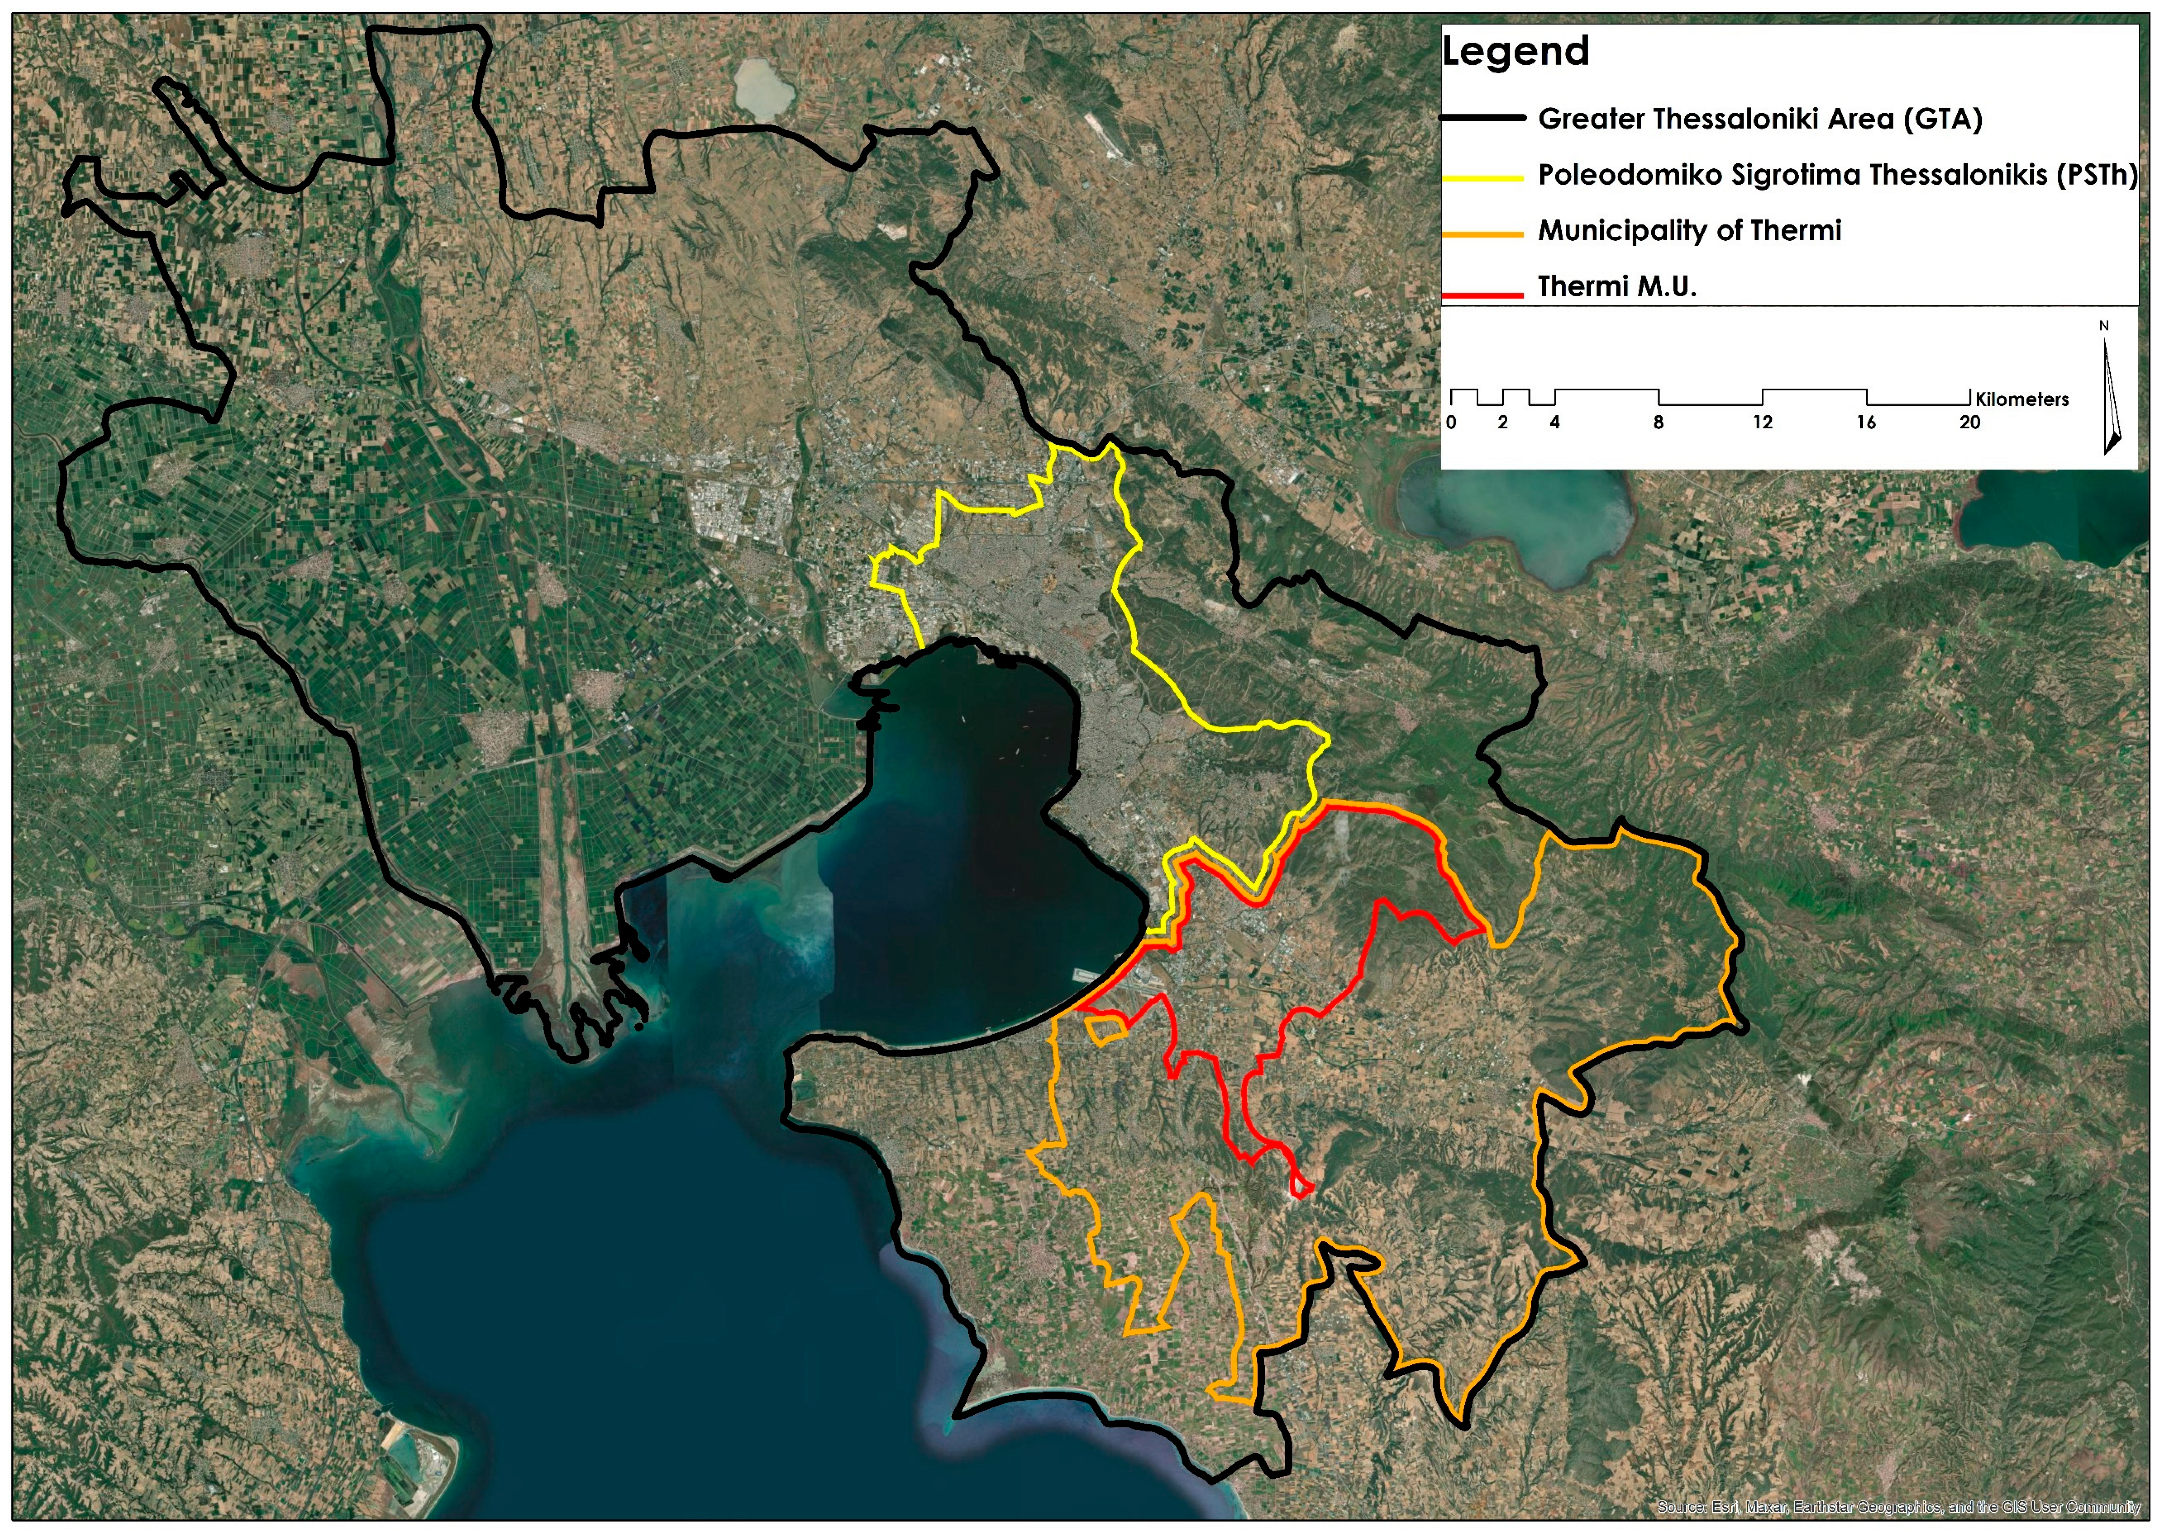
Figure 2 presents the key spatial zones of the GTA using color-coded boundary lines: black delineates the extent of the GTA; yellow outlines Poleodomiko Sigrotima Thessalonikis (PSTh); orange marks the administrative boundary of the Municipality of Thermi; and red highlights the Municipal Unit of Thermi (Thermi M.U.), which constitutes the study area. The imagery layer integrates high-resolution satellite and aerial photography, with most of the content captured within the past three to five years. It provides spatial coverage at resolutions of one meter or finer for the majority of the Earth’s land surface [27].
To analyze SDG indicator 11.3.1, the study investigated the artificial surface changes over time for the years 2001, 2006, 2012, and 2018. The case study area was delineated and mapped within a GIS environment, with the primary objective of collecting satellite imagery and spatial information, including the administrative boundaries, population data, transport infrastructure, and land cover changes over time. This mapping process also established precise geospatial coordinates reflecting the current conditions, facilitating the subsequent analysis.
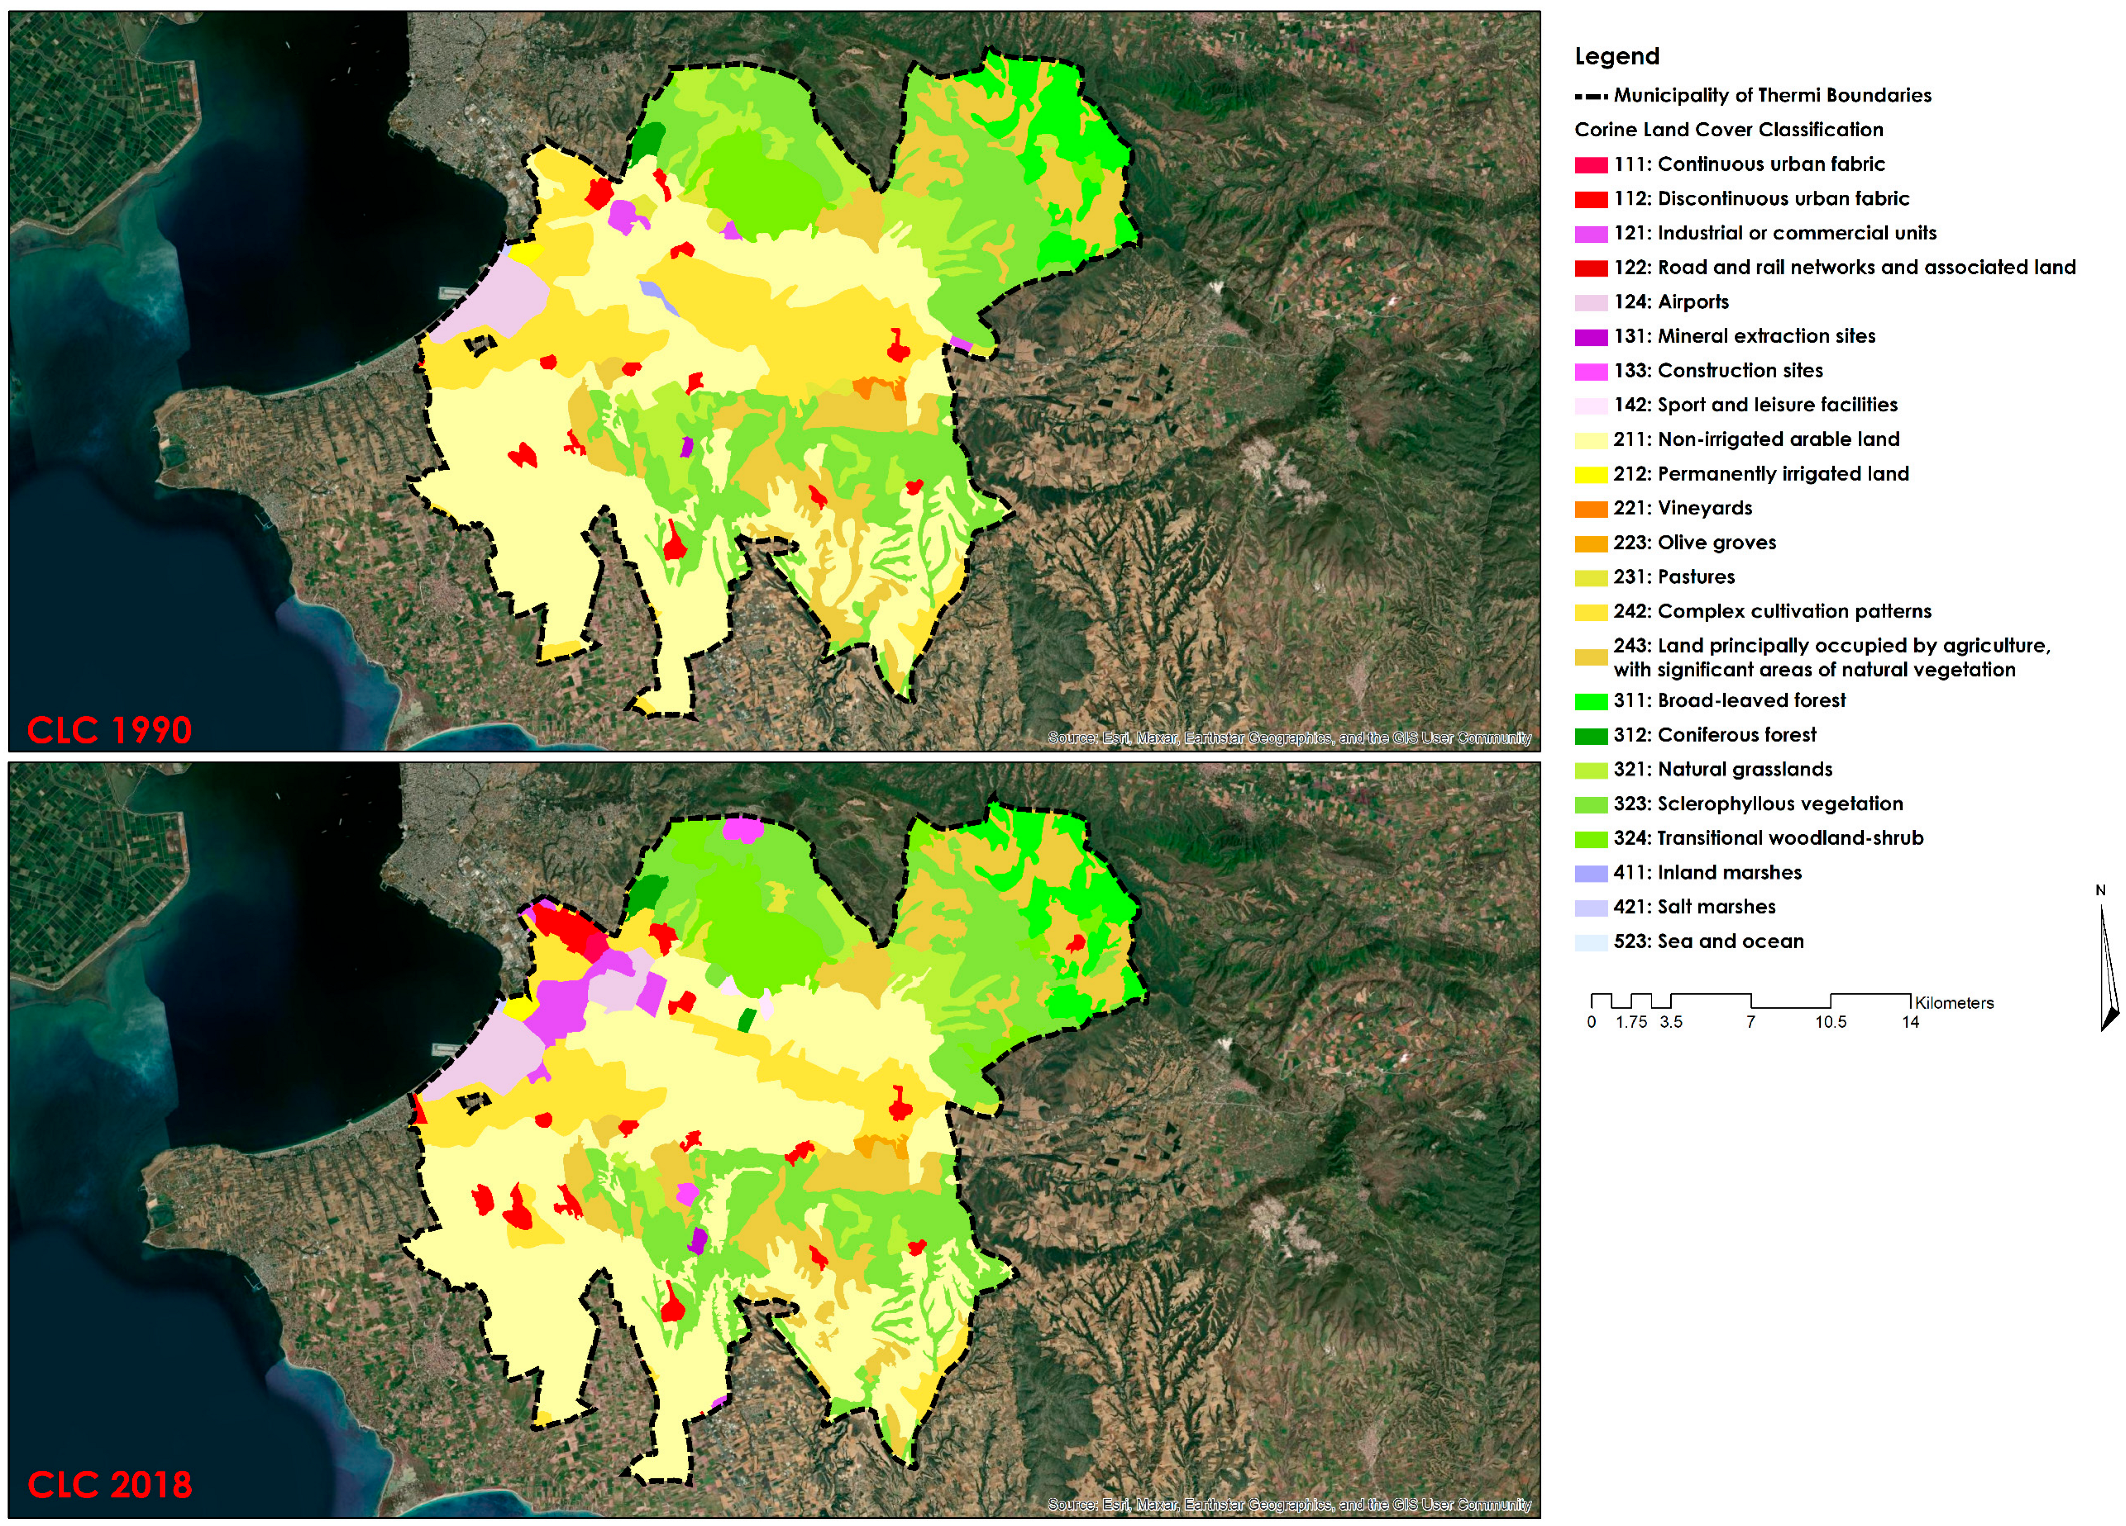
The spatial data collected, processed and analyzed, were drawn from the European Copernicus Earth Observation Programme. Specifically, the study utilized data from the Copernicus database on European Land Cover, which adheres to a standardized methodology to support environmental policy development. The land cover categories and classes were determined based on the standards and guidelines outlined in the technical reports of the CORINE Land Cover (CLC) and the European Urban Atlas databases. It should be mentioned that the CLC, which first used 1990 as the reference year for its initial census, was updated in 2000 and has adhered to a six-year update cycle since. It serves as a baseline, utilizing ortho-corrected satellite imagery of high spatial resolution. To ensure the comparability across inventories, its technical parameters remain consistent, including the description of land cover types through a three-level composite classification system, a minimum mapping unit of 25 hectares, and a minimum mapping width of 100 m. The raw data are provided in a vector format with polygonal topology, achieving thematic accuracy that exceeds the specified minimum threshold of 85%. To analyze the land cover changes in the Municipality of Thermi, cartographic visualizations of the CLC data were produced to capture the temporal changes accurately and offer a detailed understanding of the causes of these changes and the evolution of the typology of the land cover.
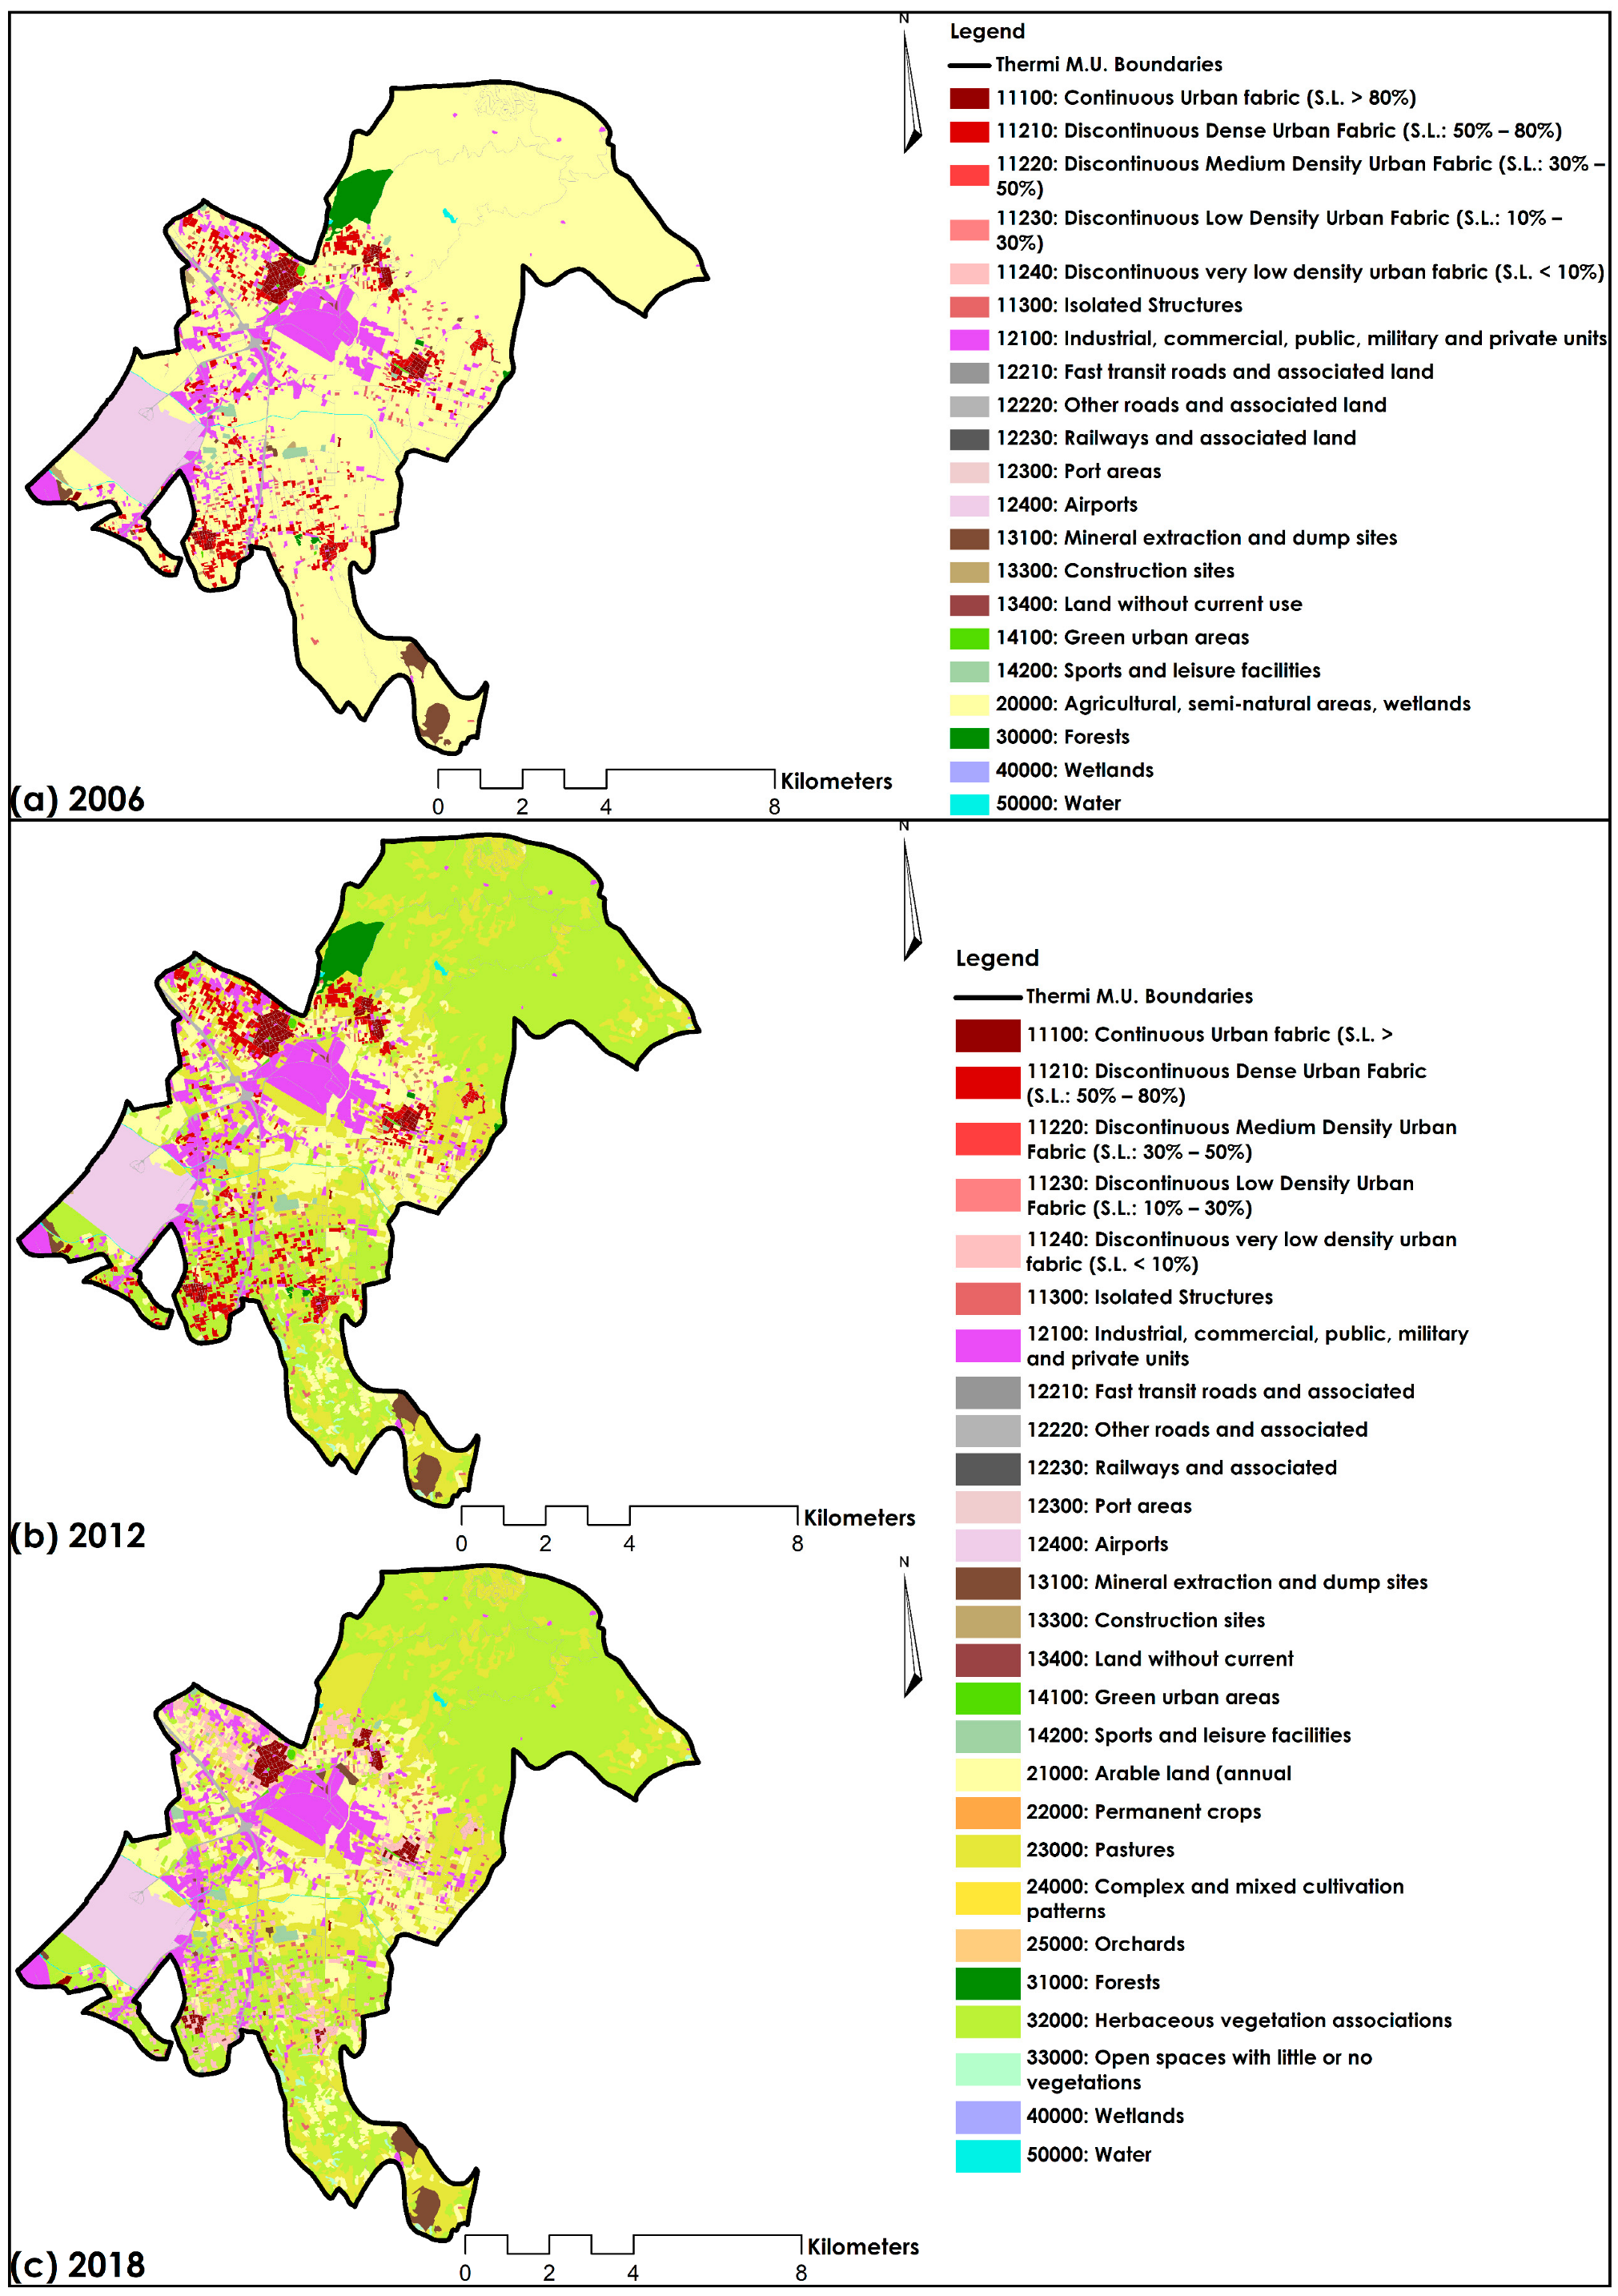
Furthermore, data for the years 2006, 2012, and 2018 were obtained from the Urban Atlas, a land-monitoring service under the European Copernicus Programme. This resource provides reliable, high-resolution land use maps for major urban zones and their peripheries, addressing the gaps in the knowledge about land use evolution and urban dynamics. The Urban Atlas was chosen for this part of the study due to its ability to track the developments and temporal changes in land use, including low-density urban fabric, at a resolution 100 times higher than that of the CLC. This part of the study was conducted at the scale of Thermi M.U., which was deemed optimal due to its large cartographic scale. This scale effectively captures the geometry of spatial elements and highlights the fragmentation of urban and non-urban landscapes. For this part of the study, primary land use data for 2001 were sourced from the archives of the Geochoros SA Consultancy.

3. Results

3.1. Spatial Patterns of the Urban Sprawl in Thessaloniki and the Planning Provisions Shaping Them

3.1.1. General Trends in the Spatial Patterns of Urban Sprawl

In the urban development pattern of Greek cities, significant changes have been observed since the 1980s in Athens and the 1990s in Thessaloniki and other major cities. The traditional cohesive and high-density city model has given way to suburbanization and urban diffusion throughout the peri-urban space. This has led to the process of “peri-urbanization”, that is, along with the further intensification of compact zones, the big cities experienced a wide expansion with the development of the suburban housing within and outside the peri-urban settlements, as well as the development of all the other urban activities and functions—such as commercial centers, leisure facilities, and transport infrastructure—in their peri-urban zones [28,29,30,31]. These urban development trends essentially occurred over a 15- to 20-year period, from the 1990s to the end of the 2000s, coinciding with the country’s fast growth prior to the onset of the 2009 financial crisis. Residential construction, tourism, commerce, and services were the main economic activities related to urban sprawl. Agricultural land, along with other natural areas in close proximity to cities, was considerably restricted in the quickly suburbanized peri-urban zones. In the 2010s, the financial crisis in the country and the longstanding recession resulted in a drastic decline in the housing construction sector, while also significantly halting the urban sprawl trends during this period.
In Thessaloniki, in particular, the clear trend of population migration from the so-called “Poleodomiko Sigrotima Thessalonikis” (PSTh), i.e., from the compact urban area to the surrounding peri-urban zone, is a relatively recent phenomenon. Before 2009, urban sprawl was a phenomenon that occurred over a period of just 15 years, from the mid-1990s to the late 2000s, although the first signs had emerged by the late 1980s with the sporadic out-of-plan construction of luxury homes or large detached houses, primarily by affluent households. However, it was in the second half of the 1990s—when the for-profit construction sector began producing housing in peri-urban areas—that the suburbanization in Thessaloniki expanded significantly. During this period, the urban sprawl throughout the peri-urban area became consolidated, not only for residential purposes but also for a variety of other urban activities, including large department stores, exhibitions, leisure facilities, and services of all kinds [21,30].
During the 20-year period from 1991 to 2011, the proportion of the population of the GTA living in non-PSTh areas relative to the entire GTA increased from 13.6% in 1991 to 17% in 2001, and to 21.8% in 2011. Practically speaking, by 2001, the peri-urban zone had regained the population percentage that it held in 1961; however, its social geography had radically transformed, with the previously rural areas now functioning as purely suburban ones.
In the 1990s, the population of the GTA as a whole grew by 1% annually, at a higher rate than the national average. PSTh, the compact urban area, grew by 0.6% annually, the inner peri-urban zone grew by 4.7% annually, and the outer peri-urban zone grew at an annual rate of 2.5%. The first time in the city’s contemporary history that the compact zone experienced a population decline was during the period from 2001 to 2011. The inflow of economic migrants from Balkan and former Soviet Union countries had halted the compact zone’s population loss in the 1990s, whereas it kept the rate of decline in the 2000s relatively low. During the 2010s, these trends changed considerably. This was the first decade in 70 years that Thessaloniki lost population, although at a lower rate than the national average. At the same time, PSTh experienced a smaller population decline than the GTA average, whereas the inner peri-urban zone increased, though at a lower rate than in previous decades. Of special interest is the fact that this increase primarily affected the two main settlements in the inner suburban zone: Thermi M.U. in the southern inner suburban zone (the case study area) and Oreokastro in the northern inner suburban zone, both of which are in close proximity to PSTh. Table 1 presents the population change in Thessaloniki by zone for the 30-year period 1991–2021.
From the perspective of housing construction activity, during the period 1995–2008, 34% of the total housing production occurred in areas outside PSTh. Based on the statistical data on housing construction presented in Table 2, the share of new dwellings built in the peri-urban zone, relative to the entire GTA, was 27.7% during the five-year period of 1995–1999, increased to 38.6% during 2000–2004, and then decreased slightly to 36% during 2005–2008. It is worth noting that during the period 2009–2019, a period of drastic decline in housing production in the entire GTA—reaching a situation of almost no production—the share of housing production in the peri-urban zone was 48.8%, the largest share of which concerned housing construction in Thermi M.U. Figure 3 presents statistical data on the annual production of new dwellings in the GTA by zone during the period 1994–2019.

3.1.2. Development Patterns

Based on Yiannakou [21,32] the following development patterns can be identified in Thessaloniki during the period 1991–2011:
  • Major reconstruction inside and on the fringes of PSTh: This includes undeveloped plots in the inner compact urban area but primarily areas on its fringe that were incorporated into the town plan from the 1990s to the early 2000s. Since the late 1990s, all newly constructed residential buildings in planned areas have included a considerable percentage of unofficial apartment floor space (i.e., not appearing in the planning permit), with the unauthorized conversion of various elements, such as semi-outdoor spaces, balconies, and garages, into main apartment floor space. Analytical surveys indicate that in most residential buildings, nearly 40% of the main apartment floor space was constructed without an official permit. This practice effectively increased, unofficially, the official building coefficients by almost 40% and, therefore, intensified the official densities in these areas.
  • Major reconstruction within the statutory boundaries of peri-urban settlements: Initially, reconstruction occurred in the settlements with available land within the town plan area and sufficient official building coefficients to attract speculative housing development. Notable examples include Perea, Neoi Epivates, and Agia Triada in the outer peri-urban coastal zone, as well as Thermi and Oreokastro in the inner urban zone. Later, house-building activity expanded to all the settlements in the peri-urban zone. Since the mid-1980s, all these settlements have had official settlement boundaries (not necessarily planned areas) and building coefficients defined by general law (see below). These legal provisions were sufficient to attract speculative housing development and, consequently, middle-class households seeking suburban housing. As in PSTh, all the elements capable of artificially increasing the building coefficients—including, in this case, the conversion of basements into main house floor area—were fully integrated into the main house floor space.
  • Out-of-plan residential development: This process followed a chronological progression, beginning with the construction of luxury detached houses, followed by double and triple houses for large families, and culminating in the development of small speculative housing complexes. The speculative house-building sector’s expansion into out-of-plan residential development was largely driven by the informal increase in the officially permitted maximum building area on estates outside the official plan, effectively creating building coefficients nearly equal to those within the planned areas. This was achieved by incorporating various elements that expanded the main floor space. This type of out-of-plan construction was also a common practice in second-home areas. Analytical surveys indicate that in most house complexes of this type, nearly 75% of the main floor space was constructed informally, i.e., without appearing in the official permit. A large number of high-income and middle-income maisonettes in the peri-urban zone, many of which feature outstanding architectural design, have been built with this level of informality.
  • Out-of-plan development of all types of other uses/facilities: this category encompasses all the other types of off-plan construction, facilitated by building variances that permitted deviations from the standard regulations.
From the perspective of spatial structure, the key feature throughout the period 1991-2011 was the transformation of the city from a typically linear, coherent urban form—shaped by natural barriers that influenced the outline of the urban fabric—into a sprawled city characterized by local concentrations of relatively dense construction within peri-urban settlements and widespread building across the entire peri-urban zone.

3.1.3. The Main Regulatory Framework

From an institutional perspective, the supply of planned areas in the peri-urban zone remained limited to small statutory expansions in certain settlements, while a few much larger expansions were never completed. Even the expansion in Thermi M.U., the largest ever in the peri-urban area, was completed only 25 years after its launch and thus entered the housing market only in the late 2000s. Two crucial pieces of legislation formed the regulatory framework for the peri-urban model of development:
  • Presidential Decree 24.4/3.5.1985: This decree established regulatory settlement limits for settlements with populations of 2000 inhabitants or fewer in the 1981 census year. In most cases, these limits were defined over a larger area than the actual built-up area. Within these extended official settlement boundaries, building coefficients were set at nearly the same levels as those of fully planned areas on the fringe of PSTh.
  • PD 31.5.1985: This decree governs building provisions and restrictions for areas outside the city plan. In Greece, one of the main causes of dispersed development is the potential for the so-called “ektos schediou domisi”, i.e., “out-of-plan” development, which refers to construction outside planned urban zones, as allowed by Greek statutory planning. According to this provision, every property outside the official settlement plan with a minimum size of 4000 m2 can be developed with a maximum built-up area of 200 m2 for residential use. Similar regulations also allow “out-of-plan” development for other purposes, including industrial, commercial, and service uses. These development processes were intensified either by unauthorized construction, defined as building beyond the area permitted by official regulations, or, in the case of commercial, industrial, and service development, by exploiting deviations provided for in the relevant legal regulations [33,34].
The above institutional framework, originally intended to regulate the building policies in rural settlements until they acquire an official plan or to control construction on the periphery of cities and towns, ultimately shaped a peculiar stock of land for development. This stock featured official building coefficients that could reach values as high as those in planned areas and was combined with permanent informal construction that far exceeded these limits. As a result, the groundwork was laid for the significant expansion of speculative construction in peri-urban areas. A large portion of these suburbanized settlements lack proper urban planning in parts or even entirely. These areas exhibit deficiencies in the spaces for collective use, lack comprehensive street planning, and feature a network of public spaces limited to roads serving individual properties, often created solely for accessibility needs.
During the period under review, new planned areas that were proposed to be released for development by the General Urban Plans enacted in the 2000s were at scales unprecedented for the traditionally restrictive release of planned areas of previous decades. This created yet another peculiar “in-formation” stock of land intended for future development, in which prices increased sharply, approaching those of the land inside the plan. The extremely slow pace of preparing the necessary plans for these areas created a form of “virtual stock”, as the actual release of planned land for development has remained largely unchanged to this day. What changed during the 2010s, however, was the drastic slowdown of the peri-urbanization process in broad sprawl patterns.

3.2. An Assessment of the SDG Indicator 11.3.1 in Thermi M.U.

3.2.1. Land Use/Land Cover Change During the Study Period, Municipality of Thermi and Thermi M.U.

Throughout the Municipality of Thermi, in the years 1990, 2000, 2006, 2012, and 2018, the presence of extensive artificial surfaces was evident. Specifically, urban areas consist of scattered buildings that extend into and fragment vegetation zones and natural terrain, creating a discontinuous spatial pattern. Additionally, industrial and commercial zones, as well as transport networks, are well-developed across the study area. These include the existing road network and the city’s airport infrastructure, located in the northwest near the coastal border. Areas of mining and quarrying activities are also identified, with a primary focus on the open-pit extraction of industrial and other minerals. Moreover, there are artificial, non-agricultural green zones, which include structured urban green spaces, sports complexes, and recreational facilities.
The majority of the land in The Municipality of Thermi is dominated by agricultural areas, with the primary subcategory being non-irrigated arable land. These areas support a variety of crops, including flowers, orchards, nurseries, and medicinal, aromatic, and culinary plants. Smaller portions of the land are dedicated to permanent irrigated areas, where the crops are sustained using fixed infrastructure such as drainage networks and irrigation canals. Permanent crops, such as vineyards, occupy the land for extended periods and provide repeated harvests. Grassland areas, characterized by dense herbaceous vegetation, also constitute a smaller percentage of the total land use. Figure 4 presents the land cover in the Municipality of Thermi.
Figure 5 illustrates the temporal evolution of various land use and land cover categories within Thermi M.U. These categories were classified based on the standards of the Urban Atlas and are broadly distinguished into the following: continuous and discontinuous urban fabric; industrial and commercial zones; transportation infrastructure, including roads, railways, airports, and port areas; mining and mineral extraction and dump sites; construction sites; land without a current use; green urban areas; sports and leisure facilities; arable land; permanent crops; pastures; complex and mixed cultivation patterns; orchards; forests; herbaceous vegetation associations; open spaces with little or no vegetation; wetlands and water bodies.
The full classification scheme for Land Use/Land Cover (LU/LC) in UA2006, UA2012, and UA 2018, across all hierarchical levels, is detailed in the official documentation [35]. In 2012, the original 2006 nomenclature was expanded to include a distinct wetland category and more detailed subdivisions within agricultural and natural areas. Notably, the 2012 and 2018 classification system introduces finer granularity in categories 2 and 3 by breaking them into additional subclasses and formally distinguishing wetlands as a separate class. It should be clarified that the classes “open spaces with little or no vegetation” (320 00) and “combinations of herbaceous vegetation” (330 00) from the Urban Atlas 2012 and 2018 database (category 3) are included within the “rural and semi-natural space” category (category 2) in the Urban Atlas 2006 database. In 2006, agricultural and semi-natural areas dominated, covering 74.3% of Thermi M.U, followed by industrial and commercial infrastructure at 8%. Smaller percentages of land coverage were occupied by airport facilities (5.1%), discontinuous urban fabric (4%), road axes (2.7%), and continuous urban fabric (1.2%). All other land cover categories accounted for less than 1% of the total area.
The 2012 land cover analysis reveals notable trends of landscape change. These changes stem both from modifications in the structure and methodology of the Urban Atlas tool but mostly from the socio-economic pressures that drove the transformations in the case study area’s landscape. Herbaceous vegetation combinations (36.9%), pasture (20.1%), and arable land (15.4%) remained the dominant land cover. However, incremental increases in industrial and commercial areas (8.9%) and discontinuous urban fabric (4.7%, primarily for residential use), as well as expansions in individual structures, construction sites, and mining sites, indicate a diffuse pattern of development and fragmentation of the rural landscape.
By 2018, a slight decrease in arable land and a parallel increase in scattered urban infrastructure were observed compared to 2012. Notable changes that require attention include shifts in agricultural land use, primarily driven by pressures to abandon marginal lands and the urbanization of farmland—all of which contribute to land take. The results also underscore the conversion of land into agricultural use at the expense of natural areas, along with changes in forested areas, which have had considerable impacts on the region’s ecosystem.
Through the extraction and processing of data, 17 land cover classes were identified and subsequently reclassified based on their characteristics to create four new land cover classes, as detailed in Table 3 and visualized in Figure 6. This grouping was deemed necessary for an in-depth analysis of the land consumption, aligning with the literature reviewed and the definition of SDG indicator 11.3.1 [24]. Moreover, this approach facilitates the comparative analysis of both qualitative and quantitative aspects across different time periods for the study area. It also enables an assessment of the rate and nature of spatial transformations over time.
The apparent reclassification of artificial surfaces to agricultural land between 2001 and 2006 does not necessarily reflect the actual land use reversals. Rather, these changes can be attributed to the methodological discrepancies between the datasets used between the Urban Atlas classifications and the historical land cover data obtained from the records of the consultancy firm, Geochoros SA. From the reclassification and creation of the four land cover classes, the total artificial surface for each year of analysis was calculated. These calculations are presented in Figure 7, which depicts the area of artificial surfaces for each year.

3.2.2. Computation of the Land Consumption Rate (LCR) and Population Growth Rates (PGRs)

To calculate the land consumption rate (LCR) in Thermi M.U., based on these values of Urban Extent we determined the area of artificial surfaces (Urbtx) for the years under analysis (2001, 2006, 2012, and 2018). The LCR was then calculated using the following Equation (5):
L C R = l n U r b t + n U r b t γ
where:
  • Urbt: the total built-up area in the initial year (km2);
  • Urbt+n: the total built-up area in the previous year (km2);
  • y: the number of years between Vpresent and V past (the considered period in years).
The results in Table 4 indicate that, from 2001 to 2018, the artificial surfaces in the study area appropriated land from other uses at an annual rate of 0.5%. The highest rate of land consumption occurred during the period 2006–2012, with a rate of 1.05%. The smaller percentage increase observed during the years 2001–2006 can be attributed to the fact that new artificial surfaces were developed as extensions of the existing residential cores. In contrast, during the years 2006–2012, development occurred more peripherally and in a diffuse form.
The population growth rate (PGR) is calculated using the total population within the study area during the analysis period, following Equation (6) below, and the results are presented in Table 5.
P G R = l n P o p t + n P o p t γ
where:
  • ln the value of the natural logarithm;
  • Popt: the total population within the study area in the initial year;
  • Popt+n: the total population within the study area in the final year;
  • Y: the number of years between the two measurement periods.
To estimate the population evolution for the years 2006, 2012, and 2018, population data from the EL.STAT censuses for 2001, 2011, and 2021 were utilized. Reductions were applied as follows: for 2006 and 2012, the average annual growth rate (AGR) for the period 2001–2011 was used. For 2018, a significantly reduced MERM was employed, considering the population growth rate of the entire Municipality of Thermi during 2011–2021. For the population estimation of Thermi M.U., this rate was adjusted upward by a percentage. The adjustment was based on construction activity data, which indicated that Thermi M.U. exhibited relatively significant construction activity during the 2010s compared to other M.U.s within the municipality and the wider Thessaloniki area.

3.2.3. LCRPGR Indicator Analysis

The final index, LCRPGR (Land Consumption Rate and Population Growth Rate), is summarized in the following Equation (7) and the results are presented in Table 6.
LCRPGR = Land Consumption Rate/Population Growth Rate
L C R P G R = l n U r b t + n U r b t γ l n P o p t + n P o p t γ
Values approaching and slightly below unity indicate a compact growth model characterized by efficient spatial organization, proximity among activities and services, and congruent population growth relative to new developments. Conversely, values significantly below unity often reflect urban areas experiencing challenges such as urban sprawl, high infrastructure costs, reliance on motorized transport, and widespread environmental degradation.
In the case of Thermi M.U., the results reveal a population growth rate that surpasses the growth rate of artificial surfaces. This trend is attributed to the suburbanization observed in previous years, driven by a demand for housing outside the urban core and a preference for improved living conditions. The value of LCRPPGR (SDG indicator 11.3.1) for all the analyzed years indicates an inefficient use of the available land. However, urban development is shaped by a multitude of factors that cannot be fully captured or generalized through a single index.

3.2.4. Urban Infill Indicator Analysis

To provide deeper insights, it is essential to incorporate secondary measures of SDG indicator 11.3.1, such as the total change in the built-up area, which is a measure of the total increase in artificial areas within the urban area over time. Additionally, the rate of change in “urban voids” (urban infill) serves as an important metric for interpreting and monitoring the urban development patterns. This indicator evaluates the densification of the built environment over time, capturing the emergence of new developments.
The urban infill is calculated using the same inputs as the land consumption rate for the different analysis years, based on the below Equation (8):
T o t a l   c h a n g e   b u i l d   u p   a r e a ( % ) = U r B U t + n U r B U t U r B U t
where:
  • UrBUt+n is the total built-up area in the urban area/city over time for the current/final year
  • UrBUt is the total built-up area in the urban area/city over time for the past/initial year
Table 7 presents the results of the Urban Infill indicator. The most significant change occurred between 2006 and 2012, with a 6.5% increase. In comparison, the change during 2001–2006 was relatively modest at 1.8%, while it declined further to 0.9% between 2012 and 2018, coinciding with the economic recession in Greece. Overall, between 2001 and 2018, urban areas experienced a cumulative change of 9.4%.
Finally, Figure 8 illustrates the spatial patterns of urban sprawl and land take over time along with their relationship to the designated settlement area within the formal plan.

4. Discussion and Conclusions

This paper attempts to enhance the study of land take from the perspective of a Mediterranean city and investigates the phenomenon of land take in the city of Thessaloniki, which had typical compact features until 30 years ago. It provides, on the one hand, an overview of the spatial patterns of urban sprawl—the main driver of land take—and, on the other, a quantitative perspective through the calculation of SDG indicator 11.3.1, which measures the ratio of the rate of land consumption to the rate of population growth.
The first part of our study provided an overview of the urban sprawl in Thessaloniki and highlighted that the urban sprawl in Thessaloniki is a relatively recent phenomenon that began after the mid-1990s, as was the case in other Mediterranean cities [19], and continuing until the late 2000s. As the literature points out, the form of dispersal and the fragmentation patterns, and consequently land take, vary from region to region [13,19,20]. The detailed analysis of land use and land cover changes in the peri-urban areas of Thessaloniki that experienced intense development in the period under review provides ample evidence of these variations, along with valuable insights into the patterns of urban sprawl and land take. These findings reveal significant trends in the spatial and landscape transformation.
One of the crucial aspects of urban growth and change in the twenty years preceding the outbreak of the economic crisis was the “artificial” and largely unrestricted supply of land for residential development. This was enabled by formal regulations of general laws, whose implementation ultimately weakened the spatial planning system, as well as due to the widespread informality. All these processes led to a great dispersion of urban land uses throughout the peri-urban areas and consequently led to a continuous loss of control over urban sprawl, with critical economic, political, social, and environmental impacts.
The second part of our study focused on the land take, defined as the conversion of primarily natural land into artificial surfaces, which compromises the land’s ecological functions. Its aim was to estimate the land take in Thessaloniki using simple metrics such as the SDG 11.3.1 indicator and the complementary Urban Infill indicator, and employing as a case study a rapidly growing peri-urban area rather than the entire urban region. This approach enables a more nuanced understanding of the relationship between population growth and land consumption within the sprawled structure of a metropolitan area. Such insights help fill the gap regarding how the critical drivers of urban sprawl, such as the specific features of the development process and regulatory framework, are interrelated with the land take patterns. In addition, they are essential for informing policies, including the EU’s objective of achieving land take neutrality.
In the study area, the Municipality of Thermi, specifically Thermi M.U., a typical example of what we called in this paper middle-class-led peri-urbanization, the population growth rate exceeds the rate of artificial surface expansion. While this finding may seem to contradict the existing literature and policy reports [2,3,4,5], it was not unexpected, as urban development patterns vary significantly between regions due to their socio-economic and geo-spatial differences. Nonetheless, the study highlights the alarming reduction and fragmentation of large, homogeneous open spaces, primarily caused by the expansion of artificial surfaces at the expense of agricultural and natural areas. This process contributes to agricultural abandonment, degrades natural processes, and disrupts ecosystem services.
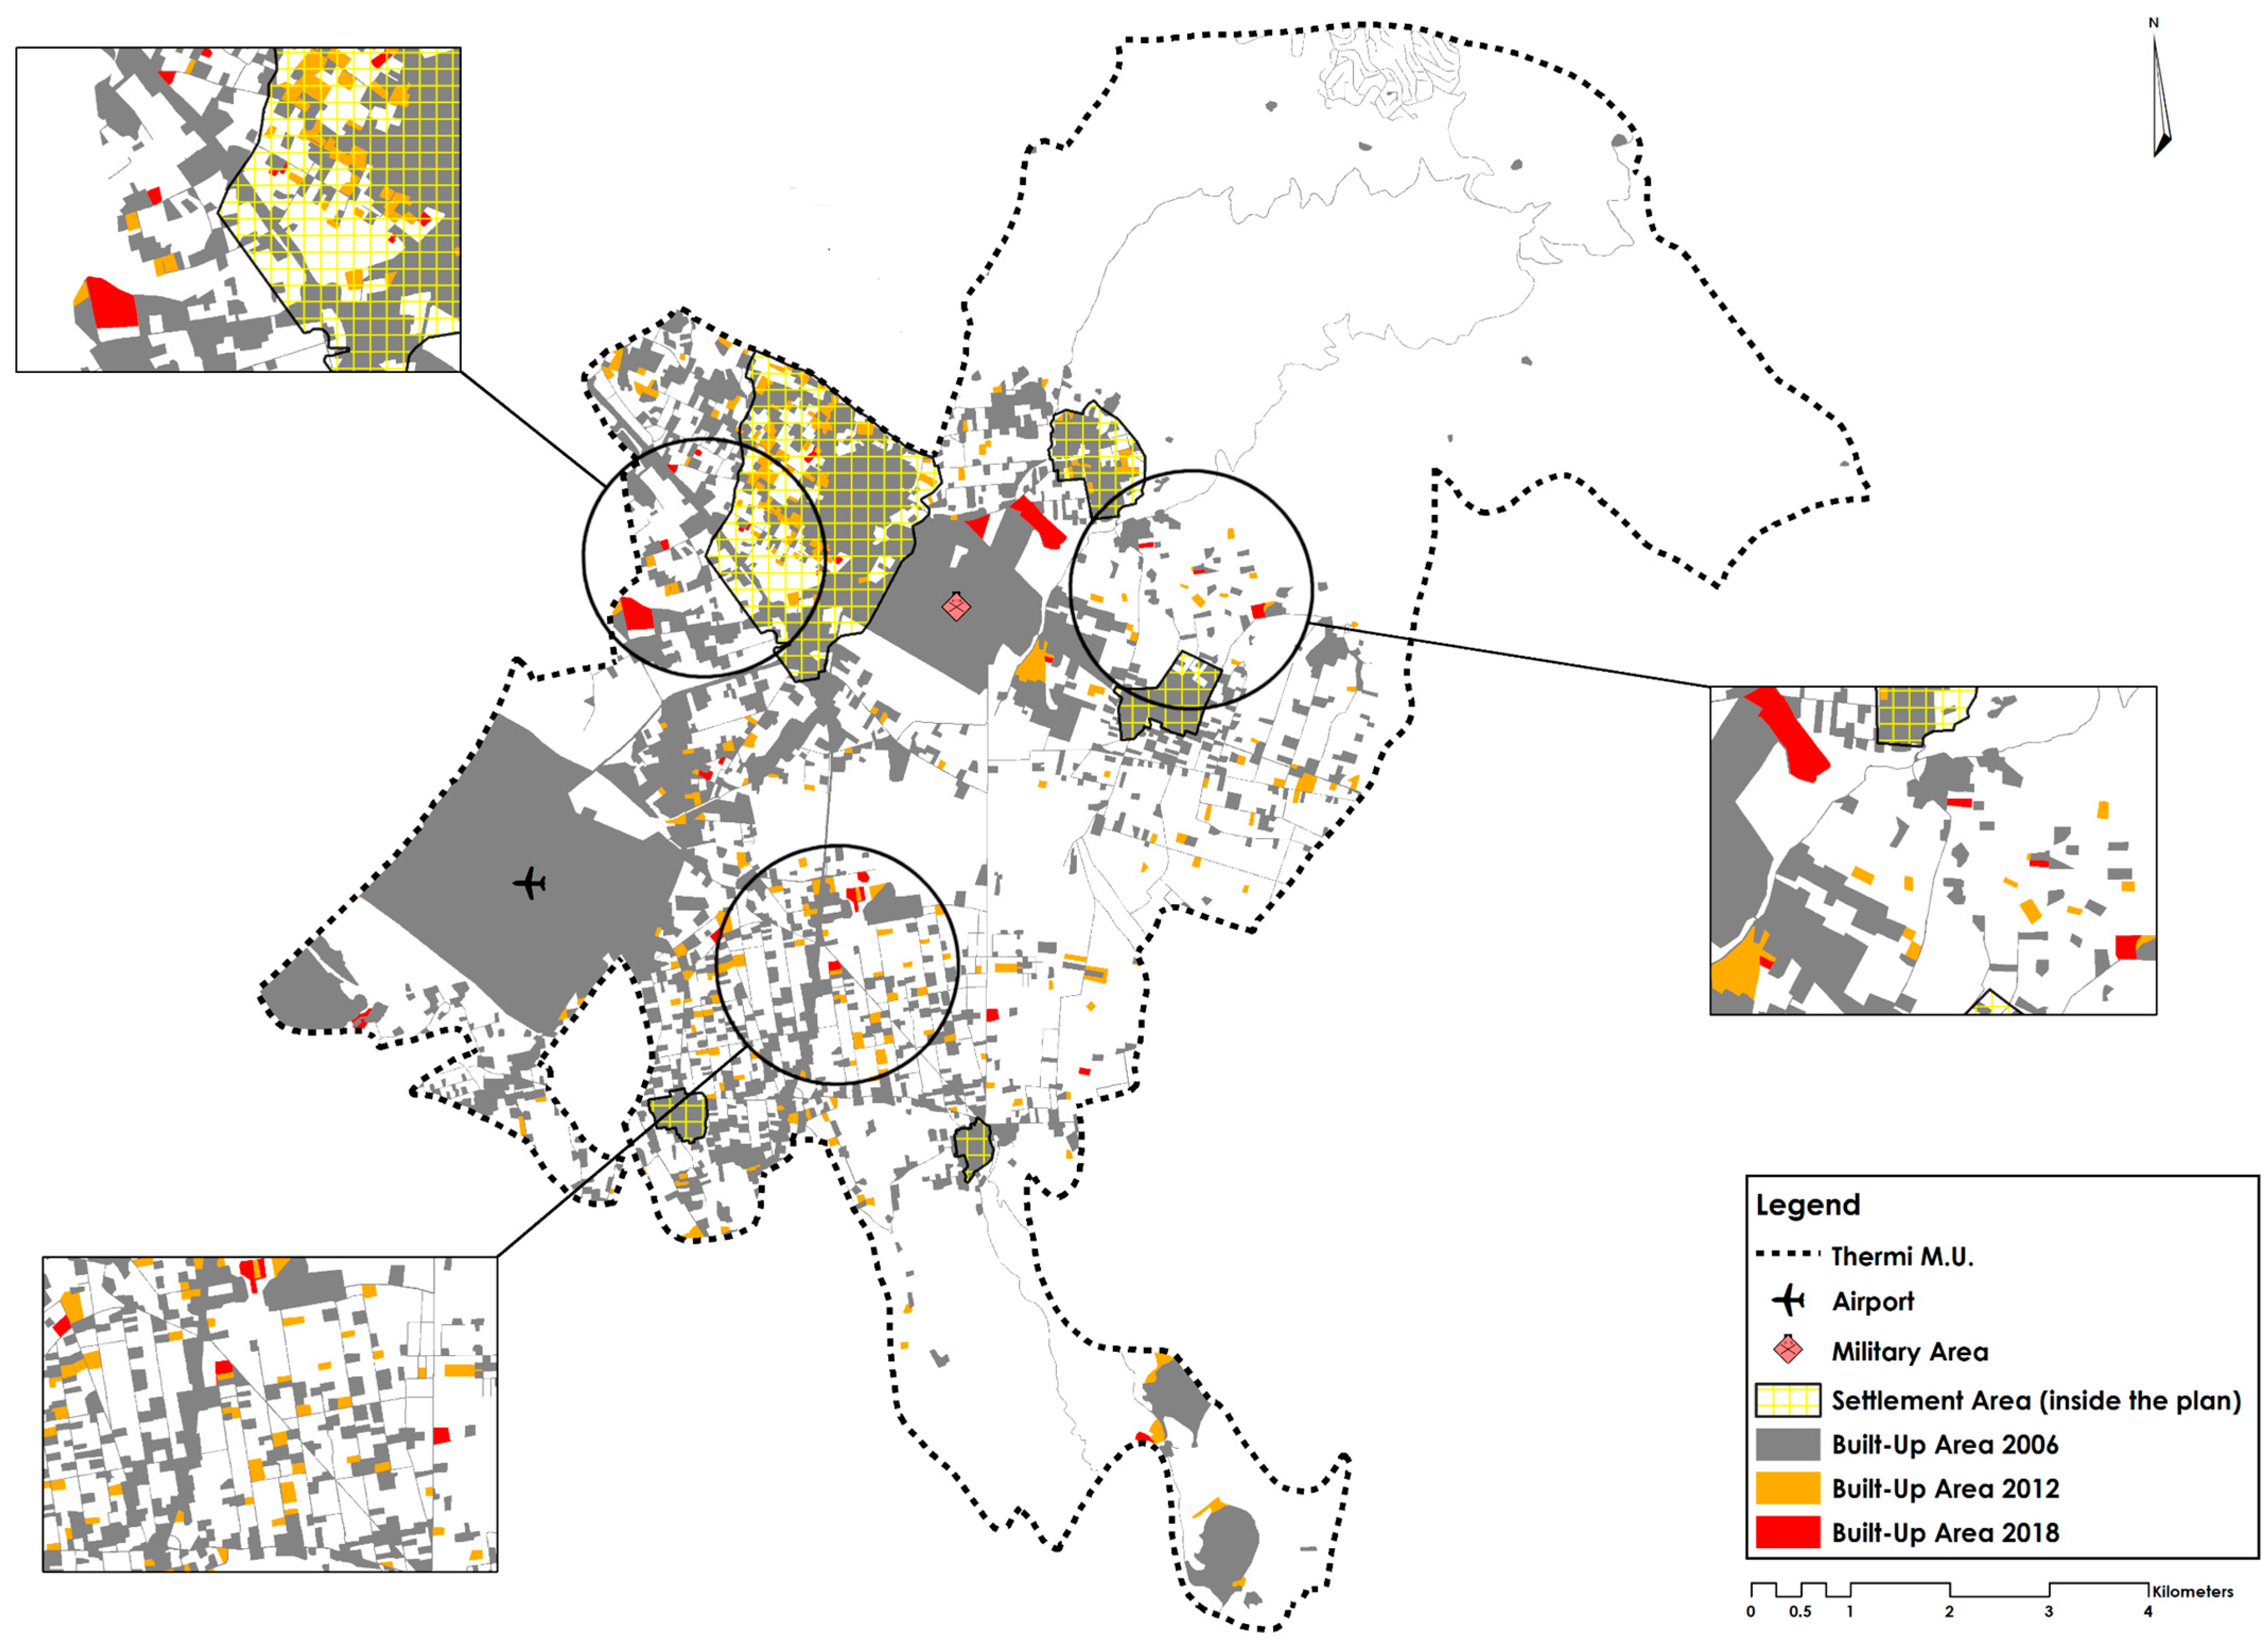
The urban sprawl in the study area followed a patchy, to a large extent linear pattern along the major road axes, with clear tendencies toward discontinuity, particularly during the 2006–2012 period. This linear development was concentrated along the main road corridors connecting Thessaloniki with the airport and the resort areas of Halkidiki. Additionally, scattered land cover changes fragmented the agricultural and natural landscapes throughout the study area, particularly between the main settlement, Thermi, and the two nearest smaller settlements. The expansion of artificial surfaces was also evident around the airport, originating from the developments established before 2001, which served as focal points for the further peri-urban sprawl.
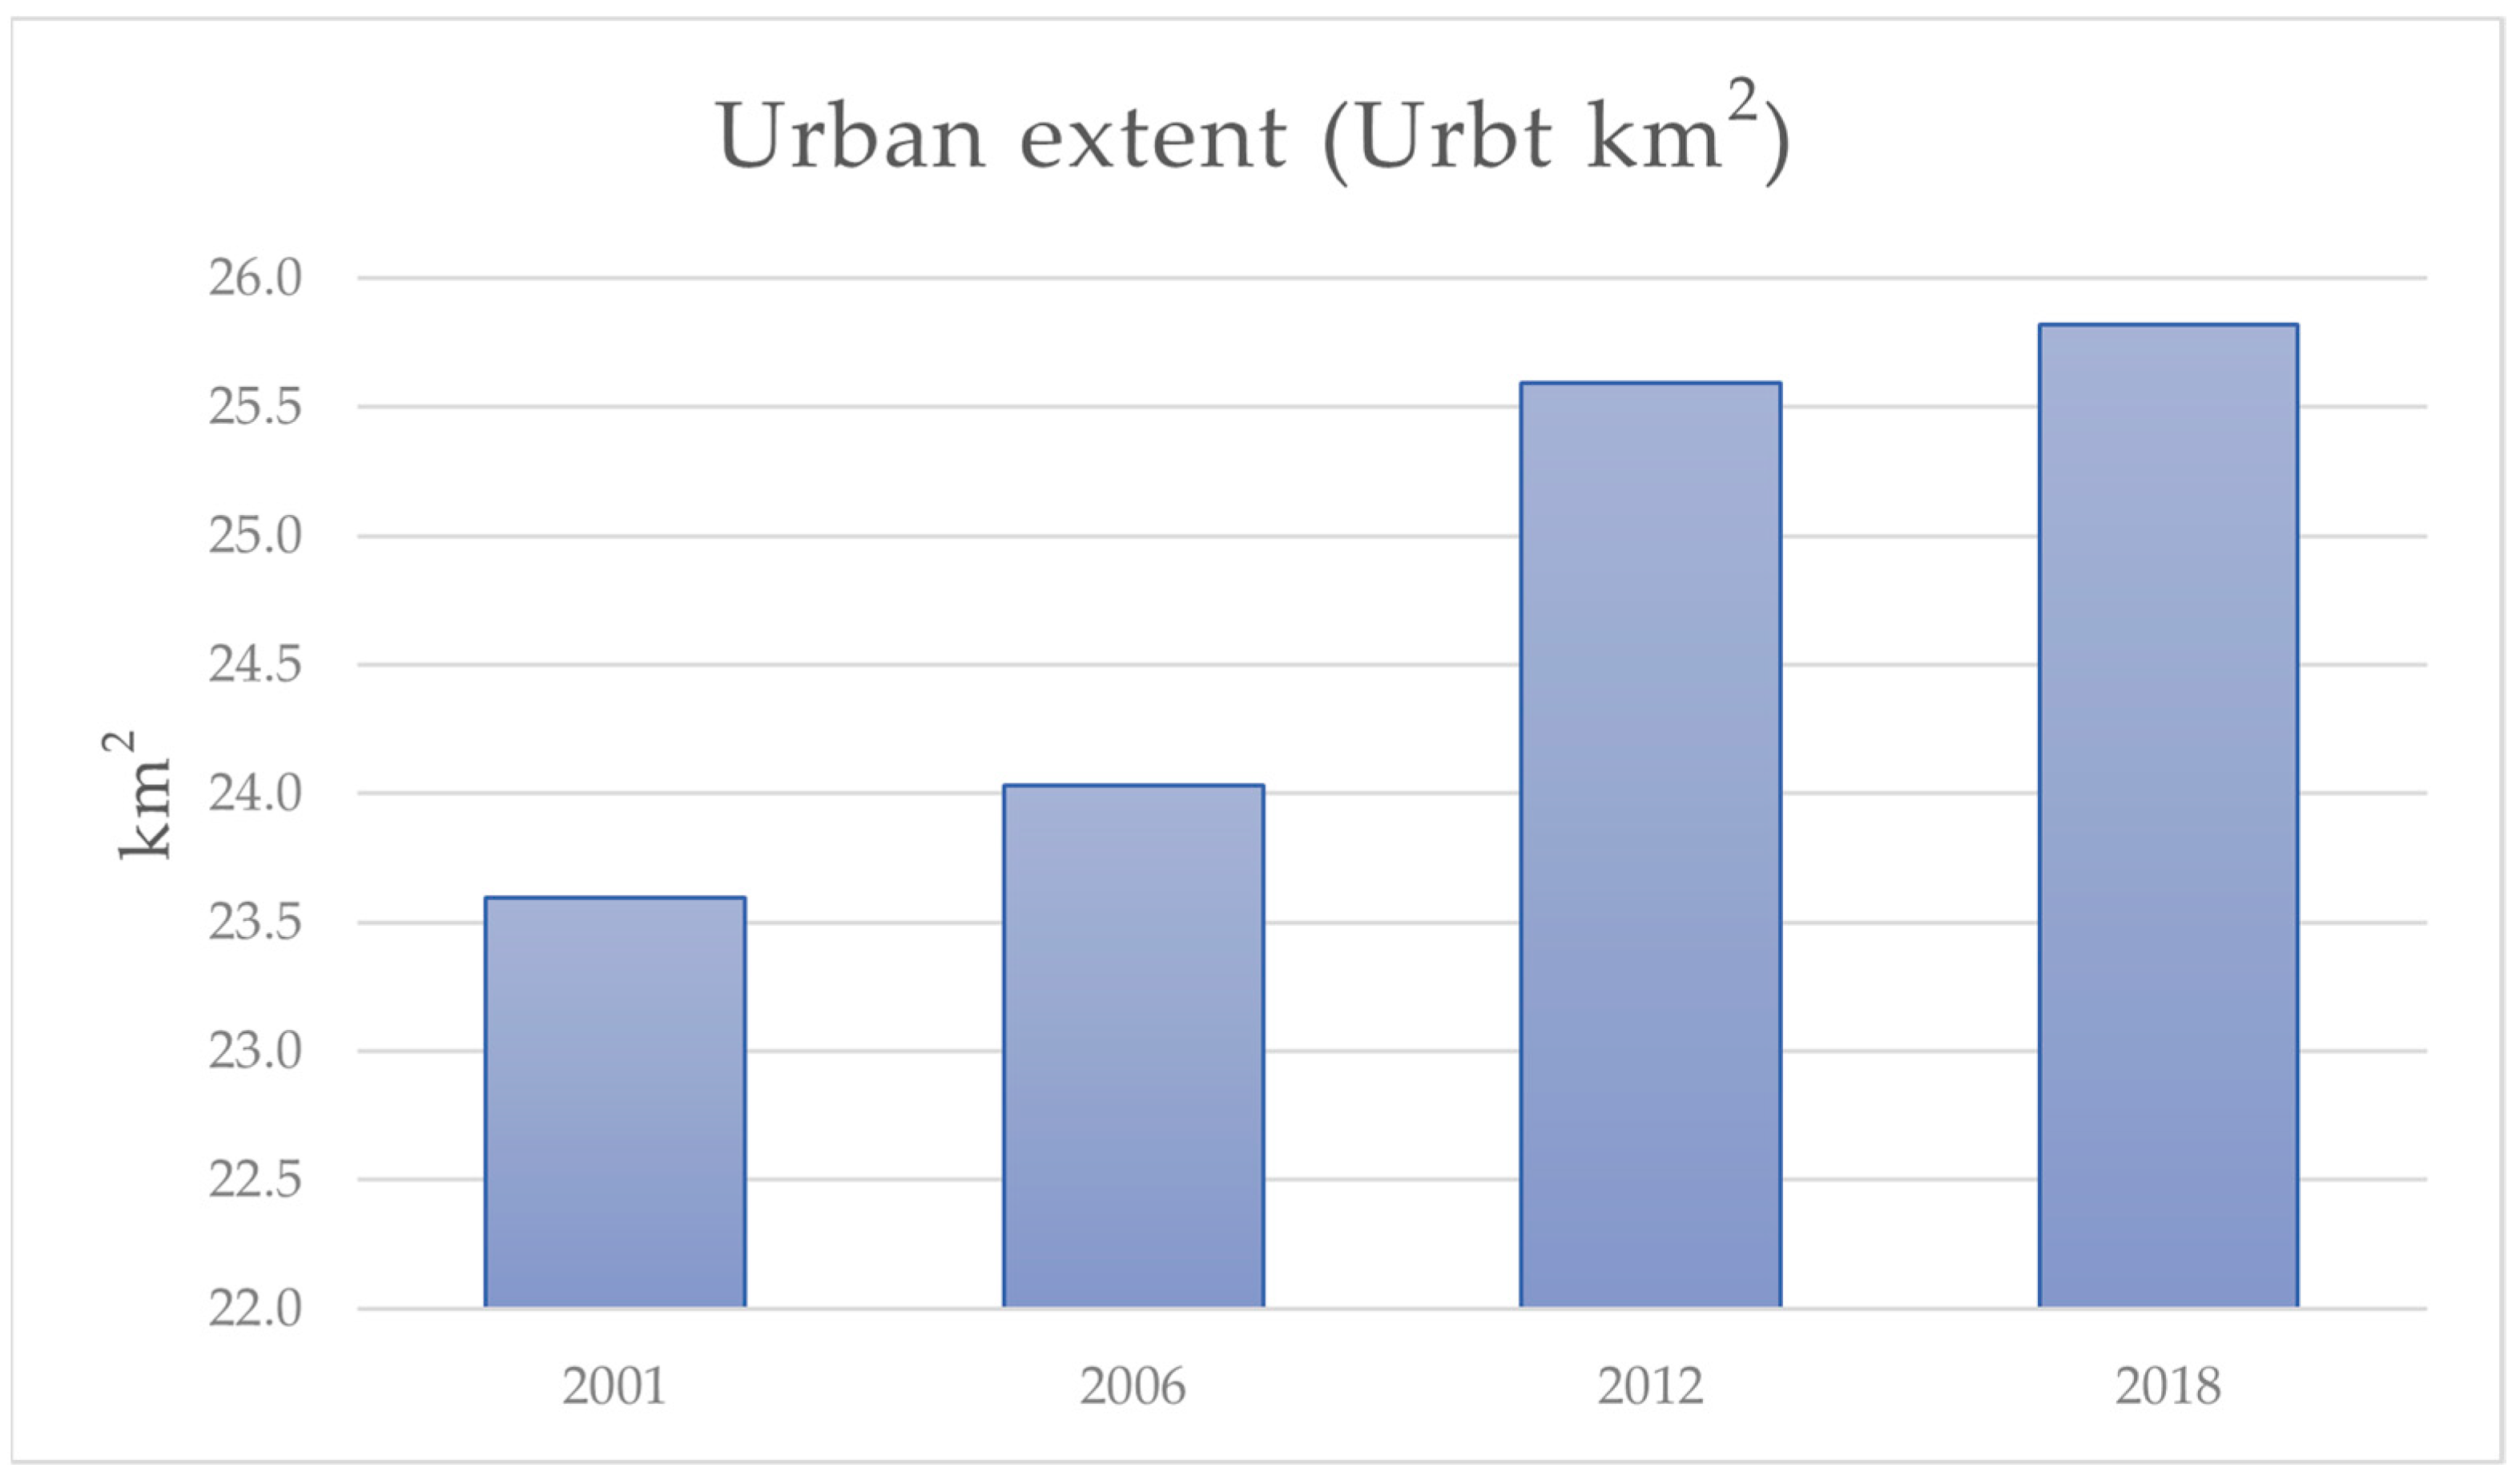
During the 2012–2018 period, the urban sprawl was markedly less dynamic, primarily due to the economic recession and its impact on the building activity and suburban growth. During this time, only 0.3 km2 of new artificial surfaces were added, with a more spatially limited and homogeneous pattern of expansion. This growth was, in fact, concentrated mainly within the Thermi planned area, the officially designated zone for urban development that was enacted and released for development by the end of the 2000s. This decade also marked a shift in the subsequent housing demand, either toward PSTh or the two largest and largely self-sufficient settlements in the peri-urban zone, Thermi and Oreokastro, as indicated by the 2021 census data.
The above findings provide valuable insights for the regulation and management of urban sprawl. As cities grow, the land take also increases, but it occurs in diverse and complex forms. More compact forms of urban growth and expansion are generally considered more compatible with natural land ecosystems, although such forms are not without environmental implications. This presupposes that planning should accommodate a wide range of spatial forms, including sustainable suburban configurations that meet the need for housing and urban functions, while simultaneously adopting more environmentally responsible physical structures. In any case, urban planning must also take into account the multiple factors that influence urban development and contribute to land take rather than rely on linear interpretations of indicators. The main limitations of this study outline the future research directions. It is important to note that, given the scale of mapping and the inherent limitations of such spatial analyses, the findings are not intended to provide precise descriptions of the spatial changes. Instead, they offer general conclusions that serve as a basis for further investigation. It is also important that such a study encompasses the entire urban area, including its distinct urban zones, in order to more effectively highlight the overall patterns of land take across the urban system.
Moreover, a significant limitation relates to the nature of the SDG 11.3.1 indicator and its interpretation. The factors influencing the urban development patterns are multifaceted, making it challenging to derive comprehensive conclusions from a single indicator. Incorporating secondary indicators, derived from the same datasets, offers deeper insights and a more nuanced understanding of the results. For instance, comparing the rates of land consumption and population change across areas with similar characteristics provides a more robust analytical framework. No dataset, however, can perfectly capture the detailed dynamics of land cover changes. Developing localized methods for quantitative and automated spatial analysis can improve the objectivity and accuracy of assessments and predictions. These efforts can be strengthened by leveraging extensive, calibrated, and validated datasets.
Nonetheless, the availability of core datasets with consistent specifications for cross-domain applications remains limited. Thus, the creation of up-to-date and regularly updated land cover and land use maps is essential. Such resources would support the decision making at the local, regional, and national levels by facilitating the sustainable management of natural environments and urban areas. The study of land take can guide the spatial planning processes, inform the coordination of policies, and ensure the preservation of natural reserves. Moreover, these efforts enable the timely monitoring of the changes resulting from anthropogenic activities (e.g., tourism, holiday home construction, unplanned development) and natural disasters, while providing critical information for assessing the environmental impacts of the socio-economic processes. This, in turn, supports the formulation of effective spatial planning supporting development and at the same time protecting natural landscapes and preserving their ecosystem services.

Author Contributions

Conceptualization, A.Y. and G.Z.; methodology, A.Y. and G.Z.; software, G.Z.; validation, A.Y. and G.Z.; formal analysis, G.Z.; investigation, A.Y. and G.Z.; writing—original draft preparation, A.Y. and G.Z.; writing—review and editing, A.Y. and G.Z.; visualization, G.Z.; supervision, A.Y. All authors have read and agreed to the published version of the manuscript.

Funding

This research received no external funding.

Data Availability Statement

Data are contained within the article.

Conflicts of Interest

The authors declare no conflicts of interest.

References

  1. Johnson, M.P. Environmental Impacts of Urban Sprawl: A Survey of the Literature and Proposed Research Agenda. Environ. Plan. A: Econ. Space 2001, 33, 717–735. [Google Scholar] [CrossRef]
  2. Colsaet, A.; Laurans, Y.; Levrel, H. What drives land take and urban land expansion? A systematic review. Land Use Policy 2018, 79, 339–349. [Google Scholar] [CrossRef]
  3. Couch, C.; Leontidou, L.; Petschel-Held, G. Urban Sprawl in Europe: Landscapes, Land-Use Change & Policy; Blackwell Publishing: Oxford, UK, 2007. [Google Scholar] [CrossRef]
  4. European Environment Agency. Urban Sprawl in Europe, The Ignored Challenge. EEA Report No 10/2006. Available online: https://www.eea.europa.eu/publications/eea_report_2006_10/eea_report_10_2006.pdf/view (accessed on 1 October 2024).
  5. European Environment Agency. Urban Sprawl in Europe Joint EEA-FOEN Report. EEA Report 11/2016. Available online: https://www.eea.europa.eu/en/analysis/publications/urban-sprawl-in-europe (accessed on 1 October 2024).
  6. European Environment Agency. Land Take and Land Degradation in Functional Areas. EEA Report 17/2021. Available online: https://www.eea.europa.eu/en/analysis/publications/land-take-and-land-degradation (accessed on 10 October 2024).
  7. Siedentop, S.; Fina, S. Monitoring urban sprawl in Germany: Towards a GIS-based measurement and assessment approach. J. Land Use Sci. 2010, 5, 73–104. [Google Scholar] [CrossRef]
  8. Bruechner, J.K. Urban Sprawl: Diagnosis and Remedies. Int. Reg. Sci. Rev. 2000, 23, 160–171. [Google Scholar] [CrossRef]
  9. Ehrlich, M.V.; Hilber, C.A.L.; Schöni, O. Institutional settings and urban sprawl: Evidence from Europe. J. Hous. Econ. 2018, 42, 4–16. [Google Scholar] [CrossRef]
  10. Marquard, E.; Bartke, S.; Gifreu i Font, J.; Humer, A.; Jonkman, A.; Jürgenson, E.; Marot, N.; Poelmans, L.; Repe, B.; Rybski, R.; et al. Land Consumption and Land Take: Enhancing Conceptual Clarity for Evaluating Spatial Governance in the EU Context. Sustainability 2020, 12, 8269. [Google Scholar] [CrossRef]
  11. European Commission. The Communication from the Commission to the European Parliament, the Council, the European Economic and Social Committee and the Committee of the Regions: “Roadmap to a Resource Efficient Europe”. COM/2011/0571 Final 2011. Available online: https://eur-lex.europa.eu/legal-content/EN/TXT/PDF/?uri=CELEX:52011DC0571 (accessed on 10 October 2024).
  12. European Environment Agency. Net Land Take in Cities and Commuting Zones in Europe. Indicator Assessment 2023. Available online: https://www.eea.europa.eu/data-and-maps/indicators/land-take-3/assessment (accessed on 10 October 2024).
  13. Bagan, H.; Yamagata, Y. Land-cover change analysis in 50 global cities by using a combination of Landsat data and analysis of grid cells. Environ. Res. Lett. 2014, 9, 064015. [Google Scholar] [CrossRef]
  14. UN-Habitat. SDG Indicator 11.3.1 Training Module: Land Use Efficiency; United Nations Human Settlement Program (UN-Habitat): Nairobi, Kenya, 2018. [Google Scholar]
  15. Eichhorn, S.; Adam, B.; Schürholt, K.; Jansen, H.; Kötter, T.; Terfrüchte, T.; Eichfuss, S.; Rohde, N.; Wilberz, J.; Stielike, J.M. No net land take policy in practice: Applications and potentials of planning instruments in municipalities. Results of an online survey in North Rhine-Westphalia. Raumforsch. Und Raumordn. 2024, 82, 68–84. [Google Scholar] [CrossRef]
  16. Decoville, A.; Feltgen, V. Towards a credible, relevant and legitimate implementation framework for the EU no net land take objective. J. Environ. Plan. Manag. 2025, 1–21. [Google Scholar] [CrossRef]
  17. Bovet, J.; Marquard, E.; Schröter-Schlaack, C. International Expert Workshop on Land Take, 4–5 April 2019 in Berlin, Germany. Workshop Report; Helmholtz Centre for Environmental Research (UFZ): Leipzig, Germany, 2019. [Google Scholar]
  18. Salvati, L.; Carlucci, M. Patterns of Sprawl: The Socioeconomic and Territorial Profile of Dispersed Urban Areas in Italy. Reg. Stud. 2015, 50, 1346–1359. [Google Scholar] [CrossRef]
  19. Salvati, L.; Morelli, V.G. Unveiling Urban Sprawl in the Mediterranean Region: Towards a Latent Urban Transformation? Int. J. Urban Reg. Res. 2014, 38, 1935–1953. [Google Scholar] [CrossRef]
  20. Lagarias, A.; Sayas, J. Urban sprawl in the Mediterranean: Evidence from coastal medium-sized cities. Reg. Sci. Inq. 2018, 10, 15–32. [Google Scholar]
  21. Yiannakou, A. Patterns of suburban growth and sprawl in Thessaloniki: Spatial aspects of a multifaceted crisis. In Proceedings of the 10th Regular Scientific Conference of the Greek Section of ERSA: Economic Crisis and Development and Cohesion Policies, Thessaloniki, Greece, 1–2 June 2012. (In Greek). [Google Scholar]
  22. Lagarias, A. Impervious Land Expansion as a Control Parameter for Climate-Resilient Planning on the Mediterranean Coast: Evidence from Greece. Land 2023, 12, 1844. [Google Scholar] [CrossRef]
  23. Lagarias, A.; Stathakis, D. Towards a more realistic estimation of urban land take by combining cadastral parcels and building footprints. Environ. Plan. 2024, 0. [Google Scholar] [CrossRef]
  24. UN-Habitat. SDG Indicator 11.3.1: Ratio of Land Consumption Rate to Population Growth Rate—Metadata Document; United Nations Human Settlements Programme (UN-Habitat): Nairobi, Kenya, 2021. Available online: https://sdg.data.gov/11-3-1/ (accessed on 1 April 2025).
  25. Ghazaryan, G.; Rienow, A.; Oldenburg, C.; Thonfeld, F.; Trampnau, B.; Sticksel, S.; Jürgens, C. Monitoring of Urban Sprawl and Densification Processes in Western Germany in the Light of SDG Indicator 11.3.1 Based on an Automated Retrospective Classification Approach. Remote Sens. 2021, 13, 1694. [Google Scholar] [CrossRef]
  26. Wang, Y.; Huang, C.; Feng, Y.; Zhao, M.; Gu, J. Using Earth Observation for Monitoring SDG 11.3.1-Ratio of Land Consumption Rate to Population Growth Rate in Mainland China. Remote Sens. 2020, 12, 357. [Google Scholar] [CrossRef]
  27. Esri, Maxar, Earthstar Geographics, and the GIS User Community. Available online: https://www.arcgis.com/home/item.html?id=10df2279f9684e4a9f6a7f08febac2a9 (accessed on 1 April 2025).
  28. Lagarias, A. Exploring land use policy scenarios with the use of a cellular automata-based model: Urban sprawl containment and sustainable development in Thessaloniki. Geocarto Int. 2015, 30, 1033–1051. [Google Scholar] [CrossRef]
  29. Yiannakou, A. Urban Plans for Thessaloniki: Ideology and practice during the 20th century. In Thessaloniki at the Verge: The City as a Transformation Process; Kafkalas, G., Lambrianidis, L., Papamichos, N., Eds.; Kritiki: Athens, Greece, 2008; pp. 447–487. (In Greek) [Google Scholar]
  30. Salvati, L. Neither ordinary nor global: A reflection on the ‘extra-ordinary’ expansion of Athens. Urban Plan. Transp. Res. 2014, 2, 49–56. [Google Scholar] [CrossRef]
  31. Karadimitriou, N.; Maloutas, T.; Arapoglou, V.P. Multiple Deprivation and Urban Development in Athens, Greece: Spatial Trends and the Role of Access to Housing. Land 2021, 10, 290. [Google Scholar] [CrossRef]
  32. Yiannakou, A. From sprawl to smog and the roles of spatial planning: Aspects of the “Greek crisis”. In Proceedings of the Joint AESOP/ACSP Congress, Dublin, Ireland, 15–19 July 2013. [Google Scholar]
  33. Delladetsima, P.M. Sustainable Development and Spatial Planning: Some considerations arising from the Greek case. Eur. J. Spat. Dev. 2012, 12, 46. [Google Scholar]
  34. Economou, D. The planning system and rural land use control in Greece: A European perspective. Eur. Plan. Stud. 1997, 5, 461–476. [Google Scholar] [CrossRef]
  35. Copernicus. Mapping Guide for an European Urban Atlas; European Union: Brussels, Belgium, 2016. [Google Scholar]
Figure 1. Methodological framework of the case study.
Land 14 00965 g001
Figure 2. Spatial zones of Greater Thessaloniki Area and the Municipal Unit of Thermi.
Land 14 00965 g002
Figure 3. Annual production of new dwellings (legal building activity) 1995–2019. Source: elaboration of data from EL.STAT., Surveys of Legal Building Activity, 1995–2019.
Land 14 00965 g003
Figure 4. Land cover in the Municipality of Thermi, (top) Corine land cover 1990; (bottom) Corine land cover 2018.
Land 14 00965 g004
Figure 5. Changes over time in the different categories of land use/land cover in Thermi M.U.
Land 14 00965 g005
Figure 6. Visualization of the four land cover classes for the years 2001, 2006, 2012, and 2018.
Land 14 00965 g006
Figure 7. Area of artificial surfaces for each year of analysis.
Land 14 00965 g007
Figure 8. Spatial patterns of urban sprawl and land take in Thermi M.U. over time.
Land 14 00965 g008
Table 1. Population change in Thessaloniki by zone, 1991–2021. Source: elaboration of data from EL.STAT Population Census, 1991–2021.
Spatial Zones1991200120112021Average Annual Rate of Change
1991–20012001–20112011–2021
PSTh780,948830,355793,583788,9570.62%0.45%0.06%
Inner peri-urban zone42,36867,04296,176102,7074.70%3.67%0.66%
Outer peri-urban zone81,186103,627125,031114,9342.47%1.90%0.84%
GTA906,4931,003,0251,016,8011,008,6191.02%0.14%0.08%
Regional Unit of Thessaloniki973,1001,084,0011,110,5511,092,9191.09%0.24%0.16%
Table 2. Number of new dwellings constructed in the period 1994–2019. Source: elaboration of data from EL.STAT. Surveys of Legal Building Activity, 1995–2019.
Spatial Zones1995–19992000–20042005–20081995–20082009–20122013–20152016–20192009–2019
PSTh29,87932,31733,54895,744426948710215777
Inner peri-urban zone48307987808520,90221283513572836
Outer peri-urban zone660312,285993728,82520503502662666
GTA41,31252,58951,570145,47184471188164411,279
Peri-urban zone/GTA27.67%38.55%34.95%34.18%49.46%59.01%37.90%48.78%
Table 3. Reclassification of existing land cover categories into new classes.
Urban Atlas CodeLand Cover ClassFinal Classification
111 00Continuous urban fabricArtificial surfaces
112 10Discontinuous dense urban fabric
113 00Isolated Structures
121 00Industrial, commercial, public, military, and private units
122 10Fast transit roads and associated land
124 00Airports
131 00Mineral extraction and dump sites
132 00Construction sites
133 00Land without a current use
141 00Green urban areas
142 00Sports and leisure facilities
210 00Arable landAgricultural and semi natural areas
230 00Pastures
310 00ForestsForests
320 00Herbaceous vegetation associations
330 00Open spaces with little or no vegetation
500 00WaterWater bodies and wetlands
Table 4. LCR values.
PeriodUBRt2UBRt1LCRLCR (%)
2001–200624.03204923.5958430.00370.37%
2006–201225.59270224.0320490.01051.05%
2012–201825.81708925.5927020.00150.15%
2001–201825.81708923.5958430.00530.53%
Table 5. PGR values.
PeriodPop2Pop1PGRPGR (%)
2001–200620,44216,5460.04234.23%
2006–201225,57420,4420.03733.73%
2012–201827,57325,5740.01251.25%
2001–201827,57316,5460.03003.00%
Table 6. LCRPGR values (SDG indicator 11.3.1).
PeriodLCRPGRLCRPGR = LCR/PGR
2001–20060.00370.04230.087
2006–20120.01050.03730.281
2012–20180.00150.01250.116
2001–20180.00530.03000.176
Table 7. Urban infill values per period.
PeriodUrban Infill (%)
2001–20061.8%
2006–20126.5%
2012–20180.9%
2001–20189.4%
Disclaimer/Publisher’s Note: The statements, opinions and data contained in all publications are solely those of the individual author(s) and contributor(s) and not of MDPI and/or the editor(s). MDPI and/or the editor(s) disclaim responsibility for any injury to people or property resulting from any ideas, methods, instructions or products referred to in the content.

