


Spatio-Temporal Evolution Characteristics of Tourism Ecological Resilience in China

Abstract
1. Introduction
2. Materials and Methods
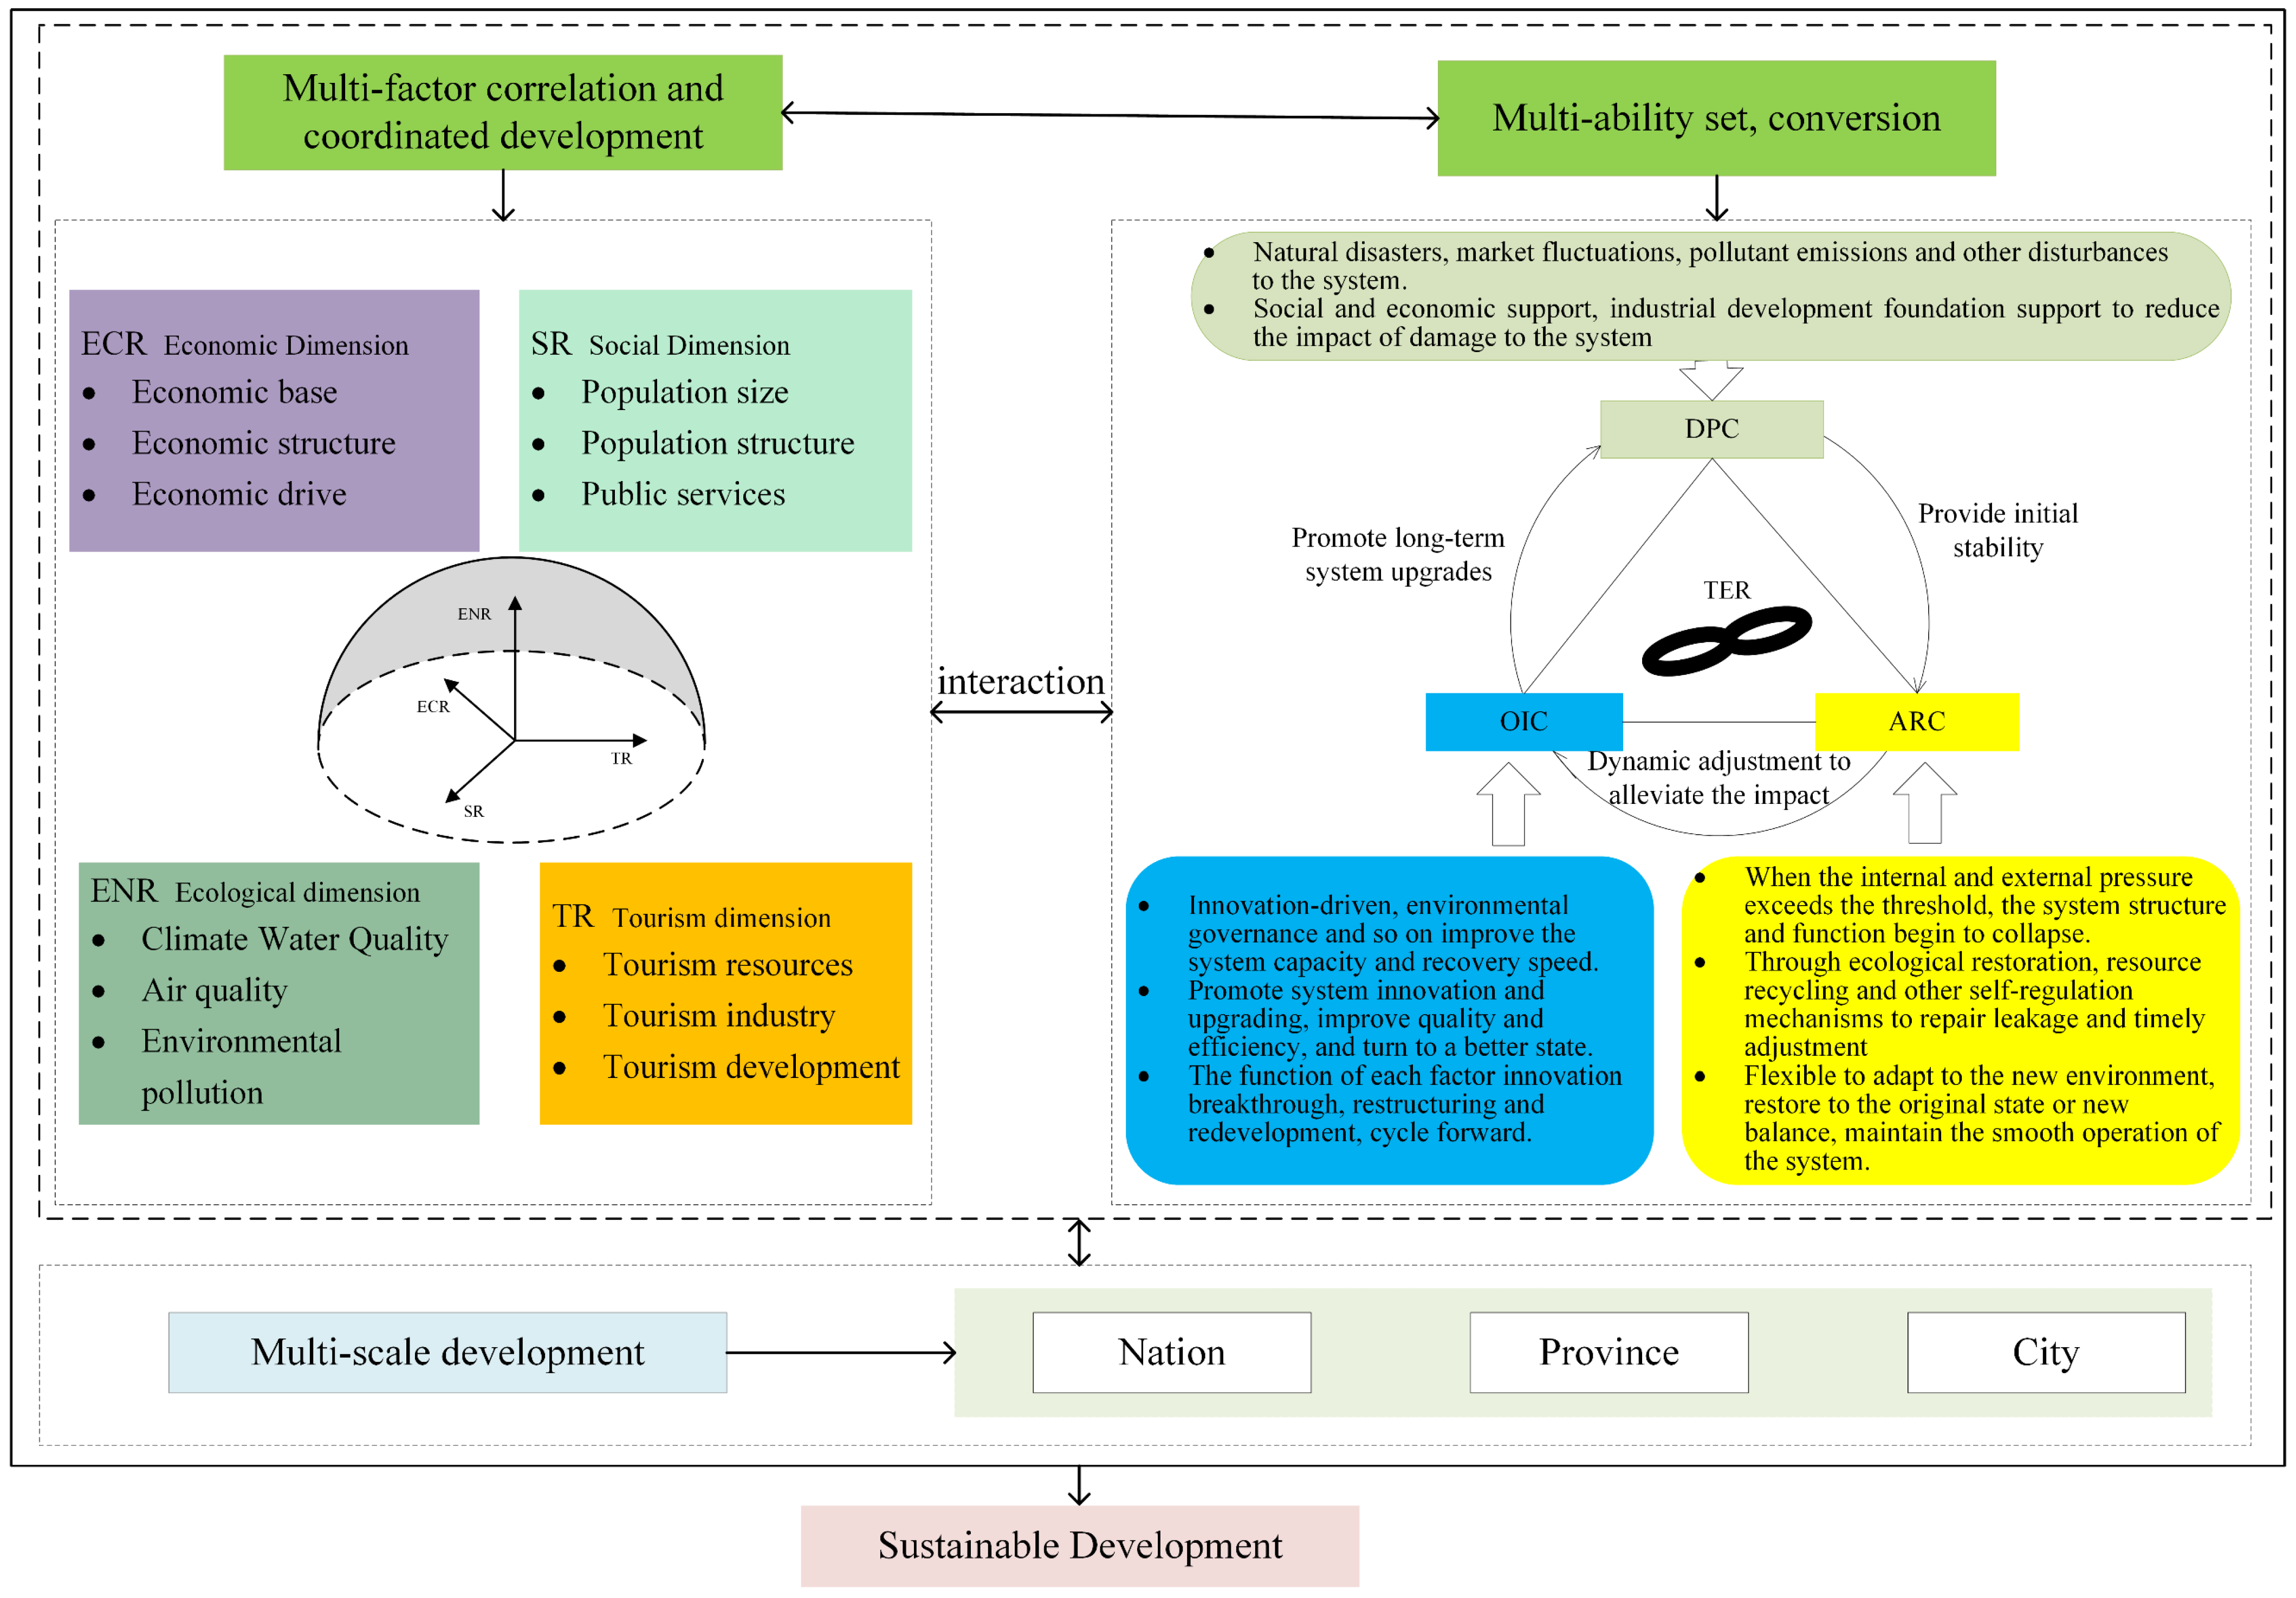
2.1. Theoretical Framework
- (1)
- DPC is the basis of the TER index system, which reflects the buffer capacity, ‘resistance’, and ‘basic stability’ of the system in the face of external shocks. Socio-economic support and the basic support for the development of the tourism industry itself are the basis for maintaining the operation of the tourism ecosystem and for the overall response of the tourism ecosystem to external pressures, which provide financial support and development momentum for the system to cope with shocks, and are also the guarantee for the tourism industry [51] to continue to carry out tourism activities in the face of external shocks. It can cope with the disturbance caused by insufficient system elements through the accumulation and reserve of elements, such as resource shortage, population loss, economic downturn, and natural disasters. Therefore, this study constructs indicators from three aspects: social and economic support, tourism attraction, and tourism reception capacity (Table 1). The stronger the tourism attraction, the greater the tourism population, indicating that the better the tourism market foundation, the greater the consumption potential, and the tourism industry is more capable of resisting the crisis [12]. The growth rate of tourist arrivals and the average daily tourist flow reflect the scale of tourism development and tourism attraction [52]. The density of A-level tourist attractions, star hotels, and travel agencies reflects the scale and reception capacity of tourism service facilities [53,54];
- (2)
- ARC is the core of the TER index system, reflecting the ability of ‘dynamic adaptation’ and ‘regulatory feedback’ after the system is disturbed. It is emphasized that when the system is faced with internal and external environmental changes or shocks (such as socio-economic changes, natural disasters, etc.), it absorbs exogenous disturbances through self-regulating mechanisms such as ecological restoration, resource recycling, tourism industry organization, and socio-cultural interaction mode to adapt to changes and dynamic recovery, reflecting the system’s adaptability, repair ability, and self-adjustment feedback mechanism. The potential damage and ecological environment pressure caused by pollutant emission intensity to the ecological environment of tourist destinations are mainly manifested in the types of waste water, waste gas, solid waste, domestic waste pollution, etc., which are non-exclusive and indivisible. The system actively resists and absorbs the disturbance caused by internal vulnerability through the robustness and stability of its own functions, such as industrial self-regulation and green environment restoration, and adapts to changes, dynamic recovery, and timely feedback, reflecting the adaptability, repair ability, and self-adjustment feedback mechanism of the system to cope with pressure. Abundant water resources (e.g., precipitation indicators) support higher biodiversity and vegetation cover, better sustain agriculture, forestry, and other productive activities, and, thus, enhance ecosystem resilience [55]. Therefore, this study constructs indicators from three aspects, ecological environment pressure, industrial self-regulation, and green environmental restoration (Table 1) to improve the carrying capacity of the system to absorb disturbances and dynamically adapt to timely feedback so as to respond to various changes and new situations more flexibly and maintain the stable development of the system;
- (3)
- OIC is the direction of improving the TER index system, which characterizes the ability of ‘innovation transformation’ and ‘upgrading optimization’ when the system responds to challenges. This dimension reflects the ability of the tourism ecosystem to reorganize and evolve according to actual conditions and is the ability of the system to cope with potential external pressures. The reflection system can not only minimize or avoid the negative effects of similar disturbances by continuous memory and learning to deal with similar disturbances but also deal with possible future disturbances by establishing new elements and operating mechanisms. When the number of tourists increases, the natural environment in the tourism ecosystem may be under certain pressure, but the socio-cultural and economic factors in the system will be adjusted accordingly through industrial investment to obtain financial support, strengthen environmental protection measures, investment, and ecological environment governance optimization, improve the quality of tourism services and technological innovation and other ways to restore the normal development path, break the original path dependence, and promote the system to improve quality and efficiency, industrial transformation, optimization, and upgrading. This paper constructs indicators from three aspects: innovation and R&D, capital regulation, and environmental governance (Table 1), and by strengthening the innovation and optimization of these aspects, we can promote the upgrading and transformation of the tourism ecosystem and realize sustainable development of the tourism industry.
2.2. Indicator System
2.3. Research Methods and Data Sources
2.3.1. Entropy Weight Method
2.3.2. Dagum–Gini Coefficient
2.3.3. Kernel Density Estimation
2.3.4. Data Sources
3. Results
3.1. Temporal Evolution Characteristics of Tourism Ecological Resilience
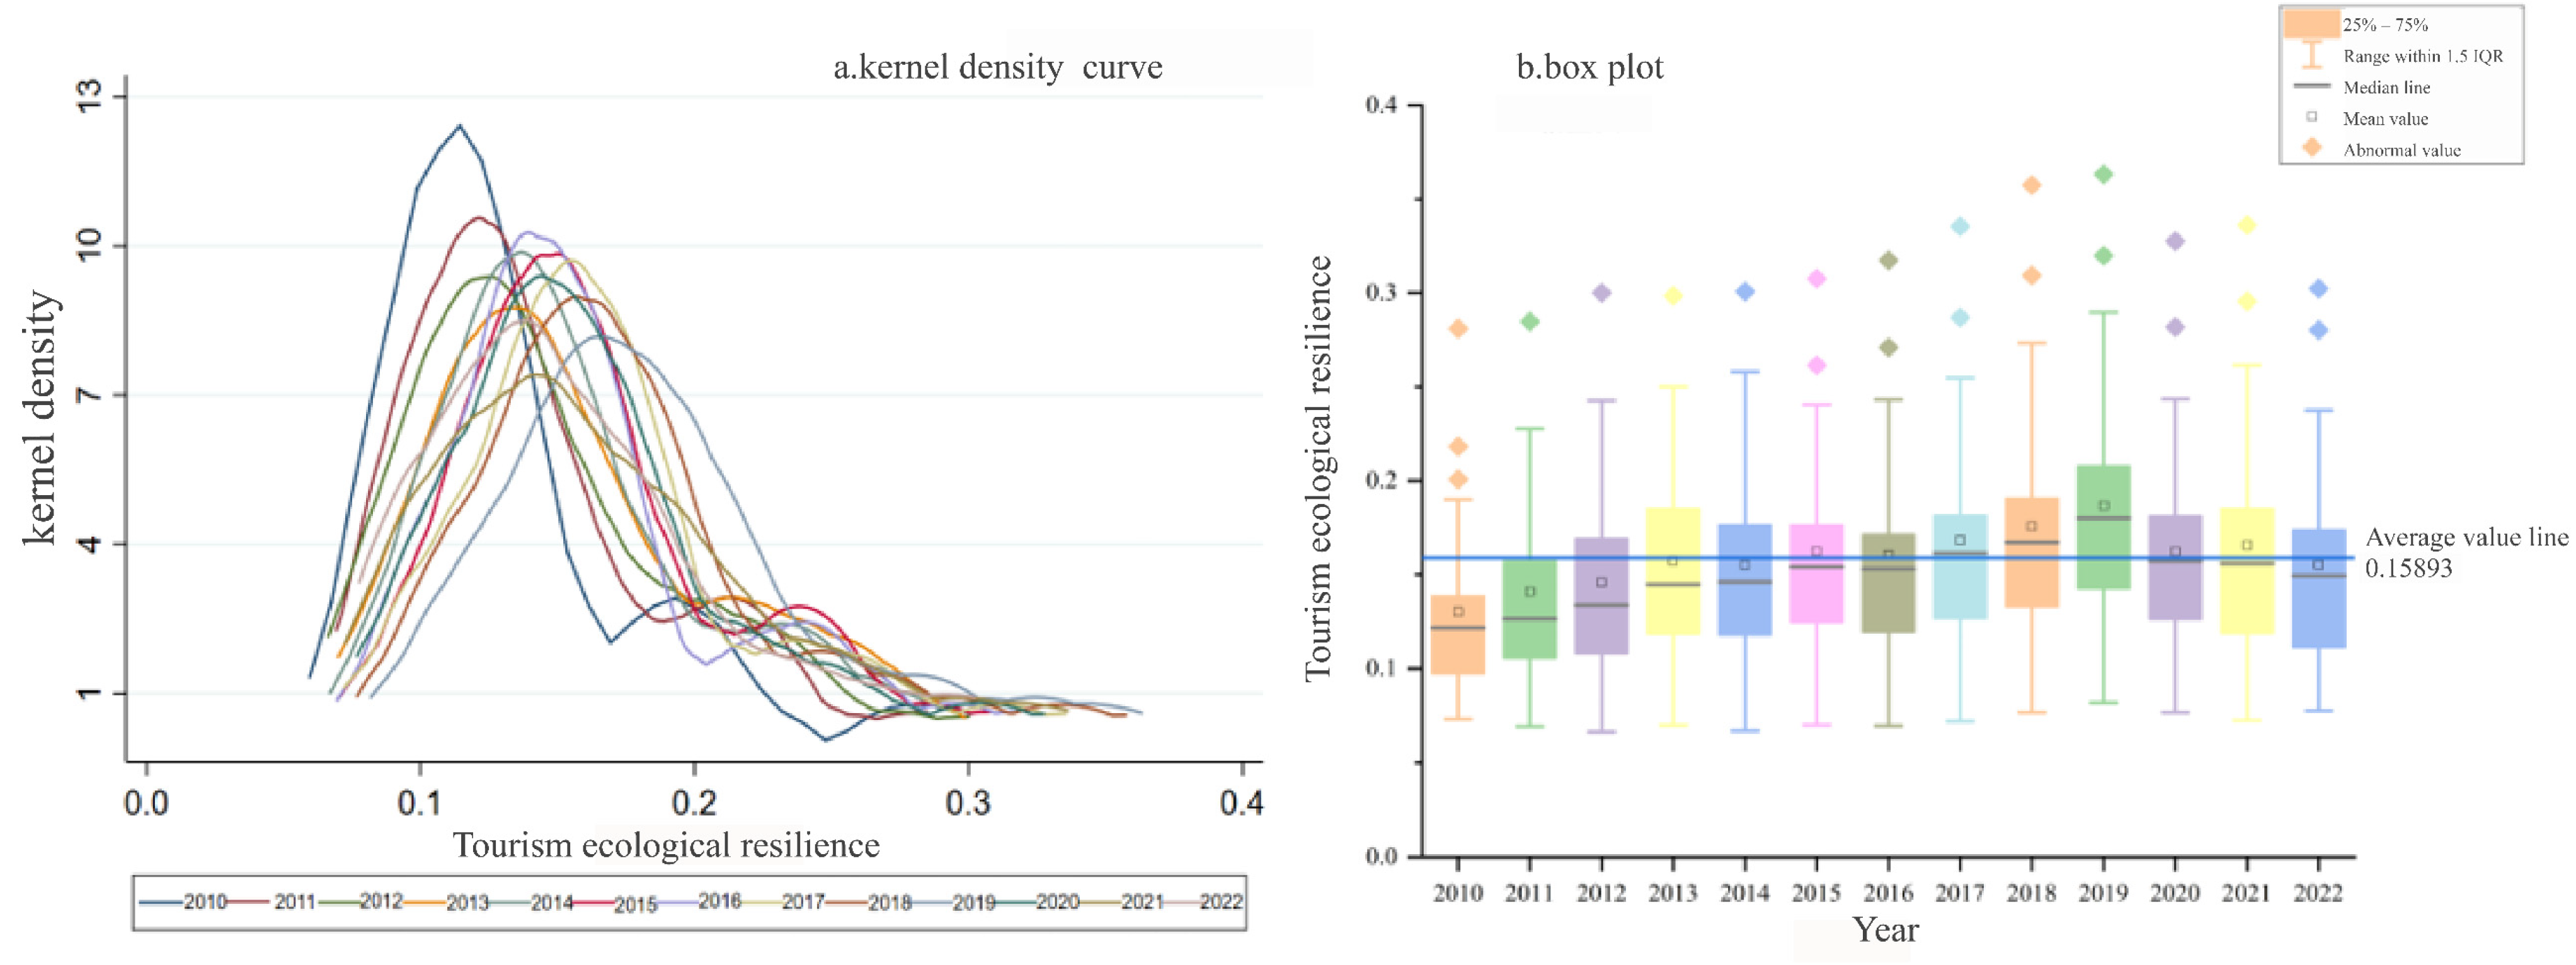
3.1.1. Overall Temporal Evolution Characteristics
- (1)
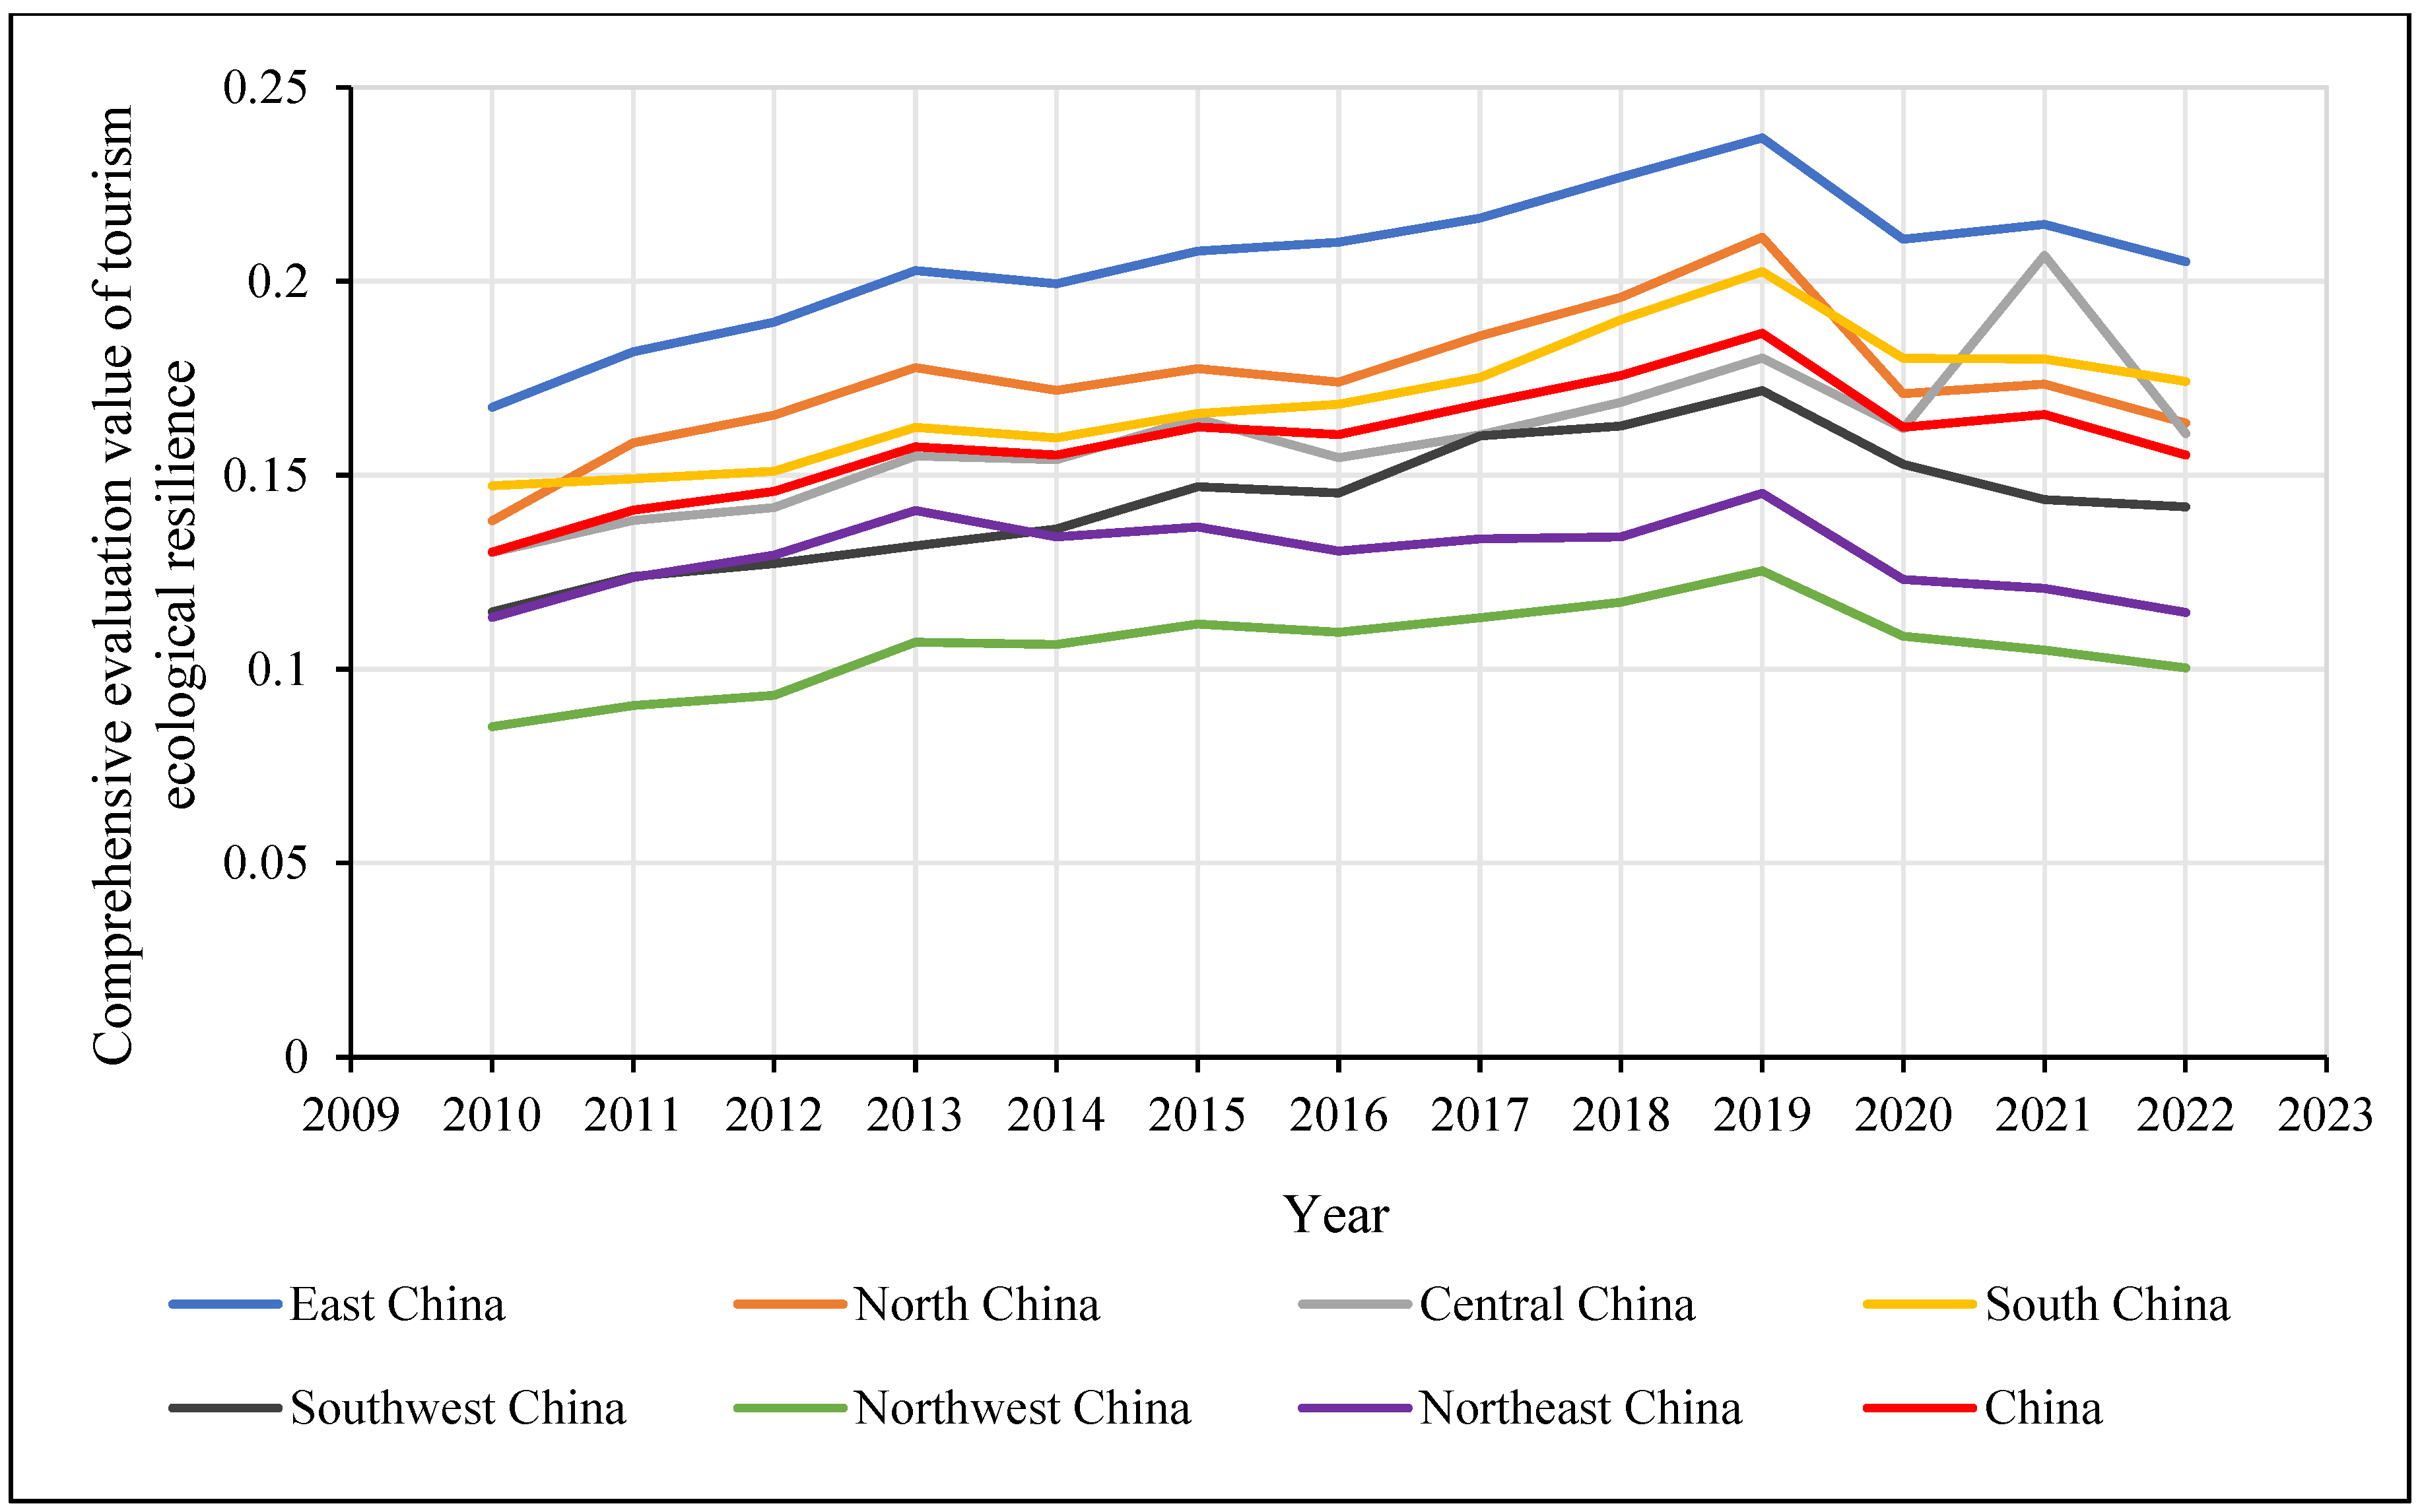
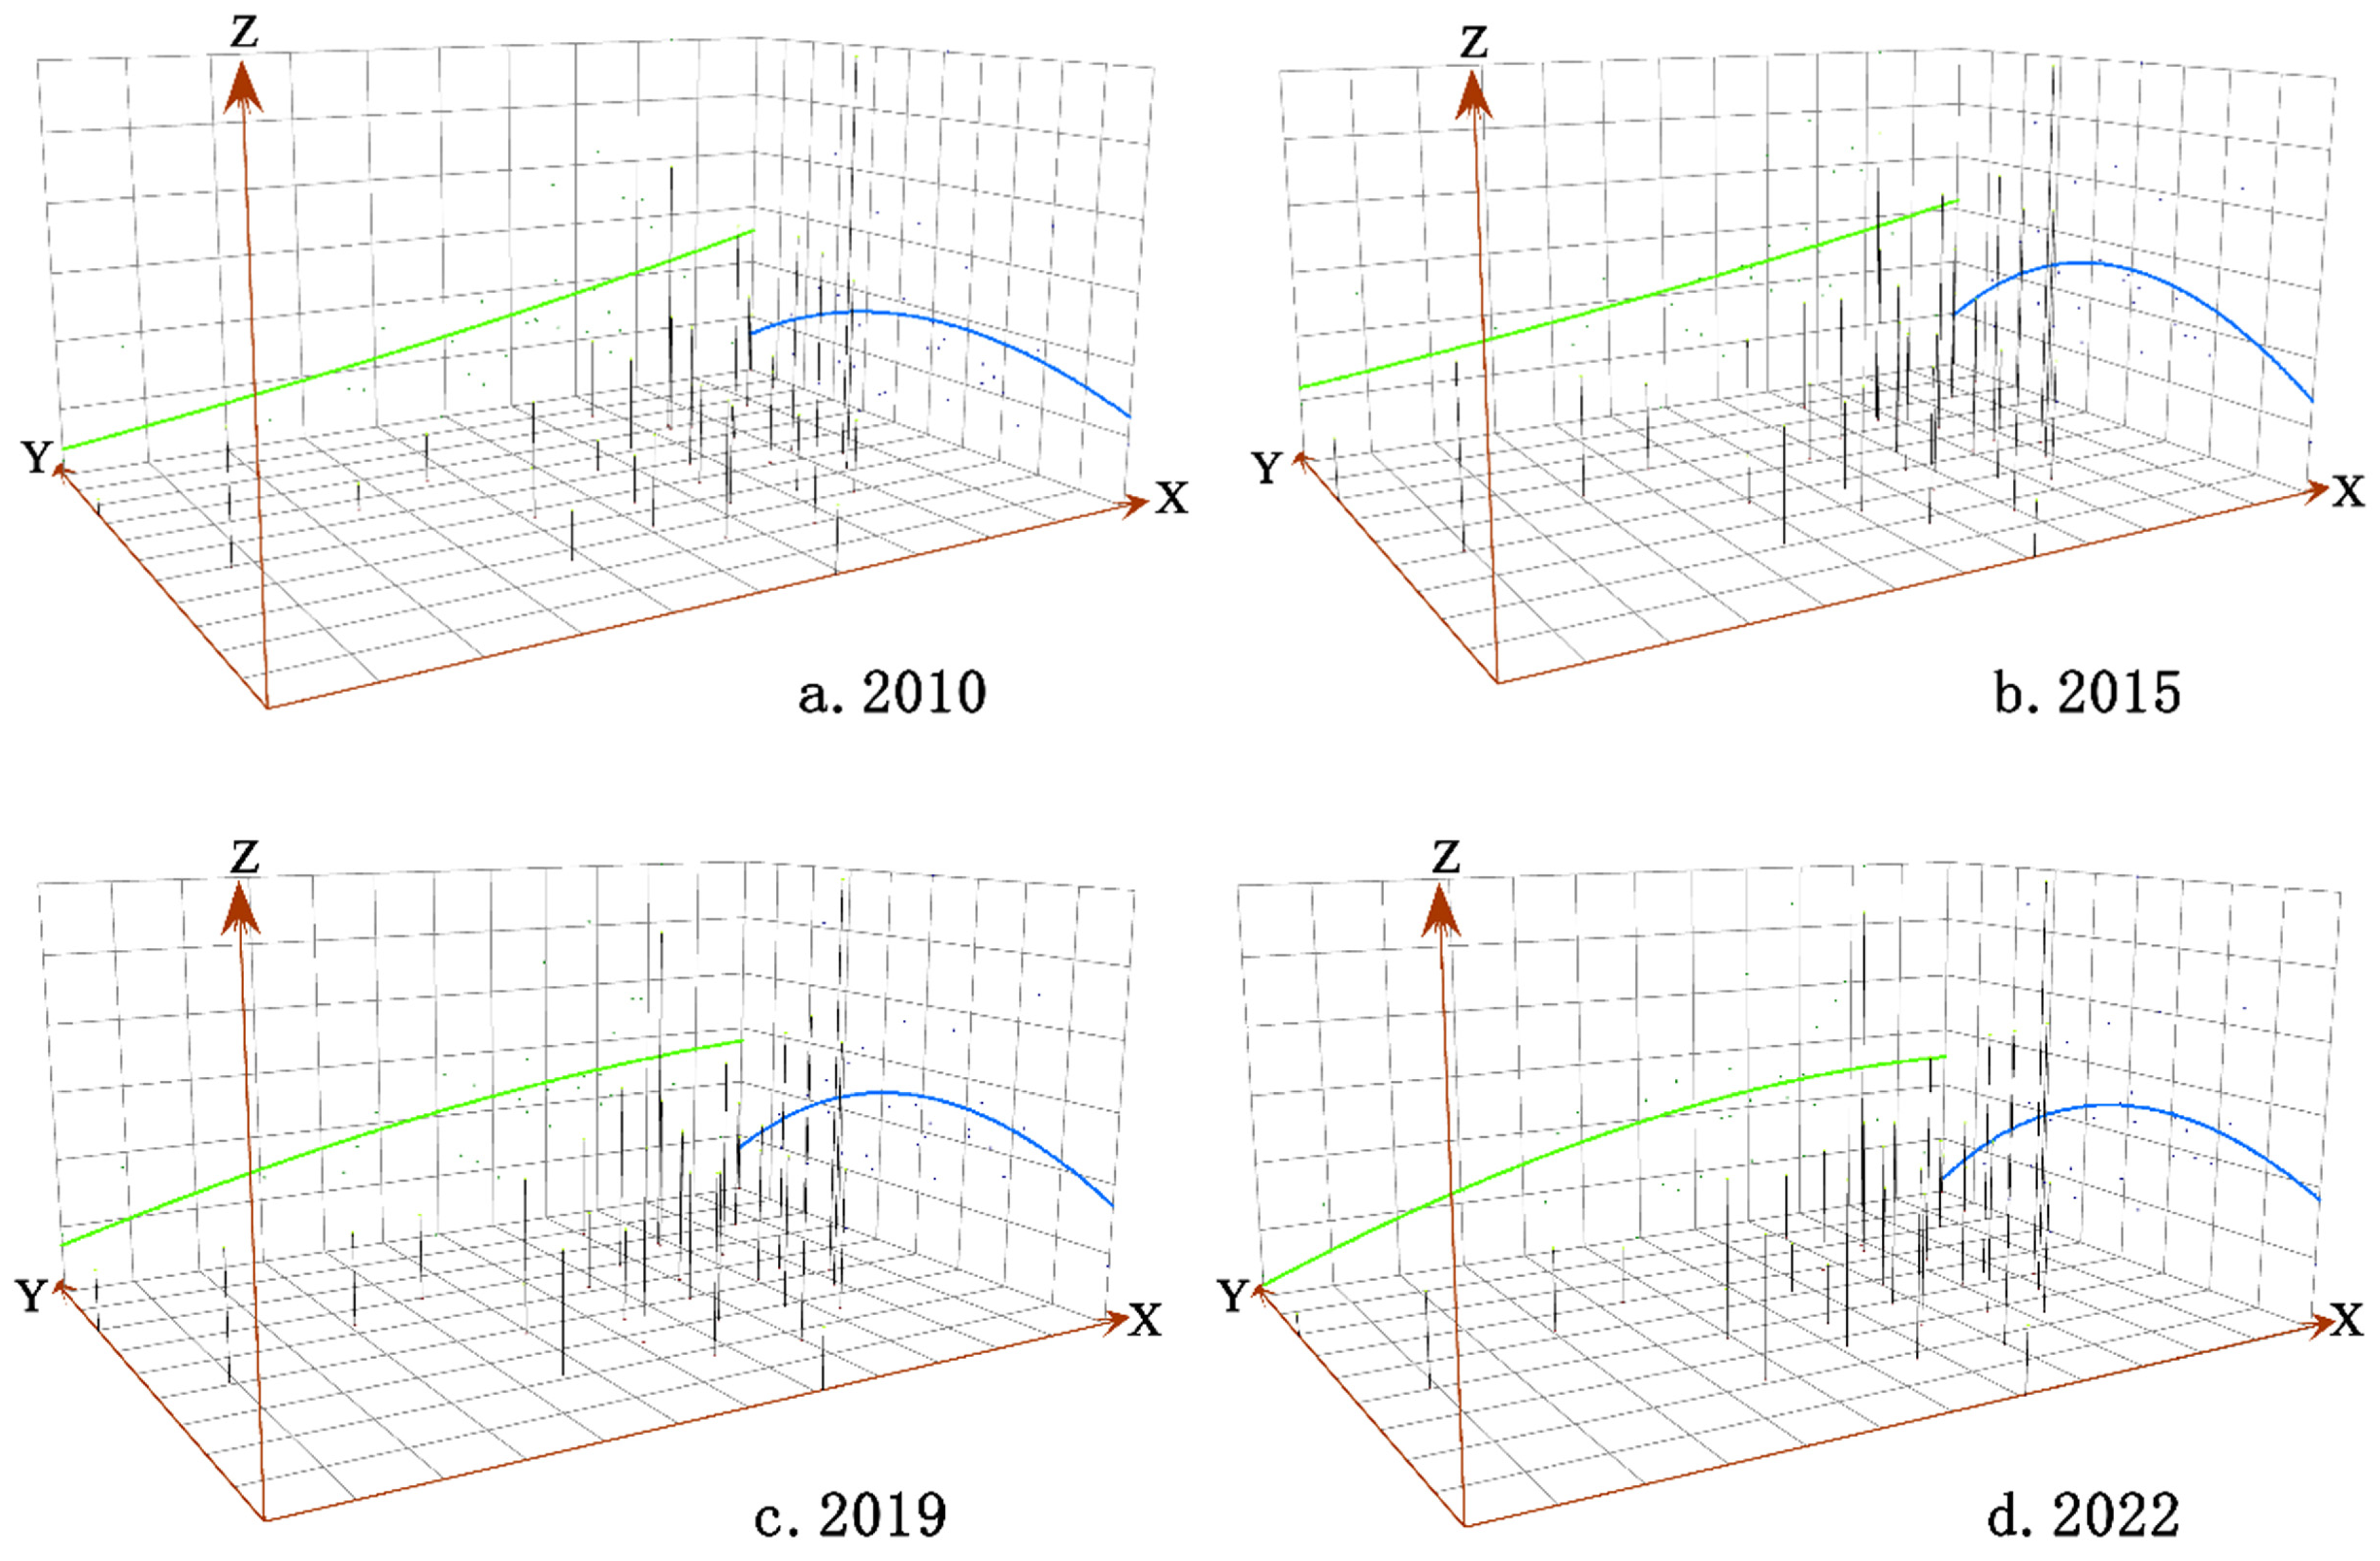
- China’s TER generally shows a steady growth trend, and regional differences are gradually expanding. It can be seen from Figure 2 that the core density center of China’s TER moved to the right as a whole from 2010 to 2022, and the median line in the box plot showed a fluctuating trajectory to the upper right, and the average value of resilience water increased first and then decreased. The average value of resilience first increased and then decreased, from 0.1302 in 2010 to 0.1866 in 2019, an increase of 43.32%, reaching a peak in 2019, and the impact of the COVID-19 pandemic decreased to 0.1552 in 2022. It can be seen that the level of ecological resilience of China’s tourism industry is generally on the rise, with an average annual growth rate of 1.47%, reflecting the continuous optimization of the development momentum, quality efficiency of China’s tourism industry, the improvement in the green effect of the tourism ecosystem, and the ability to resist potential internal and external threats [64]. The peak value of the kernel density curve of China’s tourism ecological resilience decreased, the kurtosis first decreased and then slowly increased, showing a fluctuating downward trend as a whole, and the overall width of the curve expanded as a whole, and the length of the upper and lower limits (interquartile ranges) of the box plot tended to increase, indicating that with the passage of the development cycle and the replacement of development stages, the difference degree of TER in different provinces in China gradually increased, and the absolute difference showed a significant expansion trend (Figure 2 and Figure 3a);
- (2)
- The polarization of China’s TER has been alleviated, but individual provinces occupy an absolute leading position in the development of tourism ecological resilience. From the perspective of the number of peaks and the ductility of the distribution, the kernel density curve showed a state of “main peak + double peak” from 2010 to 2017, and a “single peak” state from 2018 to 2022, and there was an obvious right tail characteristic, and the distribution ductility broadened significantly, indicating that the polarization of China’s tourism ecological resilience has been alleviated, but there are still individual provinces that occupy an absolute leading position in the development of tourism ecological resilience (Figure 2). The main reasons for this phenomenon are the great differences in resource endowment, industrial structure, policy orientation, tourism development foundation, geographical environment and other factors in different provinces, the different development paths and speeds of tourism ecological resilience between provinces, and the different ability of tourism ecosystems to resist internal and external disturbances and their own recovery, which leads to the gradual expansion of the divergent distribution trend and differences in tourism ecological resilience in different provinces. At the same time, due to the force majeure factors of the new crown epidemic, the graphic trend has changed significantly since 2020, and the overall resilience level of the country has declined, making the ecological resilience of China’s inter-provincial tourism show a convergence trend.
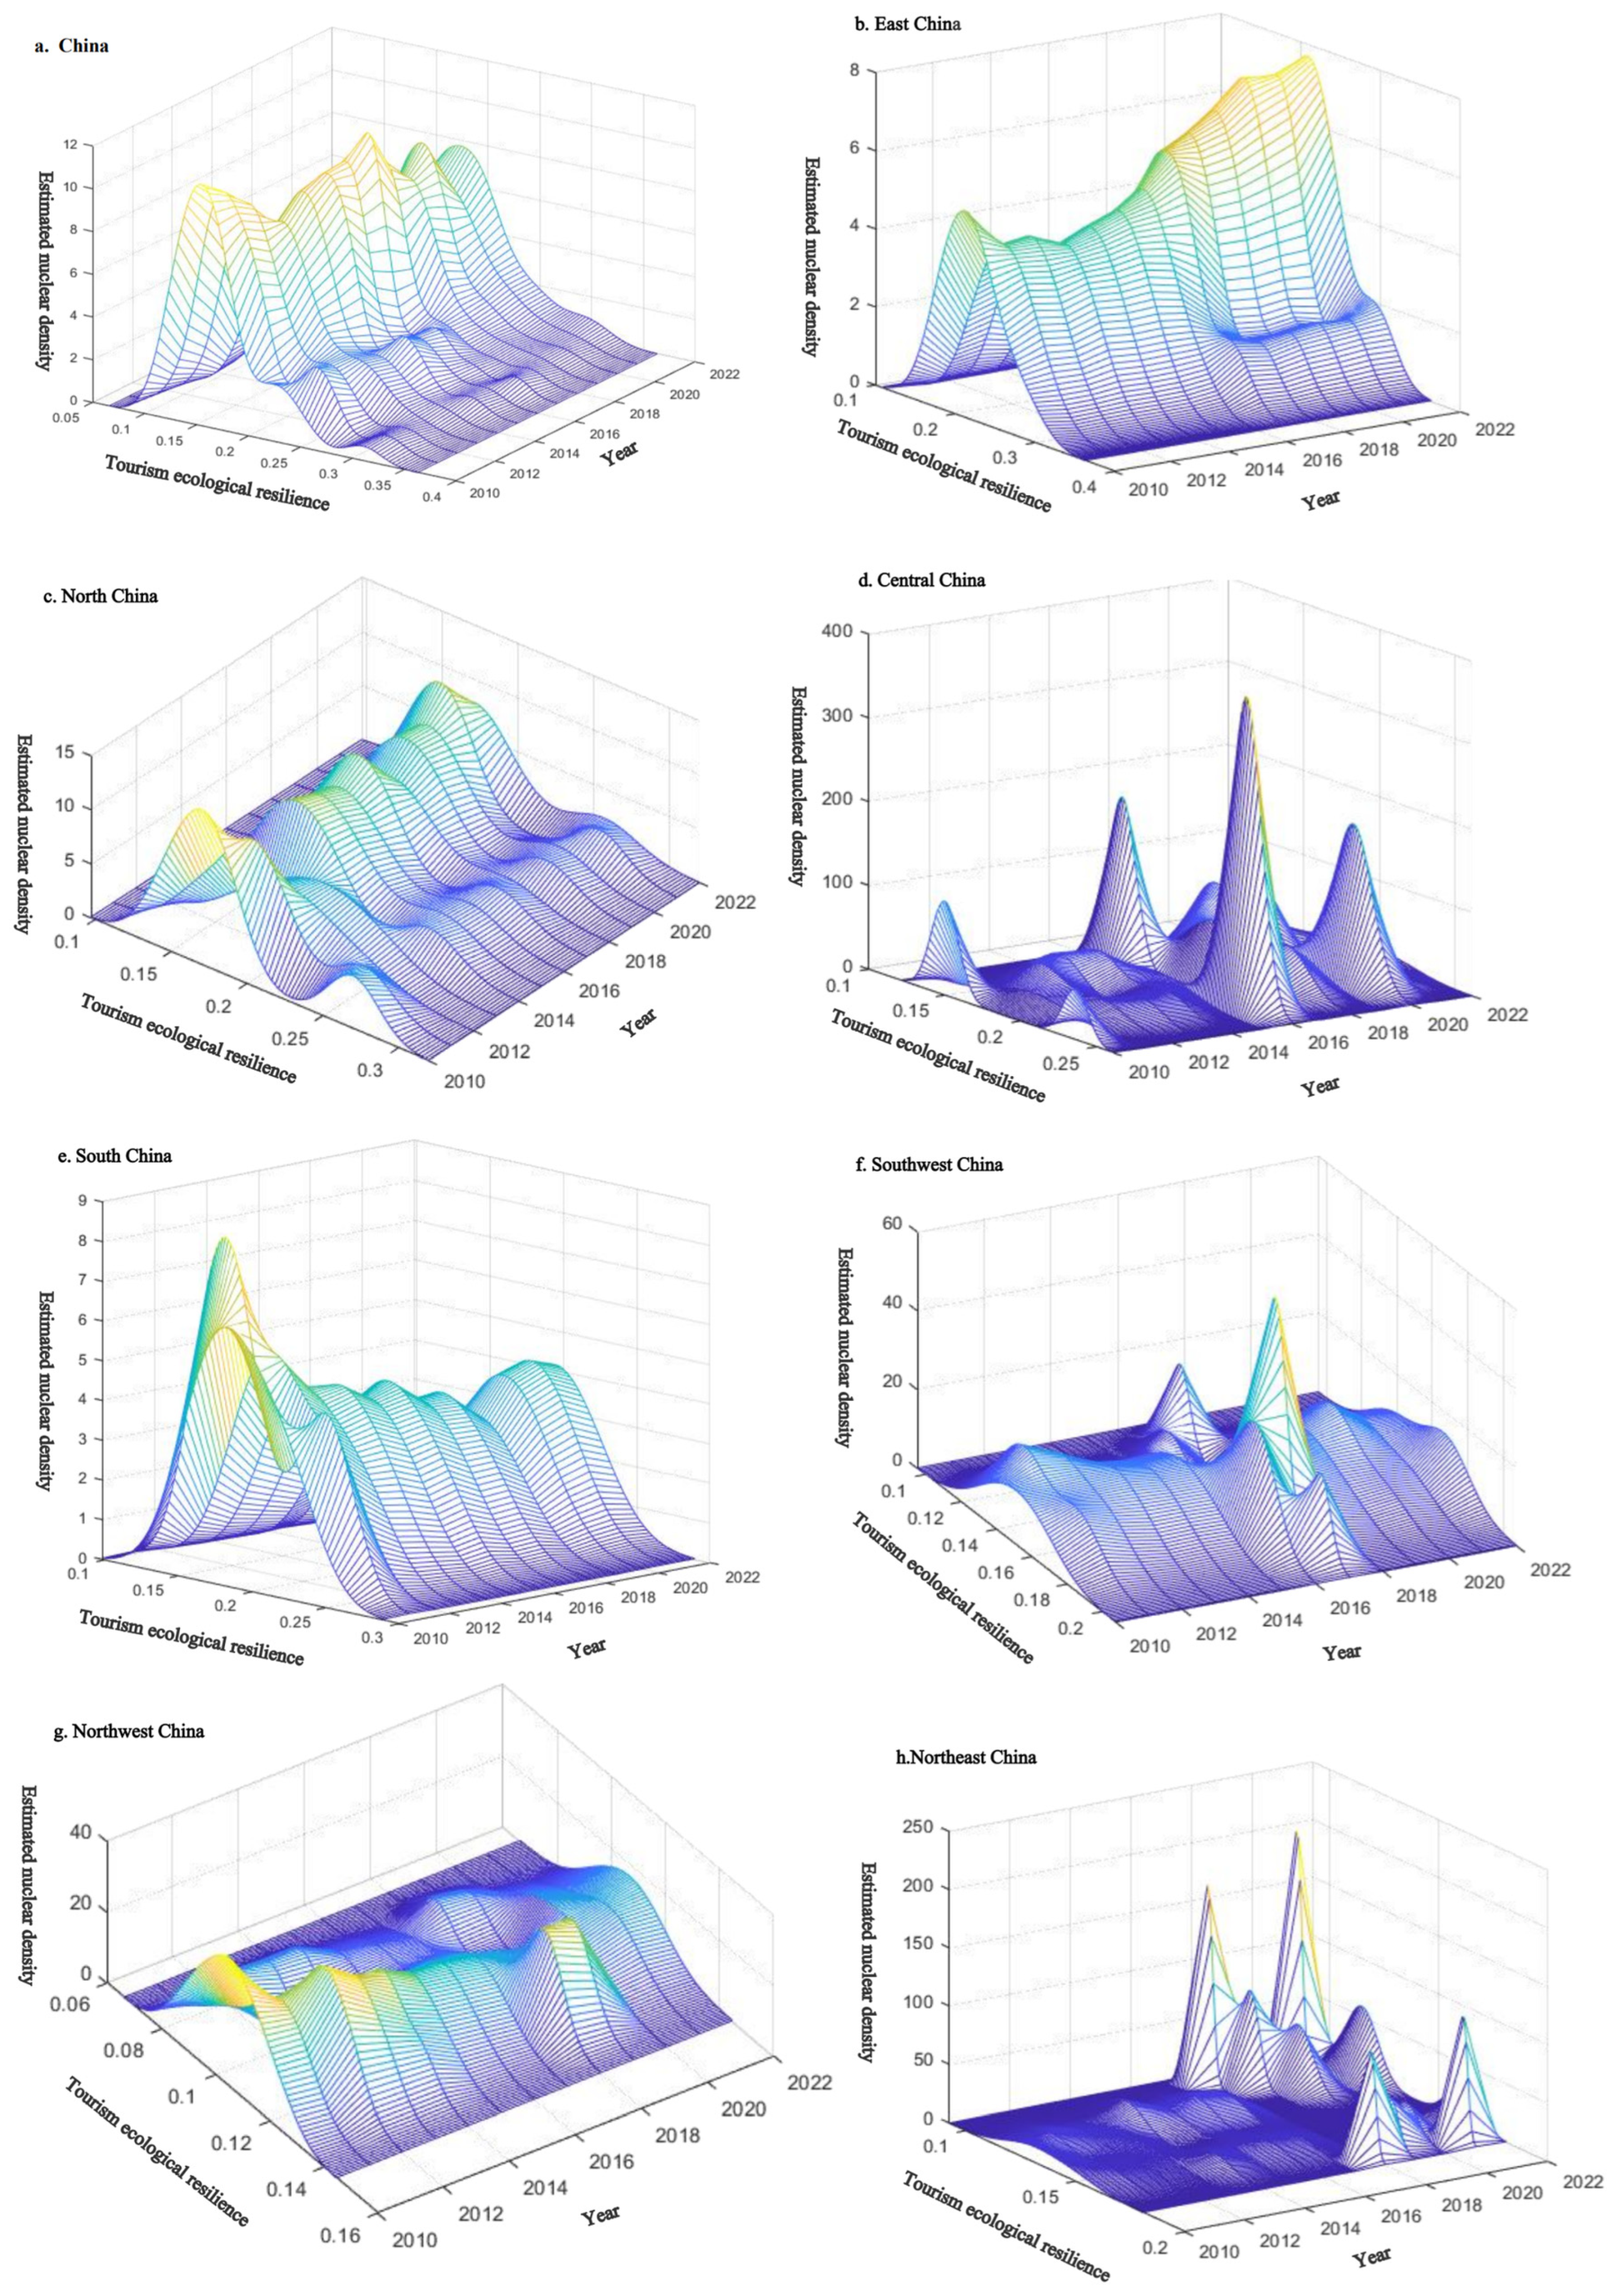
3.1.2. Temporal Evolution Characteristics of Partitions
- (1)
- Central China, as the main undertaking place for the transfer of high-pollution and high-consumption industrialized industries along the eastern coast, has experienced significant pressure on the environment, and this industrialization process has constituted an obvious coercive effect on the ecological environment, causing the tourism ecosystem to suffer from external shocks and face the dual pressure of environmental construction and ecological protection [4];
- (2)
- The southwest region is rich in natural landscapes, such as the Guilin landscape and Yunnan stone forest, but due to the remote geographical location and inconvenient transportation, due to the complex terrain in some areas, the protection and governance of the ecological environment are difficult, the development of tourism resources is limited to a certain extent, and the development of the tourism industry is relatively lagging behind;
- (3)
- Northeast China is an important industrial base. Economic transformation faces certain difficulties, and investment in tourism development is limited. For example, Jilin, Heilongjiang, and other places have low tourism eco-efficiency [65]. In addition, the problem of population aging in Northeast China and Southwest China has a significant impact on the eco-tourism efficiency of both in the long and short term [66];
- (4)
- The economic development of Northwest China is relatively lagging behind; the industrial structure is relatively single, and the support of the factor scale is weak. The tourism industry in Northwest China, such as Qinghai and Xinjiang, started late, and the tourism eco-efficiency is low [65]. It is subject to the comprehensive influence of factors such as a weak economic foundation, low green development efficiency, poor traffic accessibility, and lagging infrastructure construction, which restricts the resilience of the tourism ecosystem.
3.2. Spatial Evolution Characteristics of Tourism Ecological Resilience
3.2.1. Overall Spatial Trend Characteristics
3.2.2. Spatial Differentiation Characteristics
3.3. Spatial and Temporal Evolution Characteristics of TER in Different Dimensions
3.3.1. Temporal Characteristics
3.3.2. Spatial Characteristics
- (1)
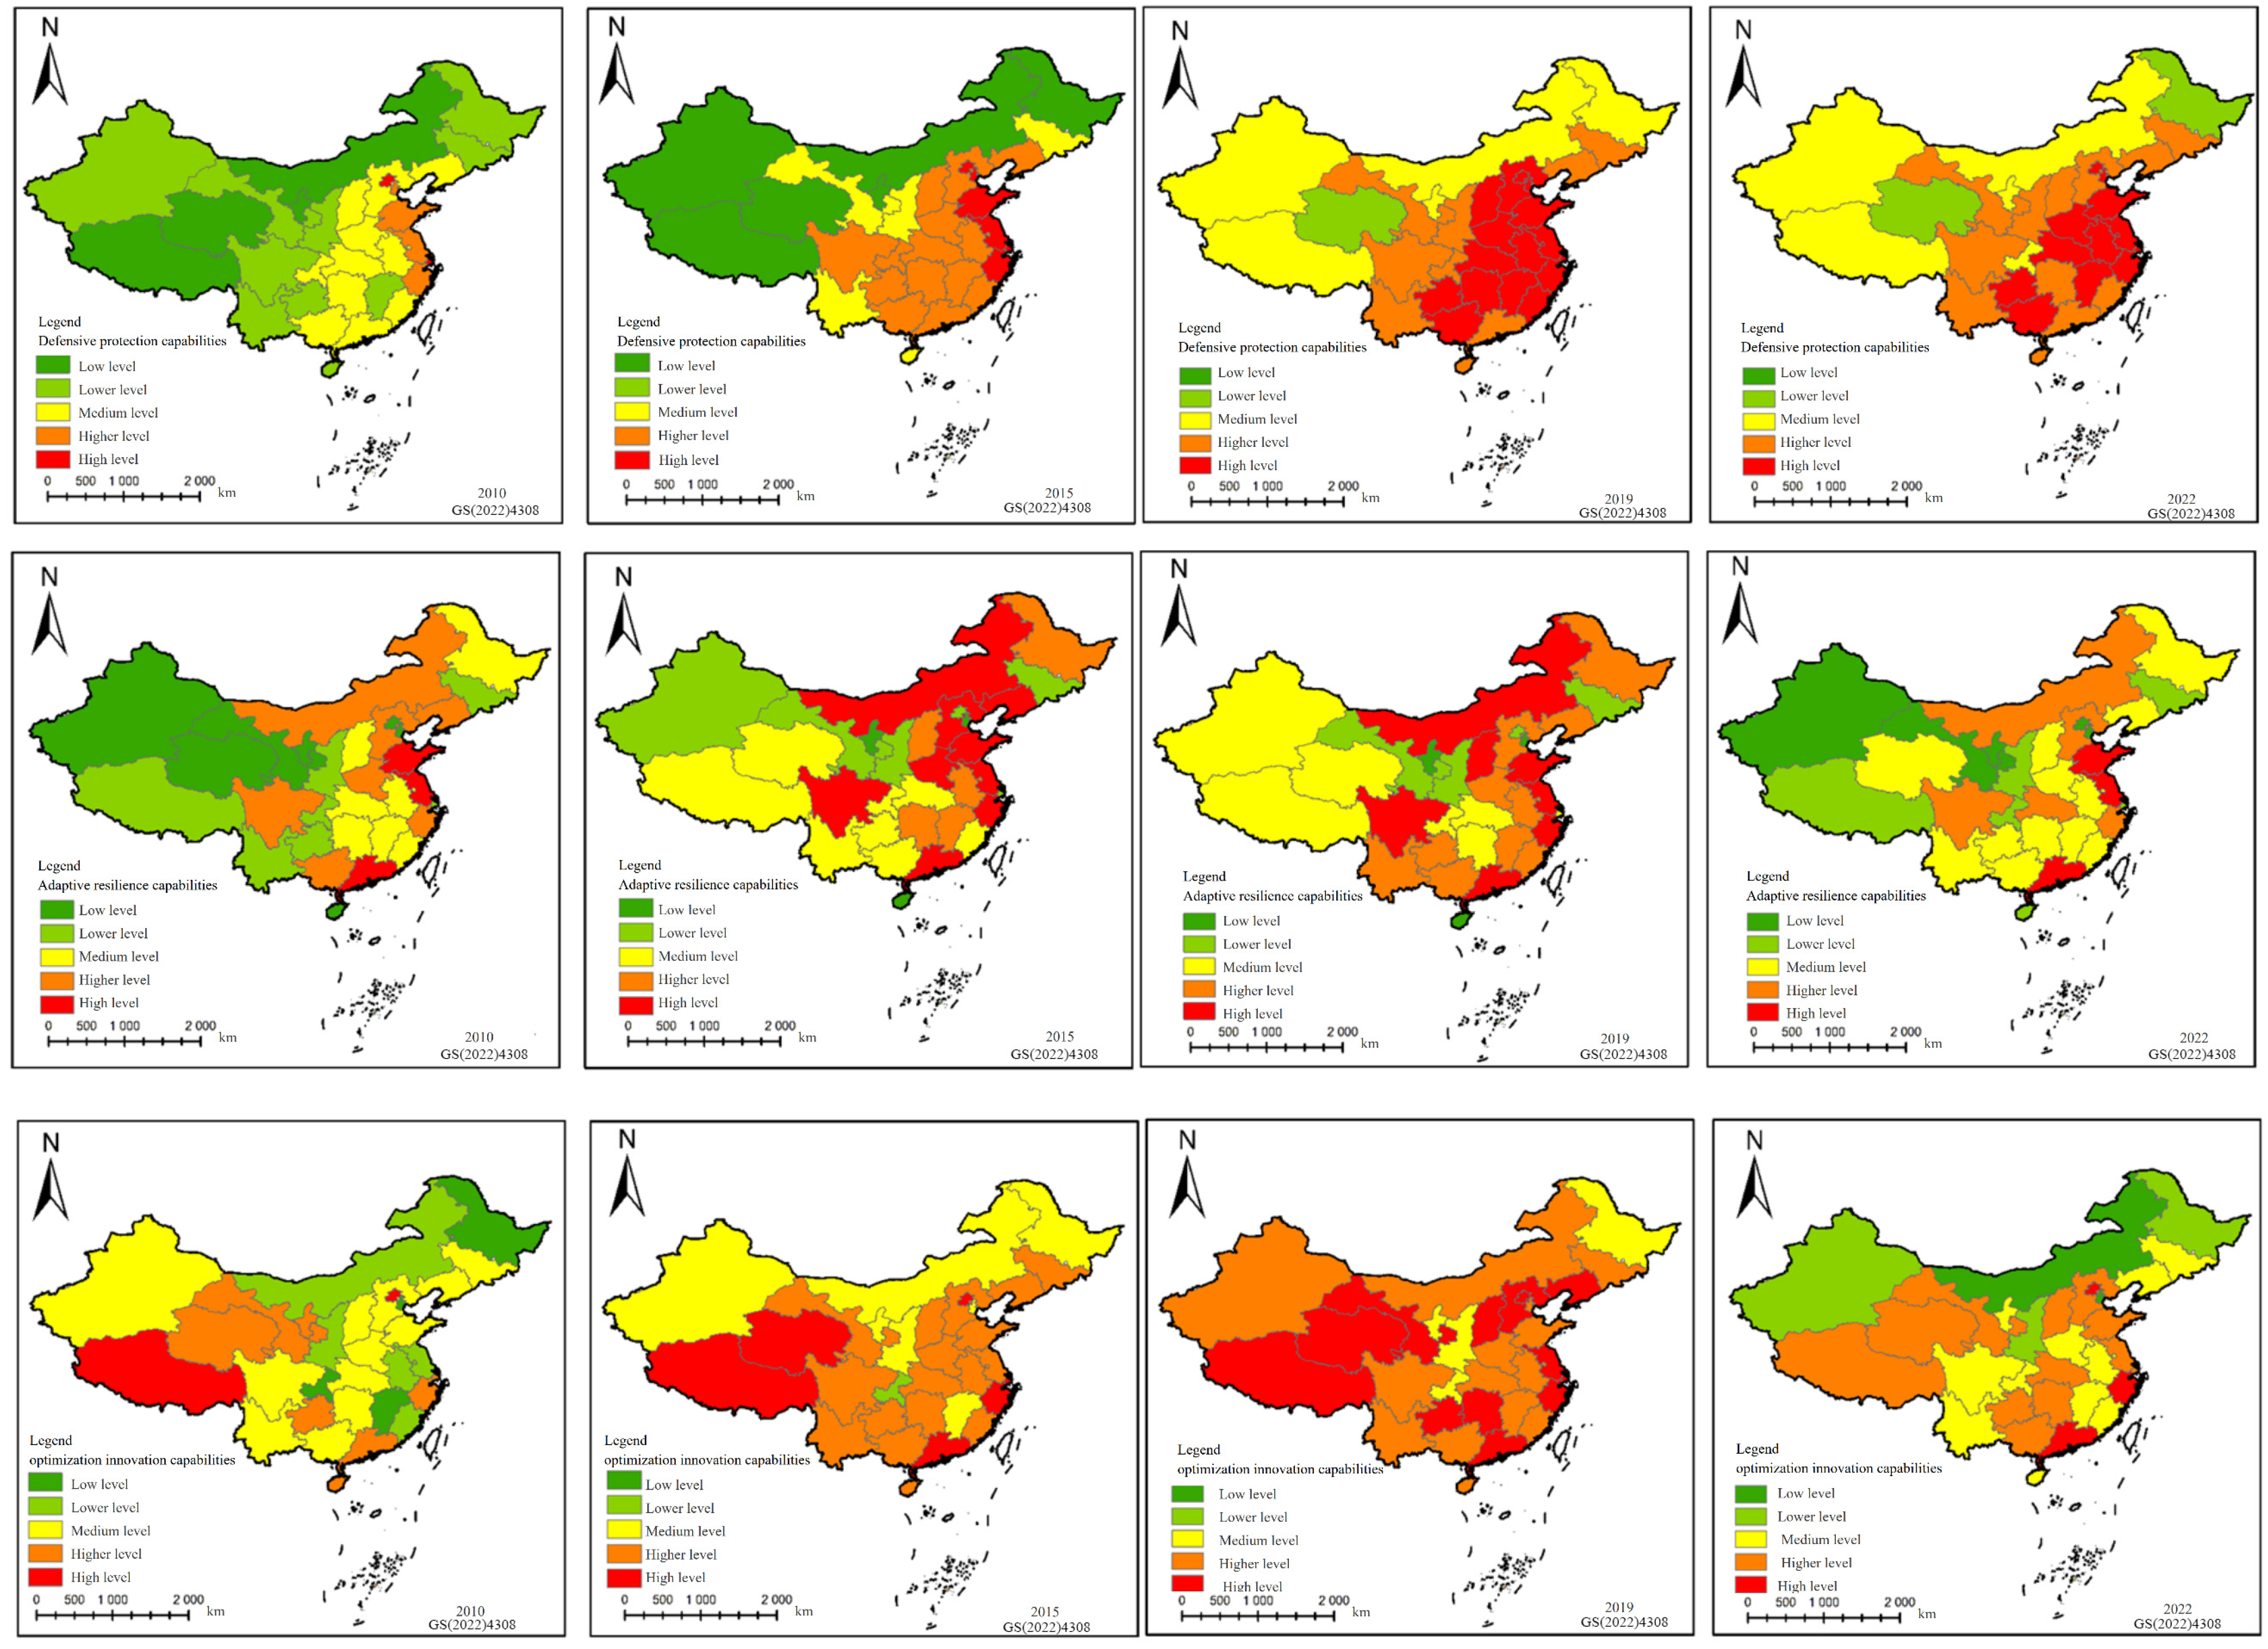
- The overall upward trend of defense and protection capability is obvious. From 2010 to 2022, the overall defense and protection capability showed a pattern of gradual attenuation from dual-core to periphery, and the mean value of DPC in Northwest China is the lowest, which is closely related to the level of regional economic development and related investment [67], reflecting that economic drive is the key variable to regulate the improvement in defense and protection capability. At the end of this study, the provinces with the leading level of defense and protection capabilities still maintained a high level, such as Beijing and Shanghai, which have always been at the leading level in forming a dual-core system, mainly because of the high level of economic development, perfect infrastructure, and strong financial investment capacity, which can provide sufficient financial support for the tourism ecosystem. From 2010 to 2022, the high-level and high-level regions showed a strong increasing tendency in terms of number or scale, reflecting obvious upward dynamics. For example, in 2010, most of them were at the middle and bottom levels with large spatial differences, and by 2022, they were all at the critical level and above except for Qinghai and Heilongjiang, and the change trend was very significant (Figure 8);
- (2)
- Adaptability and resilience fluctuate greatly. The ability to adapt and recover has increased overall but has decreased significantly after the impact of the epidemic in 2019. The level of adaptation and resilience capacity in the western region fluctuates greatly, and the other regions remain relatively stable, mainly because the fragility of the ecological environment and the relatively low level of economic development in the western region make the tourism ecosystem susceptible to external environmental changes and shocks such as natural and human factors, such as drought, rocky desertification, soil erosion, low efficiency of vegetation net primary productivity, and the contradiction between tourism ecological space and urban space. However, there has been an overall improvement in the middle and bottom areas;
- (3)
- Optimize and innovate continuously. The optimization and innovation capability showed a significant overall upward trend, forming a multi-polar distribution pattern with “Beijing–Shanghai–Zhejiang–Guangdong–Gansu–Qinghai–Tibet” as the core and gradually decreasing outward. The optimization and innovation ability of the western plateau ethnic areas such as Gansu, Qinghai, and Tibet has always maintained a high level, which shows that the region has received extensive attention and related investment in the process of tourism development due to its unique ethnic, cultural resources, special geographical features, and national policy support, which not only promotes the development of its own tourism economy but also promotes the healthy and sustainable development of the regional tourism ecosystem. Yuhuan Sun et al. conducted an empirical study on the green R&D and achievement transformation efficiency of China’s tourism industry. The results show that the western provinces perform better in green R&D than the eastern provinces, while the performance in green achievement transformation is the opposite [68]. It is worth noting that the average value of the optimization and innovation ability of the northeast region is the lowest, and the green innovation efficiency of the northeast tourism industry from 2000 to 2020 is in a state of stagnation [69].
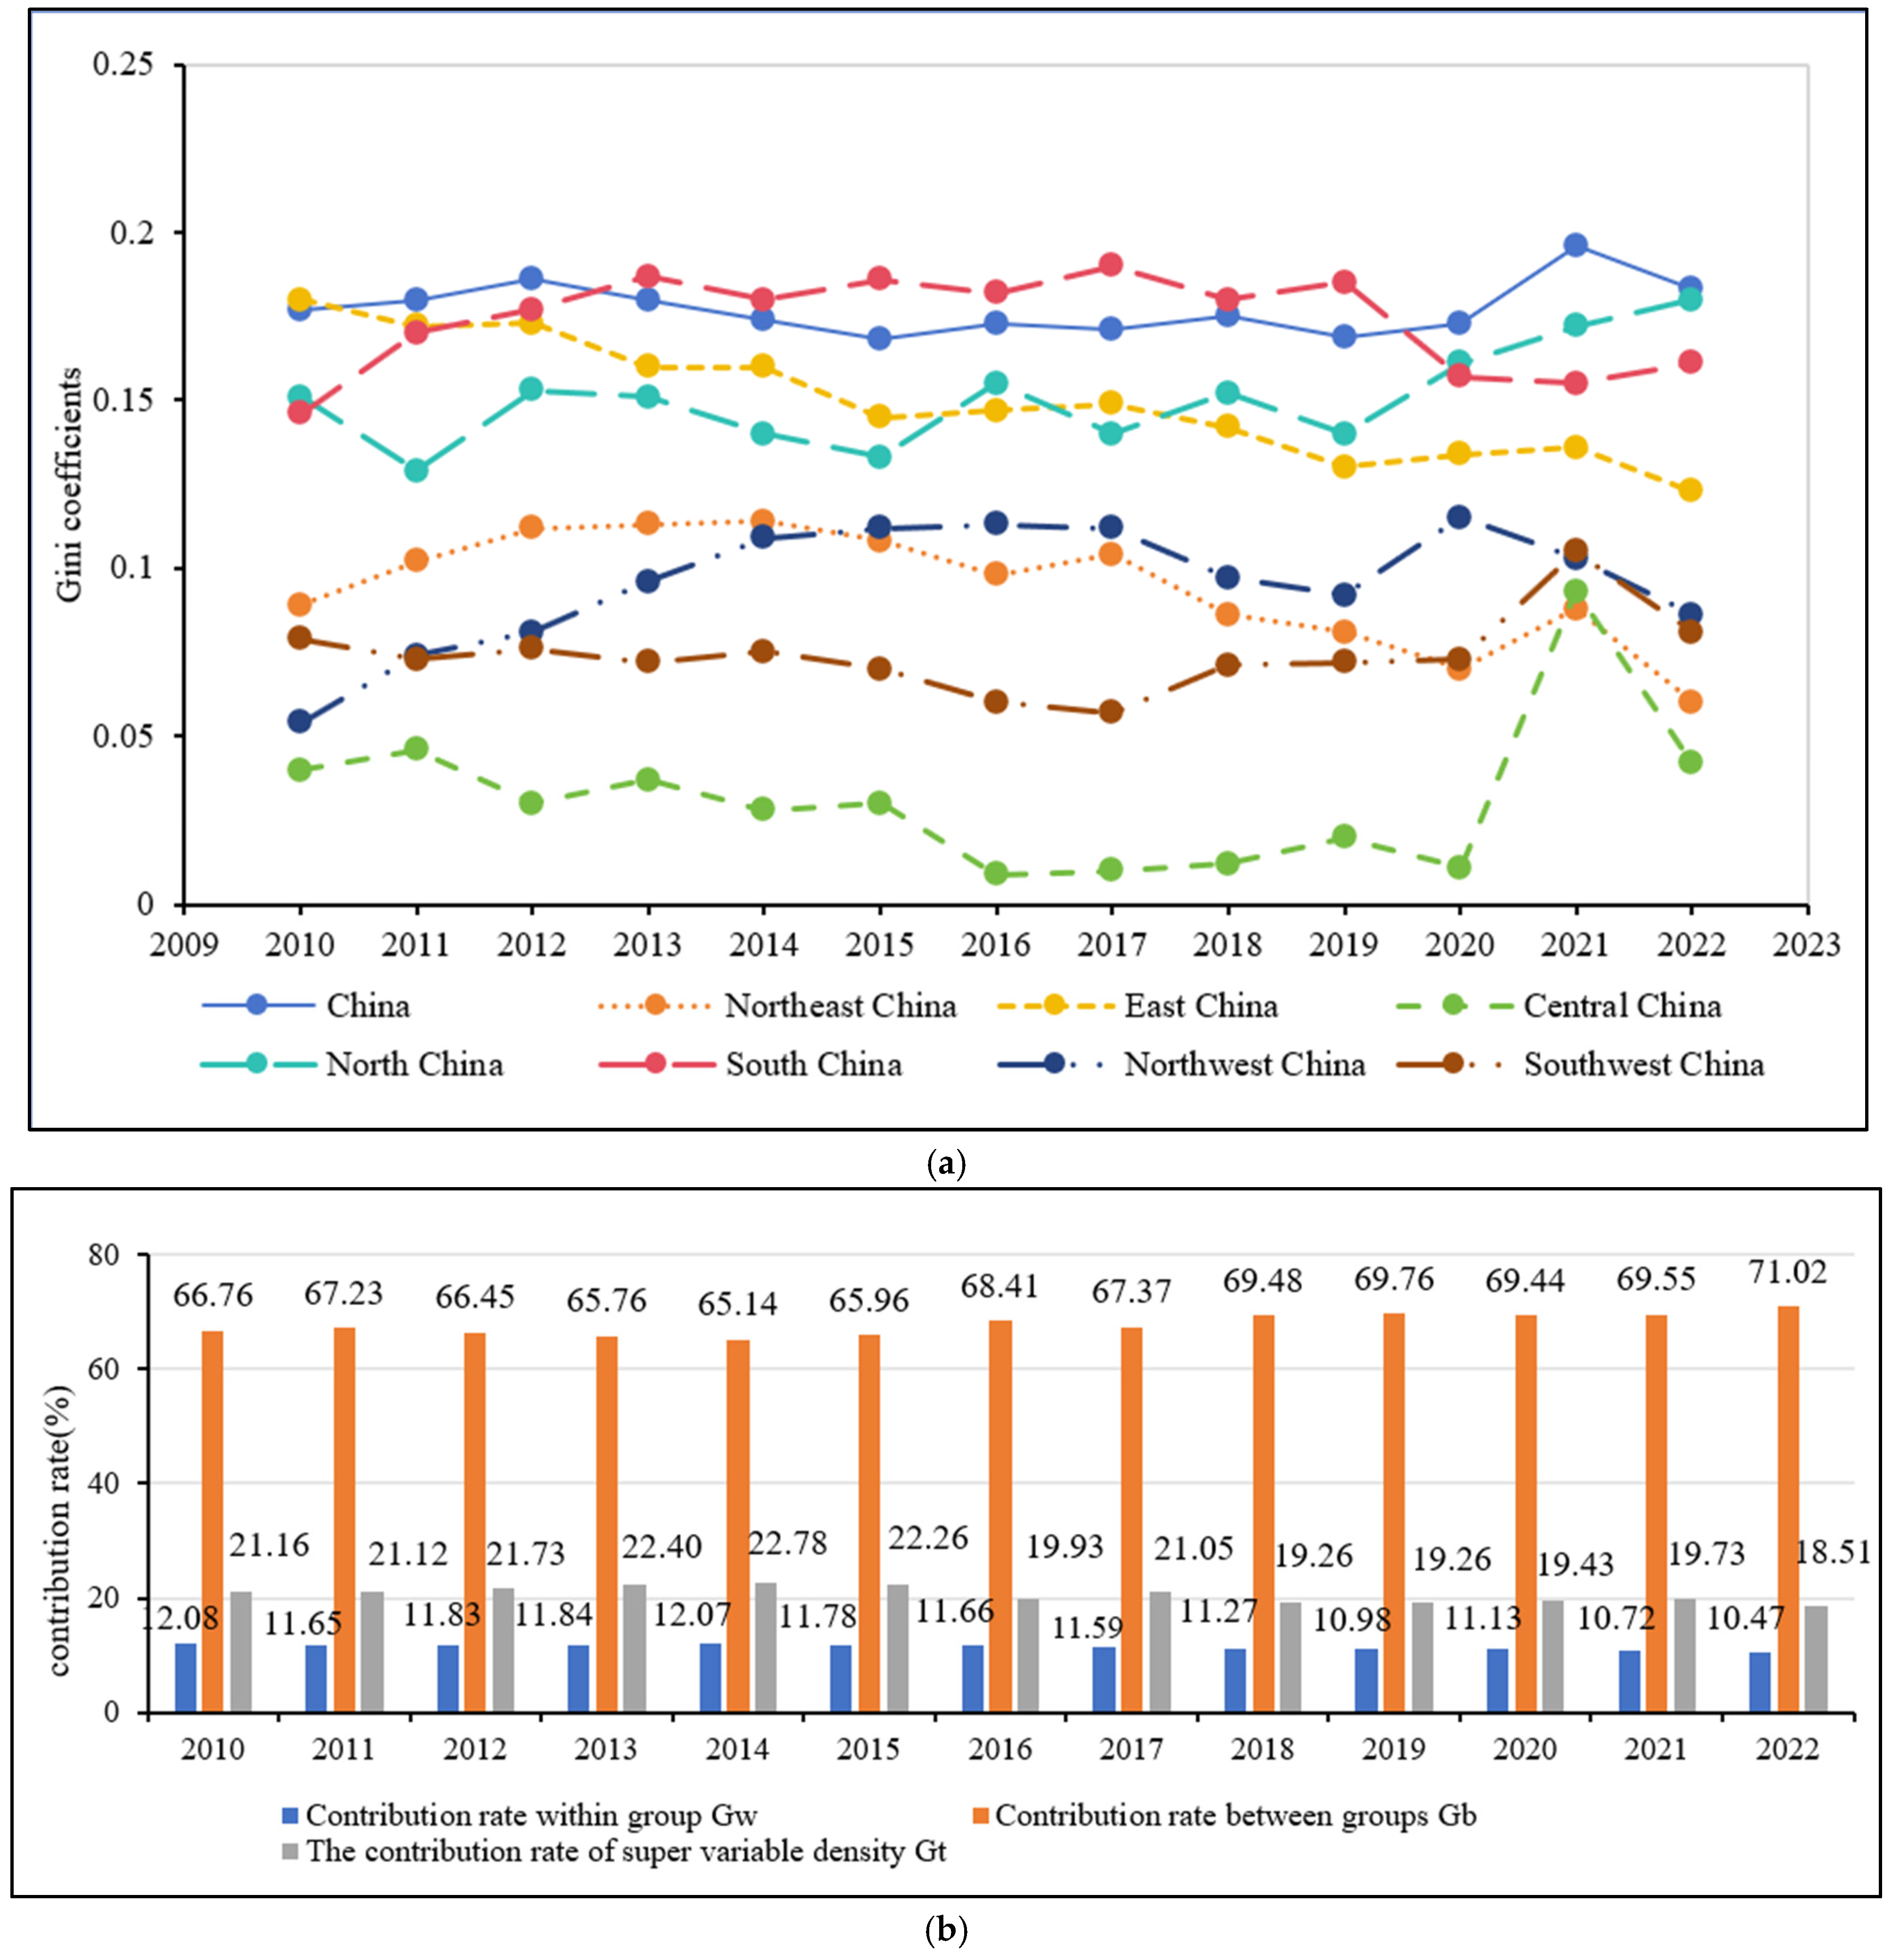
3.4. Analysis of Regional Differences in Tourism Ecological Resilience
- (1)
- Figure 9a reflects the evolution trend of China’s TER and regional Gini coefficient from 2010 to 2022. During the study period, the overall difference in national TER showed a fluctuating upward trend, and the overall Gini coefficient increased from 0.177 in 2010 to 0.183 in 2022, with a slight increase. From the perspective of the seven major regions, the intra-regional differences in East China and Northeast China fluctuated and decreased, while other regions showed a fluctuating upward trend. Among them, the decline in East China was 31.67%, and the decline in Northeast China was 32.58%. The increases in Central China, North China, South China, Northwest China, and Southwest China were 5%, 19.21%, 10.27%, 59.26%, and 2.53%, respectively, indicating that except for the narrowing of the internal differences in East China and Northeast China, the internal differences in other regions showed a significant trend of expansion. The Gini coefficient in the region shows a spatial distribution pattern of ‘South China (0.1735) > North China (0.1505) > East China (0.1500) > Northwest China (0.0957) > Northeast China (0.0942) > Southwest China (0.0742) > Central China (0.0314)’, indicating that the difference in provincial TER within South China is the largest, followed by North China and East China, and Central China is the smallest;
- (2)
- From 2010 to 2022, the Gini coefficient of China’s TER shows the characteristics of high coincidence and fluctuation balance. The fluctuation range is small (the rise and fall are all below 7%), which reflects the stability, balance, and self-regulation ability of TER. A dynamic balance mechanism has been formed in the development process of each region, which makes the regional differences fluctuate within a small range and can maintain the development within a relatively stable difference range. From the perspective of numerical differences, the average inter-regional Gini coefficients of East China–Northwest China, South China–Northwest China, North China–Northwest China, Northeast China–East China, and Central China-Northwest China are 0.3211,0.2517,0.2472,0.2416, and 0.2028, respectively, ranking the top five. The inter-regional Gini coefficient of East China–Northwest China is the largest, because the level of tourism ecological resilience in East China is much higher than that in Northwest China. With the rapid catch-up of the northwest region, the level of TER has increased rapidly, resulting in a steady decline in the regional Gini coefficient between East China and Northwest China. From the perspective of the change trend, the Gini coefficients of Northeast China–Northwest China, East China–Central China, East China–South China, East China–Southwest China, and Central China–Southwest China regions all showed a fluctuating downward trend, but the decline was less than 5.5%, indicating that the gap in the level of TER between these regions is shrinking and gradually tends to be balanced. The Gini coefficients of other regions showed a fluctuating upward trend, indicating that the differences between regions showed an expanding trend;
- (3)
- Figure 9b reflects the evolution trend of the sources and contribution rates of regional differences in China’s TER from 2010 to 2022. From the perspective of the dynamic evolution of the sources of differences, the fluctuation of the contribution rate of inter-regional differences is on the rise as a whole, from 66.76% in 2010 to 71.02% in 2022, which is an increase of about 6.38%. The contribution rate of regional differences experienced a fluctuation process of ‘decline–rise–decline–rise–decline’, and the overall downward trend was about 13.32%. The contribution rate of hypervariable density showed a significant downward trend, from 21.157% in 2010 to 18.506% in 2022, a decline of about 12.53%. From the perspective of the contribution rate of the source of difference, the average contribution rates of intra-regional difference, inter-regional difference, and hypervariable density are 11.47%, 68.87%, and 20.66%, respectively. It can be seen that the contribution rate of inter-regional difference is the largest and has been in a dominant position. It is the main source of overall difference, followed by the contribution rate of intra-regional difference, and the contribution rate of hypervariable density is the smallest.
4. Discussion
- (1)
- From 2010 to 2022, the level of tourism ecological resilience in all provinces in China has improved to varying degrees, mainly due to the fact that China has entered a new era of socialist ecological civilization, deeply practiced the concept of green development and the concept of “lucid waters and lush mountains are invaluable assets”, and continuously promoted the strategic action of “ecological civilization construction”. However, there is significant spatial heterogeneity in China’s tourism ecological resilience, and the actual development of different regions varies greatly, and the high-resilience areas are mainly distributed in regions with relatively developed economic conditions, abundant environmental protection investment, and strict environmental regulations. The higher increase in tourism ecological resilience in Yunnan, Jiangxi, Guizhou, and other places is mainly due to the rapid economic development and relatively high investment intensity in tourism infrastructure and environmental governance [70]. Therefore, each region should take measures according to local conditions, combine the actual differences in the economic foundation, geographical environment, resource endowment, location conditions, and other actual differences in the region, and learn from successful experience on the basis of clarifying the insufficient development of its own tourism ecological resilience, and scientifically formulate tourism ecological resilience improvement strategies;
- (2)
- According to the spatial characteristics of ‘high in the east and low in the west, high in the south and low in the north’, a hierarchical structure with ‘Beijing–Shanghai’ as the dual core is formed, and the regional difference is the main source of the overall difference. The regional difference between East China and Northwest China is large, and the internal difference between South China and North China is large. This result also fully confirms the conclusion that the level of economic development in North China is quite different; the industrial division of labor and cooperation is not deep enough; the radiation effect of the rapid economic growth of Beijing, Tianjin, and Hebei on the surrounding cities of Hebei is not good, and the overall coordination of the region is poor [71]. Therefore, the improvement in China’s future tourism ecosystem needs to build a ‘tourism life community’, focus on regional differences, implement a regional tourism coordinated development strategy, establish a regional tourism development coordination mechanism, and promote the free flow of diversified resource elements between regions. Through policy guidance and financial support, we should strengthen tourism cooperation and exchanges between the eastern and western regions, the northern and southern regions, and the eastern and northwestern regions. In some provinces in the central and western regions where the economy is underdeveloped but the tourism resources are abundant, we should cultivate new tourism growth poles and promote the coordinated development of inter-regional TER. At the same time, we should not ignore the gap within the region;
- (3)
- In the future, the resilience of the tourism ecosystem must pay attention to the full play and improvement in defense and protection abilities, adaptation and recovery abilities, and optimization and innovation abilities, deeply understand the connotation of tourism ecological resilience, promote the long board and make up the short board, and adhere to the multi-dimensional value co-creation of tourism ecosystem. In view of the fact that defense and protection capabilities are closely related to the level of regional economic development and related inputs, economic driving is a key variable that regulates the improvement in defense and protection capabilities. Therefore, it is necessary to increase capital investment and policy support for tourism ecological protection in economically underdeveloped areas, establish a diversified tourism economic structure through industrial poverty alleviation and development of characteristic industries, reduce dependence on a single tourism product or market, improve the level of economic development and anti-risk ability in underdeveloped areas, and enhance the defense and protection ability of the national tourism ecosystem. For example, in the western ethnic areas, the development of folk culture tourism, rural tourism, eco-tourism, and other forms of tourism industry improves the local residents’ income level and the stability of the tourism economy;
- (4)
- Due to the vulnerability of the ecological environment and the relatively low level of economic development in the western region, the tourism ecosystem is vulnerable to external environmental changes and shocks, such as natural and human factors. The efficiency of vegetation net primary productivity is low, and the restoration and adjustment of the tourism ecosystem is difficult. The stability is poor, showing that the vulnerability of the western environment has a greater impact on the ability to adapt to recovery. Therefore, adaptive management strategies (such as ecological compensation mechanism) can reduce system sensitivity, increase ecological restoration and environmental protection in ecologically fragile areas in the western region, implement large-scale afforestation, soil and water conservation, desertification control, and other ecological projects, and improve vegetation coverage and ecosystem stability in the western region. At the same time, combined with the local ecological characteristics, the development of eco-friendly tourism projects, such as ecological tourism, ecological tourism, popular science tourism, etc., so that tourism development and ecological protection can promote each other;
- (5)
- According to the characteristics of the multi-polar distribution of optimization and innovation capabilities, we will further strengthen the innovation-driven development strategy of the national tourism industry and strengthen the application of digital technology to enhance system resilience. For example, in the core areas of innovation (Beijing, Shanghai, Zhejiang, Guangdong, Gansu, Qinghai, and Tibet), we should increase investment in tourism science and technology innovation, build tourism science and technology research and development center, innovation and entrepreneurship base, attract high-end tourism talents and innovative enterprises, strengthen the cooperation between universities, scientific research institutions and tourism enterprises, and promote the innovation of tourism products, services, and management modes. At the same time, we should establish a cross-regional tourism innovation alliance or cooperation platform, give full play to the role of radiation and collaborative innovation in the core areas of innovation, and promote the innovation and development of tourism in the surrounding areas and the central and western regions through technology transfer, talent exchange, and industrial cooperation, so as to realize resource sharing and complementary advantages. For example, the eastern coastal innovation area can help the central and western regions use new technologies to develop emerging tourism models such as smart tourism and virtual reality tourism, enhance the overall optimization and innovation capabilities of the national tourism ecosystem, and enhance the resilience of the tourism ecosystem.
5. Conclusions
- (1)
- The overall level of China’s TER is low, but it shows a steady-state growth trend. Although the growth is slow, it has strong stability and sustainability. The development trend of the seven major regions is consistent with the national average trend. It shows that the green effect of the tourism ecosystem in China’s provinces is enhanced, the ability to resist internal and external potential threats is improved, and the sustainable development ability of the tourism industry is enhanced;
- (2)
- The polarization of China’s TER has been alleviated, but there are still some provinces that occupy an absolute leading position with significant spatial heterogeneity, and the actual development of each region is quite different. The overall characteristics of China’s TER are ‘high in the east and low in the west, high in the south and low in the north’, forming a distribution pattern of high in the southeast and low in the northwest, and the change trends in different directions are different. The differentiation characteristics in the north–south direction are more obvious and strong, and the non-equilibrium differentiation characteristics are obvious. The overall formation of ‘Beijing–Shanghai’ as a dual-core high-toughness center, with the central and western regions as the outer edge of the hierarchical spatial structure characteristics;
- (3)
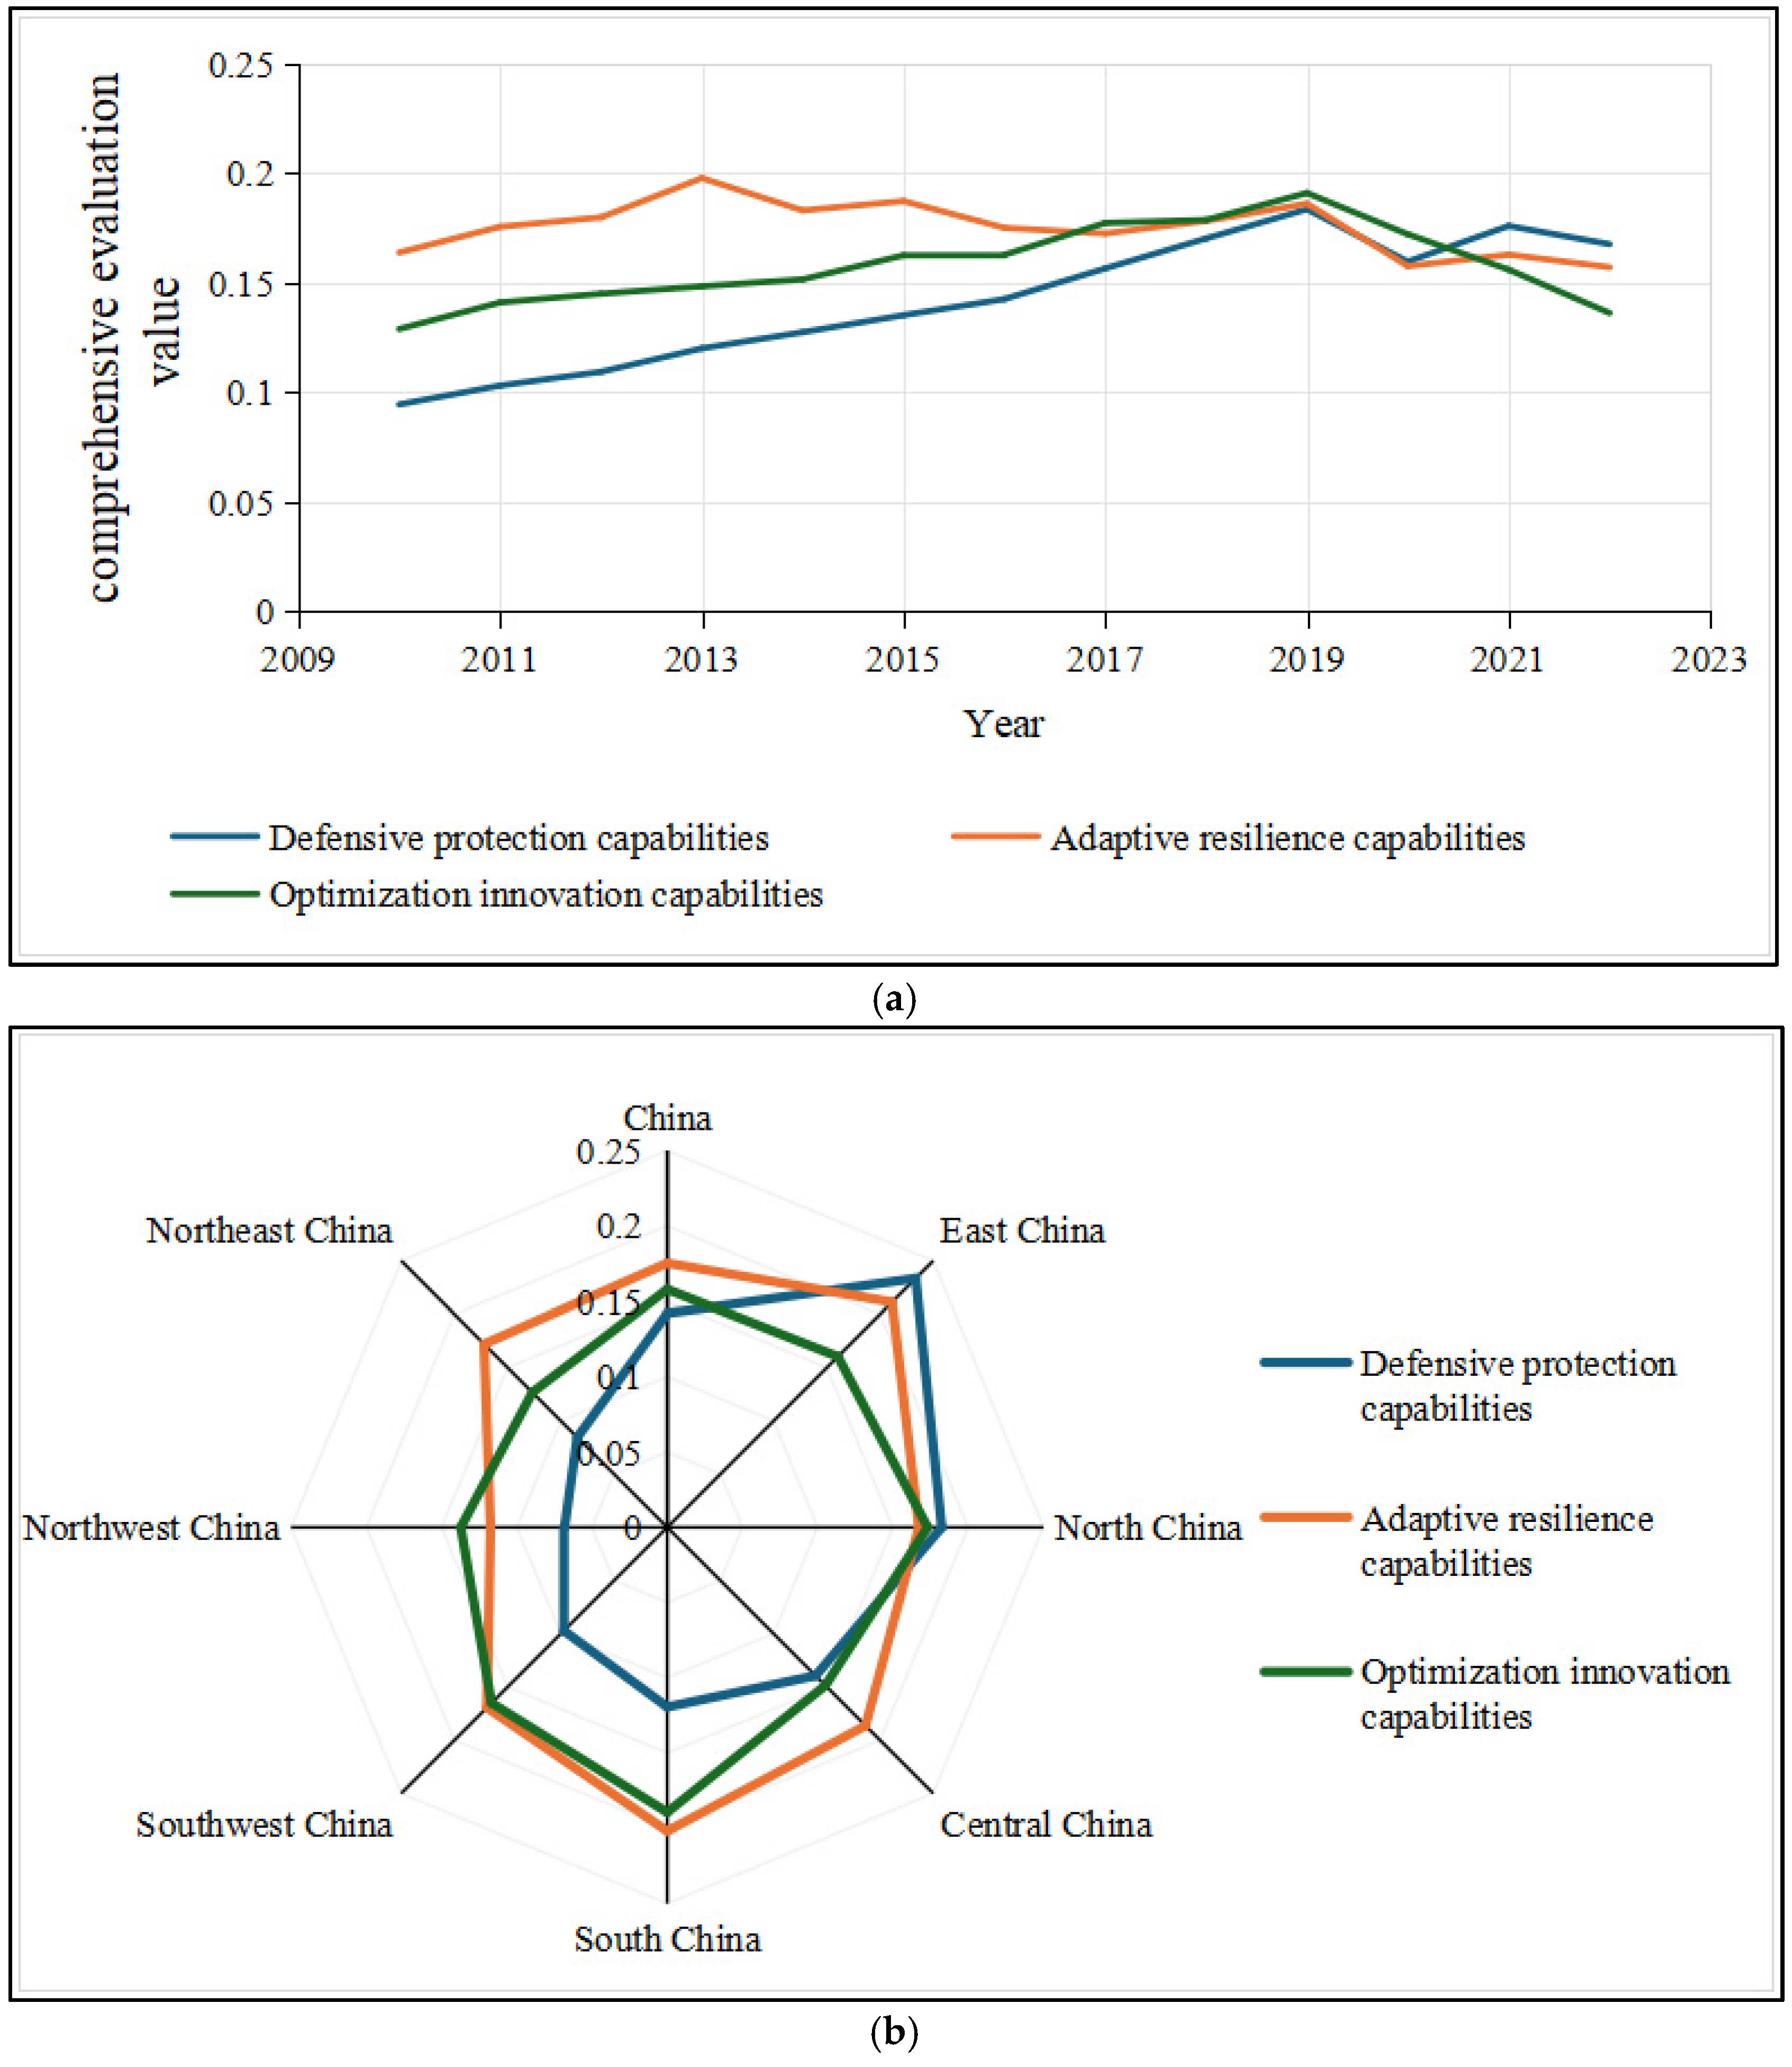
- The overall upward trend of DPC is obvious, showing a pattern of gradual attenuation from dual core to periphery. The average value of DPC in Northwest China is the lowest, which is closely related to the level of regional economic development and related investment, reflecting that economic driving is the key variable to regulate the improvement in defense and protection capacity. The mean value of ARC in Northwest China is the lowest; the level of ARC in the western region fluctuates greatly, and other regions remain relatively stable. The OIC shows a significant overall upward trend, forming a multi-polar distribution pattern with ‘Beijing–Shanghai–Zhejiang–Guangdong–Ganqing–Tibet’ as the core and gradually decreasing outward radiation;
- (4)
- The regional difference in China’s TER is gradually expanding, and the overall difference degree shows a fluctuating upward trend. The regional differences show the characteristics of high coincidence and fluctuation balance, and the fluctuation range is small, which indicates that the TER has strong stability, balance, and self-regulation ability. A dynamic balance mechanism has been formed in the development process of each region, which can maintain the development in a relatively stable difference interval. The difference within the region presents a spatial distribution pattern of ‘South China > North China > East China > Northwest > Northeast > Southwest > Central China’. The difference between East China and Northwest China is the largest, and the contribution rate of regional differences is the largest. It has been in a dominant position and is the main source of overall differences.
Author Contributions
Funding
Data Availability Statement
Conflicts of Interest
Abbreviations
| TER | Tourism ecological resilience |
| DPC | Defense protection capacity |
| ARC | Adaptation resilience/recovery capacity |
| OIC | Optimizing innovation capacity |
References
- Tang, C.C.; Zha, J.P.; Zhang, J.K.; Tao, Y.G.; Wang, L.G.; Wang, L.; Han, Y. Dual-carbon goal of China’s tourism industry under high-quality development: Evaluation & prediction, major challenges and realization path. J. Chin. Ecotourism 2021, 11, 471–497. [Google Scholar]
- Li, X. Ecological priority promotes development, and the integration of culture and tourism paints a new scene. Jinzhong Daily, 24 August 2023; 001. [Google Scholar]
- Ge, Q.; Xi, J. Strategic choices of regional tourism under the new normal of China’s economic growth. Prog. Geogr. 2015, 34, 793–799. [Google Scholar]
- Liu, Y.; Tang, J. Spatio-temporal evolution characteristics and influencing mechanism of green development efficiency of tourism industry in China. J. Nat. Resour. 2022, 37, 681–700. [Google Scholar] [CrossRef]
- Li, Z.; Feng, X.; Zuo, W.; Xia, Z.; Niu, J. Interactive stress effect and collaborative response of urban resilience level and tourism environmental carrying capacity: A case study of the Yangtze River Economic Belt. Sci. Geogr. Sin. 2024, 44, 660–669. [Google Scholar]
- Dogru, T.; Marchio, E.A.; Bulut, U.; Suess, C. Climate change: Vulnerability and resilience of tourism and the entire economy. Tour. Manag. 2019, 72, 292–305. [Google Scholar] [CrossRef]
- Navarro-Drazich, D.; Lorenzo, C. Sensitivity and vulnerability of international tourism by COVID crisis: South America in context. Res. Glob. 2021, 3, 100042. [Google Scholar] [CrossRef]
- Dai, B. The Impact of the Novel Coronavirus Epidemic on Tourism and the Countermeasures. Frontiers 2020, 6, 46–52. [Google Scholar]
- Hall, C.M.; Prayag, G.; Amore, A. Tourism and Resilience: Individual, Organisational and Destination Perspectives; Channel View Publications: Bristol, UK, 2018; pp. 1–397. [Google Scholar]
- Zhang, P.F.; Guo, W.; Yu, H. From vulnerability to resilience: How tourism turned crisis into opportunity? Tour. Trib. 2024, 39, 45–60. [Google Scholar]
- Yang, X.; Jia, Y.; Weng, G.; Li, Y.; Niu, J. A Study on System Dynamics of the Resilience of Urban Tourism Environment System: A Case Study of Lanzhou City. Tour. Sci. 2020, 34, 23–40. [Google Scholar]
- Ye, X.; He, Y.; Sun, R. Vulnerability and Anti-vulnerability: Research Progress and Review of Tourism Resilience. Tour. Trib. 2023, 38, 31–48. [Google Scholar]
- Walker, B.; Holling, C.S.; Carpenter, S.R.; Kinzig, A. Resilience, adaptability and transformability in social-ecological systems. Ecol. Soc. 2004, 9, 5. [Google Scholar] [CrossRef]
- Folke, C.; Carpenter, S.R.; Walker, B.; Scheffer, M.; Chapin, T.; Rockström, J. Resilience Thinking: Integrating Resilience Adaptability and Transformability. Ecol. Soc. 2010, 15, 20. [Google Scholar] [CrossRef]
- Shao, Y.W.; Xu, J. Understanding Urban Resilience: A Conceptual Analysis Based on Integrated International Literature Review. Urban Plan. Int. 2015, 30, 48–54. [Google Scholar]
- Tan, Z.L. Research on Resilience Evolution and Regulation of Resource-Based Cities in Heilongjiang Province. Doctoral Dissertation, Harbin Institute of Technology, Harbin, China, 2024. [Google Scholar]
- Scott, M. Resilience: A conceptual lens for rural studies? Geogr. Compass 2013, 7, 597–610. [Google Scholar] [CrossRef]
- Wang, Y.; Xiao, J. Research on Ecological Compensation Standard of Island Tourist Destination Based on Component Method of Ecological Footprint. China Popul. Resour. Environ. 2014, 24, 149–155. [Google Scholar]
- Xu, X.; Zheng, Y. Evaluation on Tourism Ecological Footprint and Compensation Standard in Rural Tourism Destination in Lhasa—A Case Study of Cijiaolin. Econ. Geogr. 2017, 37, 218–224. [Google Scholar]
- Paskova, M.; Wall, G.; Zeida, D.; Zelenka, J. Tourism carrying capacity reconceptualization: Modelling and management of destinations. J. Destin. Mark. Manag. 2021, 21, 100638. [Google Scholar]
- Leka, A.; Lagarias, A.; Panagiotopoulou, M.; Stratigea, A. Development of a Tourism Carrying Capacity Index (TCCI) for sustainable management of coastal areas in Mediterranean islands: Case study Naxos, Greece. Ocean. Coast. Manag. 2022, 216, 105978. [Google Scholar] [CrossRef]
- Gossling, S.; Peeters, P.; Ceron, J.; Dubois, G.; Patterson, T.; Richardson, R.B. The eco-efficiency of tourism. Ecol. Econ. 2005, 54, 417–434. [Google Scholar] [CrossRef]
- Kytzia, S.; Walz, M.; Wegmann, M. How can tourism use land more efficiently? A model-based approach to land-use efficiency for tourist destinations. Tour. Manag. 2011, 32, 629–640. [Google Scholar] [CrossRef]
- Wang, Z.; Liu, Q. Spatio-temporal Evolution and Influencing Factors of Tourism Eco-efficiency in the Yangtze River Economic Belt. Resour. Environ. Yangtze Basin 2019, 28, 2289–2298. [Google Scholar]
- Zhou, B.; Zhong, L.; Chen, T.; Zhang, A. Spatio-temporal Pattern and Obstacle Factors of Ecological Security of Tourism Destination: A Case of Zhejiang Province. Sci. Geogr. Sin. 2015, 35, 599–607. [Google Scholar]
- Xu, S.; Zuo, Y.; Zhang, M. Evaluation of tourism ecological security and diagnosis of obstacle factors in China based on fuzzy object element model. Sci. Geogr. Sin. 2021, 41, 33–43. [Google Scholar]
- Fang, Y.; Wu, Y.; Wang, Q. Evaluation and Influencing Factors of Tourism Economic Resilience Based on DPSIR Model: A Case Study of the Yangtze River Delta Urban Agglomeration. J. Nanjing Norm. Univ. (Nat. Sci. Ed.) 2024, 47, 26–34. [Google Scholar]
- Yang, S.; Huang, L.; Duan, Z.; Huang, W. Spatiotemporal dynamic and obstacle factor analysis of tourism economic resilience in Chinese urban agglomeration. J. Nat. Resour. 2024, 39, 1262–1277. [Google Scholar] [CrossRef]
- Yang, X.; Qin, Y. Regional Differences and Dynamic Evolution of Tourism Economic Resilience in China. Sci. Technol. Manag. Land Resour. 2024, 41, 90–105. [Google Scholar]
- Liu, H. A Study on the Assessment of Resilience of Rural Tourism Communities in the Context of the COVID-19: Taking Huizhou Nankunshan Community as An Example. Master’s Thesis, South China University of Technology, Guangzhou, China, 2023. [Google Scholar]
- Zhang, Y. Resilience Measurement and Impact Mechanism of Tourism Community Under the Impact of COVID-19. Master’s Thesis, Zhengzhou University, Zhengzhou, China, 2022. [Google Scholar]
- Zeng, A. Tourism Community Resilience Under Over-tourism—A Case Study of Kulangsu, a Historic International Settlement. Master’s Thesis, Beijing Forestry University, Beijing, China, 2020. [Google Scholar]
- He, J.; Jiang, W. Basic Theory, Decision and Management Ideas of Resilience and High Quality Development of Tourism Enterprises under the Epidemic. Tour. Trib. 2022, 37, 8–10. [Google Scholar]
- Zhang, J. Resilient Leadership in Tourism Enterprise: Measurement, Evolution, and Mechanism. Ph.D. Thesis, Huaqiao University, Xiamen, China, 2022. [Google Scholar]
- Li, X. Resilience of Tourism Enterprises and Mechanism Under the Impact of COVID-19: A Case Study of CTRIP. Master’s Thesis, Beijing International Studies University, Beijing, China, 2021. [Google Scholar]
- Liu, J.; Ma, H.; Xi, J. The measurement and influencing factors of livelihood resilience in heritage tourism destinations—A case study of Pingyao ancient city, Shanxi province. Tour. Trib. 2023, 38, 70–83. [Google Scholar]
- Jin, Y.; Xiang, F. The Impact of Entrepreneurs Network Management Ability on Entrepreneurship Resilience in Tourism Destinations of Ethnic Villages. Tour. Forum 2023, 16, 40–50. [Google Scholar]
- Wang, L.; Huang, Z.; Yu, L.; Ning, Z. Evaluation of the Development Resilience of Tourist Attractions under the Influence of Major Public Health Events. J. Resour. Ecol. 2024, 15, 698–710. [Google Scholar]
- Yin, N.; Zuo, J.; Yang, M.; Yang, J.; Liu, S.; Wu, J. Spatio-temporal evolution of social-ecological system resilience in ethnic tourism destinations in mountainous areas and trend prediction: A case study in Wuling, China. Sci. Rep. 2024, 14, 23563. [Google Scholar] [CrossRef] [PubMed]
- Ma, M.; Tang, J. The impact of the resilience of China’s tourism environmental system on the efficiency of green development and the spatial spillover effect. Stat. Decis. 2024, 40, 119–123. [Google Scholar]
- Zhu, J.; Ma, X. Research on the Assessment and Influencing Factors of the Resilience of Urban Tourism Environment: A Case Study of Chengdu-Chongqing Urban Agglomeration. J. Leshan Norm. Univ. 2024, 39, 42–51. [Google Scholar]
- Zhao, W.S.; Chen, X.; Lei, Z.; Zhou, X. Spatio-temporal evolution and influencing factors of the resilience of tourism environmental systems in the Yangtze River economic belt of China. Sustainability 2023, 15, 10527. [Google Scholar] [CrossRef]
- Wang, K.; Chen, X.; Lei, Z.; Zhao, S.; Zhou, X. The effects of tourism development on eco-environment resilience and its spatio-temporal heterogeneity in the Yangtze River economic belt, China. Sustainability 2023, 15, 16124. [Google Scholar] [CrossRef]
- Niu, J.; Xin, B.; Wang, M. Coordinated development evaluation of urban ecological efficiency and ecological resilience and identification of obstacle factors. Stat. Decis. 2024, 4, 79–84. [Google Scholar]
- Cao, K.; Long, S. Spatio-temporal Differentiation and Spillover Effect of Green Development Efficiency of Urban Tourism Industry in China. Resour. Environ. Yangtze Basin 2024, 33, 1–13. [Google Scholar]
- Zhang, J. Coupling Coordination and Interactive Response between Tourism Ecosystem Resilience and Regional Development: Evidence from the Yangtze River Economic Belt, China. Master’s Thesis, Chongqing University of Technology, Chongqing, China, 2024. [Google Scholar]
- Peng, C.; Guo, Z.Y.; Peng, Z.R. Research Progress on the Theory and Practice of Foreign Community Resilience. Urban Plan. Int. 2017, 32, 60–66. [Google Scholar] [CrossRef]
- Luo, F.; Liu, Y.; Peng, J. Assessing urban landscape ecological risk through an adaptive cycle framework. Landsc. Urban Plan. 2018, 12, 125–134. [Google Scholar] [CrossRef]
- Turner, B.L., II. Vulnerability and resilience: Coalescing or paralleling approaches for sustainability science? Glob. Environ. Change 2010, 20, 570–576. [Google Scholar] [CrossRef]
- Niu, Y.; Chen, T. Research on tourism ecological environment system: The cornerstone of ecotourism research. Tour. Trib. 2004, 4, 5–6. [Google Scholar]
- Fan, Y.; Tian, J. Spatio-temporal differentiation of urban resilience and its influencing factors: An empirical study based on Hubei Province. Stat. Decis. 2023, 23, 57–62. [Google Scholar]
- Li, J.H.; Zeng, X.; Cao, Q.Y.; Ji, Y. Evaluation and Trend Forecast of Tourism Ecological Security in Karst Mountainous Areas: Taking International Mountain Tourism Destination of Guizhou Province as an Investigation Sample. Ecol. Econ. 2022, 38, 145–151. [Google Scholar]
- Weng, G.M.; Pan, Y.; Li, L.Y. The eco-security grading and spatial-temporal evolution of tourism based on improved DPSIR-DS model: A case study of the five northwestern provinces along the SilkRoad. Tour. Sci. 2018, 32, 17–32. [Google Scholar]
- Zhou, B.; Yu, H.; Zhong, L.S.; Chen, T. Developmental trend forecasting of tourism ecological security trends: The case of Mount Putuo Island. Acta Ecol. Sin. 2016, 36, 7792–7803. [Google Scholar]
- Zhang, Y.Q.; Xiong, K.N.; Chen, Y.; Bai, X. Spatio-temporal changes and driving factors of ecological vulnerability in karst World Heritage sites based on SRP and geodetector: A case study of Shibing and Libo-Huanjiang karst. Herit. Sci. 2025, 13, 65. [Google Scholar] [CrossRef]
- Li, Z.Y.; Xia, Z.C. Measurement of high-quality tourism development level and spatial-temporal pattern of mismatch degree in the Yangtze River Economic Belt. J. Nanjing Norm. Univ. (Nat. Sci. Ed.) 2021, 44, 33–42. [Google Scholar]
- Wang, Z.F.; Chen, Q.Q. Spatio-temporal pattern evolution and trend prediction of tourism ecological security in the Yangtze River Economic Belt since 1998. Acta Ecol. Sin. 2021, 41, 320–332. [Google Scholar]
- Qin, X.; Cheng, Y. Evaluation and type classification on chinese tourist urban ecological security system: Based on the Network DEA model with node weight. Sci. Geogr. Sin. 2019, 39, 156–163. [Google Scholar]
- Li, M.C.; Li, S.T.; Wang, C.X.; Qin, W.S.; Sun, J.F. Study on the comprehensive evaluation and obstacle factors of ecological security of island tourism destinations in China. Mar. Sci. 2020, 44, 76–86. [Google Scholar]
- Cheng, Y.; Yang, Y.; Liu, Z. Capital Flow and Productivity Evolution of China’s Tourism Industry: Structure Effect Analysis Based on DSSA Method. Tour. Sci. 2020, 34, 33–53. [Google Scholar]
- Zhang, S.; Zhao, X.; Yang, J.; Yuan, C. Evaluation and Coupling Coordination Degree of Urban Factor Aggregating Capability —A Case Study of Shaanxi Province. J. Nanjing Norm. Univ. (Nat. Sci. Ed.) 2020, 4, 23–30. [Google Scholar]
- Xiang, J.; Hu, Q.; Yan, H. Regional Differences and Dynamic Evolution of China’s Digital Inclusive Finance Development. J. Tech. Econ. Manag. 2021, 2, 65–70. [Google Scholar]
- Zan, X.; Ou, G. Evolution of Urban Economic Development Potential in China: Analysis of Urban Agglomerations Based on Comprehensive Economic Zones. Inq. Into Econ. Issues 2020, 10, 15–26. [Google Scholar]
- Li, Z.; Feng, X.; He, J.; Zuo, W. Spatial correlation network structure and driving factors of tourism ecological resilience in China. Geogr. Res. 2024, 43, 1146–1165. [Google Scholar]
- Fu, J.; Zhang, H.Q. Study on the evolutionary characteristics of the spatial association network of tourism eco-efficiency and its formation effect in China. J. Environ. Manag. 2025, 379, 124706. [Google Scholar] [CrossRef] [PubMed]
- Xu, D.; Shang, Y.F.; Yang, Q.; Chen, H. Population aging and eco-tourism efficiency: Ways to promote green recovery. Econ. Anal. Policy 2023, 79, 1–9. [Google Scholar] [CrossRef]
- Yang, G.; Gui, Q.; Chen, Y. Spatiotemporal variation characteristics and influencing factors of tourism ecosystem resilience in Chengdu-Chongqing Economic Circle. In Proceedings of the 2022 China Tourism Science Annual Conference: Tourism Talent Construction and Youth Talent Training, Beijing, China, 21–23 April 2022; China Tourism Academy: Beijing, China, 2022; p. 14. [Google Scholar]
- Sun, Y.H.; Ding, W.W.; Yang, G.C. Green innovation efficiency of China’s tourism industry from the perspective of shared inputs: Dynamic evolution and combination improvement paths. Ecol. Indic. 2022, 138, 108824. [Google Scholar] [CrossRef]
- Liao, Z.J.; Liang, S.; Wang, X.F. Spatio-temporal evolution and driving factors of green innovation efficiency in the Chinese urban tourism industry based on spatial Markov chain. Sci. Rep. 2024, 14, 10671. [Google Scholar] [CrossRef]
- Guo, X.; Ming, Q.; Yang, C.; Mu, X.; Hu, J. Spatiotemporal Evolution of Tourism Ecosystem Resilience in Karst Ecologically Fragile Areas and Its Multi-scale Obstacle Factors: A Case Study of Guizhou. Econ. Geogr. 2023, 43, 190–200 + 230. [Google Scholar]
- Sun, Y.Y.; Hou, G.L.; Huang, Z.F.; Zhong, Y. Spatial-Temporal Differences and Influencing Factors of Tourism Eco-Efficiency in China’s Three Major Urban Agglomerations Based on the Super-EBM Model. Sustainability 2020, 12, 4156. [Google Scholar] [CrossRef]

| Capabilities | Feature Layers | Indicator Layer (Number) | Unit | Metric Attributes | |
|---|---|---|---|---|---|
| Defensive protection capabilities A | Socio-economic support A1 | GDP per | A11 | Dollar | + |
| GDP growth rate | A12 | % | + | ||
| Per capita disposable income of residents | A13 | Dollar | + | ||
| Total retail sales of consumer goods | A14 | billion dollars | + | ||
| Urbanization rate of the population | A15 | % | + | ||
| population density | A16 | person/km2 | + | ||
| Tourist attraction A2 | Tourism resource evaluation index | A21 | - | + | |
| Tourism Spatial Density (Tourism Spatial Index) | A22 | person /km2 | − | ||
| Tourist Population Density (Tourist Density Index) | A23 | people/hundreds | − | ||
| Growth rate of tourist arrivals | A24 | % | + | ||
| Tourism revenue growth rate | A25 | % | + | ||
| Average daily visitor traffic | A26 | 10,000 people/day | + | ||
| Tourist reception capacity A3 | Density of A-level tourist attractions | A31 | pcs/km2 | + | |
| Travel agency density | A32 | pcs/km2 | + | ||
| Density of star-rated hotels | A33 | pcs/km2 | + | ||
| Adaptive resilience capabilities B | Ecological and environmental pressures B1 | Solid waste discharge | B11 | t | − |
| The amount of household waste generated | B12 | t | − | ||
| Domestic sewage discharge | B13 | 10,000 t | − | ||
| Industrial SO2 emissions | B14 | t | − | ||
| Industrial wastewater discharge | B15 | 10,000 t | − | ||
| Industrial soot emissions | B16 | t | − | ||
| Development of the tourism industry B2 | Total number of tourists | B21 | 10,000 people | + | |
| Comprehensive tourism income | B22 | billion dollars | + | ||
| Per capita tourism income of residents | B23 | Dollar | + | ||
| Tourists spend per capita | B24 | Dollar | + | ||
| Tourism economic density | B25 | 10,000/km2 | + | ||
| Ecological and environmental quality B3 | precipitation | B31 | mm | + | |
| Green cover area | B32 | hectare | + | ||
| Forest cover | B33 | % | + | ||
| The area of green space in parks per capita | B34 | m2/person | + | ||
| The number of days when the air quality reaches level 2 or above | B35 | days | + | ||
| Environmental Composite Index | B36 | - | + | ||
| Area of natural wetlands | B37 | Thousand hectares | + | ||
| Optimization innovation capabilities C | Innovative R&D C1 | Tourism R&D funding | C11 | billion dollars | + |
| Number of tourism-related patent applications | C12 | item | + | ||
| Quantity of high schools in each district | C13 | piece | + | ||
| Number of tourism-related papers published | C14 | chapter | + | ||
| Number of students majoring in tourism in colleges and universities | C15 | person | + | ||
| Funding control C2 | Tourism management services expenditure ratio | C21 | % | + | |
| Expenditure on cultural construction | C22 | % | + | ||
| Tourism capital productivity | C23 | % | + | ||
| Investment in the tertiary industry | C24 | % | + | ||
| Environmental Investment (Proportion of GDP in Environmental Protection) | C25 | % | + | ||
| Energy conservation and environmental protection expenditure ratio | C26 | % | + | ||
| Environmental governance C3 | Comprehensive utilization rate of industrial solid waste | C31 | % | + | |
| Harmless treatment rate of domestic waste | C32 | % | + | ||
| Municipal sewage treatment rate | C33 | % | + | ||
| Industrial water reuse | C34 | % | + | ||
| Afforestation area | C35 | 10,000 hectares | + | ||
| The number of workers engaged in environmental protection | C36 | person | + | ||
Disclaimer/Publisher’s Note: The statements, opinions and data contained in all publications are solely those of the individual author(s) and contributor(s) and not of MDPI and/or the editor(s). MDPI and/or the editor(s) disclaim responsibility for any injury to people or property resulting from any ideas, methods, instructions or products referred to in the content. |
© 2025 by the authors. Licensee MDPI, Basel, Switzerland. This article is an open access article distributed under the terms and conditions of the Creative Commons Attribution (CC BY) license (https://creativecommons.org/licenses/by/4.0/).
Share and Cite
Jiang, L.; Chen, X.; Pu, L.; Xue, H. Spatio-Temporal Evolution Characteristics of Tourism Ecological Resilience in China. Land 2025, 14, 966. https://doi.org/10.3390/land14050966
Jiang L, Chen X, Pu L, Xue H. Spatio-Temporal Evolution Characteristics of Tourism Ecological Resilience in China. Land. 2025; 14(5):966. https://doi.org/10.3390/land14050966
Chicago/Turabian StyleJiang, Li, Xingpeng Chen, Lili Pu, and Huaju Xue. 2025. "Spatio-Temporal Evolution Characteristics of Tourism Ecological Resilience in China" Land 14, no. 5: 966. https://doi.org/10.3390/land14050966
APA StyleJiang, L., Chen, X., Pu, L., & Xue, H. (2025). Spatio-Temporal Evolution Characteristics of Tourism Ecological Resilience in China. Land, 14(5), 966. https://doi.org/10.3390/land14050966