Abstract
Morocco, like many nations undergoing significant economic and social transformation, is experiencing rapid urbanization alongside an ongoing rural exodus. This, coupled with the country’s diverse climate and heterogeneous geography, warrants a detailed exploration of urbanization’s effect on surface climate. Utilizing the Simple Biosphere (SiB2) model’s simulated surface temperature, this study analyses summer’s urban heat structure of seven Moroccan urban areas and their surroundings, assessing the urban impact on surface temperature at the city center, and the intensity and spatial distribution of the urban heat island (UHI) effect at different spatial resolutions. Results show wide-ranging dissimilarities in urban thermal profiles, with the maximum UHI intensity recorded at 8.7 °C in the Dakhla peninsula. Urban heat sink (UHS) effects were observed in six of the seven studied cities, with Marrakech being the exception, only exhibiting UHI effects. A more detailed examination of the thermal profile in Rabat’s metropole at a finer scale, using Landsat-observed land surface temperature (LST), yields additional insights into UHI characteristics, and the findings are contrasted with the existing literature to provide broader insights. The implications of this study strongly resonate within the Moroccan context and its neighboring regions with similar environmental and socio-economic features and should aid in the development of sustainable regional urban planning.
1. Introduction
The current state of academic knowledge regarding the urban heat island (UHI) effect reflects a continuous recognition of its global significance, while acknowledging its nuances across biomes and world regions. Research has elucidated the mechanisms driving the UHI’s formation, and advances in remote sensing and modeling techniques have enabled the quantification and characterization of its intensity with greater precision. The UHI phenomenon manifests when urban temperatures are higher than those of the surrounding vegetated, or otherwise rural, areas, as a result of the natural alterations caused by urbanization upon land surface properties and energy balance. Consequently, urban areas often exhibit elevated temperatures, particularly during periods of calm wind and high insolation [1]. Furthermore, the urban heat sink (UHS), an inverted UHI, manifests when urban areas are cooler than their rural surroundings due to factors such as proximity to water bodies providing a cooling effect, or the presence of resource-augmented urban vegetation within cities in arid climate zones [2,3]. This study investigates surface temperature differences derived from modeled data; thus, the phenomena examined correspond to a surface urban heat island (SUHI) and a surface urban heat sink (SUHS), although for simplicity, the terms urban heat island (UHI) and urban heat sink (UHS) are used throughout.
Four primary components influence the UHI effect: urban fabric characteristics, anthropogenic activities, urban morphology, and global temperature patterns. Indeed, the UHI effect can occur naturally, even without human activities, due to the higher capacities of urban materials to absorb and retain solar energy compared to the rural surroundings. Building materials in urban areas, like concrete and asphalt, possess low albedo, high thermal conductivity, and a significant capacity to absorb and retain solar heat which results in elevated surface temperatures [4]. Secondly, human activities such as industrial processes, transportation, and energy consumption generate substantial heat emissions in urban areas, further contributing to temperature increases [5,6]. Thirdly, numerous scholars have highlighted the impact of urban morphological parameters—including building size, shape, compactness, vegetation cover types, and population densities—on the UHI effect [7,8,9,10]. Lastly, rising regional and global temperatures driven by increased greenhouse gas emissions contribute to baseline temperature increases, further intensifying UHI effects [11,12,13].
While the basic principles of the UHI effect seem evident, several studies have highlighted the influence of regional climate conditions, urban planning policies, and socio-economic factors on its intensity and spatial distribution [14,15,16]. For instance, its intensity tends to be more pronounced in densely populated metropolitan areas with extensive impervious surfaces and limited vegetation cover, exacerbating heat-related health risks and energy demands [17]. Nonetheless, a UHI’s manifestation can vary, as subtropical cities experience distinct thermal profiles compared to temperate or tropical counterparts [18,19].
The UHI effect is not a static phenomenon but a dynamic process influenced by urban typology and the condition of surrounding ecosystems. It is essential to distinguish between the occurrence of the UHI and changes in its amplitude. The UHI effect, defined as the temperature difference between an urban core and its surrounding rural area, is shaped by both regional and global warming, and its intensity primarily varies based on differences in land cover. Since different land cover types respond differently to rising temperatures, the impact of warming on the UHI will vary nonlinearly across urban areas, depending on the city’s characteristics and the health of the nearby vegetation. This suggests that as urban temperatures rise with global warming, the response of the surrounding rural areas will largely depend on the physiological state of their vegetation. For instance, if the vegetation is heat tolerant and unstressed, it will continue to photosynthesize and transpire, cooling the rural area and amplifying the urban–rural temperature contrast, consequently intensifying the UHI effect. Conversely, if the vegetation is stressed due to either temperature or drought, it will downregulate its stomata and reduce transpiration, releasing most absorbed solar energy as sensible heat, which leads to increased rural temperatures, potentially surpassing urban ones and resulting in a UHS effect.
Across the African continent, the UHI effect manifests as a multifaceted phenomenon, influenced by diverse geographical, climatic, socio-economic, and cultural factors. From the metropolises of Yaoundé (Cameroon) and Nairobi (Kenya) to the urban centers of Addis Ababa (Ethiopia) and Lagos (Nigeria), it has been shown that urban areas across the African continent experience elevated temperatures compared to their surrounding rural vicinities [20,21,22].
Morocco, located in northwestern Africa, offers a compelling case for studying urban thermal profiles due to its unique geographical and socio-environmental characteristics. Bordered by the vast Sahara Desert to the south, the Atlantic Ocean to the west, and the Mediterranean Sea to the north, the country experiences a pronounced environmental gradient that shapes diverse thermal profiles. The coexistence of densely populated urban centers with contrasting natural landscapes creates microclimatic variations, which adds to the country’s strong meridional temperature and precipitation gradients, leading to significant land cover differences. Additionally, most of the population is concentrated in dispersed agglomerations along the northern and western coasts, where the pressure of urbanization and the growing rural exodus [23] heighten the relevance of studying the UHI effect. Beyond its environmental implications, understanding the urban thermal structure in Morocco is crucial for understanding related socio-economic challenges across sectors such as public health, infrastructure, and energy demand. Comprehensive insights into the country’s UHI dynamics should support the development of effective, region-specific adaptation strategies.
By analyzing specific examples from Morocco—including Casablanca, Marrakech, Agadir, Oujda, Errachidia, Dakhla, and the metropolitan area of Rabat, which encompasses the capital city Rabat, along with neighboring cities Salé and Temara—and drawing on findings from previous studies, this contribution aims to provide deeper insights into factors influencing urban thermal structures and the change in their intensities in the context of global and regional climate change. The findings are intended to inform urban heat mitigation strategies and climate adaptation efforts in Morocco, as well as in neighboring regions with comparable environmental, and socio-economic characteristics.
2. Study Area, Data, and Model
2.1. Study Area
Seven Moroccan cities from different administrative regions were selected to carry out this study. Figure 1 shows the location of these urban areas, selected for their varied urban attributes, such as different climate zones, altitudes, urban morphology, and land use patterns. Studying the UHI effect in the Rabat metropolitan area is particularly important due to its unique geographic position, flanked by the commuter urban conurbations of Salé to the north and Temara to the south (Figure 1), forming a metropolis for which the UHI effect has not been previously studied. Additionally, the urban thermal profiles of Errachidia and Dakhla offer novel findings with a perspective of cities within arid and Saharan climates.

Figure 1.
Geographic location of the study areas, including the cities of Rabat, Casablanca, Marrakech, Agadir, Dakhla, Errachidia, and Oujda.
2.2. Data
The detailed methodology of the data fusion is described in [24], and a summary is presented here for reference. Landsat-based Impervious Surface Area (ISA) from the Global Land Survey (GLS) [25] was used to characterize urban areas at 30 m spatial resolution, and MODIS-based land cover products [26] at 500 m spatial resolution were used to describe the land cover vegetation within a global climate modeling grid (CMG) of 0.10° × 0.10° of latitude–longitude (approximately 10 × 10 km).
The data fusion followed three distinct steps: (1) we first aggregated the different land cover types from MODIS 500 m and calculated fractions of each land cover type within the CMG; (2) we co-registered and aggregated the ISA from 30 m to the same CMG; and (3) we replaced into the CMG the build-up fraction from MODIS with the Landsat-based ISA. In doing so, we recognize that the accuracy of Landsat is superior to MODIS in characterizing the urban area. Since these two fractions are not equal, MODIS buildup being larger than Landsat ISA at the CMG level, these differences were redistributed proportionally over other non-urban classes within the CMG using their fractions as weights. This led to a global 0.1 × 0.1 degrees CMG in which each pixel may have up to 13 distinct land cover classes. For each CMG land cover type, biophysical parameters were generated every 16 days using MODIS data.
2.3. Model
The land cover map along with the biophysical parameters were used as boundary and lateral conditions for the Simple Biosphere model (SiB2) [27] to simulate the impact of urbanization as a form of land use on the surface energy, water, and carbon cycles at a global level for the year 2010, selected due to the availability of comprehensive biophysical and climatological data, and as a reliable global ISA product which allowed accurate urban characterization.
SiB2 is a biophysically based land surface model (LSM) that calculates the exchanges of energy, carbon, water, and momentum, explicitly considering 13 land cover classes [27], and includes an urban canopy model [28]. The model accounts for the hydraulic and thermal properties of various soil types. The prognostic variables include the canopy, ground, and deep soil temperatures, the water content in three soil layers, the canopy and ground interception stores, as well as canopy stomatal conductance. SiB2 also incorporates an integrated photosynthesis-conductance sub-model that simultaneously calculates the carbon assimilation and water vapor exchanges between the canopy and the canopy air space [29]. Alongside the biophysical fields that describe the vegetation characteristics and phenology, SiB2 is forced by short- and longwave radiation, large-scale and convective precipitation, canopy-level temperature, wind speed, specific humidity, and surface pressure. It outputs emitted and reflected radiation fluxes, soil and canopy latent and sensible heat fluxes, and the carbon assimilation rate, among other diagnostics [28]. The SiB2 surface temperature outputs have been validated in many studies [30,31,32,33], demonstrating a high degree of similarity to observations made by satellite instruments, such as Landsat and MODIS, highlighting the model’s reliability and accuracy in estimating surface temperature and thus the UHI effect.
In this study, the model was used in a stand-alone mode forced by meteorological data obtained from MERRA analysis [34]. This approach helps to isolate the effects of land cover change on local surface temperature independent of atmospheric circulation. This also allowed us to run the model globally at 0.10 × 0.10-degree spatial resolution. The model was spun up for 5 years, forced by hourly climate data. It was integrated independently for each land cover class and outputs from different integrations are stratified by land cover type, as well as a weighted average obtained as a response from each land cover weighted by its fraction within the CMG. After spin-up, each simulation was integrated forward another 3 years using the same atmospheric drivers so that model responses are exclusively attributable to changes in land cover class, a method proven to capture the observed changes in land surface. In this analysis, we use the model surface temperature outputs averaged over the last three years of integration over Morocco, for the summer season (JJA), which is characterized by conditions that typically amplify urban–rural thermal contrasts, offering a meaningful lens through which to evaluate land cover impacts on surface climate.
2.4. Data Organization
Surface (skin) temperatures obtained from SiB2 were time-averaged over the months of June, July, and August using daily average temperatures to create a seasonal summer mean temperature. A buffer zone was created at 0.1-degree intervals from the representative center of each urban area and expanding outward towards the peripheries (Figure 2). The city center was defined by the center of the CMG having the highest ISA fraction. A series of axes were then drawn, connecting the city center to the buffer edge, with a spacing of 5 degrees between each axis, making a total of 72 axes to best capture the temperature structure distinguishing the urban core from its surrounding landscape. The original gridded model temperatures were interpolated to the radial axes to obtain temperatures around a city. This process took in consideration elevation and distances between cities. Along each axis, temperatures were extracted every 0.1 degree (radial spacing), and were subsequently averaged across axes within defined quadrants to derive temperature values representing key directional transects adapted for each urban area. This approach facilitated the visualization of the temperature structure within cities, and their peri-urban and rural areas, although having some limitation near large topographic features and coastal areas.
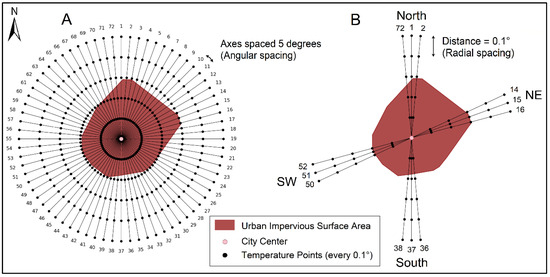
Figure 2.
Illustration of axes and buffer zone for LST analysis: (A) Distribution of axes radiating outward from the urban center to delineate directions and the buffer zone. (B) Selected quadrants with their respective axes defining north–south and northeast–southwest directional transects.
To analyze the UHI effect, two representative cross-sections of each city were selected based on geographical characteristics and land cover composition. For instance, in the case of coastal cities, cross-sections were designed to capture temperature profiles both perpendicular and parallel to the coastline, whereas, for inland cities, cross-sections extended in both north–south and east–west directions, adjusted based on land cover features, taking into consideration any natural or anthropogenic obstacles that could influence the temperature structure.
3. Results and Discussion
Table 1 summarizes the results for the seven urban areas, presenting the impact of urbanization on surface temperature in the city center and the corresponding temperature differences between urban and surrounding rural areas. These values indicate the presence of either a UHI or a UHS, depending on the direction of the transect. The urban impact on surface temperature is calculated as the difference between the actual temperature—defined as the average temperature of all land cover classes (including urban) coexisting in each CMG weighted by their fractions—and the average temperature of vegetation classes only (excluding urban) weighted by their fractions. UHI and UHS values are obtained as differences between the actual temperature at the city center and that of the surrounding rural area along each transect, with positive values indicating a UHI and negative values indicating a UHS.

Table 1.
Urban impact on surface temperature and UHI/UHS intensity across the selected Moroccan cities, positive values represent UHI and negative values represent UHS.
The urban impact on surface temperature at the city center varied across urban areas. Errachidia experienced the lowest impact, with an increase of only 0.1 °C. This was expected as this city, located in central eastern Morocco, has a hot desert climate characterized by high temperatures, peaking in summer, with very little rainfall throughout the year. The region’s landscape is dominated by desert and rocky terrain while the vegetation cover is sparse, typical of a semi-arid to arid environment, with drought-resistant plants such as shrubs, grasses, and scattered palm groves, making the natural vegetation limited outside a few irrigated zones. Within this arid desert environment, urbanization and the increase in impervious surfaces have had a minimal impact on surface temperature. In contrast, Rabat, Casablanca, Agadir, and Dakhla, all coastal cities, have had a similar urban-induced increase in temperature of about 0.2 °C, despite their differences in size and climate. This consistency underlines how factors beyond city size, such as proximity to water and urban vegetation, play a role in moderating this difference. In Marrakech, an inland city, urbanization has had an impact of 0.2 °C on surface temperature, which is likely due to local vegetation being stressed during the summer season. Indeed, in this semi-arid region, daytime surface temperature can get as high as 40 °C, stressing the local vegetation which shunts all of the absorbed solar radiation into sensible heating, thus increasing its temperature and decreasing the difference from the urban areas. The city of Oujda, located in the northeastern part of the country, and not too far from the Mediterranean shores, has experienced the largest urban-induced temperature of 0.4 °C. There, the summer is moderately warm, and the vegetation is less stressed than in Marrakech. Furthermore, most of the urban vegetation is irrigated during summertime, making the urban area warmer than the vegetated landscape.
A detailed investigation is addressed in the following sections through a closer examination at each city’s landscape and how it influences the ambient thermal structure.
3.1. Case of Coastal Cities
3.1.1. Temperature Structure in the Metropolitan Area of Rabat
The city of Rabat is characterized by a humid to sub-humid Mediterranean climate and is distinguished by a blend of modern and traditional architectural styles. Rabat benefits from the maritime influence of the Atlantic Ocean modulating its temperature, particularly during the warm and dry summer months (JJA). The most relevant temperature cross-sections in Rabat are those oriented perpendicular and parallel to its coastline (Figure 3 and Figure 4).

Figure 3.
Summertime (JJA) simulated average surface temperature cross-section along a northwest NW–southeast SE transect perpendicular to the coastline and crossing the city of Rabat. The left panel shows the land cover for the year 2010, and the selected axes for the transect. The right panel displays the surface temperature profile along the transect: The left y-axis shows the model-simulated temperatures in degrees Celsius, representing the actual temperature (‘act temp’) and the vegetation-only temperature (‘veg temp’). The dashed curve shows the hypothetical temperature profile if the city were surrounded by water. The right y-axis shows the difference between ‘act temp’ and ‘veg temp’ representing the impact of urbanization on surface temperature.
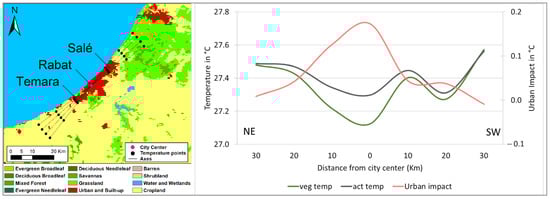
Figure 4.
Same as Figure 3, except for simulated surface temperature cross-section along a northeast–southwest transect parallel to the coastline and crossing the metropole of Rabat–Salé–Temara.
The quadrant perpendicular to the coast originating from the city center towards the northwest and the southeast allowed for the construction of the cross-section of average surface temperature represented in Figure 3.
From the northwest versant of the city, temperature increases from 22.5 °C over the ocean to 27.3 °C in the city center, creating a UHI with an amplitude of 4.8 °C. Along the same transect, and at 10 km towards the southeastern periphery, the landscape becomes rural, and the temperature increases by 0.5 °C, indicating the presence of a UHS. Further south (approx. 30 km), low-albedo fallow lands reach 28.3 °C, indicating a pronounced UHS of 1.0 °C. During dry summers, irrigated urban green spaces facilitate significant evapotranspiration and evaporation. This leads to a high latent heat flux that moderates urban temperatures through evaporative cooling. Unlike the surrounding dry rural lands which dissipate solar radiation mainly as sensible heat, the urban environment leverages evaporative cooling, creating a strong thermal gradient. Additionally, coastal sea breezes cool the urban area more effectively than the hot, moisture-deficient rural periphery due to factors like urban thermal mass and ventilation.
This underscores that the intensity and extent of UHIs are not uniformly distributed around a city, challenging the conventional notion of symmetrical temperature patterns which would likely manifest in a manner similar to the symmetrical ‘hypothetical act temp’ curve presented in Figure 3. Instead, the magnitude of the UHI effect is closely tied to the distance from the city center, influenced by the city’s geographic location and the prevailing climate zone. Factors such as land surface characteristics and urban morphology further shape the asymmetric nature of UHIs as seen in Rabat’s urban area, and their recognition is essential to accurately assess urban temperature dynamics. Even though Rabat is known for its well-maintained urban forests and irrigated lawns and gardens, its impervious surfaces resulted in this moderate increase of 0.2 °C added to its baseline surface temperature. This relatively restrained urban impact on surface temperature can be attributed to the city’s strong oceanic influence and its well-ventilated environment. The proximity to the Atlantic Ocean enhances air circulation, mitigating the heat retention typically associated with urban surfaces. In the city center, however, the simulated impervious surfaces’ temperature is 27.8 °C, or 0.5 °C higher than the actual temperature, suggesting that Rabat’s greenery plays a significant role in mitigating the city’s heating, regulating its climate through evapotranspiration cooling. In contrast, at the 10 km mark in the southeastern outskirts dominated by croplands that lie fallow during the dry summer season, the model-simulated vegetation and actual temperatures are virtually the same, indicating the absence of impervious surfaces.
To better assess the oceanic effect on the surface temperature structure in the metropolitan area of Rabat, we construct a cross-section along a transect parallel to the coastline (Figure 4). Since the effect of the ocean is practically homogeneous along this transect, the difference between the actual temperature, including the urban impervious areas’ temperature, and the vegetation-only temperature is directly attributable to the land cover characteristics. Similarly, differences between temperature in the city center and its surroundings are solely due to land surface characteristics.
Along this transect, Rabat exhibits unique land use characteristic as its surroundings remain predominantly impervious at approximately 10 km in both directions. This is due to the presence of the neighboring commuter cities of Salé to the NE and Temara to the SW. The actual temperature profile indicates that both of these commuter cities are warmer than Rabat’s center, suggesting a UHS at 10 km of less than 0.1 °C from the NE, and a UHS of approximately 0.1 °C from the SW. At the 30 km marks, the UHS is more significant with an amplitude of 0.2 °C to the NE and 0.3 °C from the SW. The vegetation-only temperature is slightly cooler than the actual temperature all along the transect with a maximum difference recorded in Rabat’s center, where the simulated impact of the ISA increased the baseline temperature by about 0.2 °C. The complexity of the temperature structure between the three cities of Temara, Rabat, and Salé and their rural immediate vicinities is further analyzed at a higher spatial resolution.
Neighborhood Level LST Analysis Across Rabat.
Land surface temperature (LST) data from a Landsat 5 scene captured on 16 July 2010 were used for analysis due to minimal cloud cover. Landsat 5 LSTs are originally captured at 120 m spatial resolution for the thermal band and commonly resampled to 30 m for analysis [35]. A 25 km southwest–northeast transect, crossing Rabat, Salé, and Témara, was selected to track the region’s architectural diversity. The transect provided 24 observations at 1 km intervals. A supervised maximum likelihood classification of land cover using a Landsat 7 image from the same day identified six classes: urban and built-up, water and wetland, mixed forest, bare land, cropland, and grassland. Accuracy was validated using historical Google Earth imagery, achieving an overall classification accuracy of 94%. Figure 5 shows the LST profile spanning from Rabat’s city center along a southwest–northeast transect crossing the cities of Salé and Temara.

Figure 5.
Spatial analysis of LST and land cover over Rabat’s metropolitan area. (A) Landsat 5-observed LST scene (30 m resolution) with the SW-NE transect crossing Temara, Rabat, and Salé over 24 data collection points spaced 1 km apart. (B) Study area land cover map with the same transect overlaid, showing the three cities’ urban expansion. (C) LST variation along the transect, annotated with the corresponding land cover type of each data collection point.
Average LSTs were computed using data points from the three cities, Temara (points 1–6), Rabat (points 7–17), and Salé (points 18–24) (Figure 5). The results, consistent with the trends simulated by the SiB2 model (Figure 4), indicate that Rabat exhibited a lower average LST of 37.1 °C, while both Temara and Salé recorded similar average LSTs of 38.5 °C. Notably, the LST values presented in the cross-sections in Figure 3 and Figure 4 represent modeled seasonal mean (day and night) surface temperatures, while the Landsat LSTs presented in Figure 5C reflect observed mid-morning acquisitions, which accounts for their higher readings compared to the seasonal means. Additionally, UHS phenomena were identified towards both the NE and SW edges of the transect, with LST differences of −4.0 °C and −3.3 °C, respectively, compared to Rabat city center’s LST. These findings indicate that, despite the moderating influence of the Atlantic Ocean on the LSTs for all the three cities, Rabat experienced lower urban heat. A key factor in this difference is the extensive amount of vegetation cover found in Rabat, including urban forests such as Dar Essalam and Ibn Sina, as well as numerous parks and irrigated lawns. In contrast, neighboring Salé and Temara have limited green infrastructure and higher population densities, driven by more affordable housing. Consequently, they experience elevated LSTs, which underscores the role of urban vegetation in moderating heat through shade provision, enhanced evapotranspiration, and improved microclimate regulation.
To better understand the effect caused by the different urban morphologies and land use patterns of different neighborhoods on LST changes, we analyze the latter over the transect covering the city of Rabat using data points 7–17 (Figure 5). The minimum temperature reads 35.7 °C and is recorded at the northernmost point number 17. This measurement point is in the Mellah neighborhood, predominantly residential, and characterized by a traditional architectural tissue, comprised of low-rise individual housing units, called Ryads which feature an open-roof area in the center of the house, hosting a vegetative cover, usually trees, playing the role of a traditional air conditioning system. Adding to that, the Mellah neighborhood is flanked by the Bouregreg River and the Atlantic corniche, two large water bodies whose proximity contributes to urban heat mitigation, resulting in the recorded minimum LST of 35.7 °C. In contrast, the maximum observed LST of 39.0 °C was recorded at the most southern periphery of the city (point 7), in barren lands separating Rabat and Temara.
Within Rabat, Hay Ryad neighborhood (points 8–10) recorded some of the highest observed LSTs. This neighborhood is formed by a diverse urban tissue, in the form of high-rise institutional and commercial buildings, administrative settings, and corporate headquarters. This concentration of anthropogenic activity and urban density explains why this district, serving as the vital economic hub of the capital, experiences elevated LSTs compared to the rest of the neighborhoods. Further north along the transect, Madinat Al Irfane neighborhood (points 11–12) showed a decrease in LSTs compared to Hay Ryad. As its name suggests, translating literally to “City of knowledge”, this district hosts the majority of Rabat’s academic institutions, with over ten public universities, and features some of the capital’s biggest medical centers. These types of buildings feature substantial green cover and exhibit lower urban density given their horizontal rather than vertical expansion, which justifies the moderate LSTs recorded in this neighborhood. Further north, Agdal neighborhood (points 13–15) recorded some of the lowest LSTs in Rabat, owing to the urban morphology which is mainly characterized by high-rise buildings acting as urban canyons whose shading contributes to mitigating accumulated heat. Agdal’s lower LSTs are further supported by the evapotranspiration cooling from the large adjacent Ibn Sina Urban Forest (Figure 5B). Further north is located the Hassan neighborhood (point 16). Reminiscent of the old colonial architectural influence, this district is known for its high-rise buildings and a high amount of irrigation-maintained green areas, and like Agdal, the urban canyon’s shading combined with the vegetation’s cooling play an essential role in maintaining a relatively moderate LST of 27.3 °C (Figure 5). Overall, this temperature profile indicated that neighborhoods with the highest green cover recorded lower LSTs, while busy commercial and economic centers hosting higher ISA densities and anthropogenic activity experienced warmer LSTs in Rabat. Additionally, this profile confirms that Salé and Temara are warmer than Rabat, highlighting the need for tailored urban policies to address the heat disparities observed across these three cities forming a metropolitan area.
3.1.2. Temperature Structure in Agadir
Located in west-central Morocco along the Atlantic Ocean, the city of Agadir features a semi-arid climate characterized by warm summers and mild winters. To assess its thermal environment, we conducted two cross-sectional profiles of LST: one oriented perpendicular to the Atlantic shore and another extending inland through the city, aligned parallel to the coastline.
The perpendicular cross-section extends westwards towards the Atlantic Ocean and eastwards through grasslands and croplands (Figure 6). The seafront temperature of 22.5 °C is significantly cooler than that of Agadir’s city center simulated at 28.7 °C, resulting in a pronounced UHI with an intensity of 6.1 °C. In contrast, a UHS of −0.6 °C is noted to the east, where grasslands and fallow croplands dominate the landscape. The city’s irrigated green cover contributes to localized cooling over the urban area, while the simulated surface temperature continues to gradually increase eastwards as one gets further away from the coastline, to reach 30.8 °C at the transect’s edge at around 30 km.
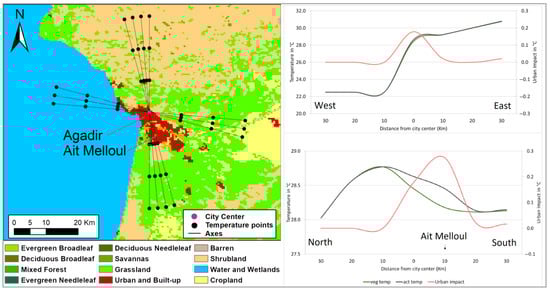
Figure 6.
Same as Figure 3, except for simulated surface temperature cross-sections along two transects: a west–east transect perpendicular to the shore, and a north–south transect parallel to it, crossing the city of Agadir.
The cross-section parallel to the coastline spans 30 km from Agadir’s city center, extending northwards through grasslands and shrublands and southwards through the commuter city of Ait Melloul, before continuing through grasslands (Figure 6). Agadir’s city center recorded a surface temperature of 28.7 °C, marking a UHS of −0.1 °C from the northern rural vicinity around 10 km, and a UHI of 0.5 °C to the southern rural lands, at around 20 km.
Similar to the coastal city of Rabat, the urban expansion continues encroaching towards the south of Agadir. The urban impact on surface temperature is clearly marked over the center of the commuter city of Ait Melloul with a peak of approximately 0.3 °C, higher than that of 0.2 °C simulated in Agadir’s city center (Figure 6). Ait Melloul is noted for its comparatively lower housing costs, which translates to a higher density of impervious surfaces at the expense of urban greenery. The interplay of these factors, confirmed in Figure 7, leads to the higher urban impact on surface temperature recorded in Ait Melloul.
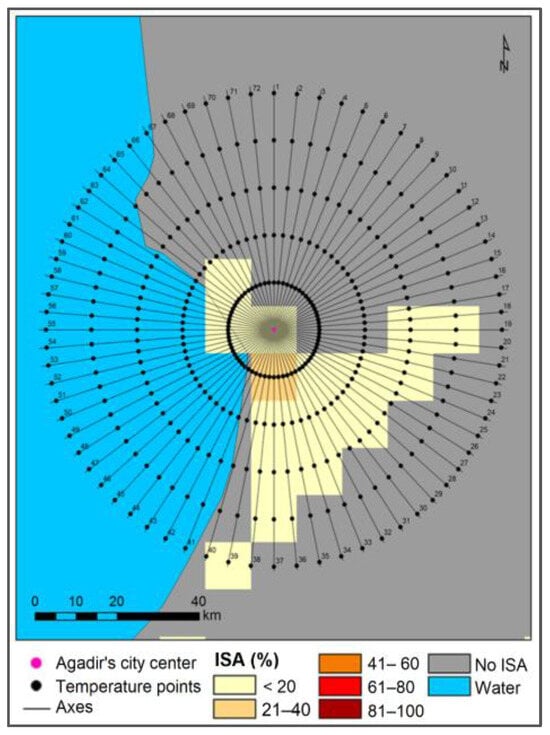
Figure 7.
Impervious surface area distribution over the cities of Agadir and Ait Melloul.
In their study of the UHI effect across several Moroccan cities during the vegetative growing season, Fathi et al. (2019) [36] found a daytime UHI amplitude of 1.1 °C and a nighttime UHI amplitude of 0.8 °C in Agadir. For Ait Melloul, the study found a daytime UHS amplitude of −0.3 °C and a nighttime UHI amplitude of 0.5 °C. These findings show how inter-seasonal variability can affect the UHI and UHS, as during the growing season in this region, usually occurring during the months from November to March, the surrounding rural areas benefit from moderate insolation and mild precipitations, optimizing the vegetation cover’s density. This means that the presence of higher evapotranspiration cooling correlates with the UHI effects noted by [36]. In contrast, during the dry summer months (JJA), the lack of precipitation and the absence of irrigation contribute to elevated rural area temperatures, thus leading to the formation of the UHS observed in our results. Further contributing to the observed UHS in coastal cities are the coastal oceanic breezes. These thermally driven circulations occur as warmer land heats up during the day, drawing cooler, more humid air from the ocean inland, directly lowering urban air temperatures through advection. Indeed, while sea breezes provide some cooling to the surrounding rural areas, the effect is often more pronounced and sustained within the urban environment due to the urban area’s greater thermal mass (slower heating/cooling of materials) and the channeling effect of urban canyons which can enhance turbulent mixing and ventilation, particularly in the immediate coastal zone [36]. This differential cooling, where the urban area benefits disproportionately from the incoming cool air compared to the intensely heated, dry rural surroundings, facilitates the observed UHS phenomena in coastal environments like those of Agadir, Rabat, and Casablanca.
3.1.3. Temperature Structure in Casablanca
The city of Casablanca is the largest and most populated urban center acting as the economic capital of Morocco [37]. The city is located along the Atlantic Ocean approximately 100 km south of Rabat (Figure 1). They share a similar Mediterranean climate, influenced by the ocean’s proximity. Two cross-section analyses were conducted: one traversing the city center in a northwest–southeast direction, perpendicular to the coastline, and a second quasi-parallel to the shore (Figure 8).
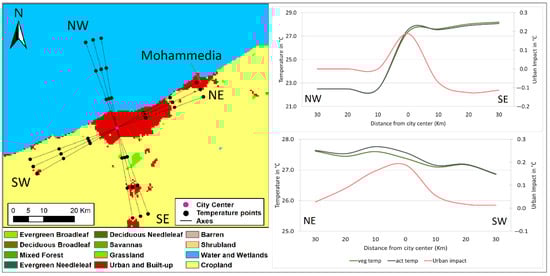
Figure 8.
Same as Figure 3, except for simulated surface temperature cross-sections along two transects: a NW-SE transect perpendicular to the shore and a NE-SW transect parallel to it, crossing the city of Casablanca.
Similar to the perpendicular cross-sections of Rabat and Agadir, Casablanca’s one (Figure 8) clearly captures the difference in temperatures between the city and the Atlantic Ocean, as the seafront temperature of 22.5 °C sharply contrasts the 27.6 °C of the city center. Overland and at around 10 km southeast of Casablanca, the simulated surface temperature in the rural vicinity stayed relatively constant at around 27.6 °C, before initiating a slow increase along the transect to reach the value of 28.1 °C around 30 km southeast of the city. Our findings corroborate those of [38], who analyzed observed data and identified comparable UHI and UHS effects in the city of Casablanca. Nevertheless, the amplitudes in our study diverge from theirs, a discrepancy largely attributable to our use of simulated seasonal averages rather than specific daily temperature measurements as employed by [39].
The second temperature profile is defined by quadrants crossing the city in a northeast–southwest direction, quasi-parallel to the shore and ensuring the oceanic influence is about the same all along the transect. The simulated surface temperature remained relatively constant with slight fluctuations around the city center’s value of 27.5 °C, mainly due to changes in ISA density within the city (Figure 8). At approximately 10 km towards the northeast, the ISA expansion dominates and the temperature reaches a maximum of 27.8 °C. Further north around 20 km, the ISA tapers off at the city’s boundaries and where rural areas begin, where the profile shows a slight decrease in surface temperature compared to the city center. Beyond these rural areas, approximately 30 km to the northeast, the temperature rises slightly, returning to around 27.5 °C—comparable to that observed in the city center. At this distance, Figure 8 shows that the data points overlap with the city of Mohammedia, which functions as a commuter hub for Casablanca and exhibits a similar surface temperature despite its smaller size. The southeastern side of the transect extends over rural areas where fallow croplands dominate the landscape and exhibit a temperature of 27.2 °C, indicating the existence of a UHS with an intensity of 0.4 °C.
Other studies have documented the UHI effect in Casablanca. For example, Ref. [39] analyzed the UHI in Casablanca using Landsat data from specific days of the year, rather than covering the entire season as is the case for our study. They indicated a strong correlation between UHI amplitude and vegetation cover, where areas with more greenery experienced LSTs. On the other hand, the study by [40] on UHI patterns in Casablanca utilized Landsat data by comparing LST observations and found that during summer, heat islands emerged in rural areas, while cool islands appeared in urban areas, similar to what was found in our parallel cross-section. Another study [36] analyzed UHI amplitude in Casablanca using MODIS LST data for the year 2013, comparing urban and rural temperatures during the vegetation growing season. The study found that Casablanca’s daytime UHI amplitude was around 2 °C, while the nighttime amplitude was 2.1 °C. Combined, these results suggest that despite the moderating role of the ocean on LST changes, making them relatively small, localized land characteristics still play an important role in shaping the temperature structure.
3.1.4. Temperature Structure in Dakhla
Dakhla is situated on a narrow peninsula in the south of the country, stretching into the Atlantic Ocean (Figure 9). The city boasts a combination of desert landscapes and extensive oceanic surroundings, with an arid climate featuring hot, dry conditions, and a mild temperature range moderated by the oceanic breeze. A NE-SW cross-section analysis was performed to highlight the peninsula effect, along with a second NW-SE cross-section that captures the juxtaposition of the desert and the sea, illustrating the unique geographic and climatic characteristics present therein.
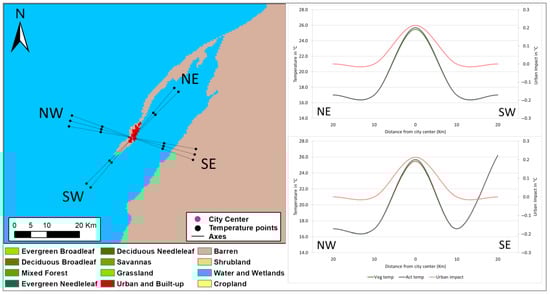
Figure 9.
Same for Figure 3, except for simulated surface temperature cross-sections along two transects: a NE-SW transect highlighting the peninsula geography and a NW-SE transect crossing the city of Dakhla.
The NE-SW cross-section spans 20 km from Dakhla’s city center towards the Atlantic Ocean in both directions, and shows a perfectly symmetrical and pronounced UHI with an amplitude of 8.7 °C (Figure 9). The city center temperature of 25.7 °C neatly contrasts with the 17.0 °C ocean surface temperature. In this context, Dakhla’s unique peninsular geography and arid climate led to the formation of a quasi-perfect UHI with high amplitude indicative of the ISA’s capacity to absorb and retain heat compared to large water bodies, while the region’s arid environment, marked with high insolation and minimum vegetation, amplifies the UHI amplitude. However, and in line with other coastal cities, the urban impact on surface temperature at the city center is of 0.2 °C. This represents the additional increase in temperature due solely to the presence of the ISA in the peninsula, and shows that while the surrounding oceanic breezes provide a moderating influence, their cooling effect is overshadowed by the high thermal absorption capacity of Dakhla’s urban surfaces.
The NW-SE transect extends northwest towards the Atlantic seafront and southeast into the barren Sahara Desert (Figure 9). Similar to the first cross-section, the strong UHI of 8.7 °C is observed between the city and the surrounding oceanic water within the 10 km radius. However, further southeast over the desert, the simulated temperature is 26.2 °C, higher by 0.5 °C than that of the city center. This horizontal temperature gradient suggests that at these latitudes, the urban surface temperature is not much different from that of the desert despite the ocean’s influence. The thermal structure of the city of Dakhla is complex, as when compared to the surrounding oceanic water, it forms a perfect UHI; however, when the comparison is extended to the mainland desert, an urban heat sink becomes apparent.
3.2. Case of Inland Cities
3.2.1. Temperature Structure in Marrakech
Located at the northern foothills of the High Atlas Mountains chain, Marrakech is characterized by a semi-arid climate, and experiences hot, dry conditions with pronounced diurnal temperature contrasts and irregular rainfall confined primarily to the winter months. Two temperature cross-sections were conducted: one oriented north–south and a second east–west.
The first cross-section extends northward into shrub and barren lands and southward into the grasslands of the Atlas Mountains (Figure 10). Marrakech’s urban core recorded a simulated surface temperature of 30.4 °C, with an urban-induced increase in the city center of 0.2 °C. UHI effects are noted at 10 km north and south of the city, where the landscape is mainly comprised of shrublands, with respective amplitudes of 0.2 °C and 0.1 °C. A sharp decrease in temperature is observed further south of Marrakech, primarily driven by elevation change, which nearly doubles from around 450 m in the city to approximately 850 m at 30 km to the south (Figure 10). This decrease in temperature is also partly attributed to evapotranspiration cooling from irrigated agriculture in the Atlas Mountains, where snowmelt from higher elevations increases soil moisture and enhances agricultural productivity throughout the year. Towards the northern direction, a noticeable dip in surface temperature occurs at around 20 km distance, where temperatures drop to 29.6 °C over the northern grasslands. Further north, temperature rises again at the transect’s edge but remains lower than that of the city center.
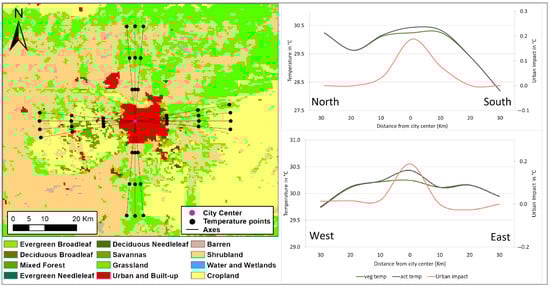
Figure 10.
Same as Figure 3, except for simulated surface temperature cross-sections along a north–south transect and a west–east transect crossing the city of Marrakech.
The parallel cross-section expands westwards through a rural landscape comprised of a merge of croplands, shrublands, and mixed tree cover (10–20 kms) (Figure 10). This blend of vegetative cover, which is maintained through irrigation during the summer season [41], growing mostly subsistence crops, exhibits lower temperatures than that of the city, forming a slight UHI with a 0.2 °C amplitude. Eastwards, the transect spans mainly through rural croplands and grasslands past the 10 km mark, and at 10 km distance, the temperature profile reveals a second UHI of 0.6° C, further confirming that Marrakech city is warmer than all its rural surroundings in all four cardinal directions. In line with our findings, the study conducted by [36] to assess the UHI effect during the growing season found that Marrakech had a daytime UHI amplitude of 0.8 °C dropping at nighttime to 0.7 °C, with both amplitudes being some of the lowest found in the urban areas studied, which was attributed to the surrounding sparse vegetation and predominated agricultural use of the adjacent rural areas. On the other hand, Ref. [42] examined the UHI effect in the city, using mid-day air temperature measurements and humidity data, highlighting a maximum mean temperature difference that reached around 3.9 °C between various neighborhoods within the city. The latter study underscored that while vegetation helps reduce UHI amplitudes, large bare areas in arid regions like Marrakech play an opposite role in this dynamic, increasing daytime LSTs.
3.2.2. Temperature Structure in Errachidia
Errachidia is a gateway to the Sahara Desert and is located in eastern central Morocco. The city is bordered by the desert to the east and south and is characterized by a year-round arid climate, with extremely dry hot summers, and cool winters. Figure 11 shows the temperature profiles crossing the city.
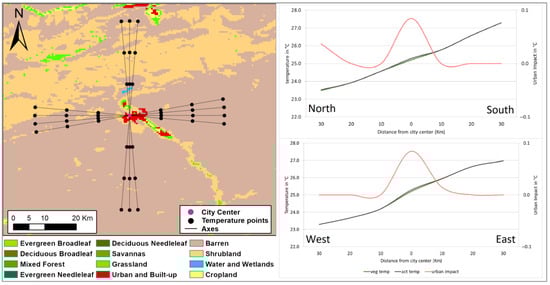
Figure 11.
Same for Figure 3, except for simulated surface temperature cross-sections along a north–south transect and a west–east transect crossing the city of Errachidia.
This temperature profile reveals distinct thermal patterns across Errachidia’s landscape. In the city center, the simulated surface temperature is 25.3 °C. A continuously increasing horizontal temperature gradient is simulated from north to south and from west to east. These contrasting effects can be clearly linked to the influence of changing land cover characteristics. Unlike Dakhla, which experiences a similar arid climate but benefits from the Ocean’s moderating influence, Errachidia’s landlocked location adjacent to the Sahara Desert results in more extreme temperature variations.
The urban impact on surface temperature illustrated by the pink curve reads around 0.1 °C in the city center (Figure 11), which is the lowest among the studied cities, largely due to the scarcity of vegetation within the city and the high temperature and water stresses that it undergoes during the summer daytime. In turn, the shrublands to the north and west do show cooler temperatures compared to the city center. Although sparse in their nature, these local shrublands are adapted to local climate and are mostly C4 plants composed of Alpha (Panicum turgidum) and Atriplex (Atriplex halimus). These species are native to the desert and are more water efficient and drought resistant as they assimilate about double the amount of carbon compared with a C3 plant for the same amount of water. The particularities of these plants located in the northern and western regions of Errachidia help maintain the UHI structure observed in these directions. Conversely, the barren desert to the south and east gets much warmer than the city core under the long periods of insolation during the summer, and in the absence of any heat mitigation mechanism, pronounced UHSs are observed. These findings align with previous research on arid regions’ urban heat structures, which document the existence of UHSs in cities built in desert environments [28,43].
3.2.3. Temperature Structure in Oujda
The city of Oujda is located in northeastern Morocco and the Atlas Mountains extend across its southwestern boundary. Oujda’s climate exhibits characteristics of both a Mediterranean and semi-arid climate, with hot, dry summers and significant diurnal temperature fluctuations, with sporadic rainfall occurring mainly in the winter months.
The city of Oujda has an almost circular shape and is surrounded by grasslands to the south and cropland to the north (Figure 12). However, our summer seasonal analysis precludes the existence of croplands as these are usually left fallow, except when irrigated. On the southern edge of the city lays an elevated terrain hosting the Sidi Mafaa forest. In this region, the predominant grassland vegetation exhibits significantly cooler surface temperatures compared to the fallow croplands north of the city. This temperature contrast is largely attributable to surface characteristics: the dry, dark fallow lands absorb more solar radiation, whereas the greener, vegetated areas in the south reflect more sunlight and benefit from evapotranspiration cooling, resulting in the simulated lower surface temperatures. This causes the temperature to decrease from north to south of the transect by about 2 °C within a radius of 30 km from the city center. A UHS is observed near the northern periphery, around 10 km from the city center, with an amplitude of −0.2 °C, and a UHI of 0.6 °C appears towards the southern outskirts, while in both directions, the amplitude of these effects increases progressively with distance along the transect. The west–east transect reveals that Oujda is consistently warmer than its immediate surrounding at a 10 km distance, with UHI effects extending in both directions and reaching amplitudes of approximately 0.3 °C. Among all urban areas analyzed, the city of Oujda exhibited the most pronounced impact of urbanization on surface temperature reaching 0.4 °C. Indeed, the impervious surfaces’ temperature in Oujda’s center was about 29.1 °C, which is 1.5 °C higher than that of the vegetation found in the city, a phenomenon driven by its unique climatic and urban morphological conditions. Unlike vertically dense cities where building shadows can mitigate surface heating, Oujda’s predominantly horizontal urban expansion maximizes exposure to solar radiation, increasing heat storage in extensive impervious cover. This sprawl pattern—coupled with the city’s semi-arid setting, reliance on ground-level irrigation without compensatory tree canopy, and widespread use of low-albedo materials—creates a thermal dipole between irrigated green zones and unshaded built surfaces.
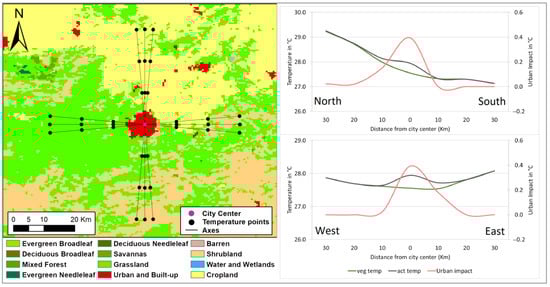
Figure 12.
Same for Figure 3, except for simulated surface temperature cross-sections along a north–south and a west–east transect crossing the city of Oujda.
3.3. Inter-City Comparison
Studying the thermal structure of the seven selected cities sheds light on important insights regarding summer urban heat patterns in Morocco. When compared to maritime boundaries, coastal cities exhibited substantially strong UHI effects with an average amplitude of 6.18 ± 1.54 °C, underscoring how aquatic and terrestrial lands have different capacities to capture and retain heat, but more importantly, the role played by the Atlantic Ocean in shaping their thermal structure. Limited surface temperature differences were noted between urban areas and their surrounding rural landscape, suggesting that the effect of impervious surfaces is predominantly shadowed by the proximity to a large water body in the form of the ocean, and its related positive consequences on urban vegetation and heat dispersal. In contrast, during Morocco’s hot and dry summer, urban vegetation in inland cities suffers from reduced soil moisture, transpiration, and high hydrological stress, which contributes to reduced UHI amplitudes, or the manifestation of UHS effects.
Out of the seven urban areas examined, Marrakech stood out as the only one where UHI effects were consistently observed across the surrounding rural areas located in the four cardinal directions. This is partly explained by the presence of large irrigated cropland perimeters in the immediate rural surroundings, where healthy vegetation moderates surface temperature through shading and evapotranspiration cooling, keeping a fresher surface temperature compared to that of the city’s impervious surfaces which retain heat more effectively.
The impervious surfaces’ effect on surface temperature was found to be the highest in the city of Oujda. This is mainly due to Oujda’s compact core, where its concentrated ISA expands more horizontally, and limited urban vegetation produces sharp microclimatic gradients. Comparatively, other cities exhibited dampened thermal contrasts due to reasons such as coastal moderation or vertical building development (especially in the cases of Rabat, Casablanca, and Marrakech) offering more shading through urban canyons. This highlights how the urban growth trajectory can either exacerbate or mitigate surface temperature and heating caused by impervious surfaces.
Commuter urban agglomerations such as Salé and Temara near Rabat, Mohammedia near Casablanca, and Ait Melloul near Agadir provide more affordable housing compared to the main nearby urban centers. On the ground, this leads to more impervious surfaces at the expense of urban vegetation, in a clear contrast with the metropoles where economic sectors such as tourism warrant stricter urban planning policies that incorporate and enforce the inclusion of higher urban greenery. Consequently, and as highlighted in our results, commuter cities exhibited either similar or higher surface temperatures during the summer, a pattern consistent across the country. In these areas, the lack of urban parks and gardens in favor of a higher ISA and population densities exacerbates the vulnerability to thermal discomfort and associated health risks for residents. This makes addressing this issue a priority for urban planners, whose intervention becomes a must to put commuter cities on a sustainable development path that incorporates mitigating UHI effects through proactive urban vegetation expansion.
4. Concluding Remarks
Our analysis underscores the complex nexus between urbanization, geography, and environmental sustainability in Morocco, revealing critical spatial disparities in UHI dynamics and their cascading socio-ecological impacts. Morocco’s most fertile agricultural plains lie directly beside rapidly expanding urban agglomerations concentrated in the northwest of the country, like Casablanca, Tangier, and Marrakech, which results in encroachment on prime cropland and natural habitats triggering arable-land loss, ecosystem disruption, increased runoff and pollution, and accelerated soil erosion. These findings highlight an urgent imperative to reframe urban planning as a multisector endeavor that balances growth with resource stewardship.
To mitigate these challenges, spatially tailored UHI interventions such as irrigated buffers, shade networks, and green infrastructure must be prioritized to enhance thermal equity across varied urban typologies. Second, robust regulatory frameworks are needed to curb sprawl, protect ecological zones, and incentivize compact, resource-efficient urban design. By embedding urban climate resilience into land-use policies and leveraging synergies between thermal mitigation and agricultural preservation. More attention must be directed towards satellite cities such as Salé and Ait Melloul, found to experience higher ISAs and LSTs. Promoting green space ratio frameworks, validated globally for their environmental and socio-economic benefits, can help mitigate thermal disparities. In the Moroccan context, such frameworks should incorporate native planting considerations and explore community stewardship programs to support sustainability and social engagement. Green roofing initiatives also present a valuable opportunity, especially where private gardens are limited, as is often the case in lower-income urban areas. Such integrative approaches will not only alleviate immediate heat risks but also fortify the nation’s efforts against climatic pressures.
Additionally, future work could extend this analysis by deploying high-resolution remote-sensing and urban-scale climate modeling to evaluate the long-term effectiveness of potential greening strategies, assess socio-economic trade-offs, and explore nature-based solutions tailored to the country’s varied climatic zones. Such integrative research will be essential for guiding evidence-based policy and ensuring equitable, livable, and productive urban futures.
Author Contributions
Conceptualization, M.A.L., L.B., N.E.-d. and M.Y.K.; methodology, M.A.L. and L.B.; software, M.A.L. and L.B.; validation, M.A.L. and L.B.; formal analysis, M.A.L. and L.B.; investigation, M.A.L.; resources M.A.L. and L.B.; data curation, M.A.L. and L.B.; writing—original draft preparation, M.A.L. and L.B.; writing—review and editing, M.A.L., L.B., N.E.-d. and M.Y.K.; visualization, M.A.L.; supervision, M.A.L. and L.B.; project administration, M.A.L., L.B., N.E.-d. and M.Y.K.; funding acquisition, M.A.L. and L.B. All authors have read and agreed to the published version of the manuscript.
Funding
This work was carried out with the support of the Moroccan National Center for Scientific and Technical Research (CNRST) under the PhD-Associate Scholarship—PASS Program.
Data Availability Statement
Data from this study are available on request from the authors.
Conflicts of Interest
The authors declare no conflict of interest.
References
- Chestnut, L.G.; Breffle, W.S.; Smith, J.B.; Kalkstein, L.S. Analysis of Differences in Hot-Weather-Related Mortality across 44 U.S. Metropolitan Areas. Environ. Sci. Policy 1998, 1, 59–70. [Google Scholar] [CrossRef]
- Carnahan, W.H.; Larson, R.C. An Analysis of an Urban Heat Sink. Remote Sens. Environ. 1990, 33, 65–71. [Google Scholar] [CrossRef]
- Imhoff, M.L.; Zhang, P.; Wolfe, R.E.; Bounoua, L. Remote Sensing of the Urban Heat Island Effect across Biomes in the Continental USA. Remote Sens. Environ. 2010, 114, 504–513. [Google Scholar] [CrossRef]
- Mohajerani, A.; Bakaric, J.; Jeffrey-Bailey, T. The Urban Heat Island Effect, Its Causes, and Mitigation, with Reference to the Thermal Properties of Asphalt Concrete. J. Environ. Manag. 2017, 197, 522–538. [Google Scholar] [CrossRef] [PubMed]
- Smithers, R.J.; Doick, K.J.; Burton, A.; Sibille, R.; Steinbach, D.; Harris, R.; Groves, L.; Blicharska, M. Comparing the Relative Abilities of Tree Species to Cool the Urban Environment. Urban Ecosyst. 2018, 21, 851–862. [Google Scholar] [CrossRef]
- Saranaathan, V.; Firoz, A.; Sridhar, K.; Govindaraju, M. Comprehensive Analysis of Urban Heat Island and Climate Change Impact on the Environment—An Overview. J. Basic Sci. 2024, 24, 326–334. [Google Scholar]
- Steeneveld, G.J.; Koopmans, S.; Heusinkveld, B.G.; van Hove, L.W.A.; Holtslag, A.A.M. Quantifying Urban Heat Island Effects and Human Comfort for Cities of Variable Size and Urban Morphology in the Netherlands. J. Geophys. Res. Atmos. 2011, 116, D20129. [Google Scholar] [CrossRef]
- Mohan, M.; Kikegawa, Y.; Gurjar, B.R.; Bhati, S.; Kolli, N.R. Assessment of Urban Heat Island Effect for Different Land Use–Land Cover from Micrometeorological Measurements and Remote Sensing Data for Megacity Delhi. Theor. Appl. Clim. 2013, 112, 647–658. [Google Scholar] [CrossRef]
- Ghous, M.; Khalida, K.; Basit, A.; Ougahi, J. Temporal analysis of urbanization and resulting local weather change: A case study of Lahore, Punjab, Pakistan. Sci. Int. 2015, 27, 1281–1287. [Google Scholar]
- Gherraz, H.; Guechi, I.; Alkama, D. Quantifying the Effects of Spatial Patterns of Green Spaces on Urban Climate and Urban Heat Island in a Semi-Arid Climate. Bull. Soc. R. Sci. Liege 2020, 89, 164–185. [Google Scholar] [CrossRef]
- Founda, D.; Santamouris, M. Synergies between Urban Heat Island and Heat Waves in Athens (Greece), during an Extremely Hot Summer (2012). Sci. Rep. 2017, 7, 10973. [Google Scholar] [CrossRef]
- Zhao, L.; Oppenheimer, M.; Zhu, Q.; Baldwin, J.W.; Ebi, K.L.; Bou-Zeid, E.; Guan, K.; Liu, X. Interactions between Urban Heat Islands and Heat Waves. Environ. Res. Lett. 2018, 13, 034003. [Google Scholar] [CrossRef]
- Bounoua, L.; Thome, K.; Nigro, J. Cities Exacerbate Climate Warming. Urban Sci. 2021, 5, 27. [Google Scholar] [CrossRef]
- Koomen, E.; Diogo, V. Assessing Potential Future Urban Heat Island Patterns Following Climate Scenarios, Socio-Economic Developments and Spatial Planning Strategies. Mitig. Adapt. Strateg. Glob. Change 2017, 22, 287–306. [Google Scholar] [CrossRef]
- Ahmed, S. Assessment of Urban Heat Islands and Impact of Climate Change on Socioeconomic over Suez Governorate Using Remote Sensing and GIS Techniques. Egypt. J. Remote Sens. Space Sci. 2018, 21, 15–25. [Google Scholar] [CrossRef]
- Hong, J.-W.; Hong, J.; Kwon, E.E.; Yoon, D.K. Temporal Dynamics of Urban Heat Island Correlated with the Socio-Economic Development over the Past Half-Century in Seoul, Korea. Environ. Pollut. 2019, 254, 112934. [Google Scholar] [CrossRef]
- Oke, T.R. The Energetic Basis of the Urban Heat Island. Quart. J. R. Meteorol. Soc. 1982, 108, 1–24. [Google Scholar] [CrossRef]
- Roth, M. Review of Urban Climate Research in (Sub)Tropical Regions. Int. J. Climatol. 2007, 27, 1859–1873. [Google Scholar] [CrossRef]
- Rajagopalan, P.; Lim, K.C.; Jamei, E. Urban Heat Island and Wind Flow Characteristics of a Tropical City. Sol. Energy 2014, 107, 159–170. [Google Scholar] [CrossRef]
- Tiafack, O.; Prisca, N.; Dian, T. Understanding Urban Growth through Heat Islands Using Remotely Sensed Data: Yaounde Case Study, Cameroon. Curr. Urban Stud. 2022, 10, 163–187. [Google Scholar] [CrossRef]
- Simwanda, M.; Ranagalage, M.; Estoque, R.C.; Murayama, Y. Spatial Analysis of Surface Urban Heat Islands in Four Rapidly Growing African Cities. Remote Sens. 2019, 11, 1645. [Google Scholar] [CrossRef]
- Isioye, O.A.; Ikwueze, H.U.; Akomolafe, E.A. Urban Heat Island Effects and Thermal Comfort in Abuja Municipal Area Council of Nigeria. FUTY J. Environ. 2020, 14, 19–34. [Google Scholar]
- Haut Commissariat au Plan (HCP). Indicateurs Recensement général RGPH, Taux d’urbanisation; Site institutionnel du Haut-Commissariat au Plan du Royaume du Maroc: Rabat, Morocco, 2024; Available online: https://www.hcp.ma/Taux-d-urbanisation_a3243.html (accessed on 23 December 2024).
- Bounoua, L.; Nigro, J.; Zhang, P.; Thome, K.; Lachir, A. Mapping Urbanization in the United States from 2001 to 2011. Appl. Geogr. 2018, 90, 123–133. [Google Scholar] [CrossRef]
- Tilton, J.C.; De Colstoun, E.B.; Wolfe, R.E.; Tan, B.; Huang, C. Generating Ground Reference Data for a Global Impervious Surface Survey. In Proceedings of the 2012 IEEE International Geoscience and Remote Sensing Symposium, Munich, Germany, 22–27 July 2012; IEEE: Munich, Germany, 2012; pp. 5993–5996. [Google Scholar] [CrossRef]
- Friedl, M.; Sulla-Menashe, D. MODIS/Terra+Aqua Land Cover Type Yearly L3 Global 500 m SIN Grid. SIN Grid V061. 2022. Available online: https://lpdaac.usgs.gov/products/mcd12q1v061/ (accessed on 28 August 2024). [CrossRef]
- Sellers, P.J.; Randall, D.A.; Collatz, G.J.; Berry, J.A.; Field, C.B.; Dazlich, D.A.; Zhang, C.; Collelo, G.D.; Bounoua, L. A Revised Land Surface Parameterization (SiB2) for Atmospheric GCMS. Part I: Model Formulation. J. Clim. 1996, 9, 676–705. [Google Scholar] [CrossRef]
- Bounoua, L.; Safia, A.; Masek, J.; Peters-Lidard, C.; Imhoff, M.L. Impact of Urban Growth on Surface Climate: A Case Study in Oran, Algeria. J. Clim. 2009, 48, 217–231. [Google Scholar] [CrossRef]
- Collatz, G.J.; Ribas-Carbo, M.; Berry, J.A. Coupled Photosynthesis-Stomatal Conductance Model for Leaves of C4 Plants. Funct. Plant Biol. 1992, 19, 519–538. [Google Scholar] [CrossRef]
- Zhang, C.; Dazlich, D.A.; Randall, D.A.; Sellers, P.J.; Denning, A.S. Calculation of the Global Land Surface Energy, Water and CO2 Fluxes with an off-line Version of SiB2. J. Geophys. Res. Atmos. 1996, 101, 19061–19075. [Google Scholar] [CrossRef]
- Denning, A.S.; Collatz, G.J.; Zhang, C.; Randall, D.A.; Berry, J.A.; Sellers, P.J.; Colell0, G.D.; Dazlich, D.A. Simulations of Terrestrial Carbon Metabolism and Atmospheric CO2 in a General Circulation Model, Part 1: Surface Carbon Fluxes. Tellus B Chem. Phys. Meteorol. 1996, 48, 521–542. [Google Scholar] [CrossRef]
- Denning, A.S.; Randall, D.A.; Collatz, G.J.; Sellers, P.J. Simulations of Terrestrial Carbon Metabolism and Atmospheric CO2 in a General Circulation Model, Part 2: Simulated CO2 Concentrations. Tellus B Chem. Phys. Meteorol. 1996, 48, 543–567. [Google Scholar] [CrossRef][Green Version]
- Al-Hamdan, M.Z.; Quattrochi, D.A.; Bounoua, L.; Lachir, A.; Zhang, P. Using Landsat, MODIS, and a Biophysical Model to Evaluate LST in Urban Centers. Remote Sens. 2016, 8, 952. [Google Scholar] [CrossRef]
- Gelaro, R.; McCarty, W.; Suárez, M.J.; Todling, R.; Molod, A.; Takacs, L.; Randles, C.A.; Darmenov, A.; Bosilovich, M.G.; Reichle, R.; et al. The Modern-Era Retrospective Analysis for Research and Applications, Version 2 (MERRA-2). J. Clim. 2017, 30, 5419–5454. [Google Scholar] [CrossRef] [PubMed]
- Parastatidis, D.; Mitraka, Z.; Chrysoulakis, N.; Abrams, M. Online Global Land Surface Temperature Estimation from Landsat. Remote Sens. 2017, 9, 1208. [Google Scholar] [CrossRef]
- Fathi, N.; Bounoua, L.; Messouli, M. A Satellite Assessment of the Urban Heat Island in Morocco. Can. J. Remote Sens. 2019, 45, 26–41. [Google Scholar] [CrossRef]
- Haut Commissariat au Plan (HCP). Population Legale du Royaume du Maroc Répartie par Régions, Provinces et Préfectures et Communes Selon les Résultats du Recensement Général de la Population et de L’habitat 2024; Site institutionnel du Haut-Commissariat au Plan du Royaume du Maroc: Rabat, Marocco; Available online: https://www.hcp.ma/Population-legale-du-Royaume-du-Maroc-repartie-par-regions-provinces-et-prefectures-et-communes-selon-les-resultats-du_a3974.html (accessed on 1 December 2024).
- El Ghazouani, L.; Bounoua, L.; Nigro, J.; Mansour, M.; Radoine, H.; Souidi, H. Combining Satellite Data and Spatial Analysis to Assess the UHI Amplitude and Structure within Urban Areas: The Case of Moroccan Cities. Urban Sci. 2021, 5, 67. [Google Scholar] [CrossRef]
- Azmi, R.; Saadane, A.; Kacimi, I. Estimation of Spatial Distribution and Temporal Variability of Land Surface Temperature over Casablanca and the Surroundings of the City Using Different Landat Satellite Sensor Type (TM, ETM+ and OLI). Int. J. Innov. Appl. Stud. 2015, 11, 49–57. [Google Scholar]
- Bahi, H.; Rhinane, H.; Bensalmia, A.; Fehrenbach, U.; Scherer, D. Effects of Urbanization and Seasonal Cycle on the Surface Urban Heat Island Patterns in the Coastal Growing Cities: A Case Study of Casablanca, Morocco. Remote Sens. 2016, 8, 829. [Google Scholar] [CrossRef]
- Centre Royal de Télédétection Spatiale (CRTS). Cartographie des Cultures Irriguees et Suivi de leur Evolution a Partir des Images Satellite; Centre Royal de Télédétection Spatiale: Rabat, Morocco, 2014. Available online: https://crts.gov.ma/files/Rapport_final_cartograhie_irrigation_nationale.pdf (accessed on 25 December 2024).
- Gourfi, A.; Taïbi, A.N.; Salhi, S.; Hannani, M.E.; Boujrouf, S. The Surface Urban Heat Island and Key Mitigation Factors in Arid Climate Cities, Case of Marrakesh, Morocco. Remote Sens. 2022, 14, 3935. [Google Scholar] [CrossRef]
- Shepherd, J.M. Evidence of Urban-Induced Precipitation Variability in Arid Climate Regimes. J. Arid. Environ. 2006, 67, 607–628. [Google Scholar] [CrossRef]
Disclaimer/Publisher’s Note: The statements, opinions and data contained in all publications are solely those of the individual author(s) and contributor(s) and not of MDPI and/or the editor(s). MDPI and/or the editor(s) disclaim responsibility for any injury to people or property resulting from any ideas, methods, instructions or products referred to in the content. |
© 2025 by the authors. Licensee MDPI, Basel, Switzerland. This article is an open access article distributed under the terms and conditions of the Creative Commons Attribution (CC BY) license (https://creativecommons.org/licenses/by/4.0/).