1. Introduction
The ecological environment is defined as “the quantity and quality of water resources, land resources, biological resources, and climate resources that affect human survival and development” [
1]. Essentially, it is a dynamically coupled system formed by the interaction between natural elements and human social activities. The interconnected dynamics of aquatic–terrestrial–biotic–atmospheric systems create synergistic feedback mechanisms [
2], where localized modifications in specific elements cascade into systemic consequences spanning natural ecosystems and human socioeconomic systems [
3]. Ecological environmental quality, as one of the crucial manifestations of the ecological environment, serves as a key indicator for measuring regional sustainable development capacity [
4], providing reliable foundations for formulating regional socioeconomic sustainable development policies [
5]. Natural environmental changes and human socioeconomic activities exert profound impacts on ecological environmental quality, where phenomena like climate warming, land use changes driven by rapid urbanization, and soil erosion may exacerbate environmental degradation [
6,
7,
8,
9,
10]. These global environmental pressures manifest in accelerating glacier retreat [
11], biodiversity homogenization [
12], and heavy metal enrichment in soils across diverse ecosystems [
13], forming interconnected environmental challenges that demand coordinated international responses. As a proactive contributor to global sustainability, China’s approach demonstrates significant governance efficacy through continuously advancing ecological civilization initiatives and establishing comprehensive environmental governance systems to address these severe challenges. From the Grain-for-Green Project to the integrated protection and restoration of mountains, rivers, forests, farmlands, lakes, grasslands, and deserts [
14], and from environmental supervision to the legal institutionalization of market-oriented ecological governance mechanisms [
15,
16], China’s eco-environmental governance has undergone systematic reforms, evolving into a new paradigm featuring institutional perfection, technology empowerment, and multi-stakeholder co-governance. With the deepening implementation of ecological civilization construction, the ecological conservation and high-quality development strategy of the Yellow River Basin impose higher-dimensional governance requirements on Shanxi Province. Under this context, establishing an integrated space–air–ground ecological monitoring network has become an imperative demand for regional ecological governance [
17,
18], creating crucial policy opportunities and practical scenarios for applying novel assessment tools like the Remote Sensing Ecological Index (RSEI).
Remote sensing technology has become an indispensable technical means for modern eco-environmental monitoring due to its advantages of large-scale, multi-temporal, and multi-spectral observation capabilities [
19]. With the continuous advancement of remote sensing technologies, data processing and analysis based on the Google Earth Engine (GEE) platform have emerged as crucial approaches for eco-environmental monitoring [
20]. The GEE platform provides abundant remote sensing datasets and powerful computational capabilities, supporting large-scale data processing and analysis, significantly enhancing the efficiency and accuracy of environmental monitoring. In practical applications, MODIS images are widely used for eco-environmental monitoring, owing to their global coverage, high temporal resolution, and multi-spectral characteristics. MODIS data can provide continuous Earth observation records, enabling long-term analysis of ecological changes. Researchers have successfully monitored key ecological indicators, such as vegetation dynamics, water body distribution, and land surface temperature, using MODIS data, providing robust data support for environmental assessments [
21,
22,
23,
24].
Early studies predominantly employed single indicators for ecological quality evaluation. The Normalized Difference Vegetation Index (NDVI) has been extensively used to assess vegetation health [
25], playing a vital role in monitoring vegetation dynamics and ecological responses to climate change [
26]. Land surface temperature (LST) serves as another critical indicator for detecting thermal variations and identifying urban heat island effects [
27]. While single-indicator methodologies maintain irreplaceable advantages in domain-specific investigations, evolving scientific demands under contemporary development paradigms necessitate multidimensional analytical frameworks. The inherent limitations of univariate approaches have become increasingly apparent in addressing the requirements for systematic and comprehensive environmental assessments. The Ecological Index (EI) emerged in response to escalating scientific demands for comprehensive environmental assessment, boasting multidimensional analytical capabilities to holistically evaluate ecosystem conditions through systematic data integration [
28]. However, advancing research frontiers have progressively revealed critical limitations in the EI’s methodological frameworks, particularly concerning measurement accuracy influenced by temporal–spatial resolution mismatches [
29], subjective bias in indicator weighting protocols [
30], practical applicability constraints across heterogeneous landscapes [
31], and diminished long-term monitoring efficacy due to cumulative error propagation [
28].
To mitigate subjective bias in indicator weighting and enhance methodological scalability across diverse application scenarios for eco-environmental analyses, Xu Hanqiu pioneered the Remote Sensing Ecological Index (RSEI) in 2013 [
32]. This innovative framework overcomes conventional constraints through the synergistic integration of multi-spectral remote sensing parameters, establishing an objective quantification system for ecological assessments. Since its inception, RSEI applications have expanded from urban areas to regional and global scales [
33,
34,
35,
36]. Recent methodological innovations in the RSEI framework involve optimizing indicator weighting systems and incorporating seasonal variation parameters, which have substantially enhanced the assessment accuracy and regional applicability of the model for ecological monitoring [
37]. By leveraging the enhanced RSEI to characterize spatiotemporal differentiation patterns of ecological quality and systematically quantify the contribution rates of driving factors, this approach enables data-informed decision-making for implementing precision management strategies in watershed sustainable development [
6,
38].
As the world’s largest loess deposit region and ecological restoration exemplar, the Loess Plateau offers unique insights into vulnerability–resilience mechanisms under intense human–nature interactions [
39,
40]. While ecological studies on the Loess Plateau have matured [
18,
41,
42,
43,
44,
45,
46], methodological divergences persist: Kang et al. combined the classical RSEI with the Hurst index for trend persistence prediction, Zhou et al. applied geographically weighted regression (GWR) to decipher the spatial heterogeneity of drivers, and Jia et al. modified the RSEI into the MRSEI by integrating meteorological and socioeconomic data on the GEE platform [
47,
48,
49]. Situated in the coal-rich Loess Plateau, Shanxi Province has undergone profound ecological transformations driven by intensive mining activities. These anthropogenic disturbances have significantly modified land use configurations and vegetation dynamics in mining regions [
50], consequently impairing ecosystem resilience. While existing studies have effectively employed the RSEI to quantify energy–ecology trade-offs in coal mining contexts, methodological constraints persist in three key aspects. Current analyses demonstrate temporal discontinuity that inadequately reflects ecological shifts occurring in recent biennia. Spatial delineations predominantly focus on localized mining districts or watershed systems, overlooking province-wide developmental trajectories. Furthermore, interpretations of RSEI interannual variations lack the systematic integration of multi-temporal observations, ultimately limiting the comprehensive understanding of Shanxi’s spatiotemporal eco-environmental differentiation patterns [
51,
52,
53,
54,
55,
56].
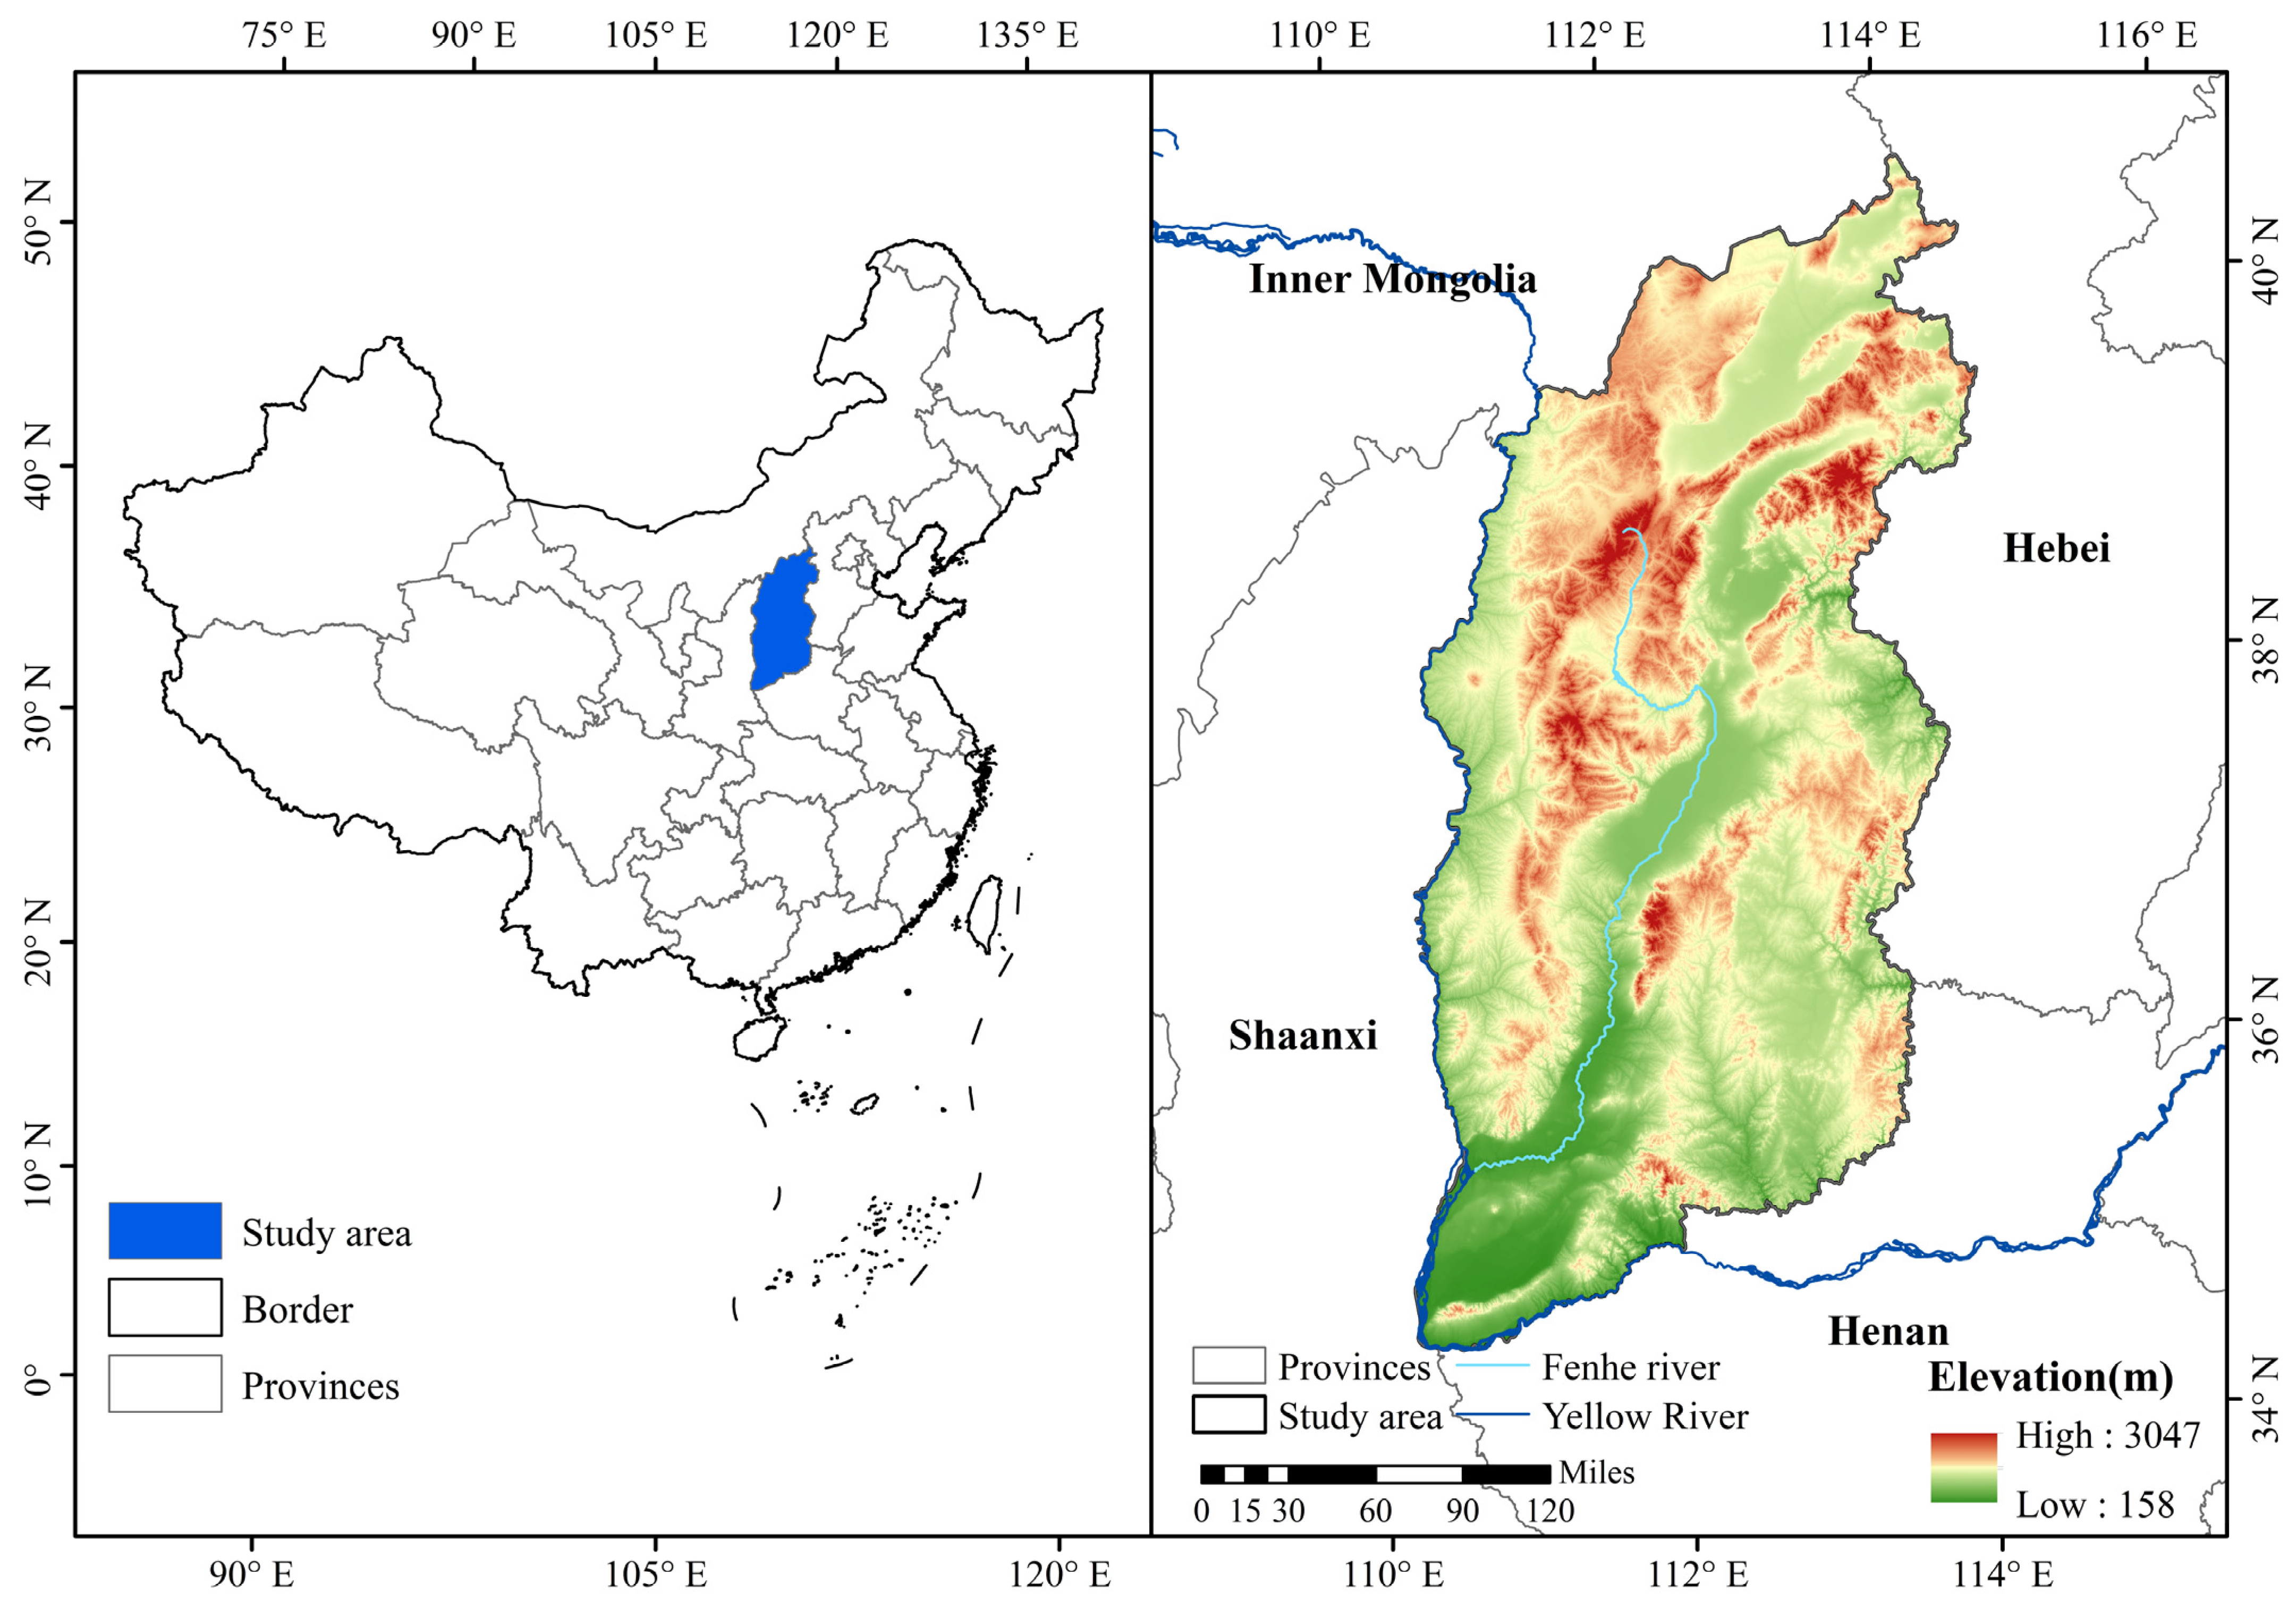
Implementing a systematic investigation into Shanxi Province’s ecological quality enables a comprehensive characterization of its spatiotemporal heterogeneity patterns, thereby advancing the understanding of regional ecosystem dynamics. This study constructs a 2000–2024 RSEI dataset for Shanxi Province based on Google Earth Engine (GEE) and MODIS time-series data, employing a geodetector to analyze multi-scale driving factor interactions. This research aims to (1) monitor the spatiotemporal differentiation of RSEI grades across different stages; (2) analyze RSEI change trends and persistence characteristics from 2000 to 2024; and (3) assess the impacts of various driving factors on the RSEI. Through systematic analytical approaches, this investigation elucidates the spatiotemporal characteristics of regional ecosystem dynamics, which can inform the development of evidence-based ecological restoration strategies.
3. Results
3.1. Results of Principal Component Analysis
As illustrated in
Table 2, the principal component analysis reveals multidimensional drivers and a spatiotemporal heterogeneity of ecological quality in the study area. PC1 explains 71.07–88.83% of the total variance during 2000–2024, indicating that ecological dynamics are primarily governed by a unified dimension, albeit with temporal shifts in driving mechanisms. The peak PC1 contribution in 2015 (88.83%) likely correlates with intensified synergistic responses among indicators under the “Ecological Redline” policy enacted that year [
64], whereas its decline to 71.07% in 2020 may reflect reduced human disturbances during the COVID-19 pandemic, which amplified the explanatory power of secondary drivers in PC2–PC4 [
65].
Loading directions of ecological indicators further elucidate the interplay between anthropogenic and natural processes. After applying the “1-PC1” transformation, positive loadings of NDVI and WET confirm vegetation coverage and surface moisture as core elements of ecological improvement, particularly in 2015 when NDVI’s absolute loading peaked. Conversely, persistent negative linkages of NDBSI and LST underscore land aridification and heat island effects as primary degradation drivers.
Disparities in indicator weights further expose regional ecological vulnerabilities. Consistently higher absolute loadings of NDVI and NDBSI compared to WET and LST demonstrate that a greening–drying imbalance constitutes a chronic constraint, corroborated by land cover transitions from agricultural to industrial uses. Moreover, cyclical fluctuations in PC1 contributions may signal a paradigm shift from “centralized restoration” to “diversified regulation” in ecological governance. Post-2015 initiatives such as sponge city development and regional pollution control potentially diluted the dominance of traditional factors.
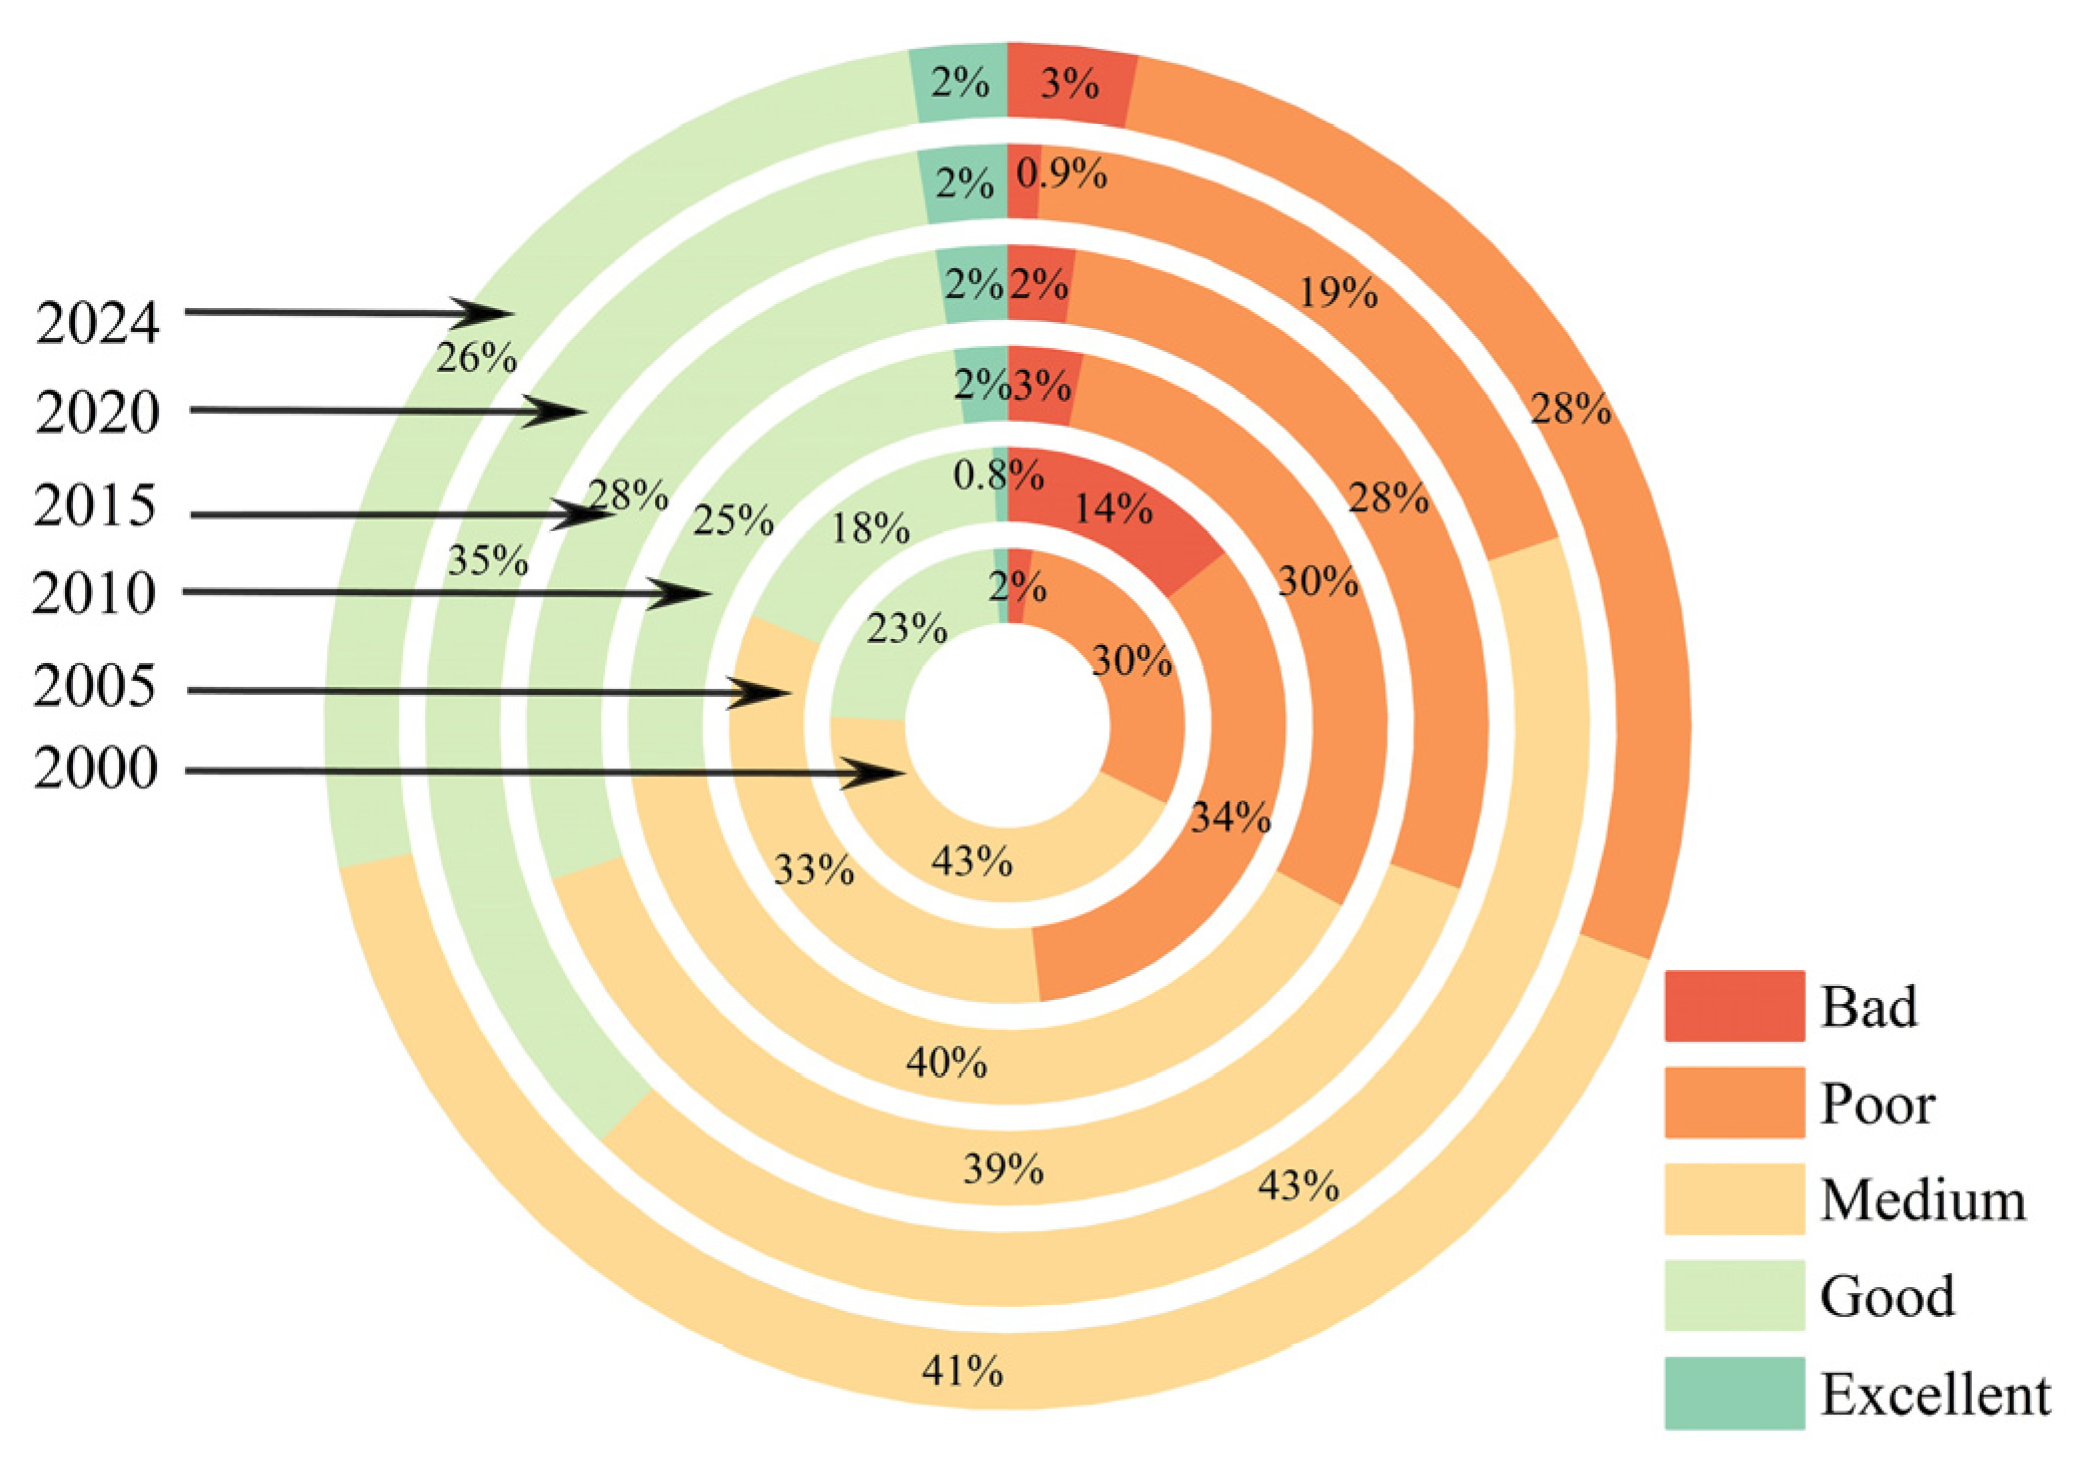
3.2. Spatial Distribution Characteristics of the RSEI in Shanxi Province
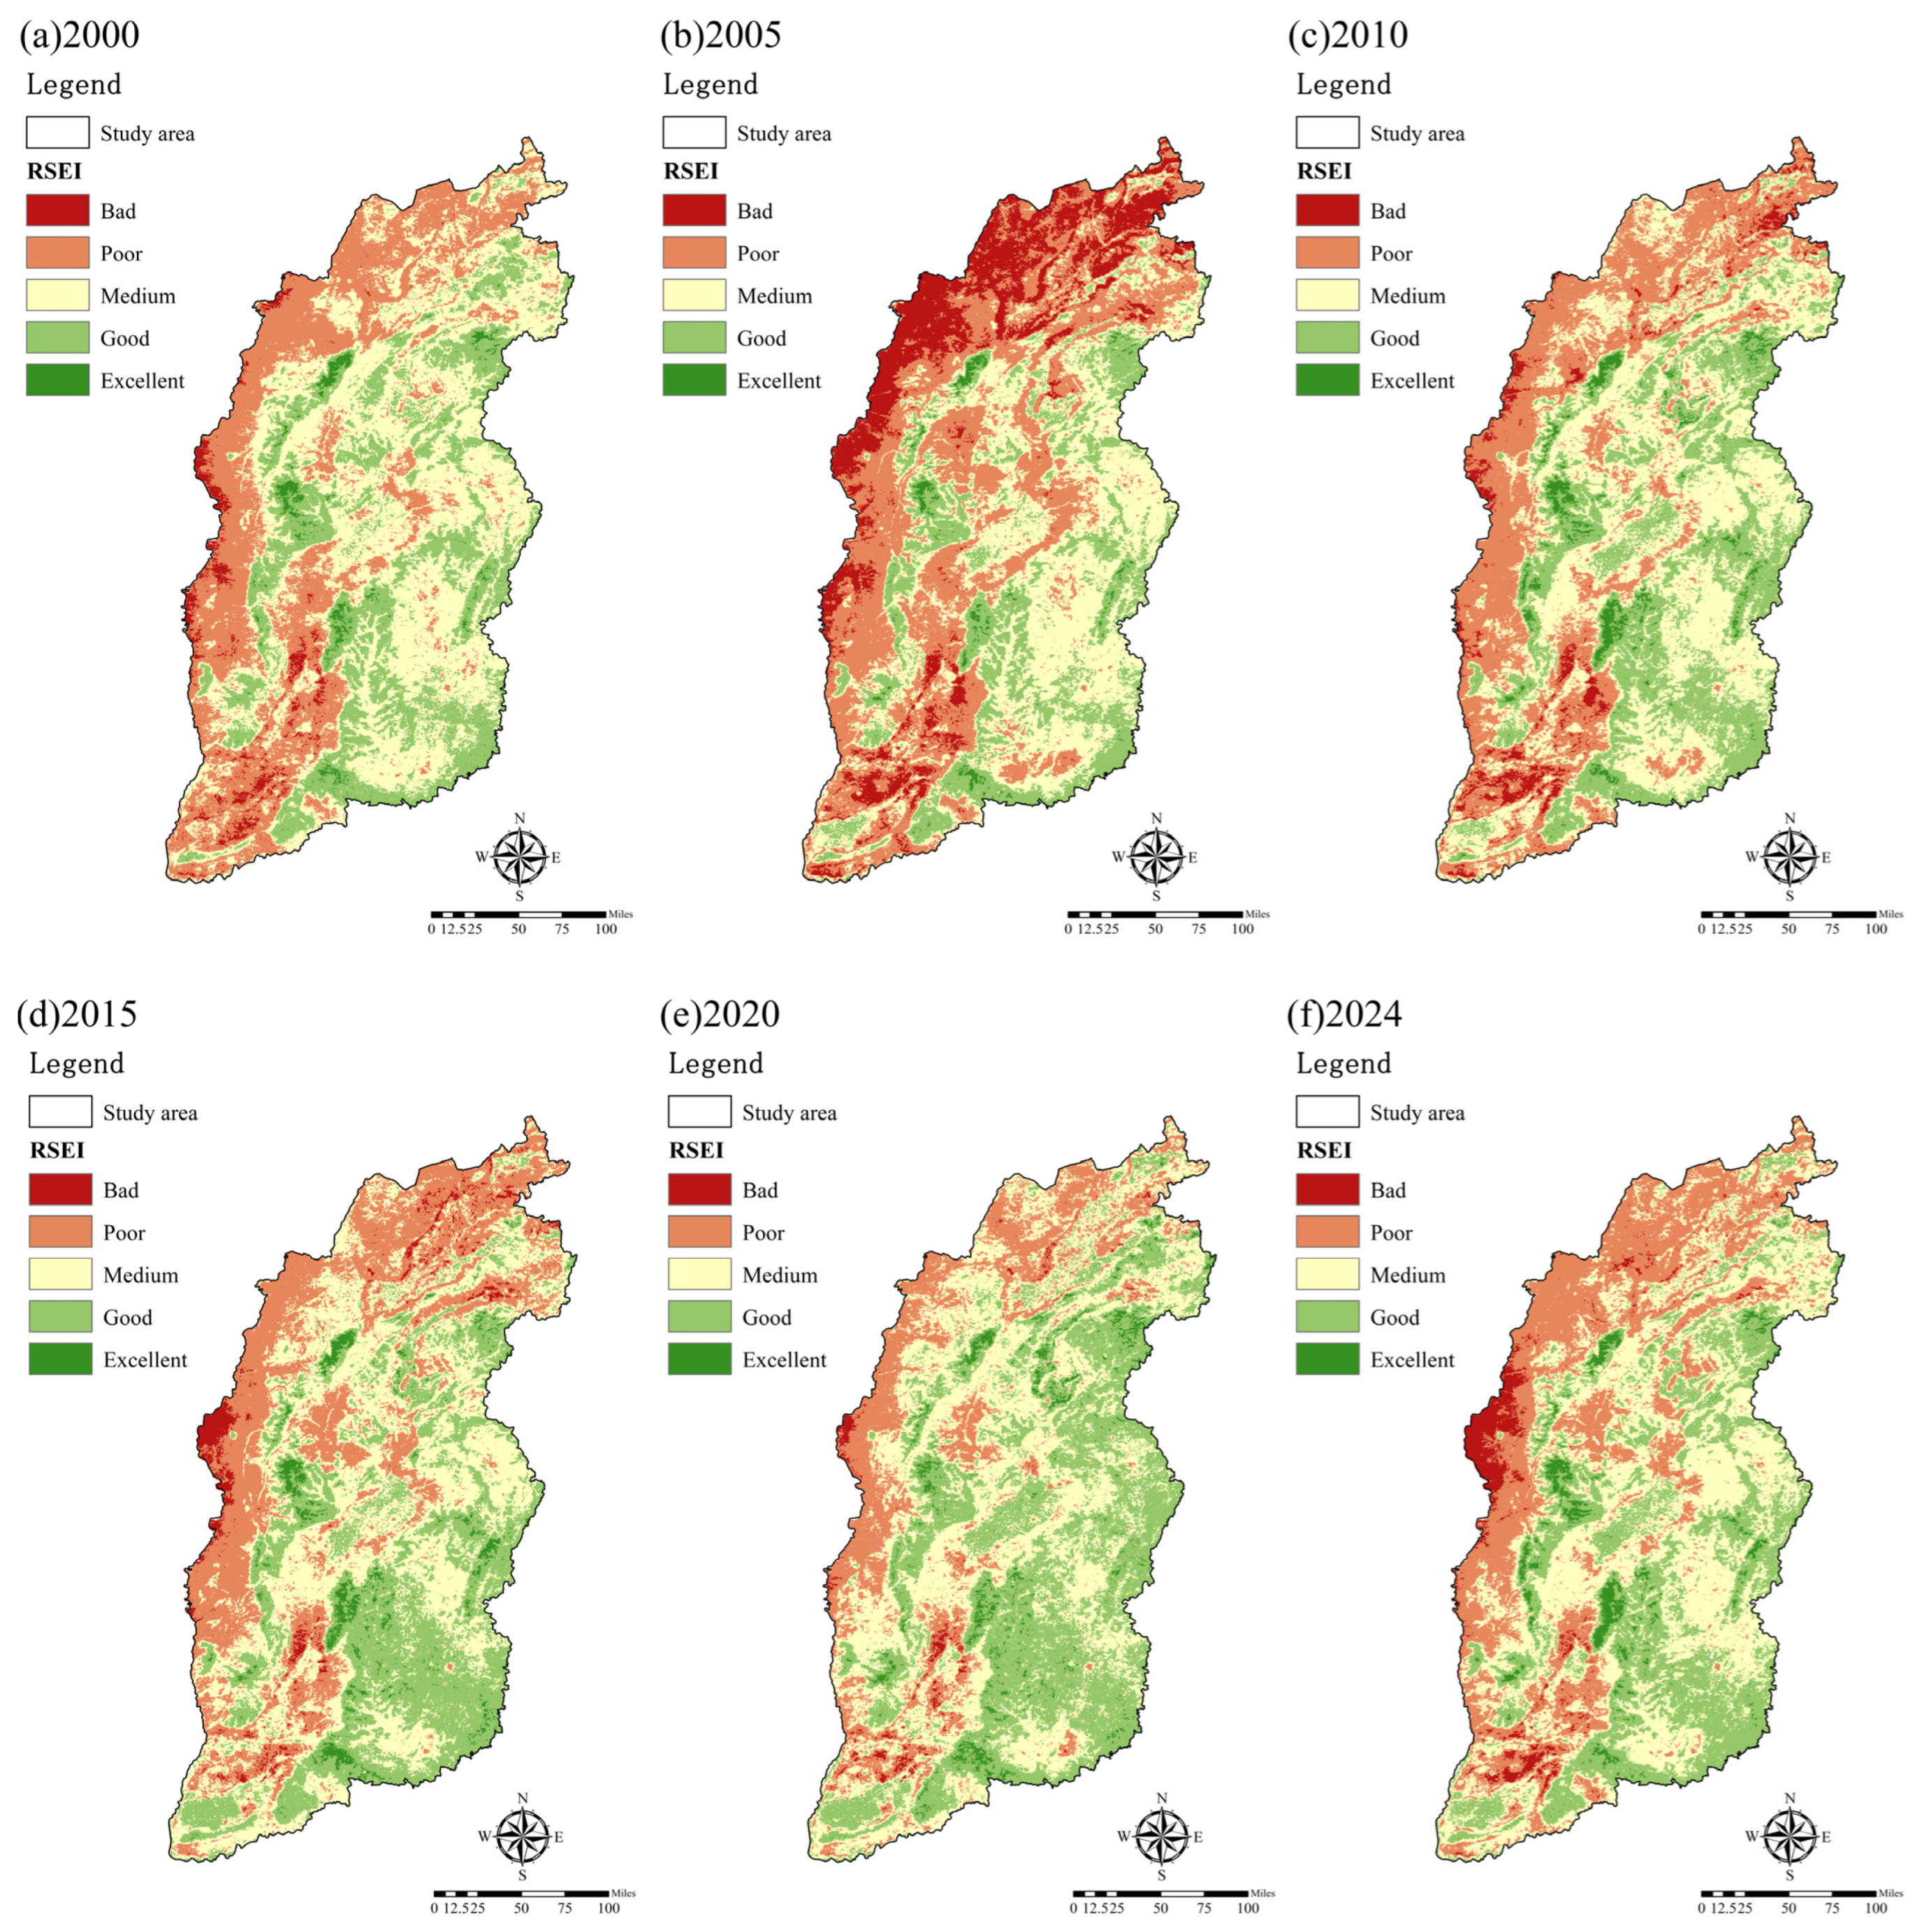
The spatiotemporal differentiation patterns of the RSEI in Shanxi Province were analyzed at intervals of five years. The RSEI was classified into five grades. The spatial distribution is illustrated in
Figure A1, and the area proportions of each grade are depicted in
Figure 3. During the study period, the ecological environmental quality in Shanxi Province manifested a gradient pattern, with the western region exhibiting inferior quality and the eastern region showing superior quality. The medium-quality zone persistently occupied a dominant position, serving as the stable foundation of the ecosystem. By contrast, the low-quality zones (poor and relatively poor grades) and high-quality zones (good and excellent grades) demonstrated a dynamic game-like characteristic, where one tended to decline as the other increased.
The spatiotemporal variations and area proportions of the poor and relatively poor grades displayed distinct periodic fluctuations. In 2000, the poor and relatively poor grades were predominantly distributed in the western foot of the Lüliang Mountains, the northern foot of the Hengshan Mountains, and the marginal areas of the southern foot of the Zhongtiao Mountains, with the combined area proportion of these two grades amounting to 32%. By 2005, influenced by the ecological degradation in the coal mining and development areas of northern Shanxi, the poor and relatively poor grades expanded significantly towards the northwest. The combined area proportion of these two grades increased from 32% to 48%. Benefiting from the implementation of ecological environment management projects, such as soil and water conservation initiatives, this situation improved in 2010. In the northern region of Shanxi Province, the extent of the poor and relatively poor grades contracted towards the peripheral areas, and the area proportion decreased from 48% in 2005 to 33%. From 2015 to 2020, a period of rapid restoration was observed, during which the proportion of the low-quality area continuously decreased to 20%. However, in 2024, a local rebound occurred, with the poor grade slightly expanding in the western and northern parts of Shanxi Province. The combined area proportion of the poor and relatively poor grades increased from 20% in 2020 to 31%.
The medium-grade areas exhibited relatively stable changes throughout the study period, being evenly distributed across Shanxi Province, with the area proportion remaining approximately at 40%. As a buffer zone between the relatively poor-grade and relatively good-grade areas, the spatial distribution of the medium-grade areas was susceptible to the changes in these two adjacent zones. The changes in the adjacent areas were more pronounced, while those in the remaining areas remained relatively stable.
The ecological environmental quality in the study area exhibited significant spatial differentiation. In the western, northern, and southwestern regions, the ecological environmental quality was predominantly of the poor and relatively poor grades, indicating a fragile ecological environment. In the central region, the ecological environmental quality was mainly of the medium grade, suggesting a relatively favorable ecological environment. In the eastern and southeastern regions, the ecological environmental quality was predominantly of the good and excellent grades, reflecting a good ecological environment. In terms of the area proportions of each grade, the proportion of the medium-grade area remained basically at 40%. The proportion of the relatively poor-grade area showed a downward trend, whereas that of the relatively good-grade area exhibited an upward trend. The area proportions of the excellent and poor grades remained relatively stable at around 2%. The spatiotemporal changes and area proportion variations in each grade confirmed the development trend of “overall improvement with local fluctuations”. Nevertheless, it is crucial to pay special attention to the ecological restoration efforts in the concentrated poor-grade areas in the west and the ecologically degraded areas in the north in order to enhance the overall ecological environmental quality of Shanxi Province.
3.3. Analysis of the RSEI Trends and Stability in Shanxi Province
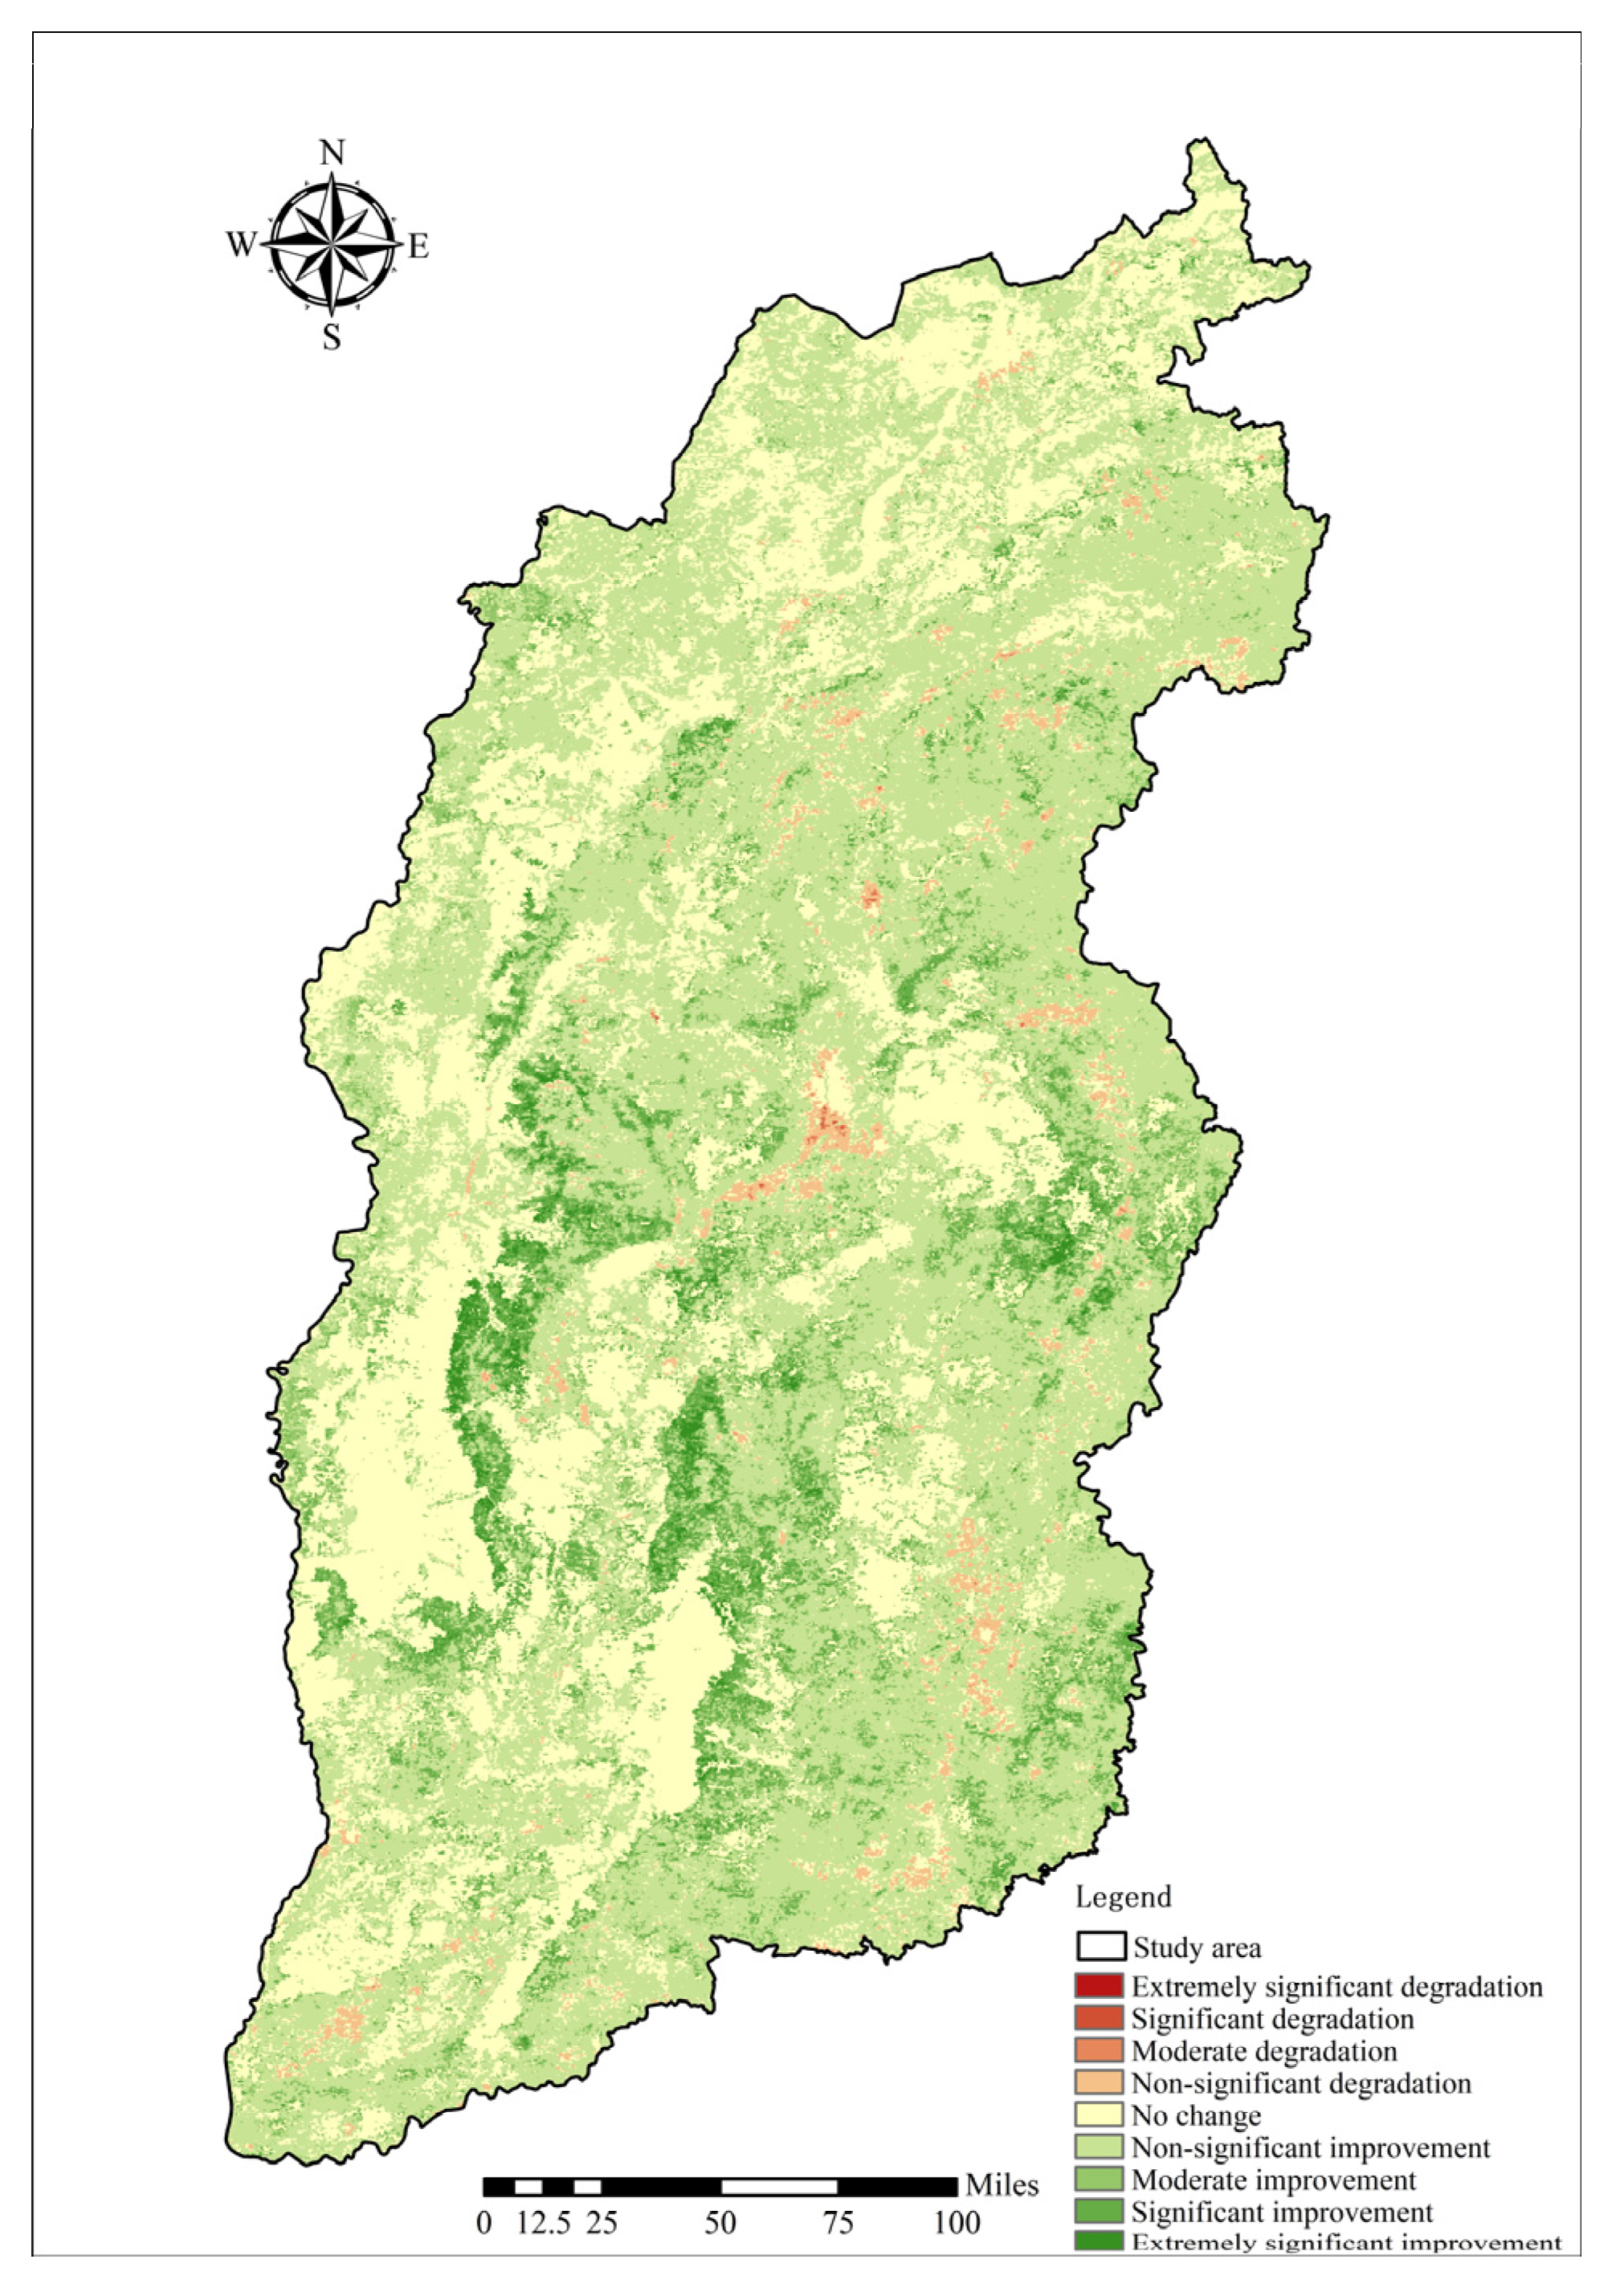
This study employed Theil–Sen Median trend analysis and Mann–Kendall significance testing to classify the RSEI trends from 2000 to 2024 into nine categories, with the spatial distribution and area proportions of each trend level illustrated in
Figure A2 and
Figure 4, respectively. The ecological quality of Shanxi Province exhibited relative stability during this period, though spatial patterns and area shares of different trend levels varied significantly.
Non-significant improvement (48.87%) and no change (33.26%) dominated the province, collectively occupying 82.13% of the total area. Non-significant improvement areas were uniformly distributed, while no-change zones clustered in western and central regions from north to south. Moderate improvement (8.86%) and significant improvement (6.02%) primarily bordered these dominant categories, demonstrating higher ecological quality that warrants sustained management. Extremely significant improvement covered merely 0.84% of the area, concentrated in central-western regions, indicating substantial potential for enhanced ecological governance. Degradation trends affected less than 3% of the province, predominantly along peripheral areas. Targeted interventions are urgently needed to prevent ecological deterioration in these marginal zones from triggering broader environmental damage.
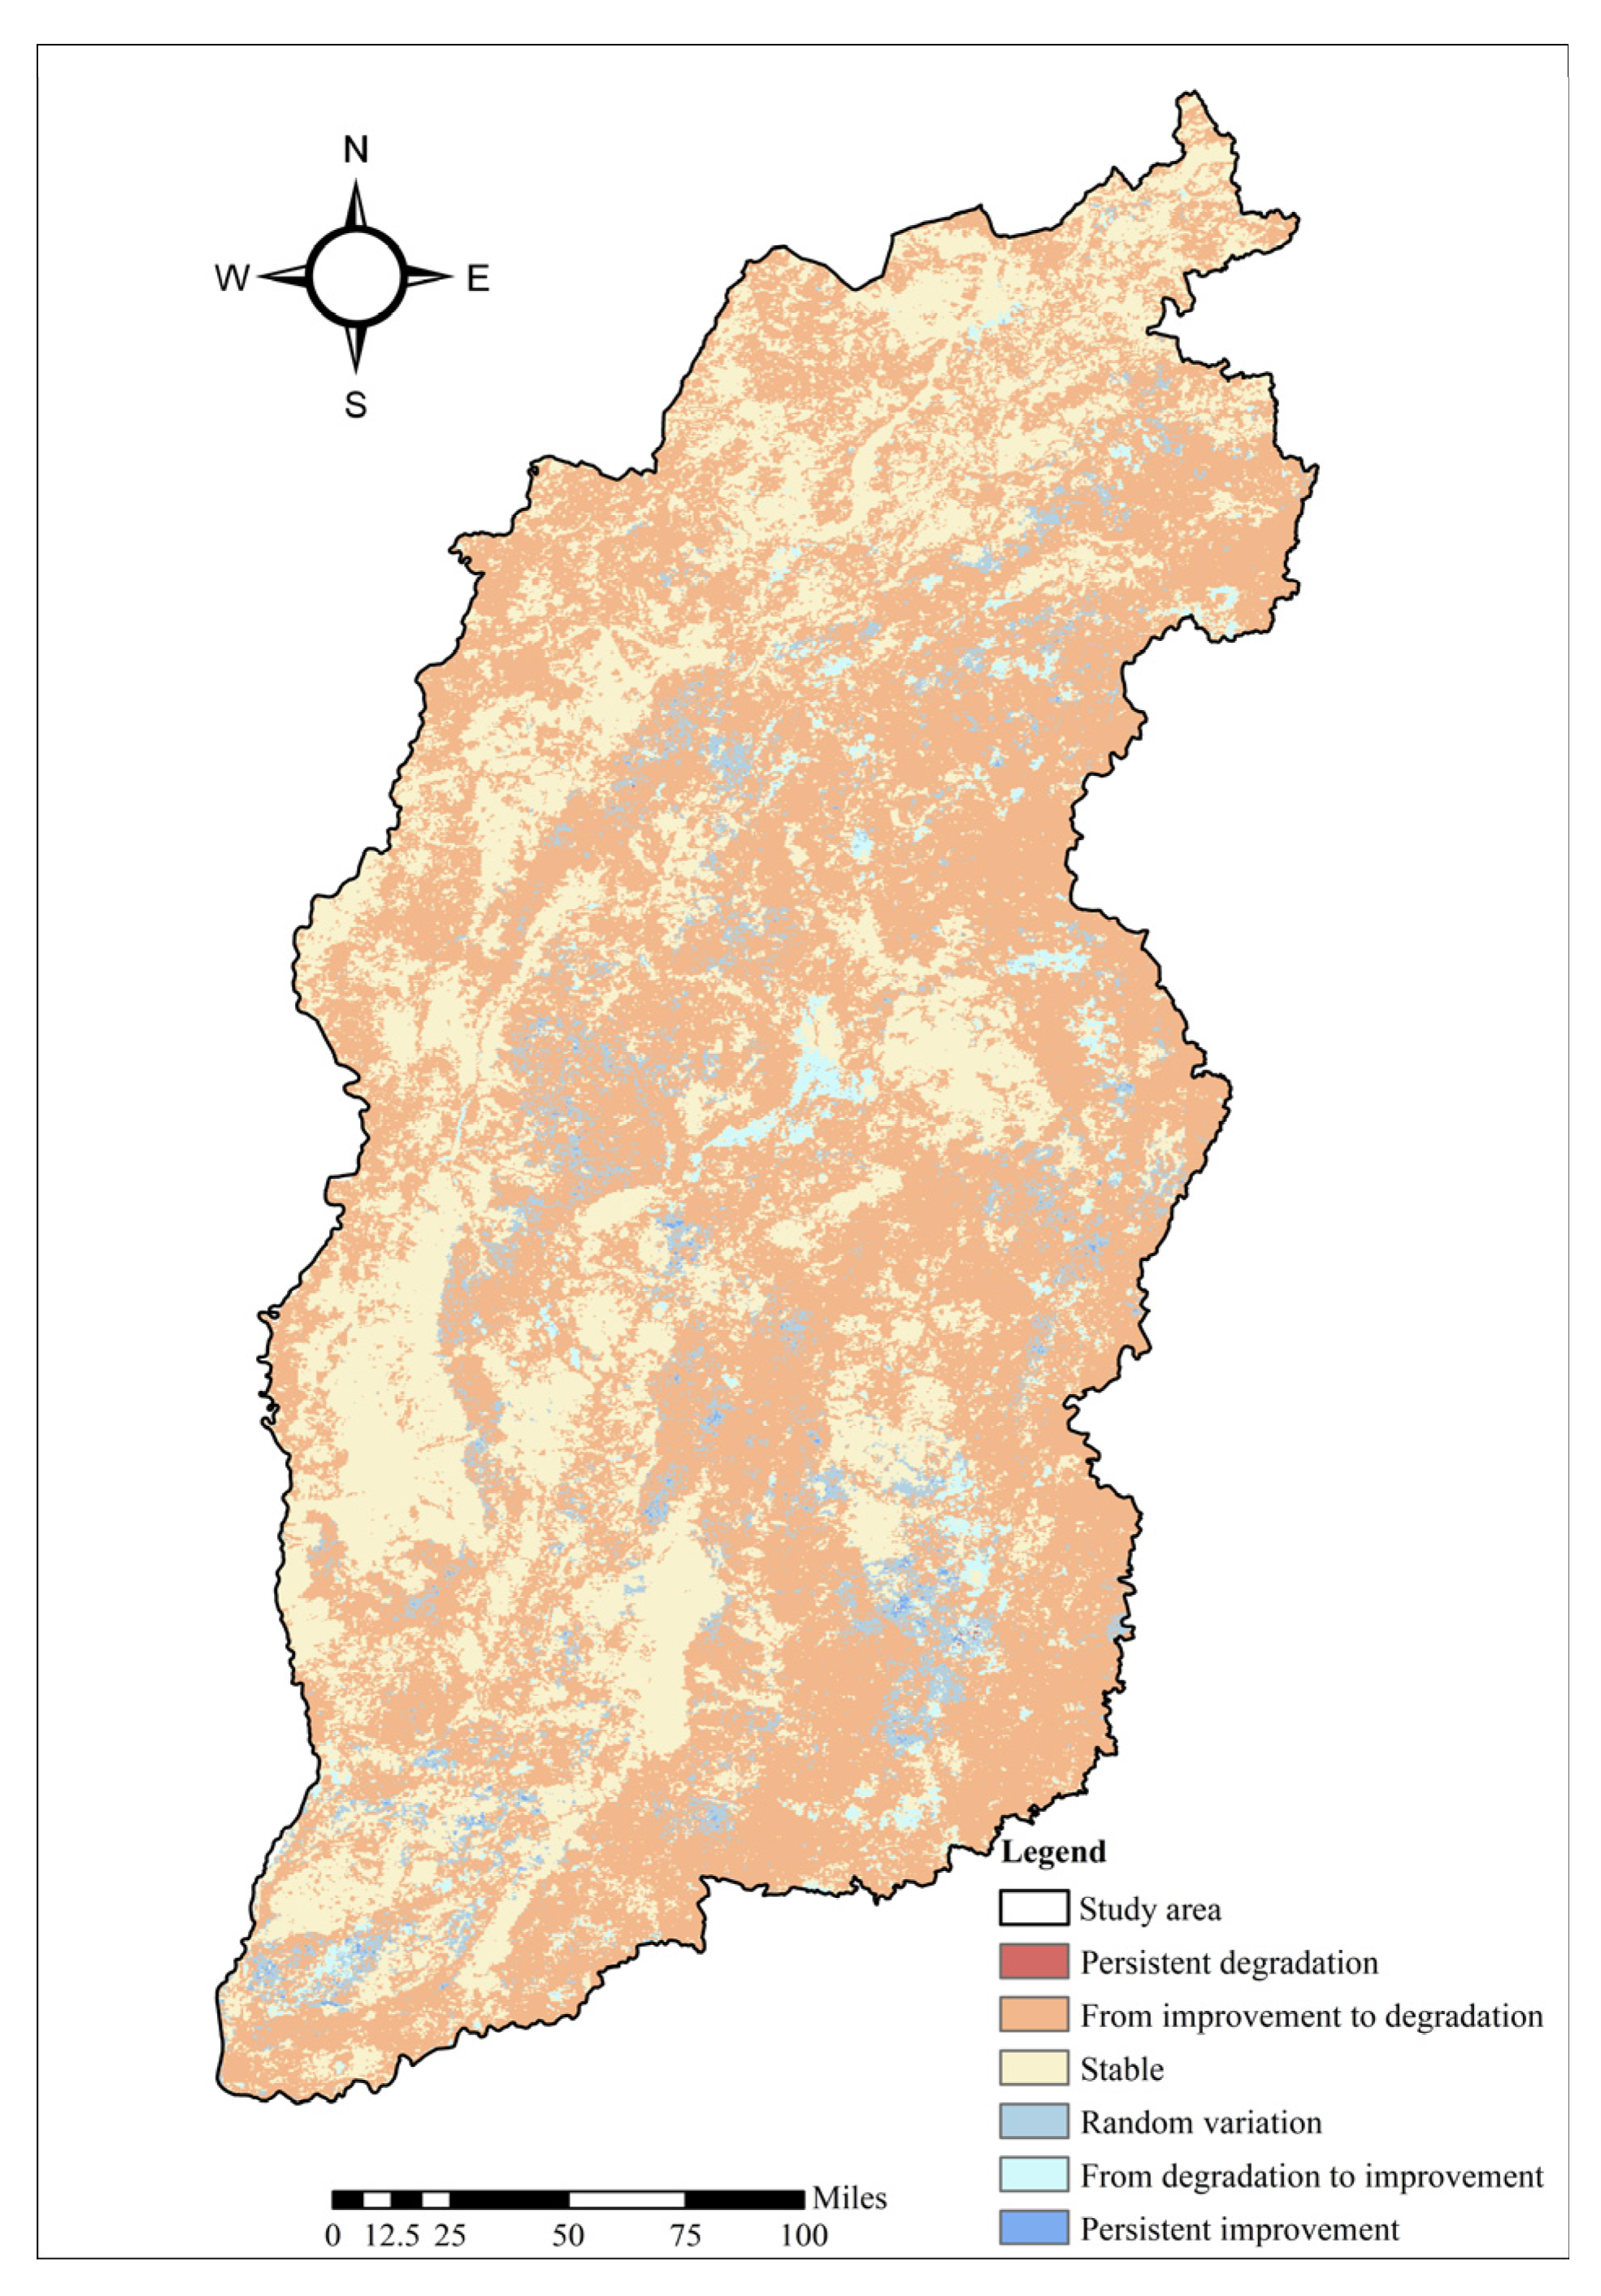
Between 2000 and 2024, the Hurst index of Shanxi Province spanned from 0 to 0.68, averaging 0.37, which implies that the forthcoming development trajectory of the ecological environmental quality in Shanxi Province exhibits a reverse persistence trend. By integrating the Theil–Sen Median trend variation outcomes with the Hurst index, the future evolution of the ecological environmental quality in Shanxi Province was projected. The projection results were categorized into six distinct classes, and the area fractions of each class were computed, as illustrated in
Figure A3 and
Figure 5, respectively.
The forecasting results reveal that the future ecological environmental development in Shanxi Province will predominantly transition from enhancement to degradation, presenting a pessimistic outlook. This category of area is dispersed throughout Shanxi Province, most prevalently in the eastern and central regions, and predominantly in the marginal zones of the southern, western, and northern regions. The area fraction of this predicted zone reaches 60.07%. Hence, it is crucial to fortify environmental monitoring and supervision in these areas and enforce proactive ecological environment management policies to preclude potential ecological deterioration in the future.
The regions forecasted to remain nearly unchanged will progress along their initial trajectories. They are predominantly situated in the marginal areas of the northern and western parts of Shanxi Province and certain local areas in the central region, constituting 33.09% of the total area. The regions predicted to experience random fluctuations are diffusely distributed, primarily in the central and southern regions, with a relatively minuscule area fraction of 4.66%. The ecological environmental development in the regions of near-stability and random variation is intricate. Holistic ecological environment management strategies should be implemented, integrating prevention and mitigation measures with ecological conservation measures, and tailoring the optimal management approach to local circumstances.
The regions predicted to shift from degradation to improvement are mainly located in select local areas of the central and eastern regions, scattered in distribution, with an area fraction of merely 2.03%. Scientific research endeavors can be initiated in these areas to explore the specific causative factors for environmental amelioration, summarize the experiences, and disseminate them to elevate the overall ecological environmental quality. The regions predicted to have continuous enhancement and continuous degradation are both sparsely distributed, with an area fraction below 1%.
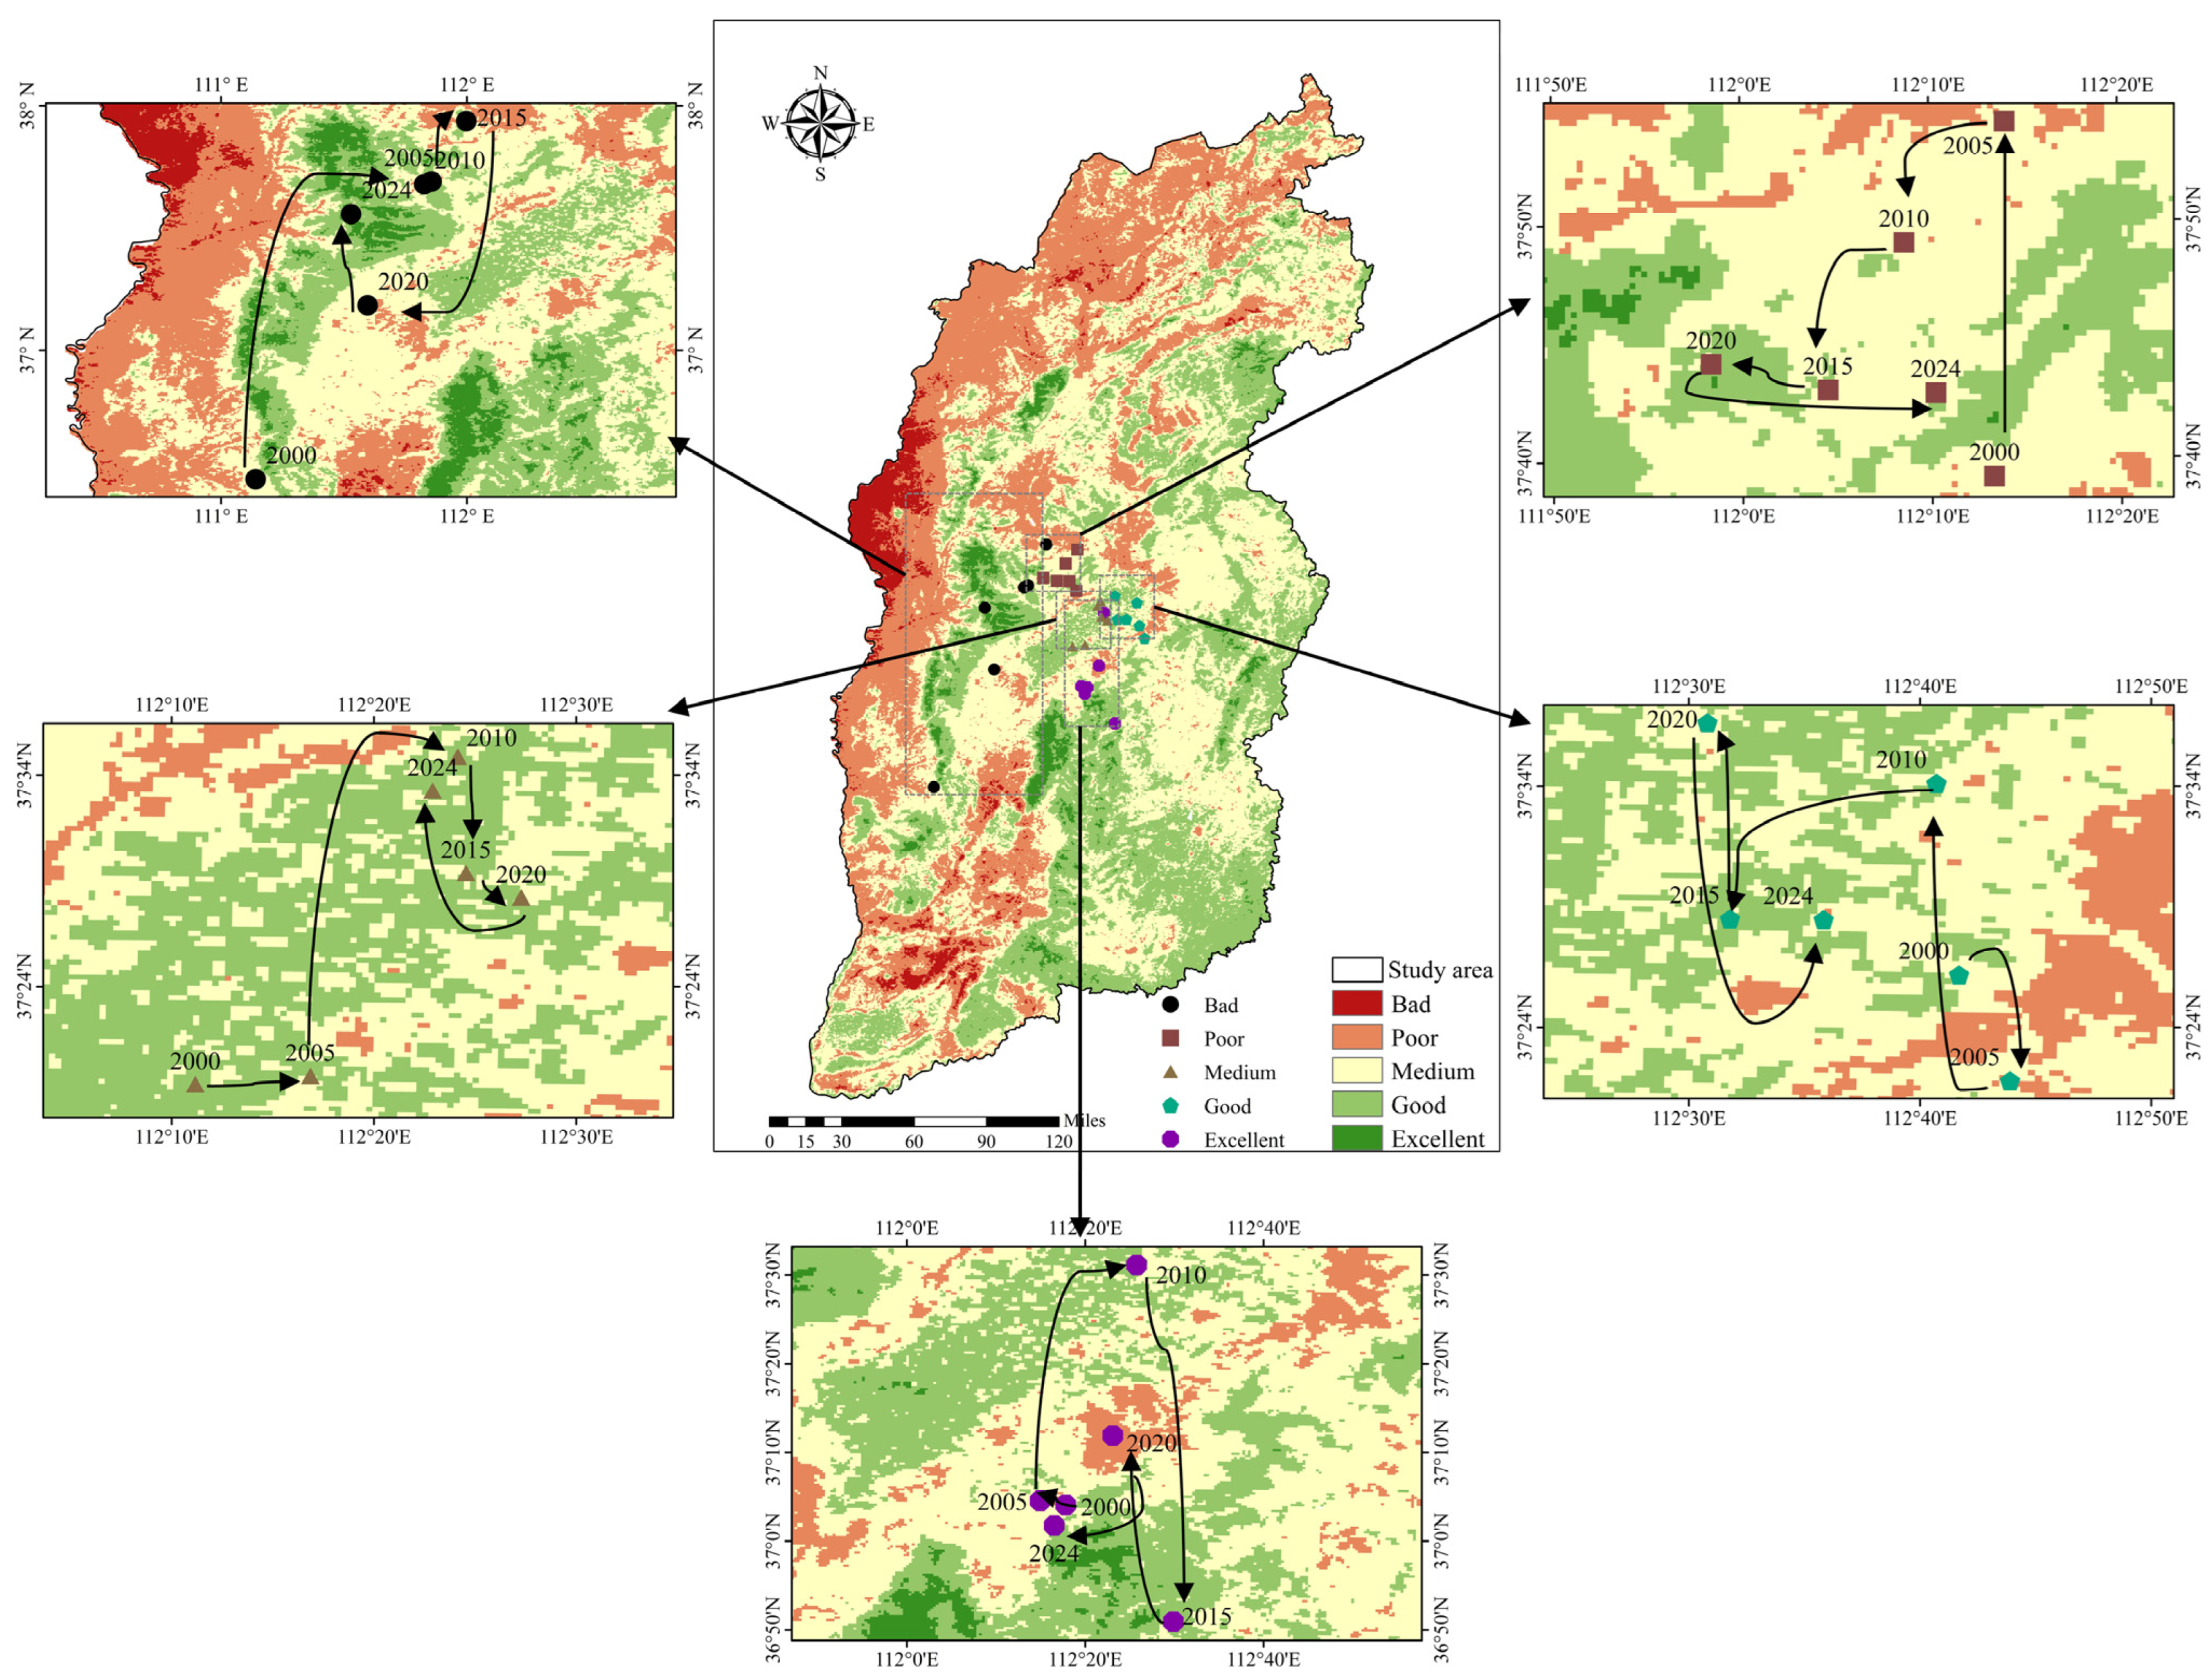
3.4. Migration of the Gravity Center of the RSEI in Shanxi Province
To gain deeper insight into the spatial variation characteristics of ecological environmental quality in Shanxi Province from 2000 to 2024, ArcGIS10.8 was employed to compute the spatial gravity centers of the five ecological environmental quality grades (poor, relatively poor, medium, good, and excellent) in Shanxi Province for the years 2000, 2005, 2010, 2015, 2020, and 2024. Subsequently, the migration trajectory diagrams of the gravity centers for each grade were mapped, as depicted in
Figure 6.
In general, the gravity centers of all grades exhibited a migratory tendency, yet with diverse migration directions and magnitudes. The poor grade was predominantly located in the western region of Shanxi Province. Its gravity center shifted northeastward throughout the study period, characterized by a substantial interannual migration span, which implies the instability and significant fluctuations of the ecological environmental quality within this grade. The gravity center of the relatively poor grade was closely positioned to that of the poor grade, but the former featured a more concentrated distribution with a smaller migration span, suggesting a relatively stable ecological environmental quality and a lower degree of variation.
The gravity center of the medium grade was mainly situated in the central region of Shanxi Province. A slight eastward migration during the study period signified an enhancement in the ecological environmental quality of the central region. The gravity center of the good grade was predominantly distributed in the east-central part of Shanxi Province and exhibited a minor westward shift during the study period, indicating incipient signs of improvement in the ecological environmental quality of the western region. The continued advancement of ecological environment management initiatives is thus essential. The migration trajectory of the gravity center of the excellent grade displayed intricate and erratic changes, accompanied by a large interannual migration amplitude, highlighting the vulnerability of high ecological environmental quality to surrounding environmental influences and the challenges in its long-term sustenance. Consequently, intensified efforts are imperative for ecological environment protection.
4. Discussion
The factors influencing the spatial differentiation of the RSEI in Shanxi Province can be classified into three categories: topographic factors, climatic factors, and human factors. According to these three categories of influencing factors, this study selects nine typical driving factors as the independent variable X and takes the RSEI of Shanxi Province as the dependent variable Y. In this study, the years 2000, 2005, 2010, 2015, and 2020 are selected as time nodes. ArcGIS10.8 is used to create a 10 km × 10 km fishnet, resample each factor, and reclassify them into five grades. The zonal statistics tool is used to obtain the mean value of each factor within the grid and then conduct a geographical detector analysis.
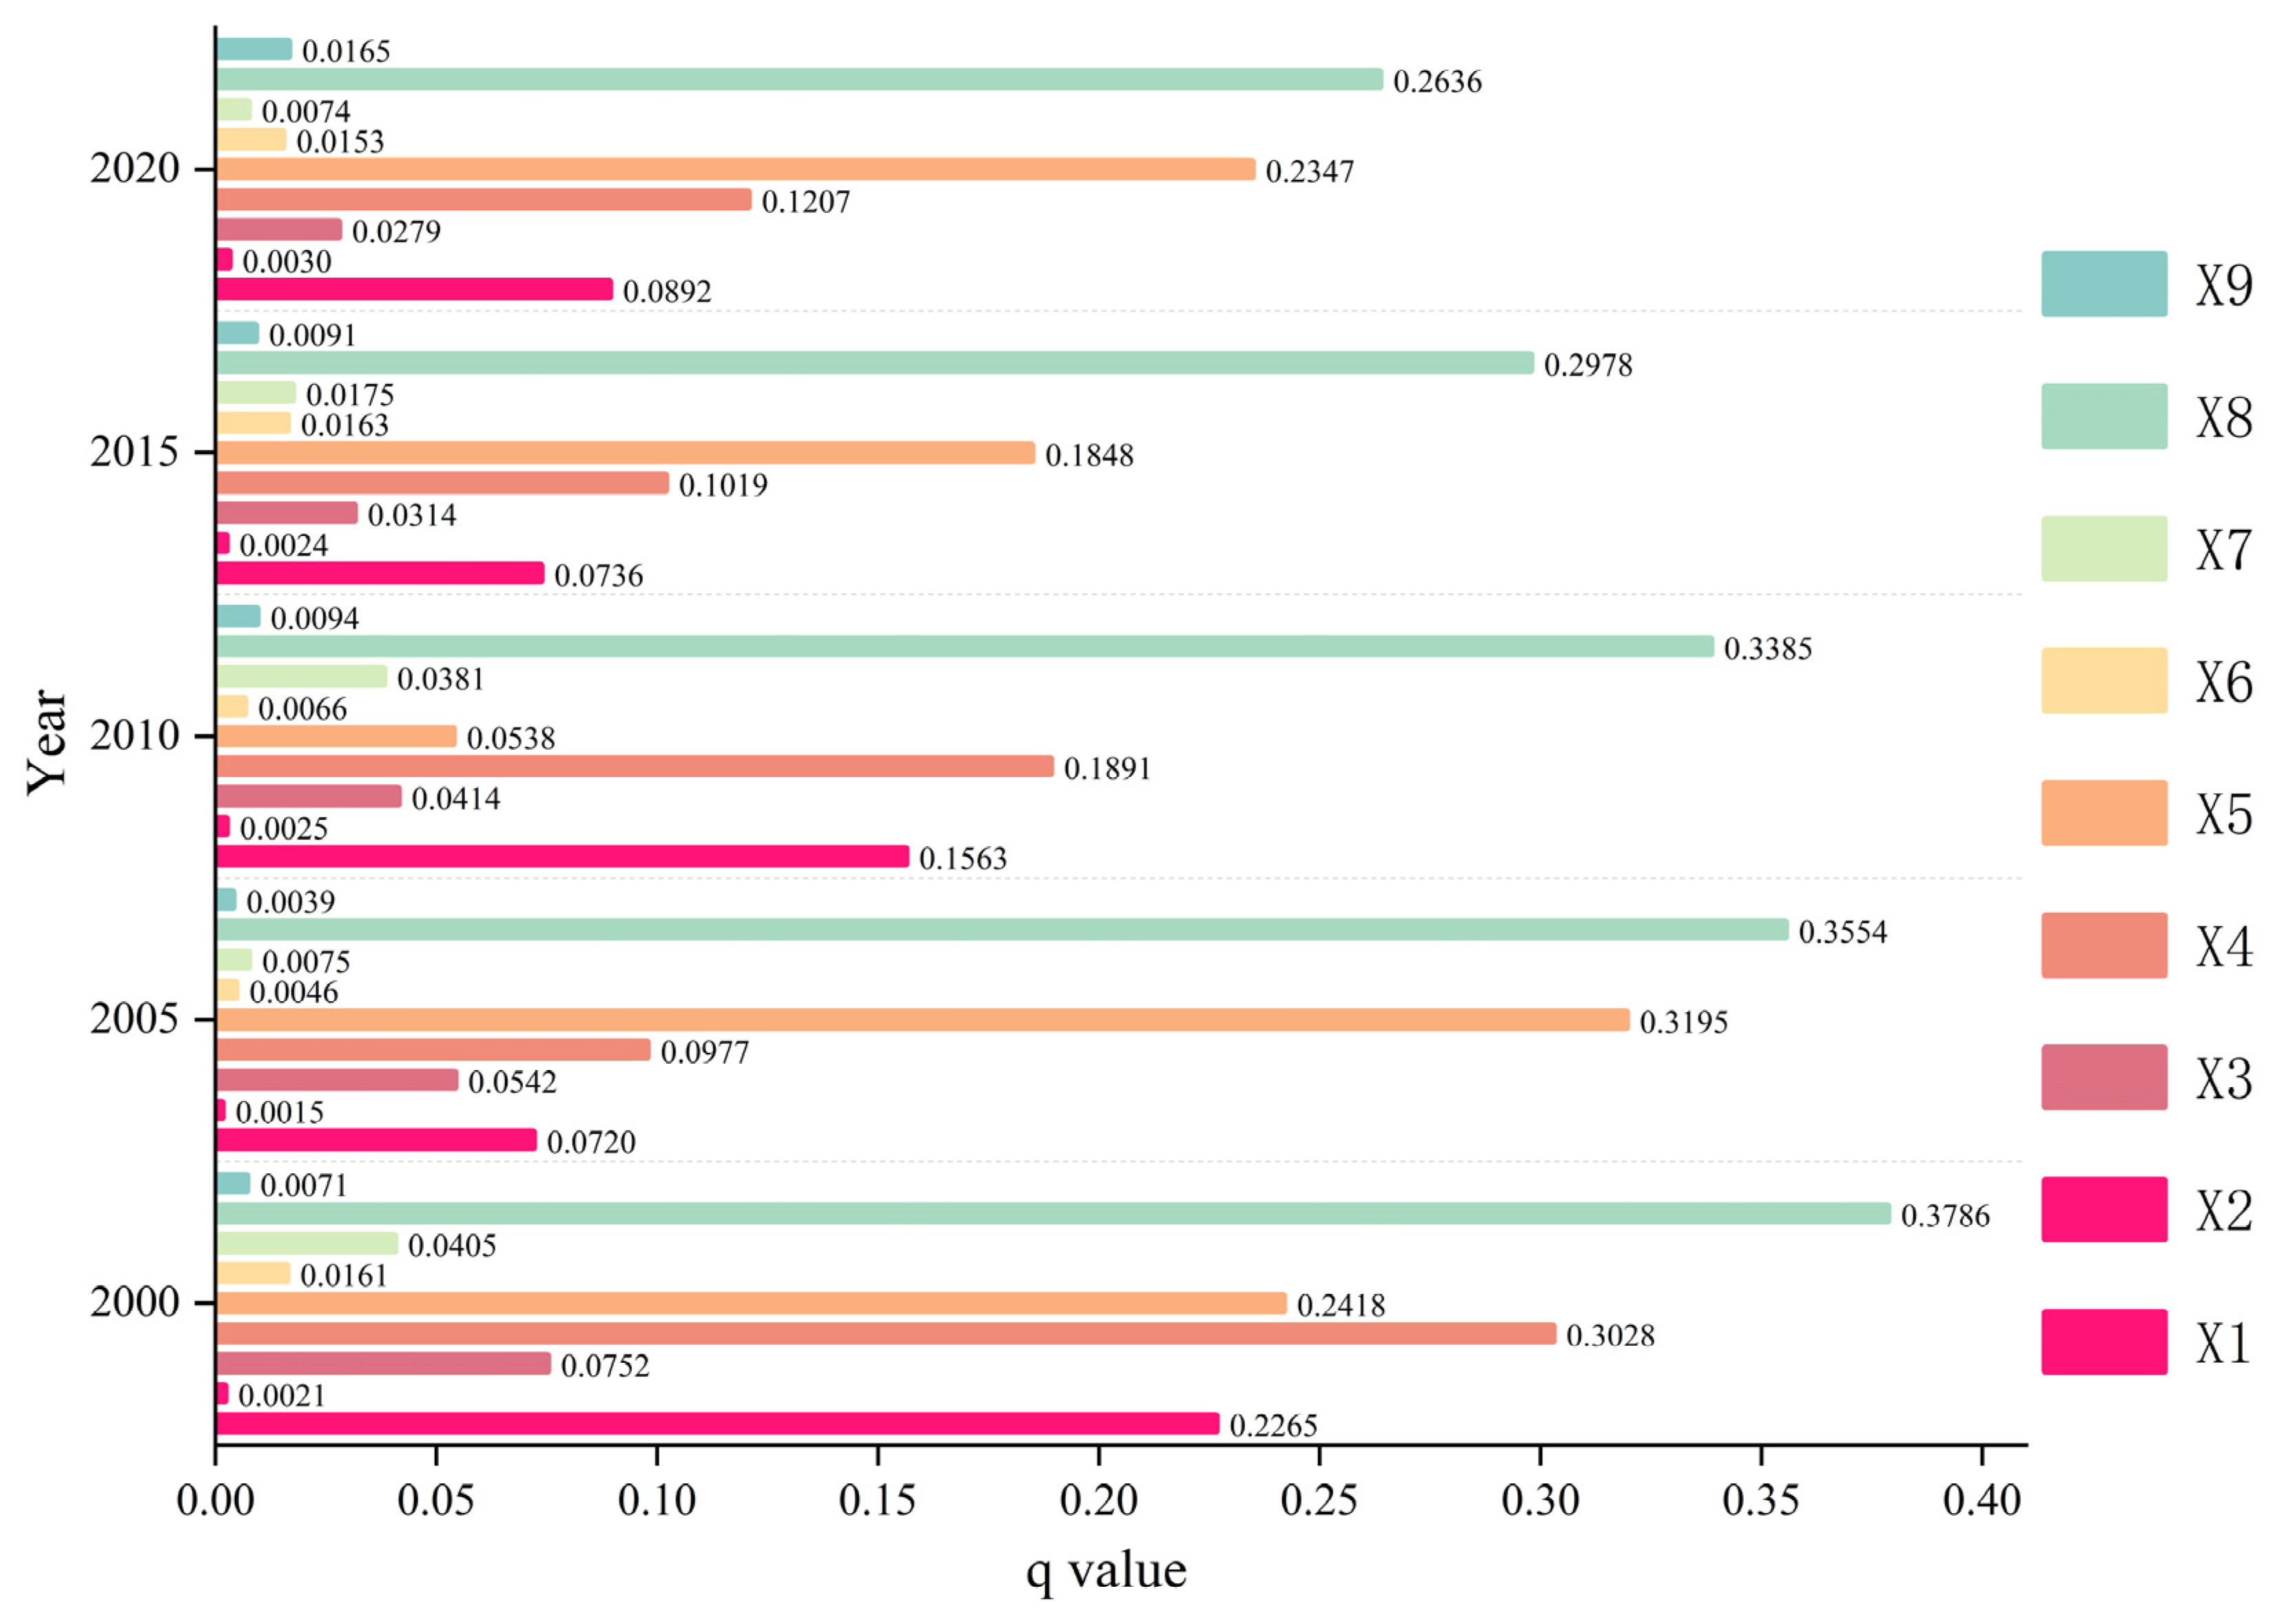
4.1. Single-Factor Detection Analysis
The impacts of various factors on the RSEI across different years are illustrated in
Figure 7. The influencing magnitudes of these factors on the RSEI in Shanxi Province exhibit distinct disparities. From the ranking of their q values, it is evident that land use type (X8), air temperature (X4), precipitation (X5), elevation (X1), and slope (X3) constitute the top five driving factors. Among them, land use type (X8) demonstrates the highest-ranking stability, whereas the rankings of the other four factors experience annual fluctuations. Secondary influential factors encompass GDP (X7), nighttime light intensity (X6), population density (X9), and slope aspect (X2), with their q values consistently below those of the top five factors. Based on the current trend, it is deduced that the composition of the top five driving factors will remain unchanged until 2024.
The persistently high q value of X8 underscores its pivotal role in the evolution of the ecological environment. Alterations in land use types, such as the extensive expansion of construction land during urbanization, and the fluctuations in cultivated land and forest land areas resulting from agricultural activities and ecological conservation efforts exert direct or indirect influences on the structure and function of the regional ecosystem. As a crucial climatic factor, the spatiotemporal heterogeneity of X5 aligns with the characteristics of the temperate continental monsoon climate in Shanxi Province. Variations in precipitation significantly impact the ecosystem’s carbon sequestration capacity and soil and water conservation efficiency by modulating vegetation coverage and soil moisture, thereby exerting a comprehensive effect on the RSEI.
Conversely, the relatively low q values of factors such as X2, X6, and X9 signify their limited impacts on the RSEI. For instance, although slope aspect influences the distribution of environmental factors such as light, heat, and moisture, the intricate and diverse topography of Shanxi Province may lead to the offsetting of slope aspect differences across various regions, rendering its impact on the overall ecological environmental quality less pronounced.
Notably, the q values of certain factors fluctuate across different years. For example, the q value of X7 increased from 0.0075 in 2000 to 0.0381 in 2010. The interannual fluctuation patterns of X7′s q values exhibit striking synchronicity with the evolutionary trajectory of the mining area RSEI. During the initial intensive coal exploitation phase, mining-induced disturbances triggered a degradation of ecosystem service functions, resulting in persistently depressed RSEI levels. The subsequent enactment of environmental protection policies and the implementation of ecological remediation measures in mining districts catalyzed a progressive restoration of RSEIs. This empirical evidence substantiates that individual driving factors, despite lacking statistical dominance in q value rankings, persistently shape RSEI dynamics through spatially heterogeneous response mechanisms.
In summary, the spatiotemporal patterns of the RSEI in Shanxi Province arise from the combined influence of multiple drivers with varying q values. Their dynamic interactions validate the operational principles of the society–economy–nature composite ecosystem framework. Consequently, the formulation of a multidimensional response strategy is imperative for effective ecological management. At the territorial space planning level, spatial conflicts among urbanization, agricultural production, and ecological protection land can be mitigated by delineating ecological protection red lines and optimizing the layout of major functional zones. At the regional development level, environmental access criteria based on the ecological carrying capacity should be established to balance the intensity of resource exploitation with the sustainable provision of ecosystem services. At the ecological restoration level, a collaborative model prioritizing natural restoration supplemented by artificial restoration should be implemented, integrating natural base features such as topography and hydrology with engineering measures such as vegetation reconstruction.
4.2. Multi-Factor Interaction Detection Analysis
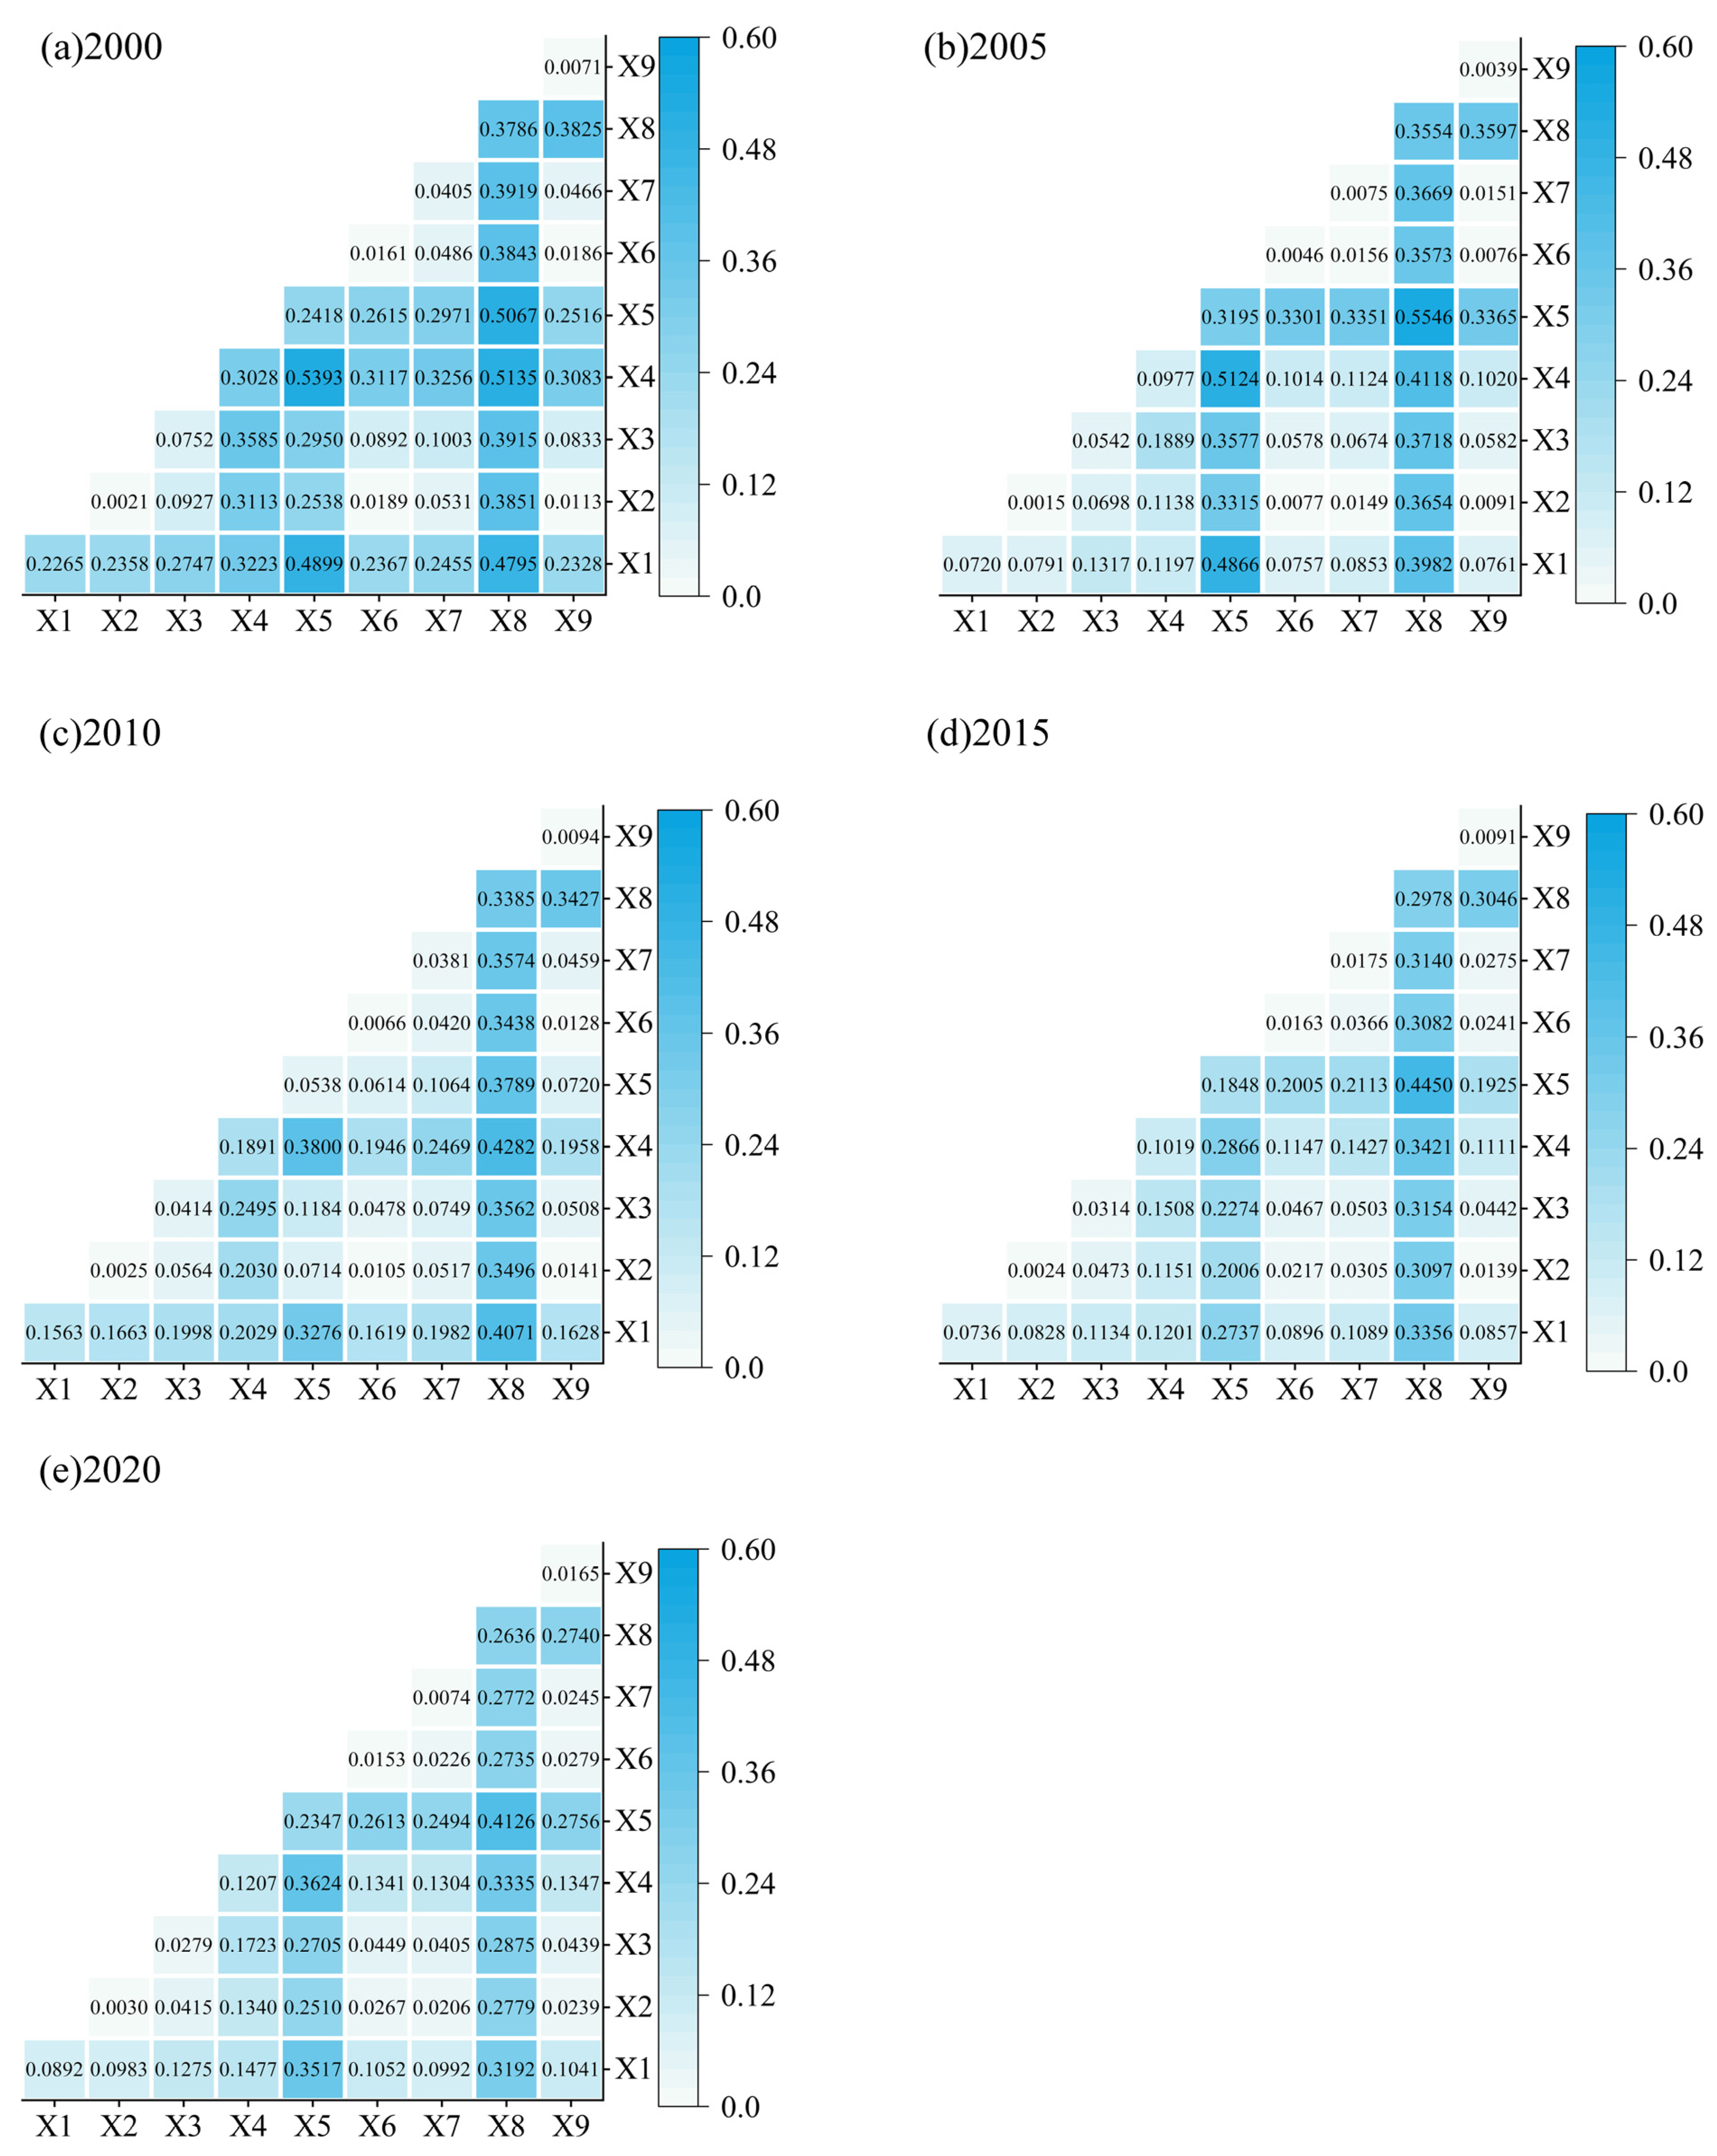
Overall, from 2000 to 2020, the interactions among the driving factors of the RSEI in Shanxi Province exhibited pronounced spatial heterogeneity, with q values predominantly distributed within the range of 0 to 0.6. High-value combinations (q > 0.4) predominantly occurred among natural factors (X1, X4, X5) and their interactions with land use (X8), unveiling the coupling effects between the natural substrate and human activities. Conversely, low-value combinations (q < 0.2) were concentrated among socioeconomic factors (X6, X7, X9), reflecting the spatial decoupling phenomenon within the subsystems of human activities. This gradient disparity validates the multi-scale driving mechanisms underlying the evolution of ecological environmental quality. The results of the multi-factor interaction probes are shown in
Figure 8.
Time-series analysis reveals that X1, X4, X5, and X8 constitute a stable high-interaction group. The elevation gradient constrains the distribution of vegetation types and the intensity of land development by reshaping the spatial differentiation of hydrothermal conditions. Meanwhile, the intra-annual fluctuations of the precipitation–air temperature combination directly influence the crop planting regime, driving the seasonal conversion between cultivated land and forest land. Changes in land use types, such as urbanization and deforestation, subsequently alter local climate and hydrological processes, amplifying the interaction effects among these factors. Collectively, these cross-factor interactions not only significantly govern the spatiotemporal differentiation patterns of the RSEI but also establish themselves as the dominant determinants in shaping its dynamics.
By contrast, the interactions among X2, X6, X7, and X9 are relatively weak. The impact of slope aspect on the ecological environment may be attenuated by other factors amidst the complex topography of Shanxi, resulting in an inconspicuous synergistic effect with other factors, as factors reflecting human socioeconomic activities, GDP, nighttime light intensity, and population density exhibit low interactions both among themselves and with other factors. This may suggest that, during this period, the spatial layout and intensity of socioeconomic activities in Shanxi Province have not yet established a tight linkage with ecological environmental elements or that there is a certain time lag in the ecosystem’s response to these socioeconomic activities.
Notably, the q values of key interaction combinations exhibit periodic fluctuation patterns. For instance, the interaction q value of X5 and X8 peaked at 0.55 in 2005, closely associated with the implementation of the Grain-for-Green Project during the same period. This intensified interaction directly amplified the spatial heterogeneity of RSEI gradation, demonstrating that interaction intensity governs regional ecological quality stratification. In other years, as the land use type structure was optimized or the precipitation pattern relatively stabilized, the interaction q value decreased. Consequently, weakened cross-factor couplings coincided with more homogeneous RSEI distributions, revealing the causal linkage between interaction dynamics and ecological pattern evolution. The interaction q values of socioeconomic factors, such as GDP, nighttime light intensity, and population density, also vary over time. With the transition of Shanxi Province’s economic development stage, the adjustment of the industrial structure, the advancement of urbanization, etc., will transform the GDP growth model, the spatial distribution of human activities, and the characteristics of population agglomeration, thereby influencing the interaction relationships among these factors and with others. This time-varying characteristic necessitates that ecological management strategies possess dynamic adaptability.
Based on the aforementioned findings, a trinity management framework encompassing “spatial constraint–process regulation–dynamic optimization” can be formulated. At the natural substrate constraint layer, a combined zoning model of elevation–precipitation–air temperature is established to demarcate differentiated land use thresholds. At the human activity regulation layer, the spatial allocation of “industry–residence–ecology” is optimized according to the coordinated evolution trend of GDP and population density. At the dynamic optimization layer, a real-time monitoring system for interaction q values is developed, integrating multi-source remote sensing and statistical data for monthly scale early warning. This methodological system can provide a scientific paradigm for the continuous enhancement in ecological environmental quality in Shanxi Province and regional sustainable development.
4.3. Analysis of the Coupling Relationship Between Land Use Types and the RSEI
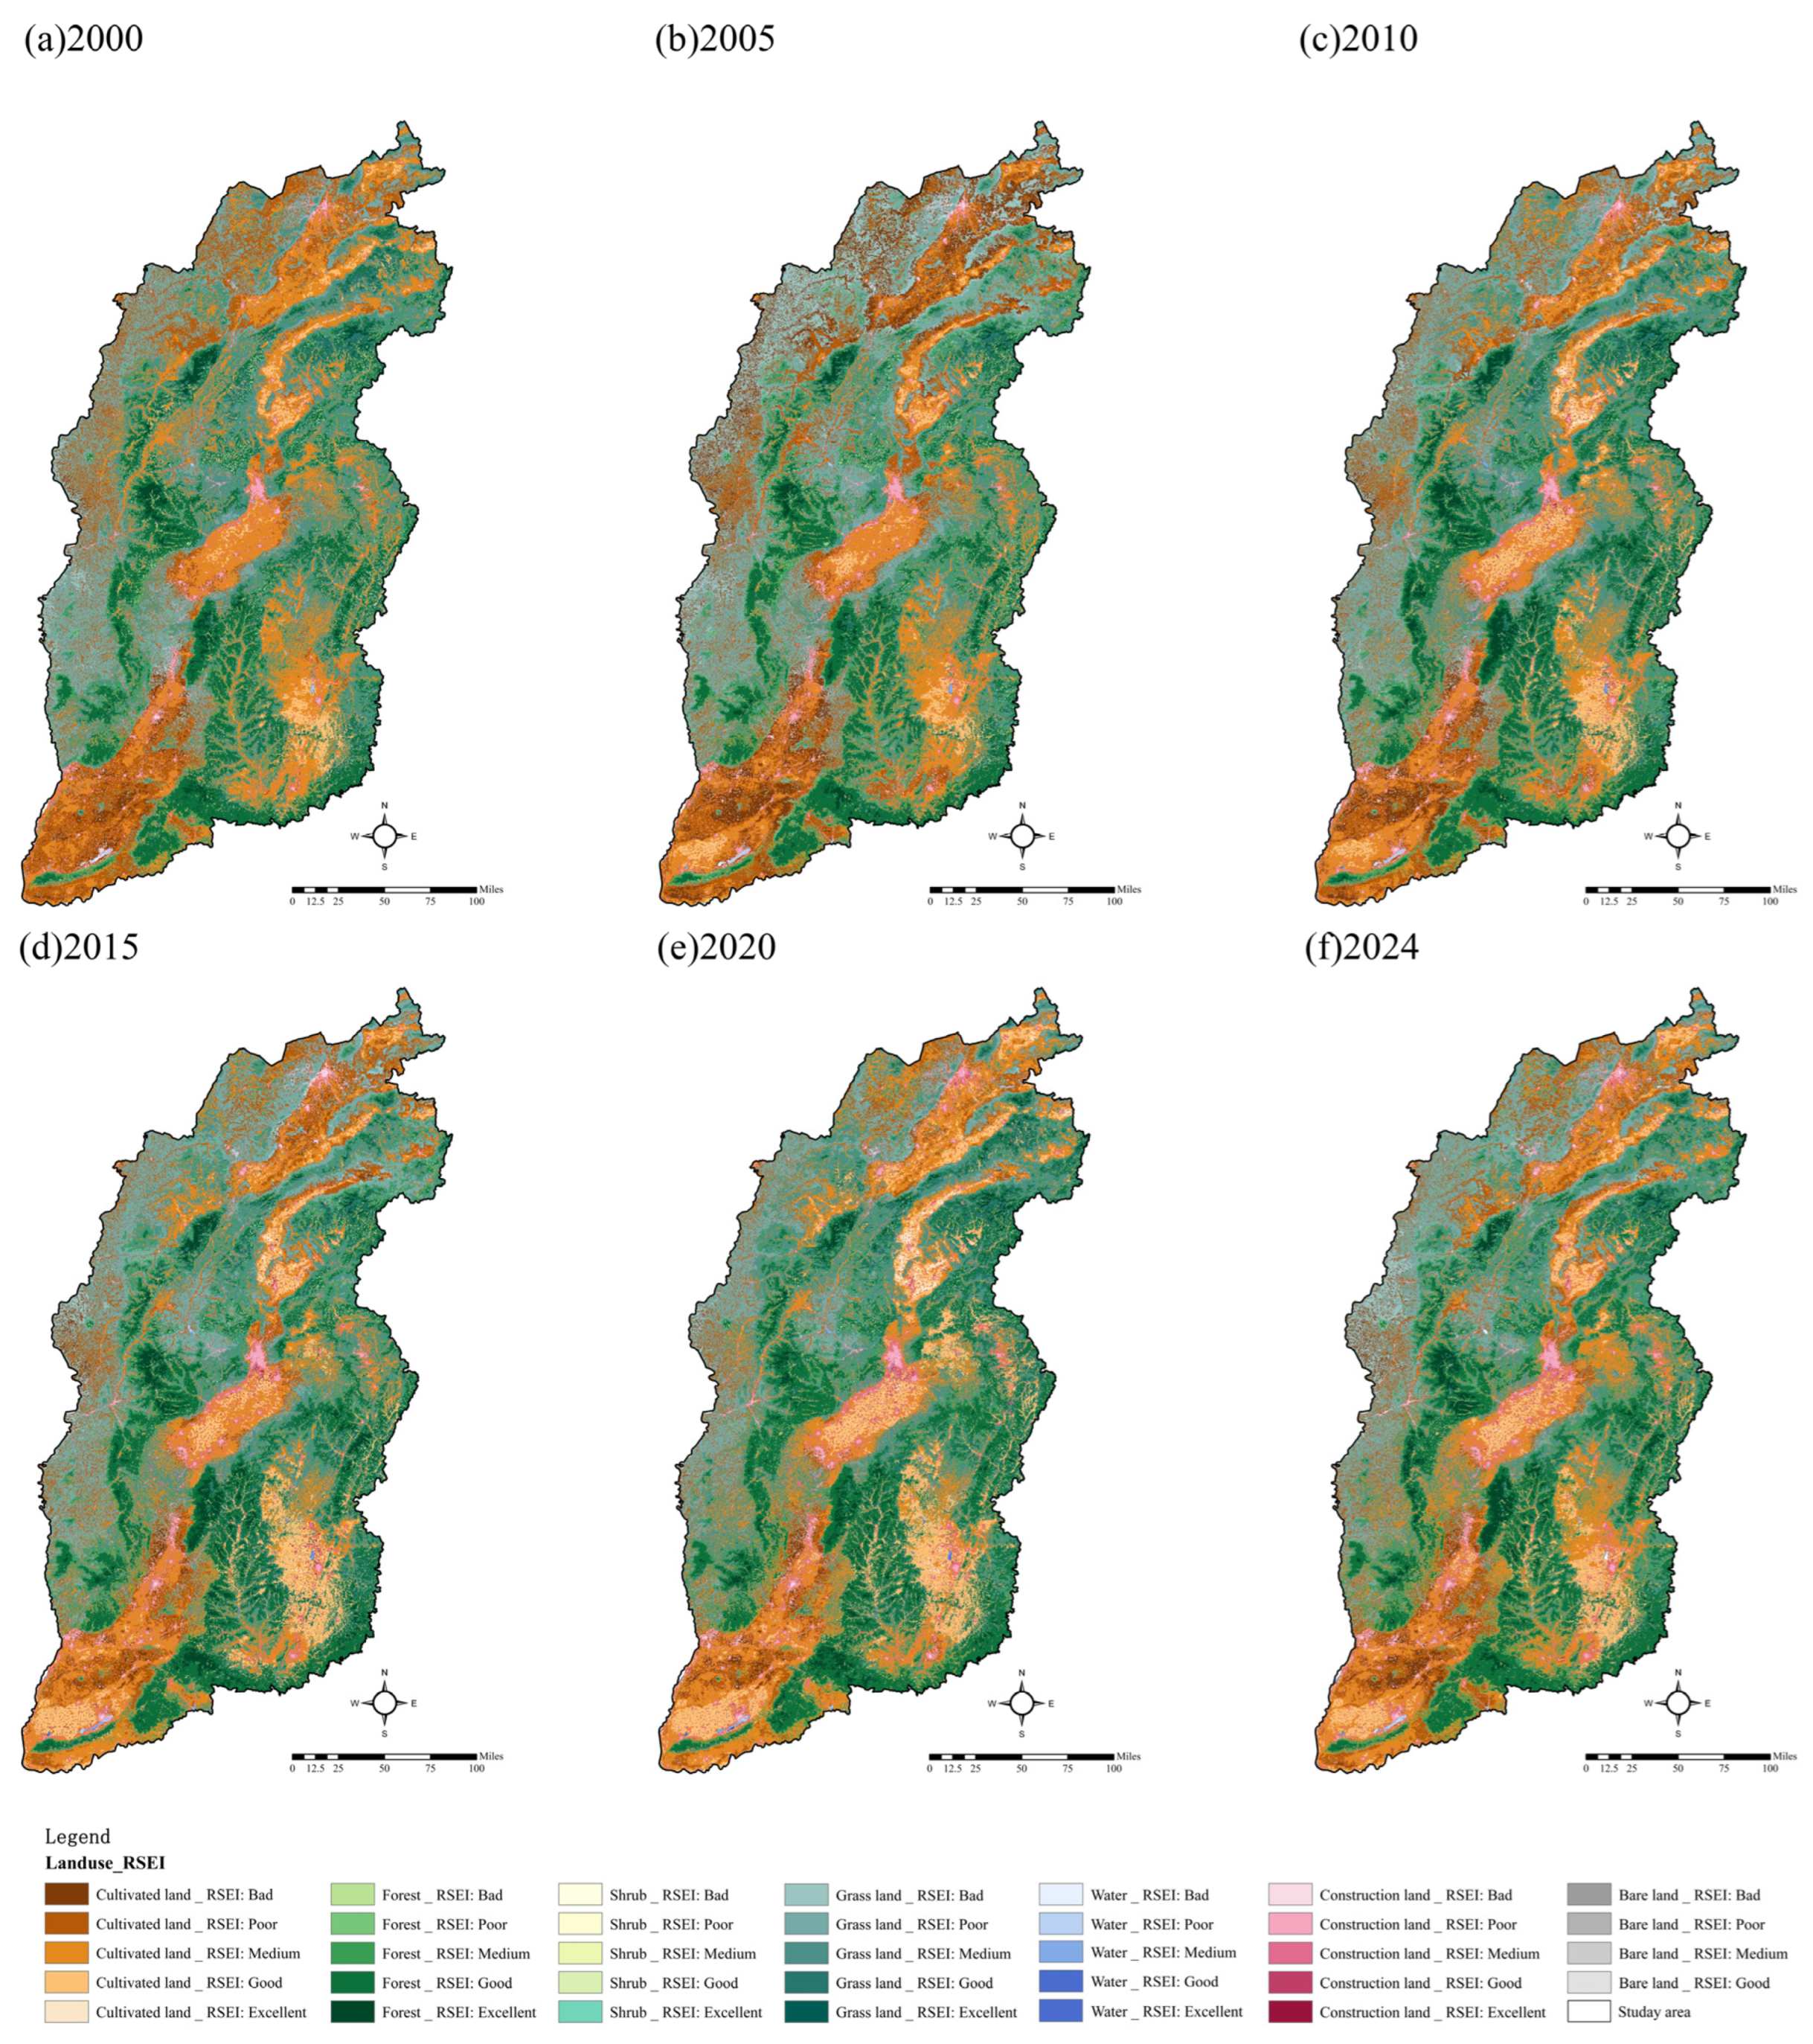
To systematically investigate the coupling mechanisms between land use dynamics and RSEI evolution in Shanxi Province, this section synthesizes six-phase land use datasets (2000, 2005, 2010, 2015, 2020, and 2024) with the previously established RSEI classification scheme to develop an integrated spatiotemporal analysis framework. The objective is to elucidate the correlation patterns between diverse land types and ecological environmental quality, thereby providing a scientific foundation for the optimal allocation of regional land resources. The results are depicted in
Figure A4 and
Figure 9. Due to the unavailability of land use type data for 2024 and considering the minimal changes in land use types over the two-year period, the land use type data for 2023 were employed as a substitute.
The ecological function of cultivated land predominantly manifested as poor and relatively poor grades in most years, with the area proportions of both remaining around 30%. This indicates that cultivated land generally exerts a negative influence on the ecological environment. Cultivated land exhibited the poorest performance in 2010 and 2015, with the combined area proportions of the poor and relatively poor grades reaching 78 and 77%, respectively, primarily attributed to excessive cultivation and non-point source pollution. In certain years, such as 2005 and 2020, cultivated land witnessed improvements, likely associated with the dissemination of water-saving irrigation technology. As a typical region of dryland farming in northern China, there is an urgent need to establish a model for the coordinated enhancement in the ecological productivity of cultivated land.
The ecological function of forests has undergone a discernible cycle of degradation and subsequent restoration. In 2000, benefiting from the preceding Grain-for-Green Project, forest land predominantly attained a good grade, with the area proportion reaching 65%. However, from 2003 to 2010, Shanxi Province was in the peak phase of coal exploitation, and from 2010 to 2015, the excessive development and planting of economic forests, among other factors, collectively led to forest degradation. The area proportion of the good grade continued to decline, while the poor and relatively poor grades increased. In 2020, the forest ecosystem underwent adjustment and management, yet it proved challenging to sustain. From 2020 to 2024, degradation recurred due to factors such as high temperatures. It is imperative to implement proactive management policies, such as establishing a sustainable forest ecosystem management paradigm through measures including increasing the proportion of mixed forests, allocating drought-resistant tree species, and constructing a three-dimensional monitoring network.
The shrub ecosystem demonstrates characteristics of robust resilience interspersed with periodic degradation. During the study period, 70–80% of the area maintained a good grade, highlighting its pivotal role as an ecological transition zone. Notable abnormal fluctuations occurred in 2005 and 2020, with the relatively poor grade surging to 90% and 50%, respectively. Spatiotemporal analysis reveals a significant spatial coupling with overgrazing and open-pit coal mining activities. Given the lengthy natural restoration cycle of shrubs, spanning 10–15 years, it is advisable to implement a four-tiered control strategy: prohibit human interference in the core area, limit the grazing intensity in the buffer zone, conduct replanting of drought-resistant shrubs in the experimental area, and complement it with a drone patrol system to enhance supervision efficacy.
The grassland ecosystem has traversed a typical trajectory of “destruction–restoration”. In 2000, it was predominantly at the medium grade, whereas in 2005, there was a precipitous decline in ecological quality, resulting from the synergistic effects of overgrazing and consecutive droughts. After 2015, the quality rebounded steadily, attributed to the precise reseeding guided by satellite remote sensing monitoring and the dynamic distribution mechanism of ecological reward and subsidy funds. It is recommended to promote the “livestock carrying capacity–vegetation coverage” linkage regulation model and establish a real-time early warning platform for the grassland health index.
The water area ecosystem exhibits pronounced fluctuations in quality. From 2000 to 2005, the poor grade remained dominant, primarily linked to the direct discharge of industrial wastewater and excessive groundwater abstraction. In 2010, the good grade soared to 94%, credited to the construction of 67 sewage treatment plants in the Fenhe River Basin and the implementation of the inter-basin water transfer project. In 2024, the poor grade rebounded to 74%, underscoring the arduous nature of water area ecosystem management. By promoting the establishment of a trinity management and control system encompassing “water quantity–water quality–water ecology” and piloting the establishment of a basin ecological compensation mechanism based on virtual water trading, the overall ecological quality of the water area ecosystem in Shanxi Province can be enhanced.
The bare land ecosystem has shown a transformative trend from negative dominance to positive transition. From 2000 to 2020, the proportion of the poor grade remained stable at approximately 90%, reflecting the long-standing challenges of soil erosion and impeded vegetation restoration. In 2024, the proportion of the medium–good grade exceeded 70%, potentially due to the synergistic effects of the silt dam groups on the Loess Plateau and the measures of natural enclosure. It is essential to establish an evaluation index system for the ecological resilience of bare land and prioritize the implementation of a microbial–plant combined restoration project in coal mining subsidence areas.
The ecological impact of construction land consistently exhibits characteristics of negative dominance. During the study period, it was predominantly at the poor and relatively poor grades, reflecting the ecological costs of rapid urbanization. In 2015, the medium grade increased anomalously to 67%, possibly associated with the local effectiveness of measures such as the sponge city pilot project and roof greening. It is recommended to establish a “five-line control” system: delineate the ecological security red line, set development intensity thresholds, enforce lifelong accountability for ecological impacts, prioritize the protection of the connectivity of biological habitats in the Fenhe River corridor, and progressively achieve harmonious coexistence between construction land and the ecological environment.
5. Conclusions
This study calculated the RSEI of Shanxi Province from 2000 to 2024 using the GEE platform and conducted a principal component analysis. The RSEI data of Shanxi Province in 2000, 2005, 2010, 2015, 2020, and 2024 were selected for spatial variation analysis, and the interannual migration paths of different grades were mapped. From 2000 to 2024, the RSEI of Shanxi Province was mainly at the medium grade, with the area proportion fluctuating between 30 and 40%. Trend analysis indicated that 48.87% of areas exhibited non-significant improvement, and 33.26% remained stable. However, Hurst-based predictions warned of trend reversal from improvement to degradation, particularly in the Datong Basin and Lüliang Mountain ecologically fragile zones. Centroid migration trajectories revealed a northeastward expansion of degradation paths into the Xin-Ding Basin, while improvement paths shifted westward along the Yellow River ecological belt. A geographical detector was used to explore the main driving factors of the RSEI in Shanxi Province. The results of the geographical detector indicate that land use type, air temperature, precipitation, elevation, and slope are the main driving factors of the RSEI in Shanxi Province. The interactions among different factors jointly shape the spatial differentiation characteristics of the RSEI in Shanxi Province. The distribution and interannual changes in different land types also have a certain degree of influence on the RSEI.
Systematic analysis utilizing the RSEI enables the identification of spatiotemporal differentiation patterns and driving mechanisms of ecological environmental quality in Shanxi Province. By elucidating the dynamic spatial evolution of ecological conditions, this approach provides a robust scientific foundation for formulating targeted ecological conservation policies. It should be noted that the current RSEI projections do not account for potential impacts of future policy innovations and technological advancements on ecological trajectories. Ongoing research initiatives will incorporate multi-scenario modeling approaches to refine predictive accuracy, thereby mitigating projection uncertainties that might misguide policymaking processes. To enhance environmental monitoring and assessment capabilities, future research should prioritize investigating the cascading effects of land use transitions on ecosystem services under climate warming, with a particular emphasis on empirical studies of the coupling mechanisms between mining area restoration and intensive agricultural land utilization. For identified ecological degradation hotspots, differentiated governance strategies—such as optimizing ecological compensation mechanisms and restructuring territorial spatial functions—should be implemented to maximize ecological restoration efficacy.


