Article

Study on the Effectiveness of Temporary Vegetation Measures on the Regulation of Runoff, Sediment Yield and Hydraulic Characteristics on the Spoil Heaps

1
The Research Center of Soil and Water Conservation and Ecological Environment, Chinese Academy of Sciences and Ministry of Education, Yangling 712100, China
2
University of Chinese Academy of Sciences, Beijing 100049, China
3
Changjiang River Scientific Research Institute of Changjiang Water Resources Commission, Wuhan 430010, China
4
Research Center on Mountain Torrent & Geologic Disaster Prevention of the Ministry of Water Resources, Wuhan 430010, China
5
Small and Medium-Sized Rivers and Mountain Torrent Disasters Observation and Research Station for Southwest Mountainous Areas, Ministry of Water Resources, Wuhan 430010, China
6
State Key Laboratory of Soil and Water Conservation and Desertification Control, College of Soil and Water Conservation Science and Engineering (Institute of Soil and Water Conservation), Northwest A&F University, Yangling 712100, China
7
Changjiang Water Resources Protection Institute, Wuhan 430051, China
*
Author to whom correspondence should be addressed.
Land 2025, 14(5), 951; https://doi.org/10.3390/land14050951 (registering DOI)
Submission received: 15 March 2025 / Revised: 15 April 2025 / Accepted: 21 April 2025 / Published: 28 April 2025

Abstract

:
Temporary vegetation measures are the most common methods for reducing soil erosion of spoil heaps during construction; however, their regulatory mechanisms on soil and water loss have not been sufficiently studied. This study compared the impacts of five temporary vegetation measures (turfing 300 cm (TF-300 cm), turfing 75 cm (TF-75 cm), grass seeding 300 cm (GS-300 cm), grass seeding 75 cm (GS-75 cm), and synthetic turf (ST)) on the dynamic processes of runoff and sediment yield as well as hydraulic parameters under simulated rainfall experiments. A 30° bare slope (BS) was set up as the control. The results indicated that (1) all measures delayed the onset of runoff by 57–233%, effectively decreasing the runoff rate and the average erosion rate by 45–49% and 91–99%, respectively; (2) these measures reduced the average Reynolds number by 45–52% and diminished both the average runoff shear force and runoff power by 44–60%; and (3) the effectiveness in reducing runoff and sediment loss ranked as follows: turfing > synthetic turf > grass seeding, When these measures are applied locally to the bottom 25% of the slope, the efficiency of runoff and sediment reduction can exceed 89% for the entire slope. Our findings provide valuable insights for designing temporary vegetation measures in construction.

1. Introduction

Currently, rapid economic development has intensified human-induced soil erosion resulting from significant disturbances to the land surface, particularly due to activities such as road construction, urban demolition, and mining [1,2,3]. These anthropogenic disturbances not only drastically alter the original topography but also create large accumulations of mixed soil and rock material, referred to as spoil heaps [4]. Due to their steep slopes, loose structures, low vegetation cover, and complex material composition, spoil heaps are highly susceptible to severe soil erosion, which leads to land degradation and ecological damage [5,6,7]. Furthermore, during heavy rainfall, they pose an increased risk of geological disasters such as landslides and debris flows [8,9,10]. Given the serious environmental threats and risks to human safety associated with spoil heaps, there is an urgent need to investigate their erosion mechanisms and develop key technologies for controlling soil erosion and mitigating its effects [11].
Numerous studies have been carried out to explore the erosion mechanism of spoil heaps, especially after the 21st century. It is widely recognized that the key factors influencing spoil heap erosion encompass rainfall (runoff), topography, soil quality, material composition, and surface cover. Rainfall factors consist of duration, intensity, and distribution [12,13,14]. Topographical factors involve slope, slope length, and slope type [13,15,16,17]. Soil quality mainly denotes the various soil types in different regions [18,19]. Material composition primarily pertains to the substances in the subsurface of spoil heaps, such as soils and gravels, encompassing their content, particle size, distribution, and type [19,20,21,22]. Surface cover (microtopographic transformation) primarily entails the protective measures implemented, including engineering measures (fish-scale pits, level terraces), vegetation measures (grass seeding, vegetative hedgerows), and temporary measures (dust screen, slit traps) [23,24,25]. Rainfall, soil quality, and material composition are typically inherent or external characteristics of the spoil heaps that are challenging to modify. In contrast, topography is associated with the construction process and governed by relevant standards. Consequently, the primary approach to modifying spoil heap erosion through human intervention lies in altering the surface cover conditions.
Vegetation measures are initiated following the main project’s completion, while temporary measures are essential for reducing soil erosion during construction [26,27,28]. Temporary measures include dust screens, slit traps, sediment deposition, and drainage [29,30]. Specifically, dust screens involve dust nets and UV-protection nets, embankments utilize bagged soil, and sediment deposition with drainage primarily consists of earthworks. Temporary vegetative measures, as a type of dust screen (e.g., turfing, synthetic turf, and grass seeding), are commonly employed in engineering construction [31]. These measures effectively reduce soil erosion and diffused pollution while delivering enhanced ecological benefits [32]. Existing studies have shown that grass seeding can achieve substantial anti-erosion benefits within a short period [4]. The grass roots can enhance soil structure stability and increase water infiltration [33]; the grass stems contribute to greater surface roughness and water flow tortuosity [34]; and the grass cover protects the soil surface from the impact of raindrops [35]. Additionally, the erosion control effectiveness of grass increases with higher coverage rates [36]. Compared with grass seeding, which requires several months after broadcasting for the grass to mature and achieve water and soil conservation benefits, turfing can immediately provide effective vegetation cover and surface stability, preventing soil erosion and even serving as a component of a permanent vegetative measure. Nevertheless, turfing is relatively expensive. As a lower-cost alternative, synthetic turf can also reduce soil erosion, but it lacks ecological comprehensiveness and long term sustainability. However, little attention has been paid to the effect of temporary vegetation measures on the soil erosion of steep spoil heaps. In current practical engineering applications, there is no universal standard for the selection of these three types of temporary vegetative measures. Additionally, research on their impacts on runoff and sediment reduction remains unclear.
This study focused on steep spoil heaps and evaluated the effectiveness of temporary vegetation measures, including turfing, synthetic turf, and grass seeding. The aims of this study were to investigate the water and sediment retention capabilities of all measures, to analyze their impact on hydraulic parameters, and to delve into the underlying erosion protection mechanisms. These results may offer valuable insights for selecting temporary vegetation measures for spoil heaps.

2. Materials and Methods

2.1. Experimental Soil

Soil samples were collected from Shenzhen. The soil, categorized as sandy loam based on the USDA texture classification system, has an organic matter content of 2.59 g kg−1, with a particle size distribution consisting of 71.39% sand (>0.02 mm), 20.13% silt (0.002–0.02 mm), and 8.48% clay (<0.002 mm) [37]. Initially, the soil was air-dried outdoors and subsequently passed through a 10 mm sieve to prepare it as fill material.

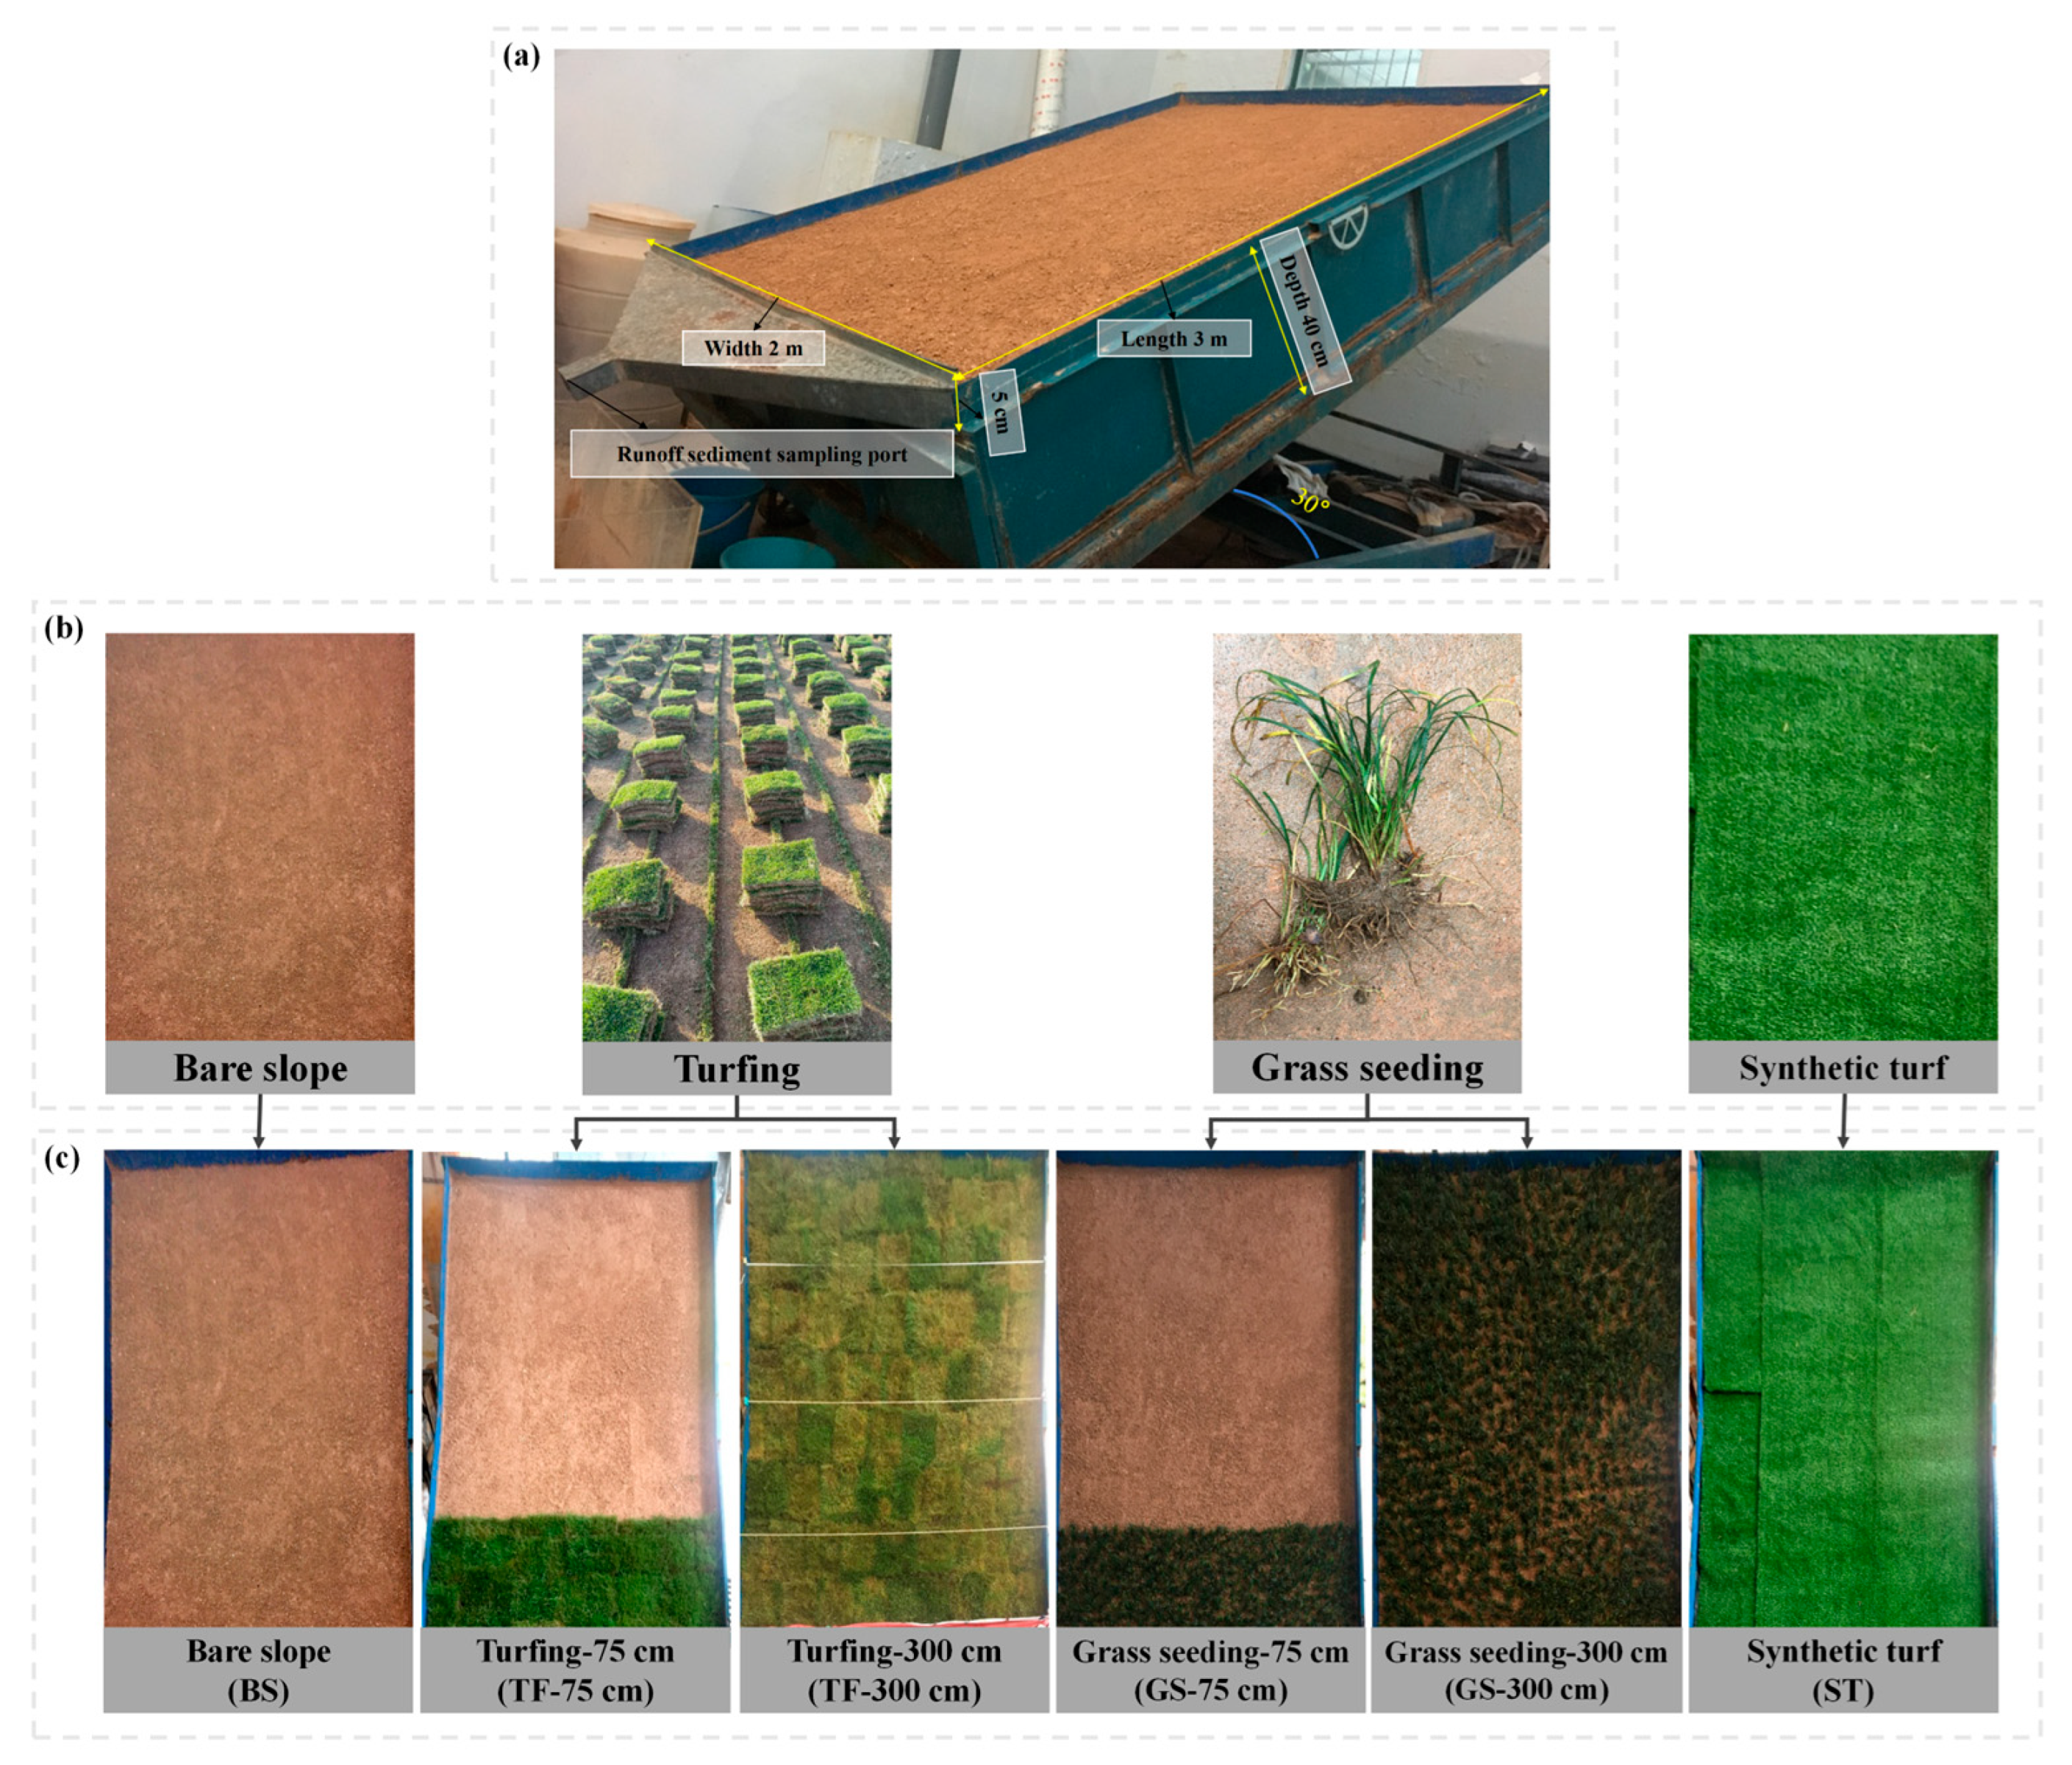
2.2. Experimental Design and Procedures

The laboratory simulated rainfall experiments were conducted in the artificial rainfall simulation hall of the Yangtze River Academy of Sciences. Through field survey and statistical analysis of the project’s spoil heaps, a self-made steel flume model measuring 3.00 m × 2.00 m × 0.45 m (length × width × depth) was utilized, with the actual fill depth aligned with the outlet of the trough at 0.40 m (Figure 1a). The bulk density of the laboratory-simulated spoil heap was determined to be 1.25 g cm−3 based on field survey results. To simulate natural rainfall infiltration, a 5 cm layer of natural sand was placed at the bottom of the experimental flume, followed by a three-layer fill: the bottom two layers were 15 cm and 10 cm deep, respectively, while the top layer was 10 cm deep. The bottom two layers were compacted, whereas the top layer was smoothed without compaction. Prior to adding each layer, the underlying layer was scarified to prevent separation and potential sliding.
A field survey was conducted on 351 spoil heaps of construction projects in Shenzhen during 2019–2020. The slope gradient primarily ranged from 15° to 48°, so a slope gradient of 30° was chosen in this study to represent typical conditions.
This study designed 6 experimental groups. The bare slope underwent a rainfall experiment after 24 h of natural settlement following filling. Three temporary vegetation measures were implemented: turfing, grass seeding, and synthetic turf (Figure 1b).
The turfing measure utilized mature zoysia japonica sod with a thickness of 5 cm, which was pre-grown and cut into rectangles measuring 40 cm × 35 cm. The sod pieces were laid tightly on the bare slope, ensuring 100% surface coverage, with a planting density of approximately 200 plants·m−2 (Figure 1c). The selected grass for grass seeding was ophiopogon japonicus, with a canopy height of approximately 10 cm and a root depth of 3 cm. The seeding was implemented with a uniform spacing of 10 cm × 10 cm, which corresponds to an approximate planting density of 100 plants·m−2, ensuring a uniform and optimal ground cover. The synthetic turf employed in the experiments was manufactured from materials such as polyethylene and polypropylene. In addition to a backing thickness of approximately 1 cm, the artificial grass fibers had a height of about 1.5 cm and a high fiber density (approximately 16,500 stitches·m−2). The turf was assembled from two pieces of 80 cm × 300 cm and one piece of 40 cm × 300 cm and laid smoothly on the slope’s surface to mimic a realistic vegetative cover. The procedures for turfing and grass seeding were identical, covering 75 cm at the bottom. After measures were applied, the spoil heap was allowed to rest for 24 h before the rainfall experiment commenced. Following each experimental session, the moisture depth of the soil layers was assessed for replacement. After completing one experiment, the stockpile was refilled, and the corresponding measures were reinstated before starting the next experiment, continuing in this sequence.

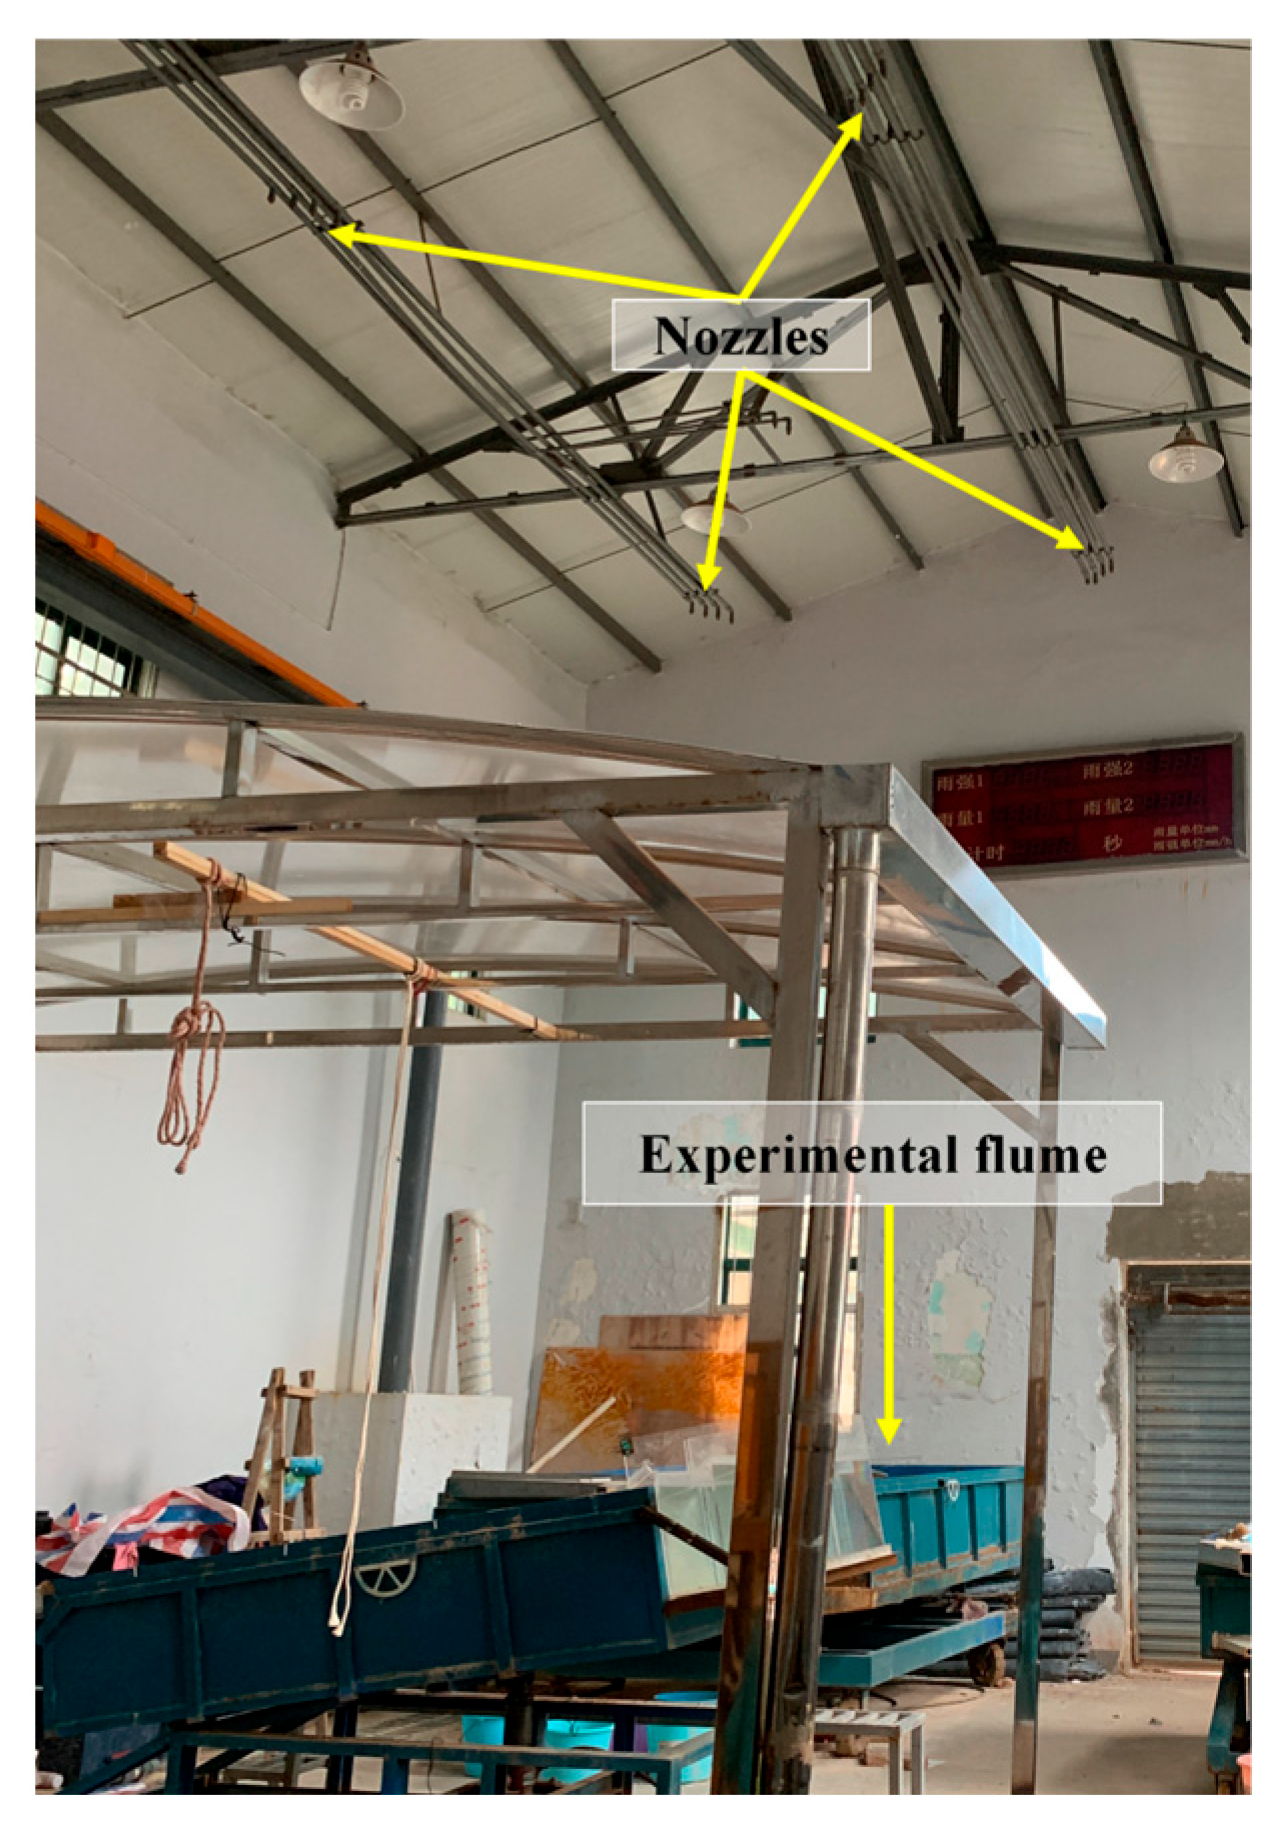
2.3. Simulated Rainfall Experiments

The rainfall simulation was conducted using a sprinkler-type rainfall simulator system, vertically mounted at a height of 6.0 m above the center of the experimental flume, enabling raindrops to reach terminal velocity [38] (Figure 2). Four nozzles were symmetrically arranged at the four corners of the flume to ensure uniform water distribution [29]. Following systematic calibration, the rainfall simulation system demonstrates adjustable precipitation intensity within the range of 0.5–3.5 mm·min−1. The spatial uniformity of rainfall distribution, quantified by Christiansen’s Uniformity Coefficient, exceeds 85%, thereby satisfying the ASTM standard threshold for controlled experimental conditions [39,40]. In order to determine the runoff and soil erosion responses, a rainfall intensity of 1.45 mm·min−1 was applied since this intensity has been previously used in experimental research and represented natural events based on long term meteorological data from Shenzhen [29,41].
Each rainfall event is configured to last for 45 min after runoff initiation. During the first 3 min, two sediment runoff samples are collected every minute, followed by collections every 3 min from 3 to 15 min and every 5 min from 15 to 45 min, resulting in a total of 26 samples per event. One runoff sediment sample is collected using a 1 L graduated cylinder, while another is collected in a 5 L plastic bucket. The graduated cylinder records volume, sampling time, and weight, while the plastic bucket records sampling time and weight. The runoff sediment collected in the plastic bucket is allowed to stand for 6 h; the supernatant is then decanted, and the sediment is transferred to an aluminum container. This container is placed in a 105 °C oven for over 24 h to determine weight, facilitating the calculation of erosion rates, which are subsequently used to calibrate runoff rates [36,42]. Simultaneously, two observation cross-sections, each 0.8 m long, are established on the slope to measure flow velocity, depth, and width. Flow velocity is determined using the potassium permanganate method, with surface velocity multiplied by a correction factor of 0.75 to obtain the final velocity [43]. Flow depth and width are measured using a thin steel ruler and corrected for flow rate, with water temperature recorded during each event.

2.4. Data Analysis

(1) Froude number ( F r ). The Froude number is a quantitative criterion for distinguishing between subcritical and supercritical flow regimes and was defined as [8]:
Fr = V g · h    
where V is the velocity of runoff (m s−1); g is the acceleration of gravity (9.8 m s−2); h is the flow depth (m).
(2) Reynolds number ( R e ). Reynolds number delineates the flow pattern of runoff, acting as an indicator to assess the magnitude of runoff turbulence, and was calculated by [44]:
R e = V × R υ , υ = 1.775 × 1 0 6 1 + 0.0337 T + 0.000221 T 2
where υ is the kinematic viscosity (m2 s−1); T is the water temperature (°C); R is the hydraulic radius (m), and because the slope flow is a thin layer flow, R can be replaced by h .
(3) Darcy-Weisbach resistance coefficient ( f ). The Darcy–Weisbach resistance coefficient represents the total resistance encountered by runoff as it moves downslope, attributable to the drag forces exerted by the water-soil interface, which was calculated by the expression [45]:
f = 8 · g · R · J V 2
where J is the hydraulic slope (m m−1), can be approximated by the slope’s sin value.
(4) Runoff shear stress ( τ ). Runoff shear stress represents the scouring power exerted by runoff on the slope surface during flow and was calculated as follows [46,47,48]:
τ = p w · g · R · J
where   p w is the mass density of muddy water (kg m−3)
(5) Runoff power ( ω ). Runoff power represents the rate of change of potential energy per unit area of the water body over time, which was given by [45,49]:
ω = τ · V
The difference analysis between the average runoff rate, average flow velocity, average soil loss rate, average Reynolds number, average Froude number, average resistance coefficient, average runoff shear stress, and average runoff stream power among different underlying surfaces was implemented by one-way ANOVA (α = 0.05) using SPSS 16.0 (IBM Corp., Armonk, NY, USA). Figures were conducted by Origin 8.5 software (OriginLab Corp., Northampton, MA, USA) and PowerPoint 2024 software.

3. Results

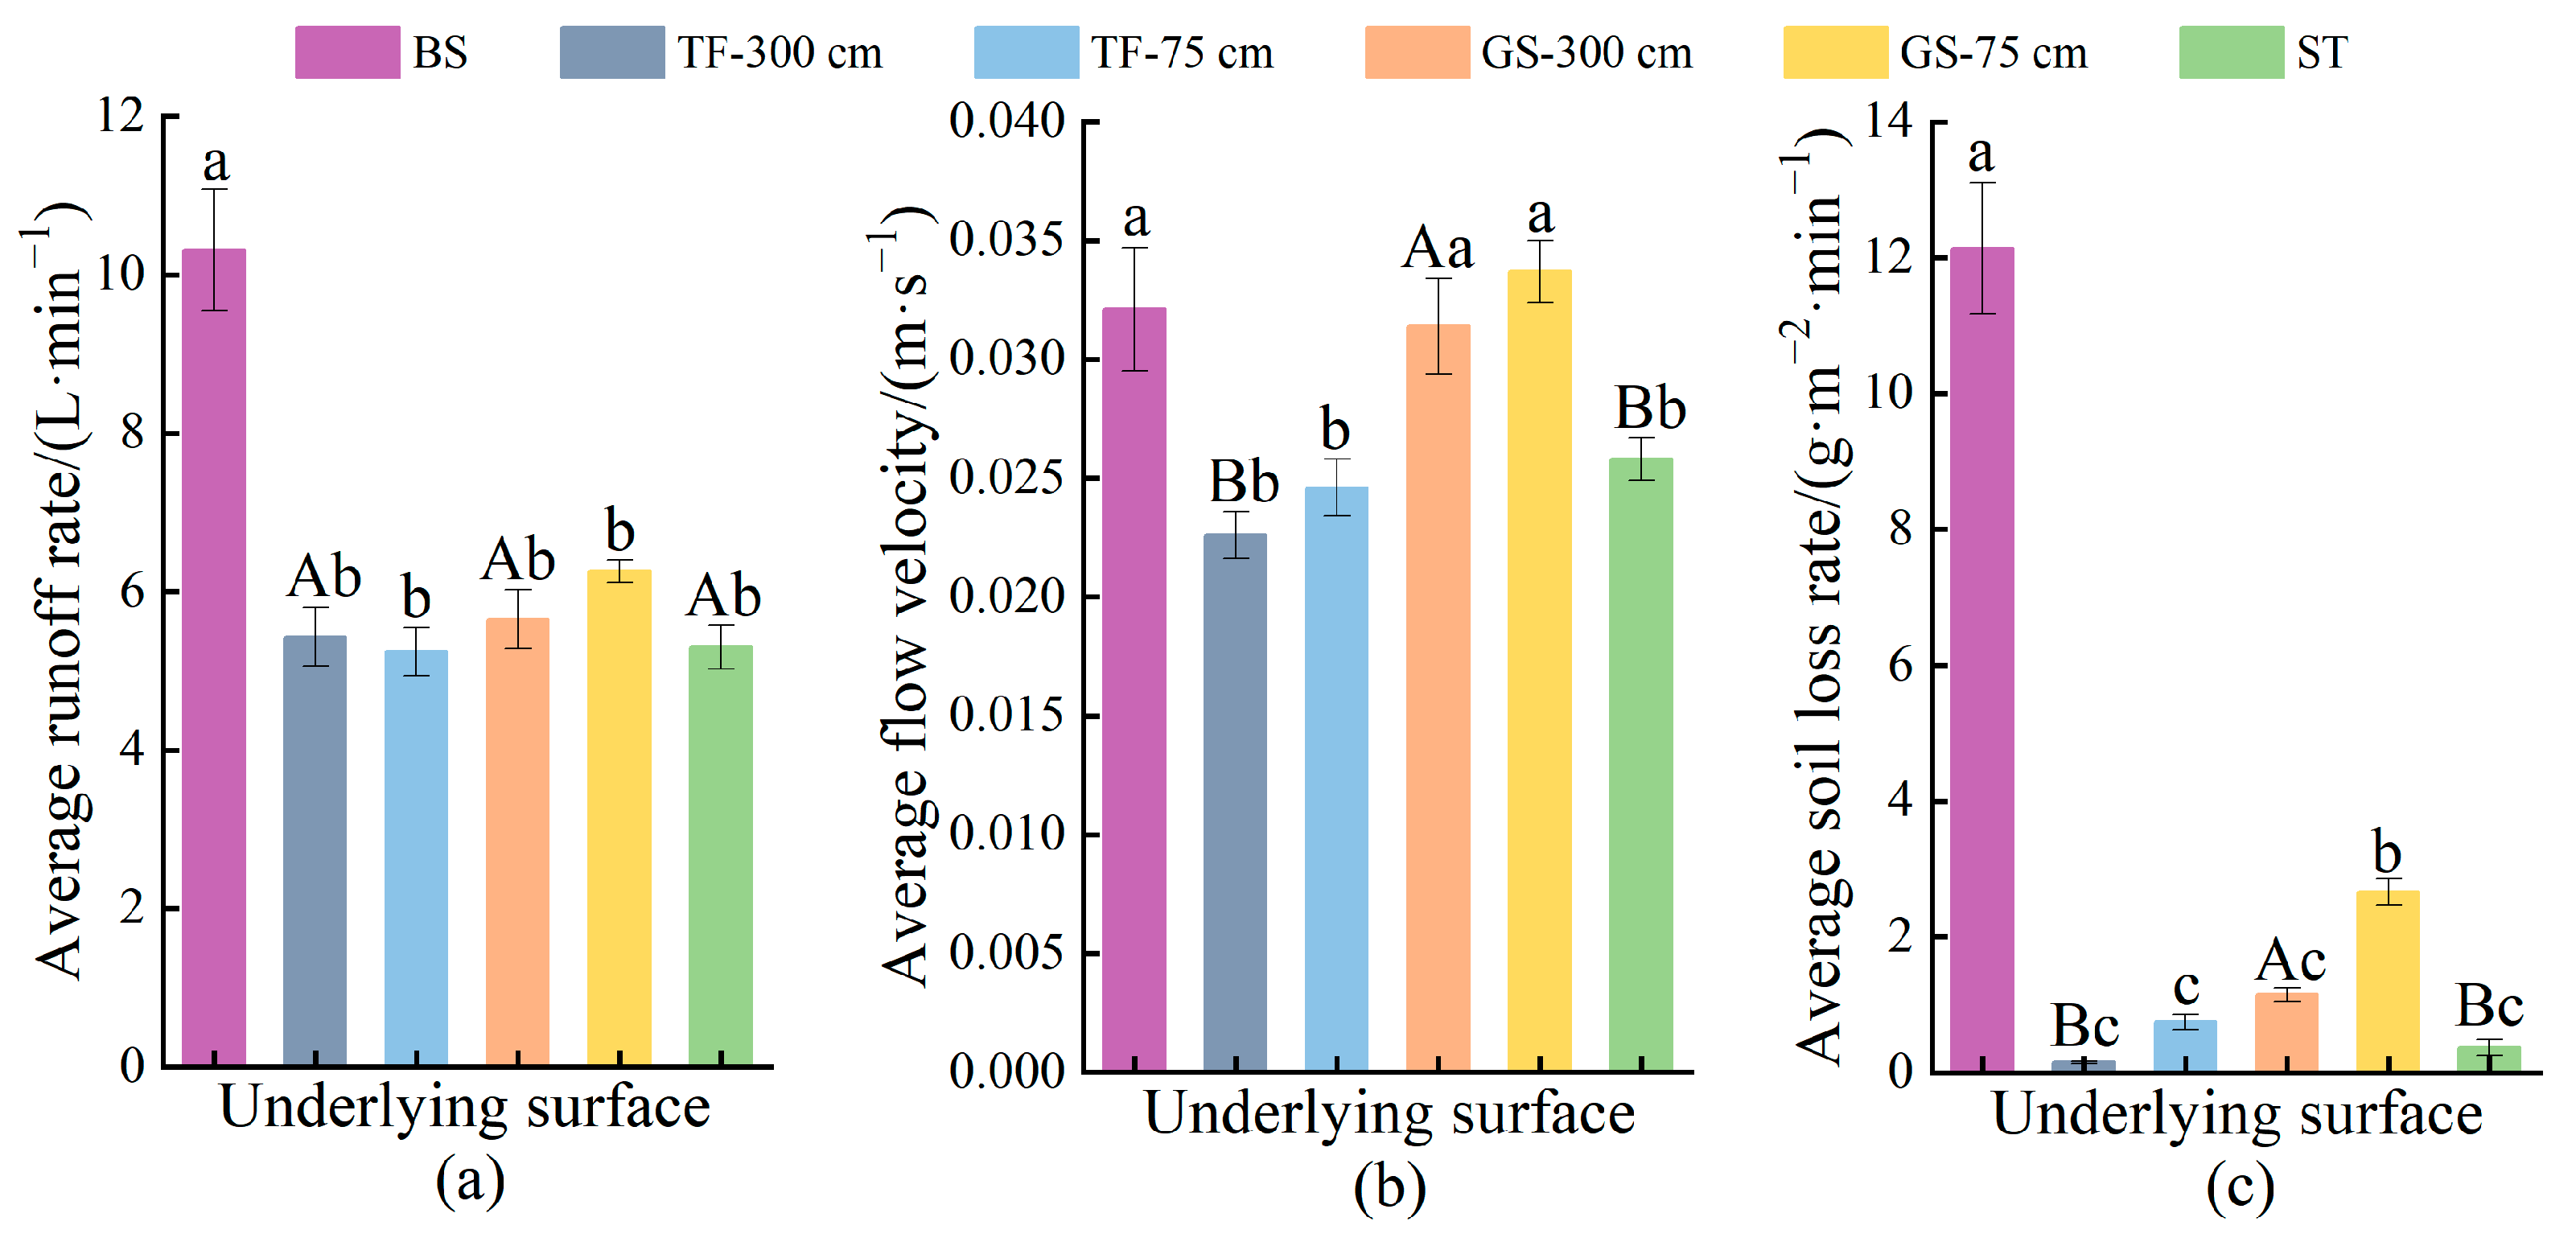
3.1. Characteristics of Runoff and Sediment Yield

The three types of temporary vegetation measures, namely turfing, grass seeding, and synthetic turf, could all effectively delay the onset of runoff on slopes (Figure 3a). Among these measures, turfing provides the most significant benefits, demonstrating a delay of 232.89% compared to the onset of runoff production on bare slope (2.98 min). The delayed benefits of grass seeding and synthetic turf are similar, ranging from 56.71% to 57.05%. Even when implemented only at the bottom of the slope (75 cm), turfing or grass seeding can still effectively delay runoff occurrence. However, the delayed benefits, compared to full-slope coverage, decrease by 112.08% and 36.91%, respectively. This means that implementing turfing and grass seeding only at the bottom 75 cm achieves 51.87% and 35.29% of the benefits achieved with full-slope implementation.
The instantaneous runoff rates of bare slope and three types of temporary vegetation measures exhibited a general trend of “increasing-relatively stable” as the duration of runoff production progressed. However, the turning point of the bare slope (15 min) took longer to stabilize compared to the vegetation measures (9 min). The instantaneous runoff rates of bare slope ranged from 27.82% to 179.26% and from 2.10% to 8.64% in the two stages. On the other hand, the variations in turfing, grass seeding, and synthetic turf during the incremental stage were from 16.20% to 62.72%, from 30.58% to 130.24%, and from 27.98% to 86.89%, respectively. In the stabilized stage, the variations were from 0.38% to 18.93% for turfing, from 0.38% to 18.93% for grass seeding, and from 10.09% to 21.12% for synthetic turf. The average values of instantaneous runoff rate in both stages showed the following order: bare slope > grass seeding > synthetic turf > turfing. This implies that implementing vegetation measures not only reduces runoff from the spoil heap slope but also stabilizes the runoff producing process. Furthermore, in the case of turfing, the average value of instantaneous runoff rate increased by 14.28% and 4.11% with a bottom 75 cm implementation compared to a 300 cm implementation. For grass seeding, the increase was 1.22% and 2.11%, respectively. In other words, implementing turfing or grass seeding on the bottom 75 cm of the spoil heap slope can achieve more than 80% of the runoff reduction benefits attained with the corresponding measures implemented on the entire slope.
Bare slope exhibited a general trend of “fast increasing—relatively stable”, while turfing, grass seeding, and synthetic turf displayed a trend of “slow increasing—relatively stable” (Figure 3b). The turning point occurred approximately 15 min into the runoff, and during the first 2 min of runoff production, the instantaneous runoff rate was higher in the measured plots compared to the bare slope. Subsequently, the instantaneous runoff rate of the bare slope surpassed that of the measured plots, except for the grass seeding condition, where the instantaneous runoff rate remained higher than that of the bare slope in the later stage of runoff production. When calculating the average value of instantaneous runoff velocity in the relative stabilization stage, the order observed was bare slope (0.0381 m·s−1) > grass seeding 300 cm (0.0378 m·s−1) > synthetic turf (0.0283 m·s−1) > turfing 300 cm (0.0255 m·s−1). The average instantaneous runoff rate reduction benefit during the stabilization phase was only 0.79% for the grass seeding test, significantly smaller than the 25.76% and 33.07% reduction seen in the synthetic turf and turfing tests, respectively. Implementing either grass seeding or turfing measures at the bottom of the spoil heaps can also reduce the transient runoff velocity, with a difference in the reduction benefit compared to full-slope measures ranging from 0.95% to 6.52%. In other words, implementing these measures at the bottom of the spoil heap achieves more than 80% of the runoff velocity reduction obtained with the full-slope measures.
The changes in the instantaneous erosion rate of the spoil heaps over time indicate that the implementation of turfing, grass seeding, or synthetic turf can reduce slope surface erosion during rainfall (Figure 3c). The erosion rate of the bare slope exhibited a trend of “decreasing-increasing-fluctuating”, whereas the erosion rate of the spoil heaps with temporary vegetation measures remained relatively stable after 3 min of runoff. Therefore, implementing temporary vegetation measures not only reduces slope erosion in the spoil heaps but also makes the erosion process more gradual. The instantaneous erosion rates of bare slope varied from 5.25 to 16.57 g·m−2·min−1, representing a range of 25.85% to 215.59%. For turfing, grass seeding, and synthetic turf, the transient erosion rate ranged from 0.05 to 0.32 g·m−2·min−1, 0.72 to 1.81 g·m−2·min−1, and 0.06 to 1.60 g·m−2·min−1, respectively, with variations ranging from 2.09% to 545.34%, 17.86% to 152.19%, and 105.46% to 2411.70%. Comparing the instantaneous erosion rates among the three measures, the overall trend was grass seeding > turfing (or synthetic turf), meaning that the erosion protection effect of turfing (with an average reduction benefit of 98.70%) or synthetic turf (95.78%) on the spoil heap slope was higher than that of grass seeding (88.96%). The instantaneous erosion rate changes observed from implementing turfing and grass seeding measures only at the bottom of the spoil heaps ranged from 0.22 to 1.41 g·m−2·min−1 and 1.94 to 4.23 g·m−2·min−1, respectively, which were lower than those of bare slope. However, the average reduction benefits achieved by implementing these measures at the bottom of the spoil heaps increased by 3.00 to 6.79 times for TF-300 cm and 2.06 to 2.70 times for GS-300 cm compared to BS. Additionally, the average reduction benefits obtained from implementing these measures at the bottom accounted for a higher percentage of the erosion protection provided by full-slope implementation (accounting for 95.21% and 83.12% of the full-slope erosion protection, respectively).
From the average values, it is evident that the average runoff rates associated with turfing, grass seeding, and synthetic turf were all lower than those observed on bare slopes (Figure 4a). However, the differences among three temporary vegetation measures were marginal, showing reductions of 47.33%, 45.20%, and 48.59%, respectively. The variation in reduction benefits was minimal, amounting to less than 5%. Notably, the average runoff rate achieved with only bottom turfing (5.24 L·min−1) was marginally less than that of turfing implemented across the entire slope (5.43 L·min−1). Despite a 10.80% increase in the average runoff rate when utilizing turfing exclusively at the bottom in comparison to turfing across the whole slope, it remains evident that this localized approach can significantly reduce the overall runoff rate.
The three temporary vegetation measures (turfing, grass seeding, and synthetic turf) exhibited less effective flow velocity regulation compared to the substantial runoff control impact of plants. The average flow velocity were ranked as follows: bare slope (0.0321 m·s−1) > grass seeding (0.0314 m·s−1) > synthetic turf (0.0258 m·s−1) > turfing (0.0226 m·s−1) (Figure 4b). The reductions in average flow velocity achieved by turfing, grass seeding, and synthetic turf were 29.59%, 2.18%, and 19.63%, respectively. Despite an 8.85% increase in the average runoff velocity when implementing turfing solely at the bottom of the slope in contrast to turfing across the entire slope, it still resulted in a 23.36% decrease compared to the bare slope conditions. Similarly, grass seeding exclusively at the slope’s base led to a 7.32% increase in average runoff velocity compared to full-slope grass seeding and even a 4.98% increase compared to bare slope conditions. In essence, the efficacy of using synthetic turf and turfing for regulating flow velocity on the slope proved more pronounced than grass seeding.
In terms of runoff rate and flow velocity regulation, the three temporary vegetation measures had a lesser impact compared to their substantial effects on sediment production on the slope. The erosion rate reduction benefits of turfing, grass seeding, and synthetic turf were 98.76%, 90.53%, and 96.95%, respectively (Figure 4c). When considering erosion reduction, the order of effectiveness was turfing > synthetic turf > grass seeding, with turfing and synthetic turf showing similar and high efficacy levels exceeding 95%. Implementing turfing and grass seeding solely at the base of the spoil heaps resulted in a significant increase of 400% and 131.30%, respectively, compared to full-slope implementation. However, these localized measures still led to a remarkable decrease in erosion rates by 93.82% and 78.09%, respectively, when compared to the bare slope.
The analysis of variance revealed significant differences in the average runoff rate and erosion rate of bare slope compared to all five measures (p < 0.05). Interestingly, there was no significant distinction in average runoff rates between turfing, grass seeding, and synthetic turf (p > 0.05); however, the average erosion rate of grass seeding differed significantly from the other two methods (p < 0.05). While the variance in average runoff rates between bare slope and grass seeding intervals was nonsignificant (p > 0.05), it was significant between turfing areas and synthetic turf, as well as between grass seeding intervals and the remaining two methods (p < 0.05). Notably, no significant differences (p > 0.05) were observed between turfing and grass seeding in the two distinct tests.

3.2. Hydraulic Parameters

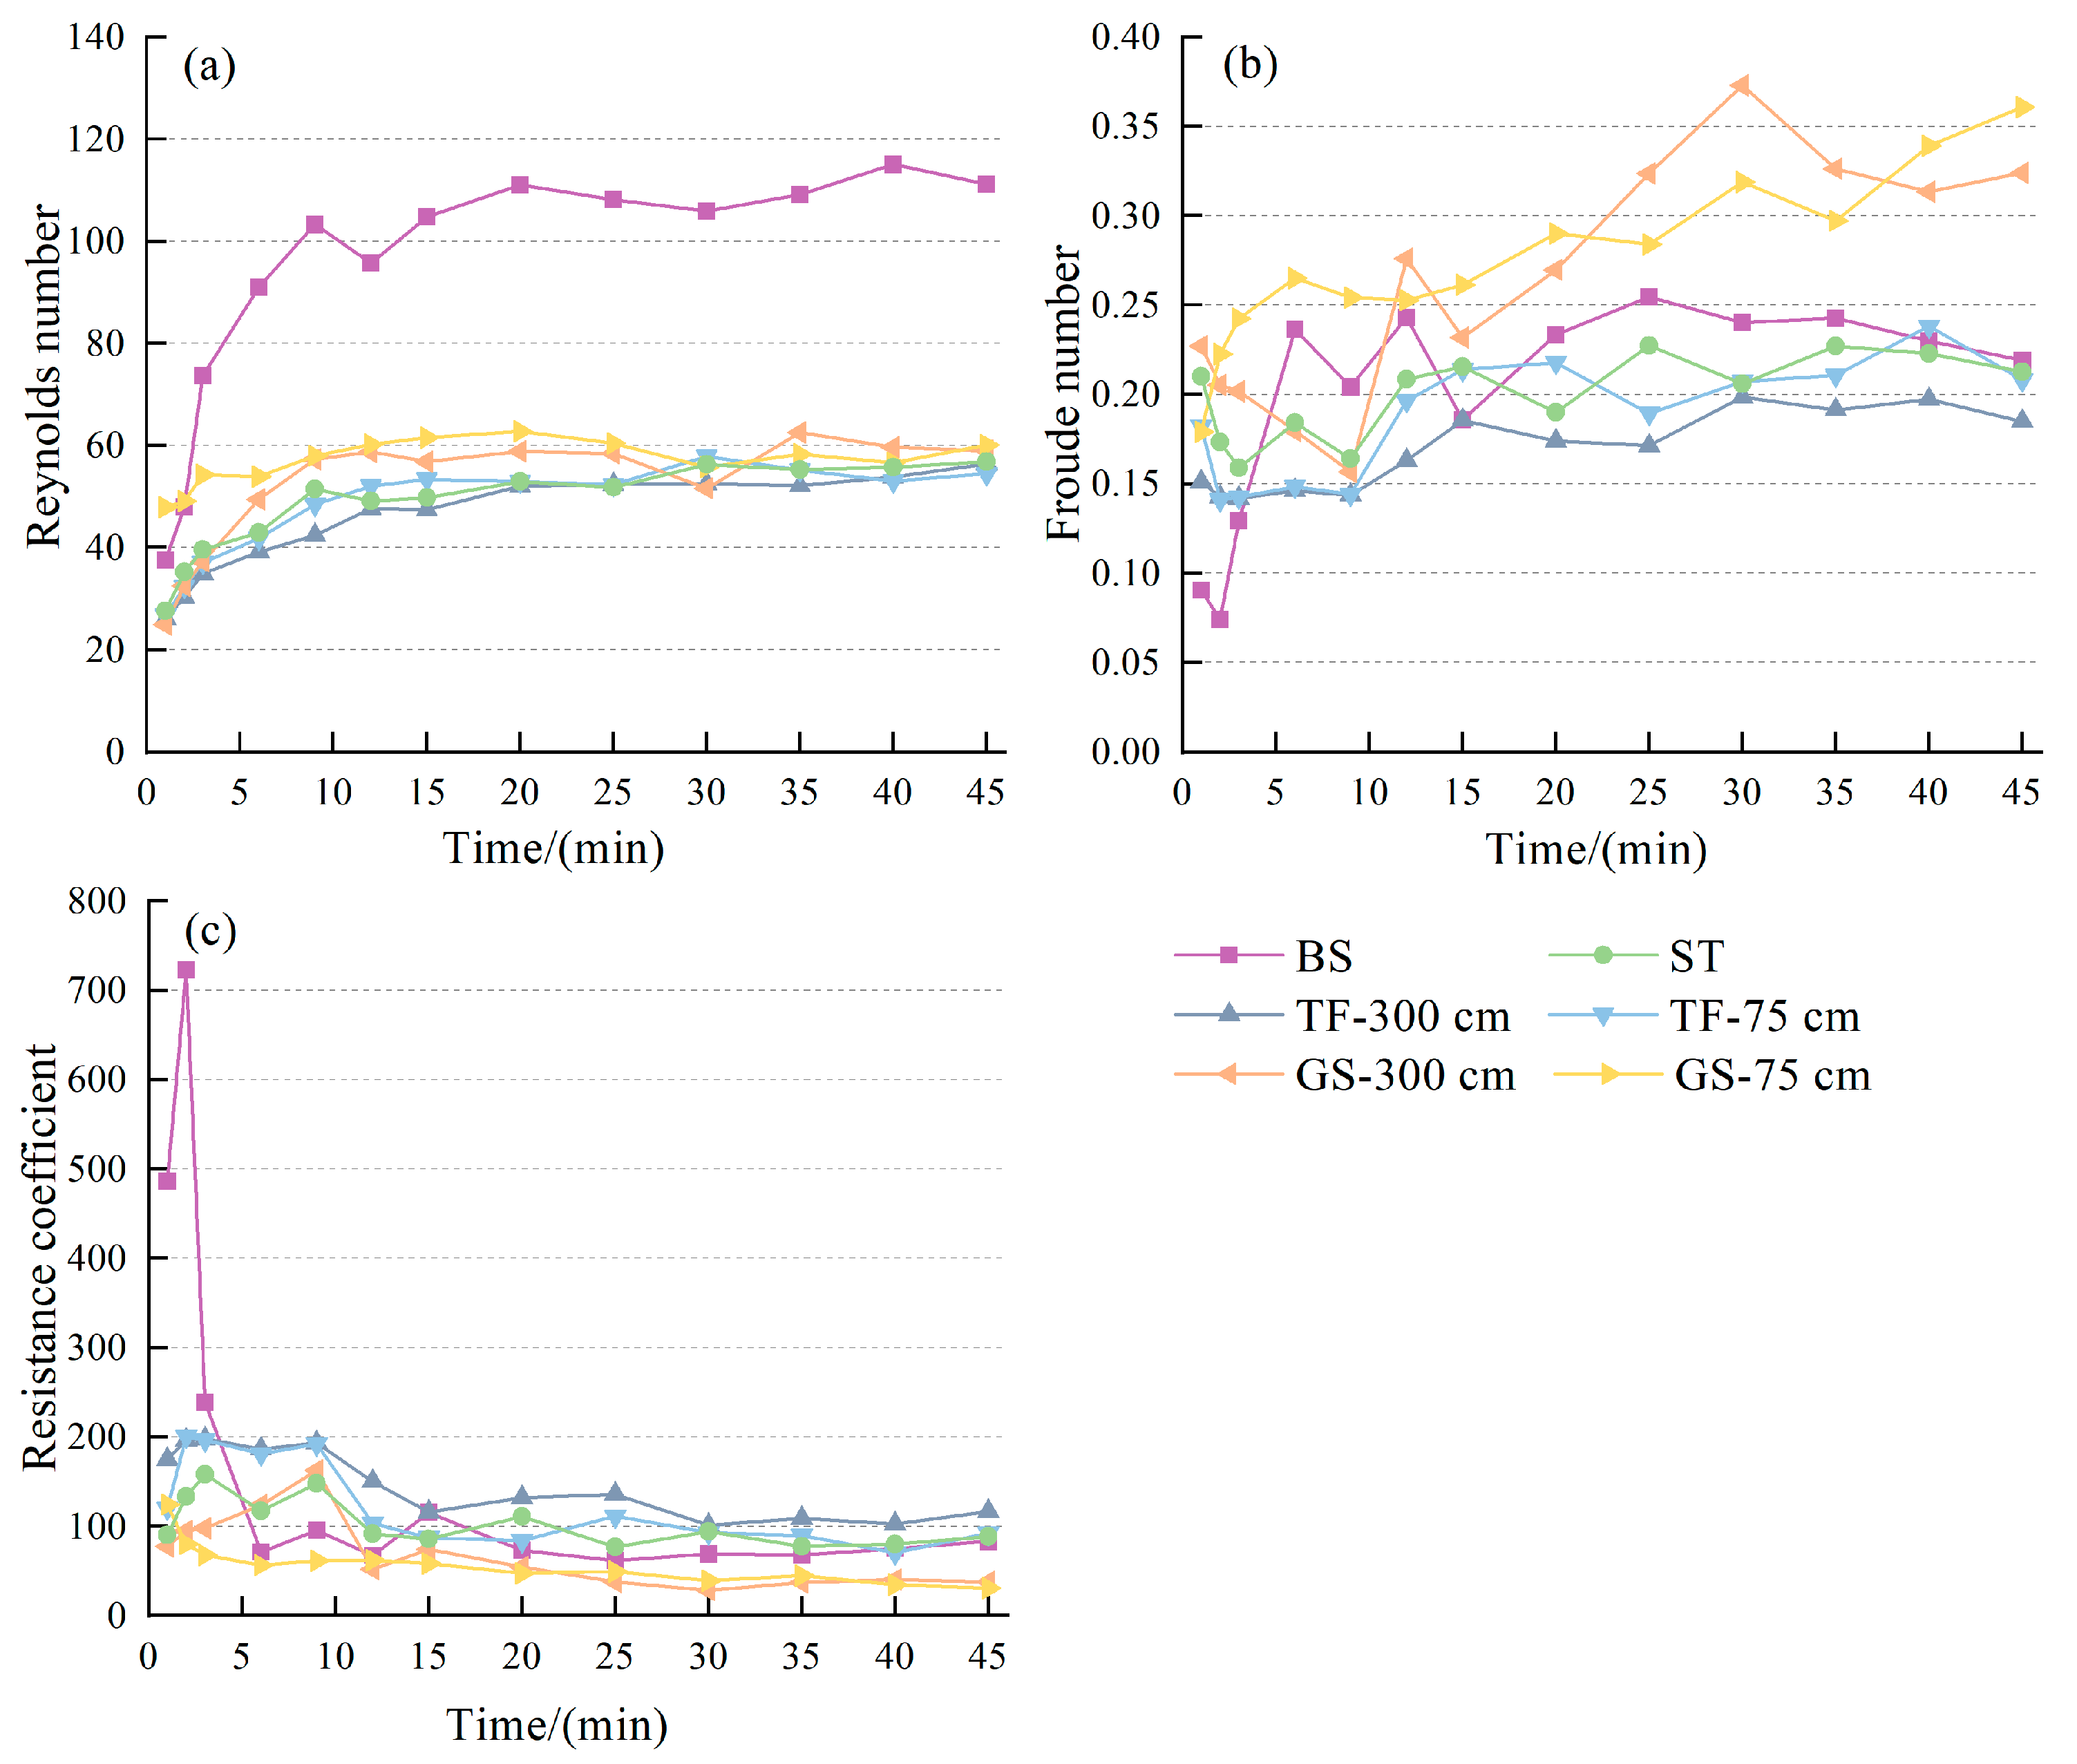
3.2.1. Runoff Patterns and Resistance Coefficients

The analysis of runoff patterns, characterized by the Reynolds number, and runoff regimes, indicated by the Froude number, of runoff from both bare slopes and five temporary vegetation spoil heaps revealed a laminar, slow runoff regime (Re < 500, Fr < 1.0) (Figure 5a,b). The instantaneous Reynolds numbers of bare slope and measured spoil heaps generally displayed an “increasing-relatively stable” trend as runoff production progressed, showing a significant shift at approximately 9 min. During the stabilization stage, the average Reynolds numbers were as follows: bare slope (107.15) > grass seeding (58.12) > synthetic turf (53.27) > turfing (50.74). Notably, all three temporary measures had a remarkable impact on runoff from spoil heap slopes, aligning with the outcomes seen with other measures. These temporary measures demonstrated similar effects on regulating the runoff pattern on the spoil heap slope. When turfing and grassing were specifically implemented at the base, there was a 5.06% and 2.02% increase in the average Reynolds number during the stabilization stage compared to full-slope implementation. This indicates that concentrating these measures solely at the base can nearly replicate the effectiveness of full-slope implementation in controlling the runoff pattern.
In terms of runoff patterns, both runoff from bare slope and measured mound plots exhibited slow runoff (Froude number < 0.40). Generally, the instantaneous runoff Froude number was higher in grassed plots than in bare slopes, whereas turfing and synthetic turf showed lower values compared to bare slopes. The runoff Froude number across different subsurfaces displayed a fluctuating trend of “increase-decrease-relatively stable” as runoff production progressed, with a notable inflection point at around 9 min. During the stabilization stage, the average Froude number rankings were as follows: grass seeding (0.29) > bare slope (0.23) > synthetic turf (0.21) > turfing (0.18). Notably, implementing turfing and grassing solely at the spoil heap’s bottom led to a 13.46% and 2.47% increase in the average Froude number during the stabilization phase compared to full-slope implementation. This approach resulted in an 11.79% decrease and a 28.46% increase, respectively, compared to runoff from the bare slope.
The resistance coefficients of bare slope and measured spoil heaps exhibit changes over time during runoff production, displaying a general trend of “fluctuating and decreasing-relatively stable”, with an inflection point around 12 min (Figure 5c). In the stabilization stage, the average resistance coefficients were turfing (128.61) > synthetic turf (94.93) > bare slope (78.77) > grass seeding (58.57). Compared to a bare slope, the average resistance coefficient in the stabilization stage increased by 30.31% when utilizing turfing solely at the spoil heap base and decreased by 39.43% with grass seeding only at the base. Notably, both turfing and simulated turf increase runoff resistance on the spoil heap slope, while grass seeding tends to reduce the slope resistance.
From the average sub rainfall values, the efficacy of the three temporary vegetation measures in reducing the average Reynolds number ranked as turfing (51.66%) > synthetic turf (48.55%) > grass seeding (45.06%) (Figure 6a). Implementing turfing and grass seeding measures solely at the base of the spoil heaps resulted in lower reductions in the average Reynolds number compared to implementing these measures on the entire slope, yet still showed reductions of 49.12% and 39.17%, respectively. In terms of the Froude number, only turfing under specific conditions (300 cm and 75 cm) effectively decreased the average Froude number by 15% and 5%, respectively (Figure 6b). Conversely, synthetic turf maintained a consistent Froude number with bare slope, while the average Froude number increased by 30% and 35% under the grass seeding condition (300 cm and 75 cm) compared to bare slope. The average resistance coefficients were ranked as turfing > synthetic turf > grass seeding, all of which were lower than bare slope under the three temporary vegetation measures (Figure 6c). Notably, the resistance coefficients were smaller than the bare slope during rainfall in only the grass seeding test after 9 min. Turfing and synthetic turf significantly increased runoff resistance, while the average resistance coefficients decreased by 15.20% and 17.61% when implementing turfing and grass seeding solely at the bottom of the spoil heaps compared to full-slope implementation, respectively.
The results of the variance analysis revealed significant differences in the average Reynolds number between the bare slope and the three temporary vegetation measures (p < 0.05). However, the variations among these measures and between implementing the same measure on the entire slope versus solely at the base were found to be nonsignificant (p > 0.05). Significant differences (p < 0.05) were observed in the average Froude number between grass seeding and bare slope, turfing, and synthetic turf. Conversely, the variances among the latter three and among measures implemented at various locations were not significant (p > 0.05). Grass seeding and synthetic turf had a notable impact on the average resistance coefficient, exhibiting significant differences among the three temporary vegetation measures. Notably, the effect of grass seeding and synthetic turf on the average resistance coefficient showed significance, with the three temporary vegetation measures presenting significant diversity from one another.

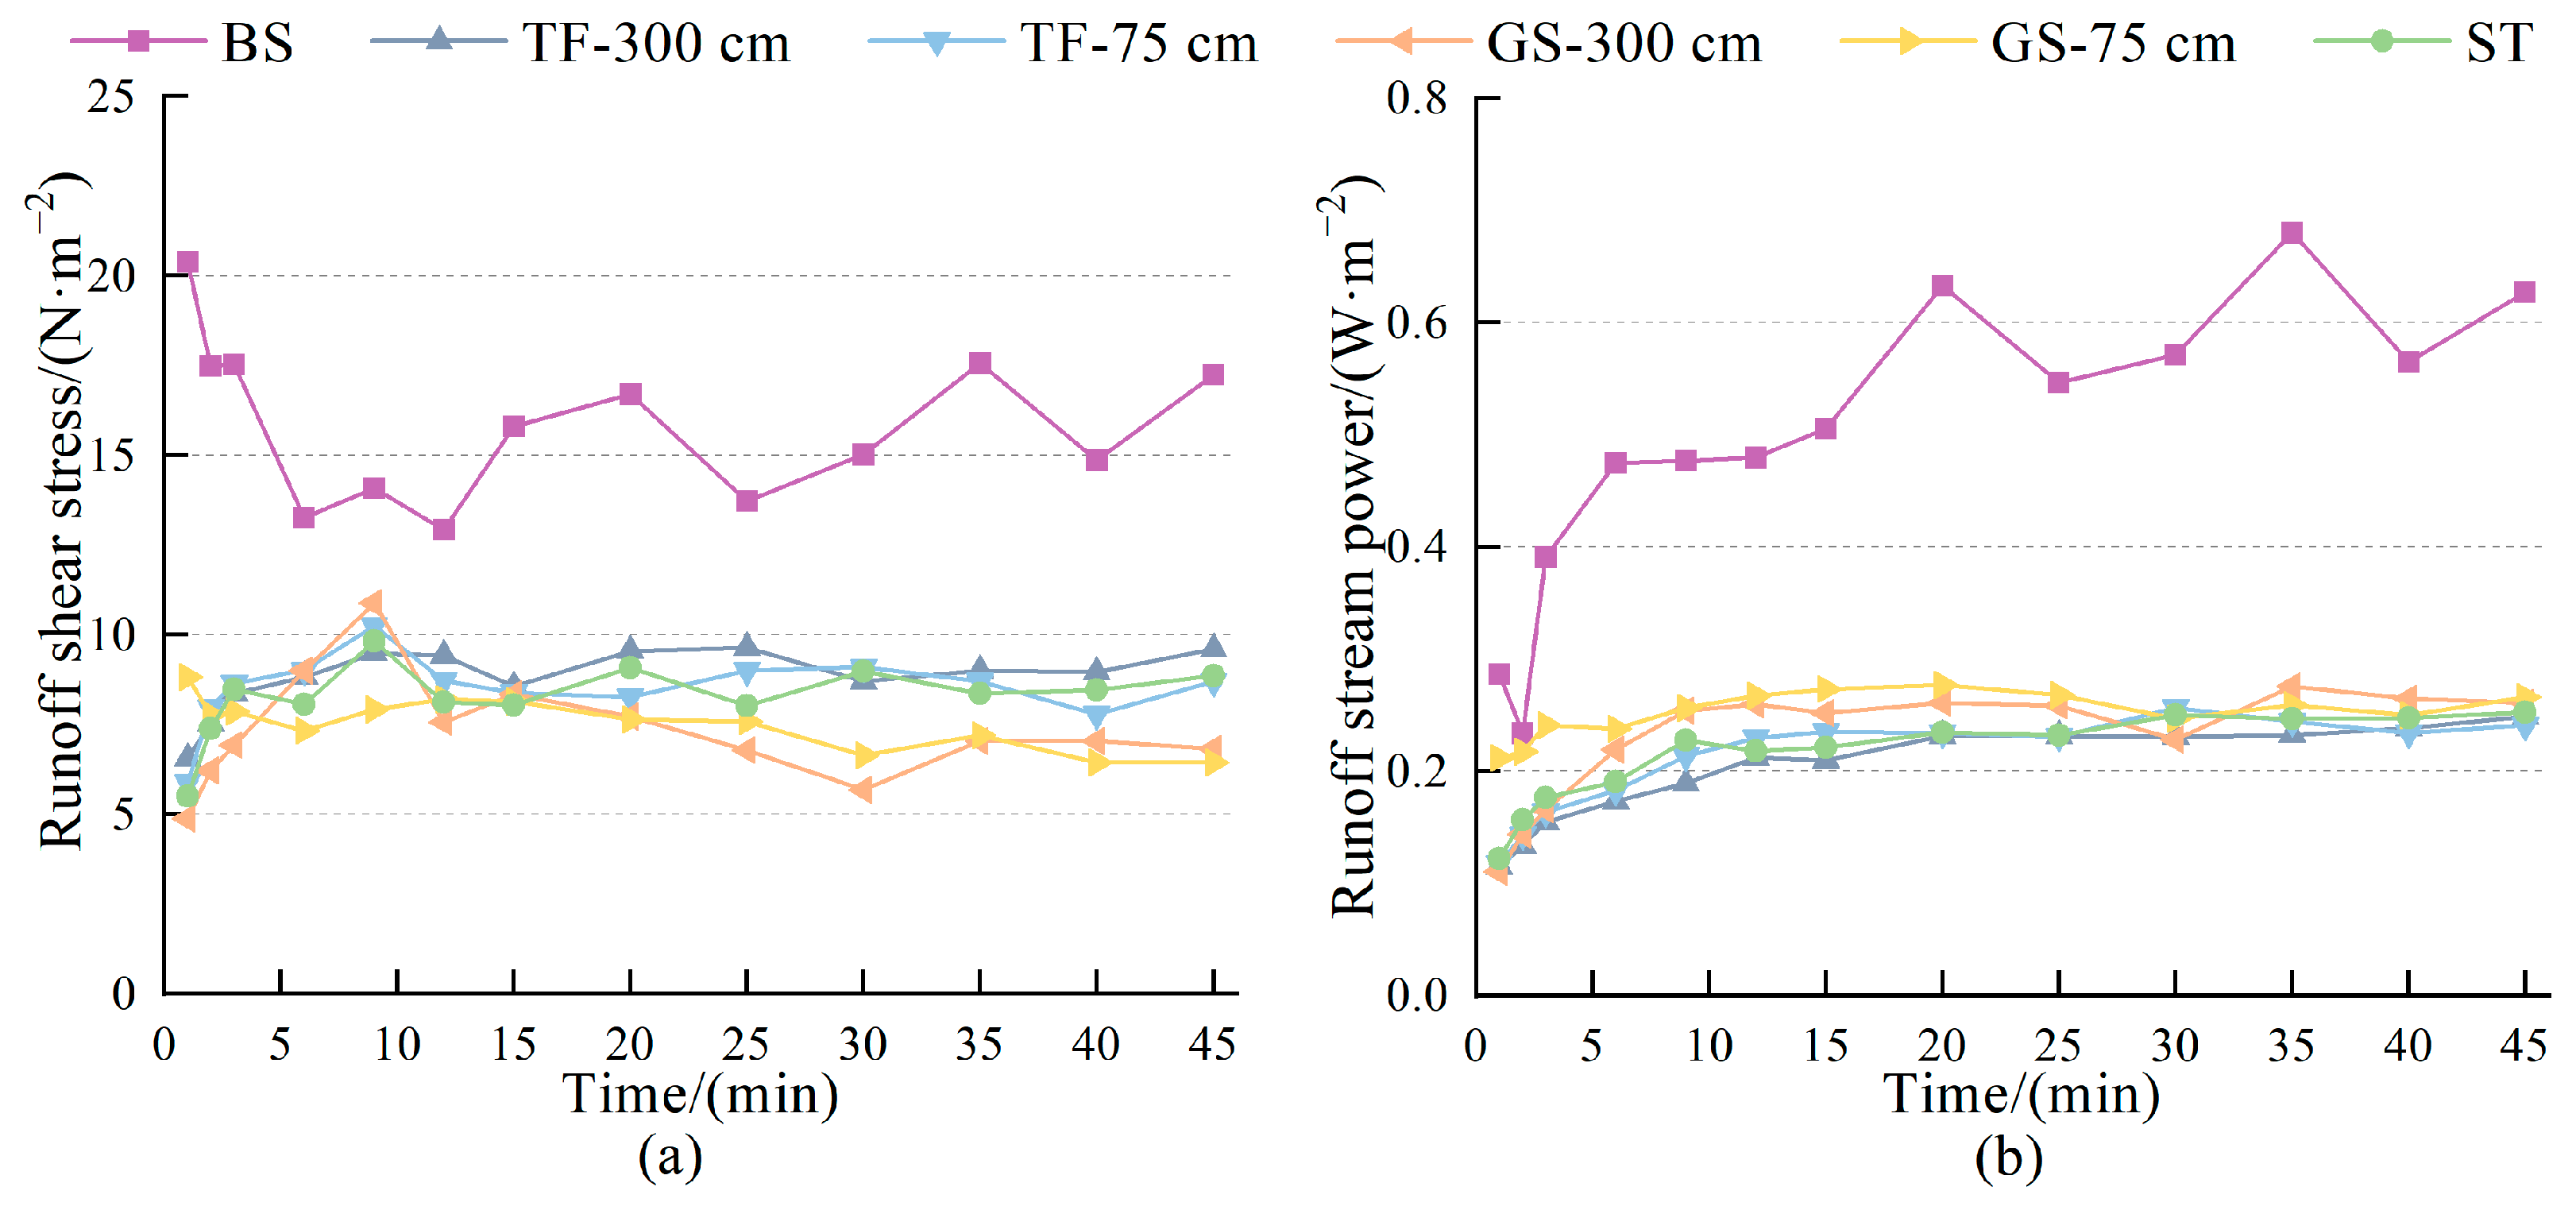
3.2.2. Shear and Runoff Power

The instantaneous runoff shear stress of the bare slope spoil heaps exhibited a general trend of “decreasing-fluctuating” during runoff production, while that of the measured spoil heaps showed an “increasing-relatively stable” pattern, marking the turning point at around 9 min (Figure 7a). Overall, the instantaneous runoff shear stress was ranked as bare slope > turfing > synthetic turf > grass seeding. The difference between turfing or grass seeding solely at the base and implementing them across the whole slope did not show significance in the runoff shear stress. The bare slope’s instantaneous runoff power demonstrated an overall pattern of “rapid increase-increasing”, in contrast to the spoil heaps body plot measures showing a “rapid increase-relatively stable” change with a turning point at 9 min, with the overall ranking as bare slope > grass seeding > synthetic turf > turfing (Figure 7b). Turfing and grass seeding solely at the bottom resulted in a higher increase in the instantaneous runoff power compared to full-slope implementation.
Based on the average values, the average runoff shear power stress was ranked as bare slope > turfing> synthetic turf > grass seeding (Figure 8a). The reduction benefits for the average shear power with the three temporary vegetation measures were 44.72%, 48.11%, and 54.02%, respectively. When turfing and grass seeding solely at the base of the slope compared to full-slope conditions, the impact on the average runoff shear power showed variations of less than 5%. In terms of average runoff power rankings, the order was bare slope > grass seeding> synthetic turf > turfing (Figure 8b). The reduction benefits with these measures were 54%, 58%, and 60%, respectively. The differences in the effects of solely implementing turfing and grass seeding at the base of the spoil heaps on the average runoff power compared to full-slope implementation were 5% and 8.69% (<10%). Generally, grass seeding proved more effective in reducing runoff shear, while turfing was more efficient in reducing runoff power. Synthetic turf benefits fell between those of grass seeding and turfing in regulating both runoff shear and power. Even implementing turfing or grass seeding solely at the bottom showed a control benefit on runoff shear and power with differences of <10% compared to full-slope implementation, implying that implementing 25% of the measures at the base could achieve over 90% of the full-slope effectiveness.
The results of the analysis of variance indicated significant differences (p < 0.05) in the average shear and runoff power between the bare slope and the measured mound plots. Conversely, there was no significant variance in the average power among the three measures (p > 0.05); however, a notable difference in runoff shear existed between grass seeding and turfing, as well as synthetic turf (p < 0.05). The impact of implementing measures solely at the bottom versus across the full slope on shear and runoff power did not show significance (p > 0.05).

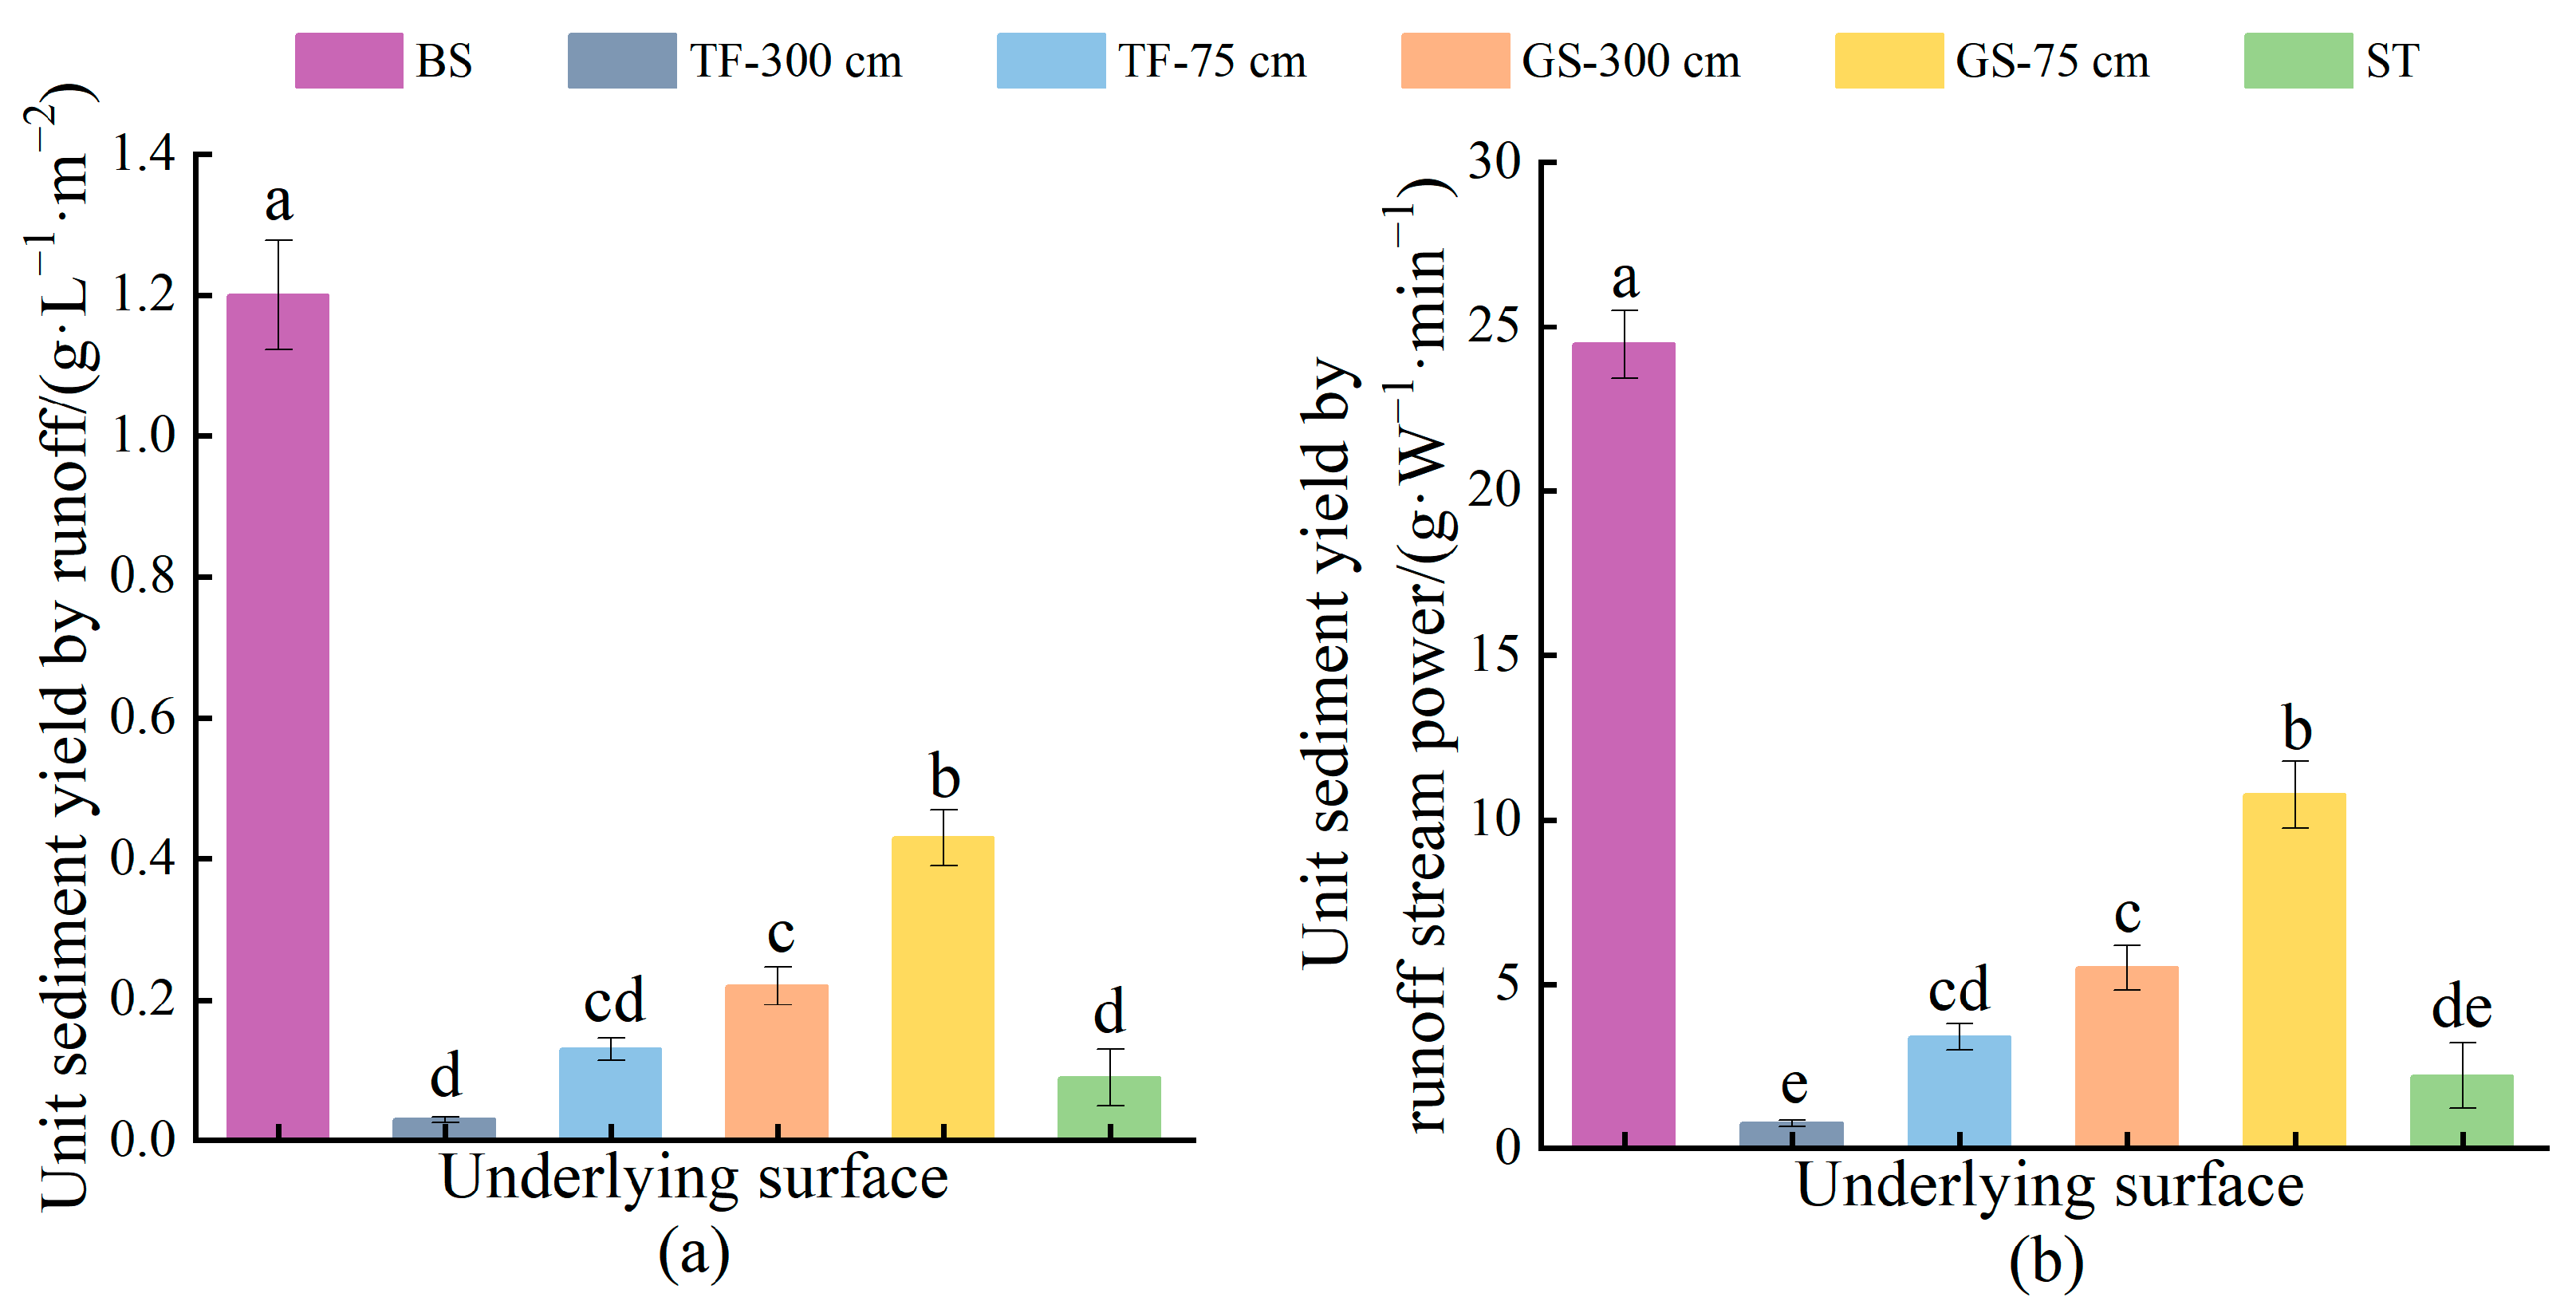
3.3. Runoff and Sediment Reduction Benefits

Table 1 presents the statistics regarding various bare slope and temporary vegetation measures in terms of subrainfall runoff volume, sediment production, and the corresponding runoff and sediment benefits. The findings revealed that, compared to bare slope, the reduction benefits for both runoff and sediment with the three temporary vegetation measures (turfing, grass seeding, and synthetic turf) were ranked as turfing > synthetic turf > grass seeding. Interestingly, the average sediment reduction benefit (96.35%) exceeded the runoff reduction benefit (49.42%) by 1.95 times. The sediment and runoff reduction benefits of turfing and synthetic turf were quite similar, with minimal differences of only 0.66% and 4.53%. Specifically, implementing turfing solely at the base led to a 3.93% decrease in runoff reduction benefit and a 5.62% decrease in sediment reduction benefit compared to full-slope implementation, while grass seeding resulted in a reduction of 5.10% and 11.17%, respectively. In essence, employing just 25% of the turfing and grass seeding measures at the base of the spoil heaps could attain over 89% of the water and sediment reduction benefits of full-slope implementation.

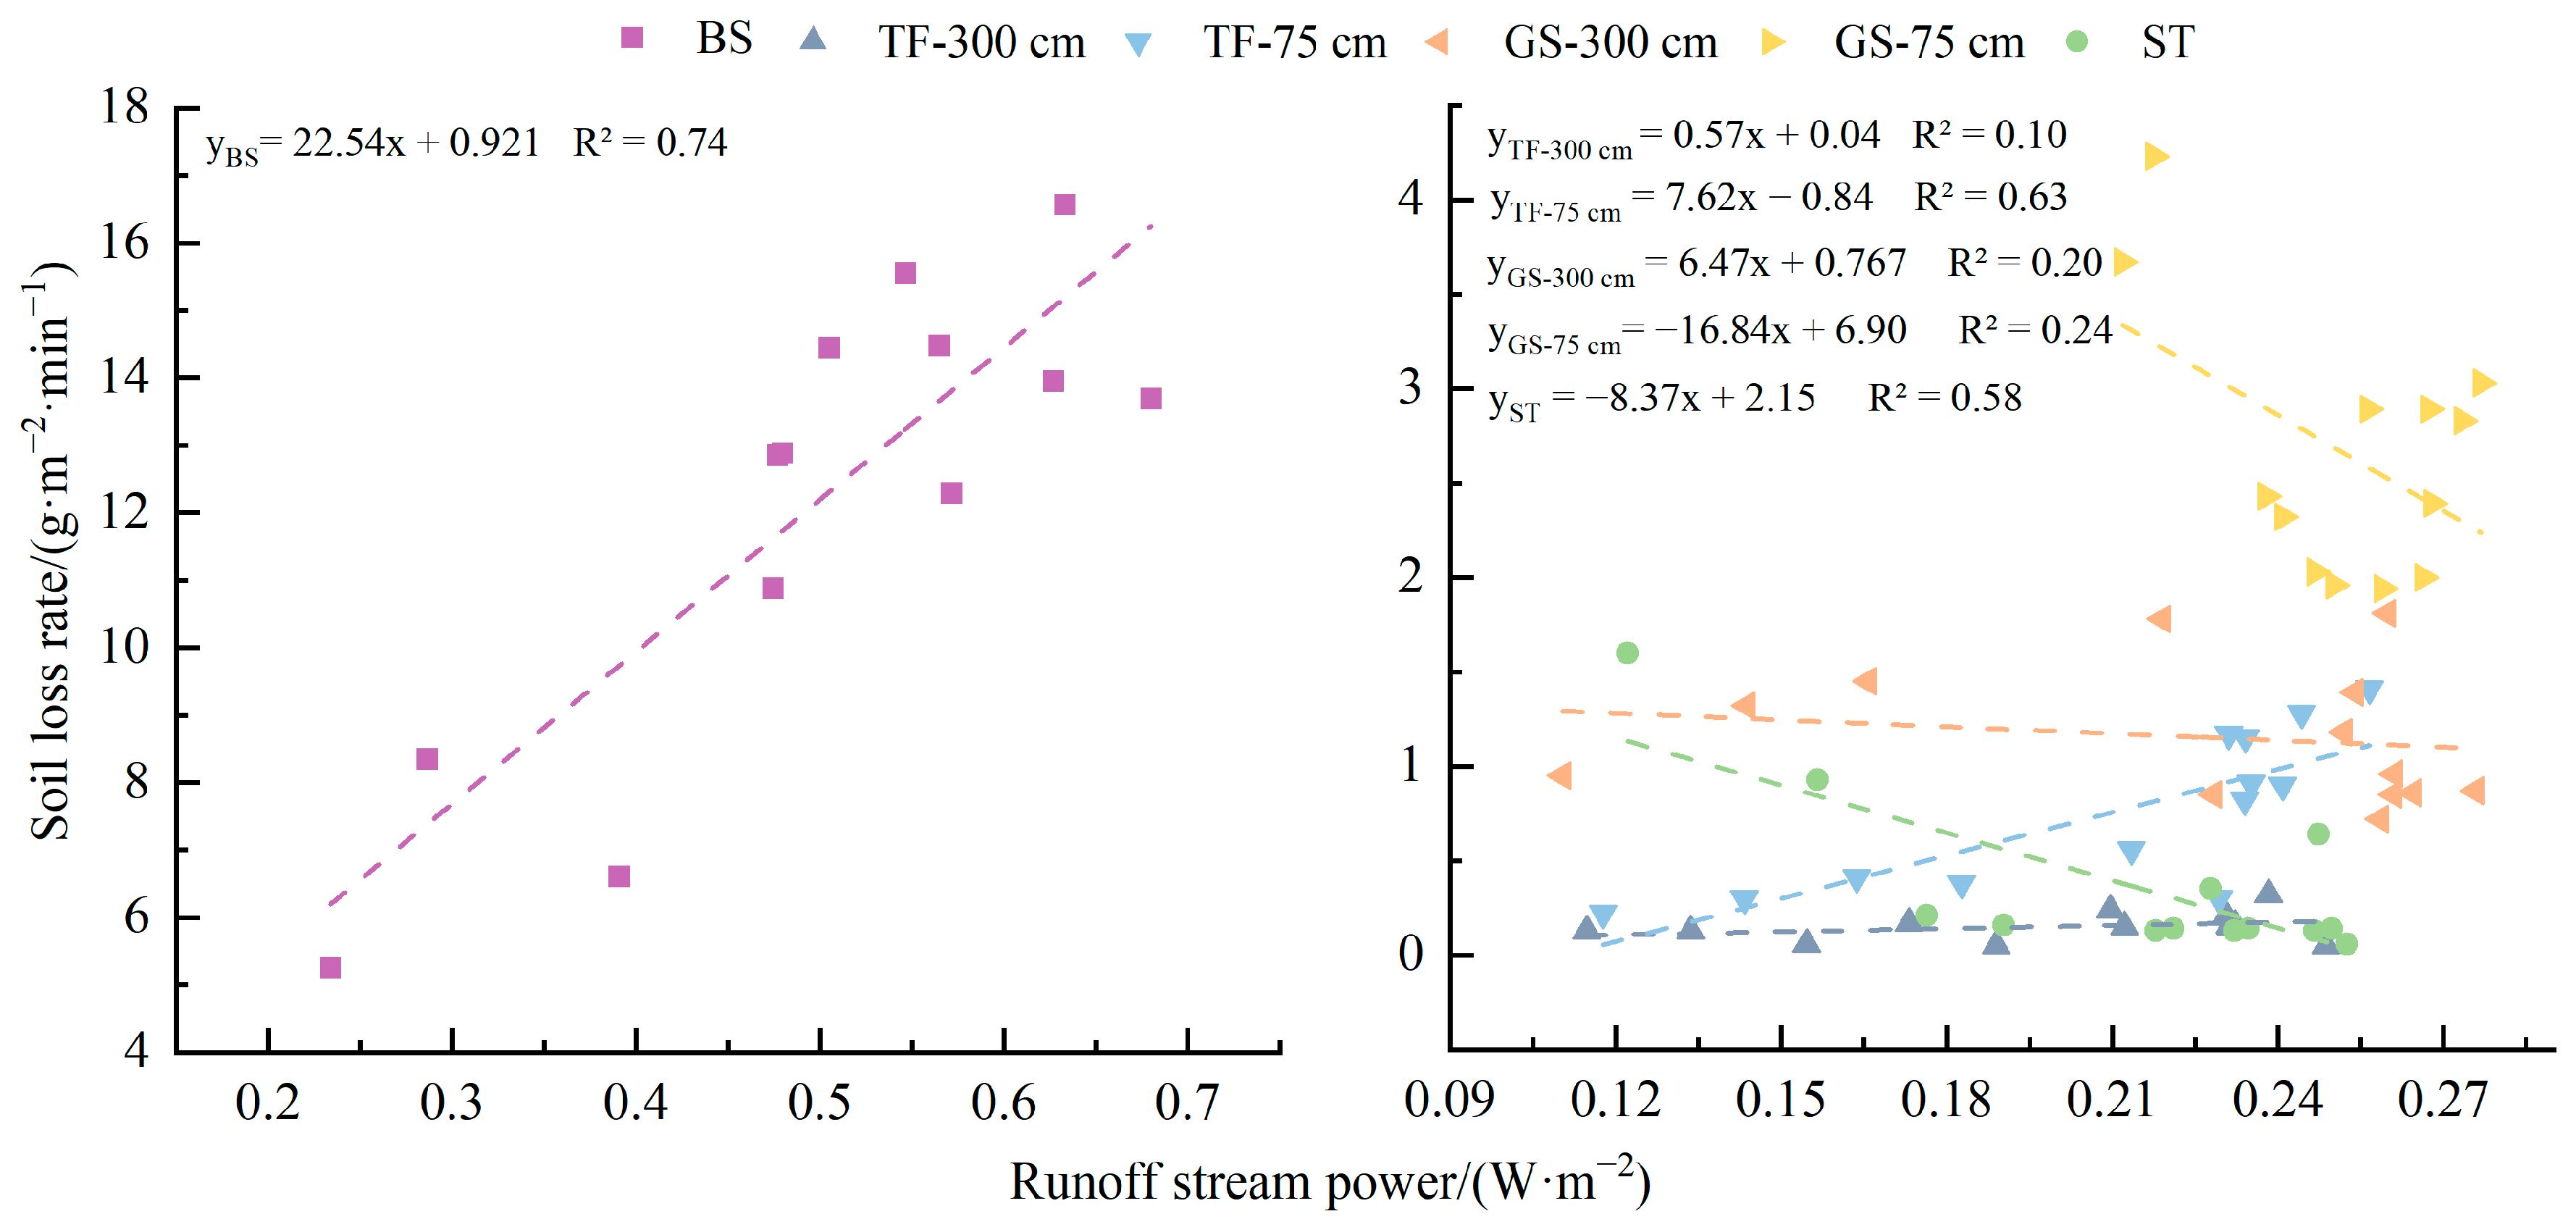
3.4. Parameter Correlations and Erosion Dynamic Coupling Mechanisms

The correlation analysis results indicated that the runoff rate of bare slope demonstrated significant correlations with runoff rate, Reynolds number, Froude number, resistance coefficient, shear stress, and runoff power, with the strongest correlation observed with the Reynolds number (1.000). Notably, the correlation with runoff power (0.921) exceeded that with shear stress. For the TF-300 cm condition, no significant correlations were found between the runoff rate and each parameter. However, the 75 cm turfing runoff rate exhibited significant correlations with runoff rate, Reynolds number, Froude number, shear stress, and runoff power, with particularly strong correlations observed with Reynolds number (1.000) and runoff power (0.997). Similarly, the GS-300 cm runoff rate showed significant correlations with runoff rate, Reynolds number, and runoff power, while the GS-75 cm runoff rate presented significant correlations with runoff rate, Reynolds number, Froude number, resistance coefficient, and runoff power, showing robust correlations exceeding 0.99 with Reynolds number and runoff power. Finally, the runoff rate of synthetic turf displayed significant correlations with runoff rate, Reynolds number, shear stress, and runoff power, with particularly strong correlations exceeding 0.99 with Reynolds number and runoff power.
The erosion rate of bare slope demonstrated a significant correlation with runoff rate, Reynolds number, Froude number, resistance coefficient, and runoff power, with higher correlations observed with runoff rate, Reynolds number, and runoff power. The erosion rate of TF-300 cm was notably correlated with the Froude number and resistance coefficient, while the erosion rate of GS-75 cm showed significant correlations with runoff rate, Reynolds number, Froude number, resistance coefficient, and runoff power, with strong correlations particularly with runoff rate, Reynolds number, and runoff power. Similarly, the erosion rate of GS-300 cm had significant correlations with runoff rate, Froude number, and resistance coefficient, whereas the erosion rate of GS-75 cm correlated significantly with runoff rate, Froude number, resistance coefficient, and shear power. Finally, the erosion rate of synthetic turf exhibited significant correlations with runoff rate, Reynolds number, shear power, and runoff power. Overall, bare slope and measurement plots showed the most substantial correlation between runoff rate and Reynolds number as well as runoff power, while erosion rate correlated more strongly with Froude number and runoff power.
A quantitative relationship between erosion rate and runoff power was established (Figure 9). The erosion rate and runoff power of the bare slope were satisfactorily fitted by a linear function (R2 = 0.74). In contrast, the erosion rate and runoff power of the measured plots with TF-75 cm and ST exhibited even better linear fits (R2 = 0.63 and 0.58, respectively). However, the linear fitting for the conditions involving GS-300 cm and GS-75 cm, as well as 300 cm turfing, resulted in R2 values < 0.3. This suggests a significant alteration in the erosion pattern under these specific conditions.
Sediment production per unit runoff demonstrated that, under similar runoff conditions, turfing, synthetic turf, and grass seeding reduced sediment production by 97.50%, 92.50%, and 81.67%, respectively, compared to bare slope (Figure 10a). Similarly, under equivalent runoff power, these measures reduced sediment production by 96.85%, 90.92%, and 77.51%, respectively. When implementing turfing and grass seeding solely at the base of the spoil heaps, sediment production per unit runoff was 4.33 and 1.95 times higher, and sediment production per unit runoff power was 4.41 and 1.96 times higher, respectively, than when implementing them across the entire slope (Figure 10b). This signifies that these temporary vegetation measures effectively reduce erosion by moderating runoff or runoff power. The comparisons between sediment production per unit of runoff and sediment production per unit of runoff power among the measures indicated significant differences (p < 0.05).

4. Discussion

Soil erosion in construction projects differs significantly in spatial and temporal distribution and erosion intensity compared to traditional erosion on cultivated land, wasteland, forests, and grasslands. Studies suggest that soil erosion from engineering construction can be several times, or even hundreds of times, more intense than natural slope erosion [50]. Spoil heaps have emerged as major eroding geomorphic units due to their steep slopes and inadequate protective measures during construction processes [4]. Recommendations include temporary protection during construction, engineering actions upon civil construction completion, and implementing vegetation measures after project finalization. Yet, factors such as construction period and project disturbances often lead to less emphasis on temporary conservation measures compared to permanent engineering and vegetation measures. The “Views on strengthening soil and water conservation work in the New Era” issued in 2023, highlighted soil and water conservation as a fundamental aspect for river management and advocated for enhanced oversight of human-induced soil and water erosion [51]. This underscores the significance of research on soil and water erosion prevention and control measures during construction, as such research has become the primary focus.
In this study, we examined the impact of temporary vegetation measures on runoff, sediment production, and hydrodynamic parameters following soil erosion during the construction process. The findings indicated that turfing, grass seeding, and synthetic turf can contribute significantly to runoff storage and sediment reduction. The average sediment reduction and streamflow reduction benefits for these three temporary vegetation measures were 96.35% and 49.42%, respectively, as detailed in Table 1. While our conclusion aligns with prior research, noteworthy differences in specific benefits were observed. For instance, Zhang et al. studied the efficacy of level terraces (ditches) and fish-scale pits on steep slope spoil heaps (36°) using field water discharge and scouring tests, showing higher combined benefits compared to individual measures [52]. Niu et al. demonstrated that implementing level terraces and fish-scale pits had a notable impact on sediment retention on various slope gradients of 24° [53]. However, different slope gradients (24°, 28°, 32°) not only failed to mitigate runoff and sediment production but also resulted in an increase of 9% to 175% in runoff and 16% to 60% in sediment production. This increase was primarily attributed to water damage occurring in the later stages of the engineering interventions. Building upon this, Yang et al. conducted a runoff scouring test study, revealing that vegetative hedgerows exhibited a sediment reduction efficacy ranging from 10% to 45% [54]. Interestingly, the erosion on slopes with vegetative hedgerows surpassed that of bare slopes, suggesting that vegetative hedgerows altered the “source-sink” relationship during erosion processes. Furthermore, laboratory simulated rainfall experiments (with intensities of 90–200 mm·h−1) demonstrated that temporary dust screens, slit traps, or a combination thereof could contribute to soil and water conservation in slope spoil heaps of 20°. The sediment reduction benefits ranged between 34.15% and 96%, while runoff reduction benefits ranged from 2.46% to 42.15% [29]. Additionally, Li explored the impact of two vegetation types, Artemisia ferruginea and Artemisia dogtoothii (grown with grass seeding for approximately six months), on runoff and sediment production in short-term heaps with a gradient of 30°, using field simulated rainfall experiments of 48, 72, and 108 mm·h−1 [42]. Their findings indicated that the two vegetation types provided greater benefits for reducing runoff (91.1%) compared to sediment reduction (91%), with a 2.2 times higher sediment reduction benefit (91.1%) than runoff reduction benefit (42.1%). Vegetation, through a synergistic effect of surface stems, leaves, and underground canopy, altered the erosion dynamics and resistance mechanisms of slope spoil heaps, thereby diminishing effective shear stress and reducing erosion. However, in intense rainfall conditions, vegetation without a protective root system could exacerbate erosion, exceeding that of bare slope by 68% [4]. Existing studies primarily propose that vegetation alters runoff by modifying the physical properties of underlying surfaces (e.g., runoff initiation time, infiltration, bulk density, and moisture content). One critical mechanism for vegetation to reduce slope sediment yield lies in modifying hydraulic and hydrodynamic characteristics of runoff, ultimately achieving erosion reduction benefits [55,56]. Li et al. found that vegetation cover increases the critical runoff shear stress by 40.4–73.79% but may reduce critical runoff power by 14.6–78.3% [36]. Additionally, Liu et al. demonstrated that litter coverage enhances critical runoff shear stress by 98–193%, thereby reducing soil erodibility by 38–59% [57]. The soil and water conservation measures implemented offered significant benefits to the engineered stock spoil heaps. This study highlighted that the sediment reduction benefits from temporary vegetation measures were comparable to permanent vegetation measures but exceeded both temporary and engineered measures. This difference can be attributed to the erosion protection role played by temporary vegetation measures. By turfing and synthetic turf at the technical level, the slope surface was effectively shielded, creating a stable protective layer that minimized erosion from raindrop impact and runoff. This approach, akin to gravel and thatched covers, nearly achieved full coverage, resulting in considerably higher water and sediment reduction benefits compared to gravel cover (19.34%) and thatched cover (89.73% to 97.35%) [58,59]. Additionally, at a biological and physical level, grass seeding and synthetic turf acted as filters for rainwater, leading to a reduction in suspended particles and sediments within rainwater. This filtering effect curbed soil erosion and indirectly bolstered the erosion resistance of the landfill base.
Simultaneously, existing studies have demonstrated that both bare slopes and treated slopes exhibit significant correlations in runoff-sediment relationships, universally characterized by a “higher runoff volume, greater sediment yield” pattern. Furthermore, hydraulic parameters (e.g., flow velocity, shear stress) in treated plots show notable reductions compared to bare slopes [60]. Zhou et al. demonstrated through water flushing tests that implementing vegetation measures and ecological restoration materials can reduce the spoil heaps of body Froude number by 16.88% to 43.76%, runoff velocity by 6.05% to 43.63%, increase the resistance coefficient by 1.02 to 2.09 times, and decrease runoff power by 5.80% to 51.90% [61]. Results indicate that compared to bare slope, implementing temporary vegetation measures reduced runoff velocity by 2.18% to 29.59%, Reynolds number by 45.06% to 51.66%, shear stress by 44.72% to 54.02%, and runoff power by 54% to 60%. While these findings align with previous studies, differences are apparent in terms of erosion power mechanisms. It is argued that shear stress and runoff power can more objectively portray erosion rates [62,63]. Specifically, the coefficient of determination between erosion rate and runoff power was below 0.65 for bare slope under temporary vegetation measures, contrasting with a 0.74 coefficient for bare slope without measures. This highlights how temporary measures alter the mechanism of runoff action on stripping and carrying eroded particles on spoil heap slopes. Despite variations in research scope, methods, and goals, the study results both align with and differ from existing literature.
From the perspective of material cost analysis, turfing, grass seeding (only seeds), and synthetic turf cost 15 CNY·m−2, 1.2 CNY·m−2, and 5.5 CNY·m−2, respectively. Grass seeding is optimal for long term projects requiring strict cost control due to its low initial material expenses, though it demands extended maintenance periods to achieve vegetation coverage. Turfing suits short-term erosion control on localized slopes, as immediate vegetation coverage effectively stabilizes soil within weeks. For rapid and durable vegetation restoration, prioritize turfing despite its higher upfront cost, as it ensures instant greening and long term stability. It should be noted that all experimental results presented in this study are derived from certain kinds of turfing, grass seeding, and synthetic turf used in construction projects. Potential variations in material properties or planting density may influence the generalizability of the findings. Nonetheless, the conclusions offer valuable guidance for erosion control measures deployment and provide a quantitative foundation for supervisory agencies’ oversight.

5. Conclusions

This study quantitatively investigates the effects of temporary vegetation measures on runoff sediment yield and hydrodynamic processes on steep spoil heaps through laboratory simulated rainfall experiments. The experiment was conducted under rainfall intensity of 1.45 mm·min−1 and a 30° slope condition, leading to the following key conclusions:
All three temporary vegetation measures effectively delayed the onset of runoff from spoil heaps by 56.71% to 232.89%. For treated spoil heaps, parameters such as runoff rates, flow velocities, erosion rates, Reynolds numbers, Froude numbers, drag coefficients, shear forces, and hydraulic power stabilized after a certain duration of runoff.
The average reduction in runoff achieved by the three measures ranged from 45% to 49%, while the average reduction in erosion rates ranged from 90% to 99%, with differences remaining below 10%. However, the reduction in average flow velocity varied significantly, ranging from 2% to 30%.
The average reduction in Reynolds numbers for the three measures ranged from 45% to 52%. Only turfing and synthetic turf significantly decreased the average Froude number (by 5% to 15%), while both measures notably increased the slope’s drag coefficient. The average reductions in shear forces and hydraulic power for all three measures fell between 44% and 60%. Implementing turfing and grass seeding solely at the bottom of the slope resulted in reductions in runoff, sediment yield, and hydrodynamic parameters exceeding 80% compared to full-slope implementation.
Both runoff rates and erosion rates were significantly correlated with hydraulic power; however, Reynolds numbers and Froude numbers exhibited more pronounced effects on runoff rates and erosion rates, respectively. Temporary vegetation measures altered erosion patterns on spoil heaps, thus diminishing the linear relationship between erosion rates and hydraulic power. Under the same runoff conditions, sediment yields for turfing, synthetic turf, and grass seeding were reduced by 97.50%, 92.50%, and 81.67%, respectively, compared to bare slope. Under identical runoff conditions, reductions of sediment production were 96.85%, 90.92%, and 77.51%, respectively.
The material cost analysis indicates that turfing > synthetic turf > grass seeding. Grass seeding, with its low initial cost, is optimal for long term projects that require strict cost control, although achieving complete vegetation coverage demands a longer maintenance period. In contrast, turfing is more suitable for short-term erosion control on localized slopes, as it provides immediate vegetation cover that quickly stabilizes the soil. Despite its higher upfront cost, turfing is the preferred solution for rapid and durable vegetation restoration, as it ensures instant greening and offers long term stability.

Author Contributions

Conceptualization, J.P. and W.W.; methodology, J.P. and J.L. (Jianming Li); software, J.W.; validation, K.W.; formal analysis, J.P. and Z.W.; investigation, J.L. (Jianming Li); resources, Z.W.; data curation, X.Z.; writing—original draft preparation, J.P.; writing—review and editing, J.L. (Jianming Li) and W.W.; visualization, X.L.; supervision, W.W.; project administration, W.X.; funding acquisition, J.L. (Jigen Liu). All authors have read and agreed to the published version of the manuscript.

Funding

This research was supported by the Natural Science Foundation of China (grant number: 41701316,40771127); the Science and Technology Innovation Program from Water Resources of Guangdong Province (grant number: 2024-02); and the Natural Science Foundation of Hubei Province, China (grant number 2024AFB407).

Data Availability Statement

The data that support the findings of this study are available from the corresponding author upon reasonable request.

Conflicts of Interest

The authors declare no conflicts of interest.

References

  1. Riquetti, N.B.; Mello, C.R.; Leandro, D.; Guzman, J.A.; Beskow, S. Assessment of the Soil-Erosion-Sediment for Sustainable Development of South America. J. Environ. Manag. 2022, 321, 115933. [Google Scholar] [CrossRef] [PubMed]
  2. Rodrigues, S.C.; Silva, T.I. Dam Construction and Loss of Geodiversity in the Araguari River Basin, Brazil. Land Degrad. Dev. 2012, 23, 419–426. [Google Scholar] [CrossRef]
  3. Nyssen, J.; Poesen, J.; Moeyersons, J.; Luyten, E.; Veyret-Picot, M.; Deckers, J.; Haile, M.T.K.; Govers, G. Impact of Road Building on Gully Erosion Risk: A Case Study from the Northern Ethiopian Highlands. Earth Surf. Process. Landf. 2002, 27, 1267–1283. [Google Scholar] [CrossRef]
  4. Li, J.M.; Li, L.; Wang, Z.G.; Zhang, C.W.; Wang, Y.F.; Wang, W.L.; Zhang, G.H.; Huang, J.Q.; Li, H.; Lv, X.; et al. The Contributions of the Roots, Stems, and Leaves of Three Grass Species to Water Erosion Reduction on Spoil Heaps. J. Hydrol. 2021, 603, 127003. [Google Scholar] [CrossRef]
  5. Niu, Y.B.; Gao, Z.L.; Li, Y.H.; Lou, Y.C.; Zhang, S.; Zhang, L.T.; Du, J.; Zhang, X.; Luo, K. Characteristics of Rill Erosion in Spoil Heaps under Simulated Inflow: A Field Runoff Plot Experiment. Soil Tillage Res. 2020, 202, 104655. [Google Scholar] [CrossRef]
  6. Nearing, M.A.; Xie, Y.; Liu, B.Y.; Ye, Y. Natural and Anthropogenic Rates of Soil Erosion. Int. Soil Water Conserv. Res. 2017, 5, 77–84. [Google Scholar] [CrossRef]
  7. He, L.; Chen, J.; Cheng, C.; Yuan, J.; Qu, B.; Wei, Y. Assessment and spatiotemporal analysis of flood vulnerability in the Yangtze River Economic Belt. Water Resour. Hydropower Eng. 2024, 55, 24–39. (In Chinese) [Google Scholar] [CrossRef]
  8. Zhang, L.; Gao, Z.; Yang, S.; Li, Y.; Tian, H. Dynamic Processes of Soil Erosion by Runoff on Engineered Landforms Derived from Expressway Construction: A Case Study of Typical Steep Spoil Heap. Catena 2015, 128, 108–121. [Google Scholar] [CrossRef]
  9. Gao, Y.; Yin, Y.; Li, B.; He, K.; Wang, X. Post-Failure Behavior Analysis of the Shenzhen “12.20” CDW Landfill Landslide. Waste Manag. 2019, 83, 171–183. [Google Scholar] [CrossRef]
  10. Iqbal, J.; Dai, F.C.; Hong, M.; Tu, X.B.; Xie, Q.Z. Failure Mechanism and Stability Analysis of an Active Landslide in the Xiangjiaba Reservoir Area, Southwest China. J. Earth Sci. 2018, 29, 646–661. [Google Scholar] [CrossRef]
  11. Li, J.; Chen, L.; Ren, H.; Sun, B.; Yang, H.; Xiong, Y.; Sun, B. Response of runoff and sediment production and sediment and water benefits of engineering spoil heaps to vegetation characteristics. Trans. Chin. Soc. Agric. Eng. (Trans. CSAE) 2024, 40, 142–151. (In Chinese) [Google Scholar] [CrossRef]
  12. Lee, M.-G.; Song, C.-S. Characteristics of the Soil Erosion with the Rainfall and Geotechnical Conditions. J. Korean Soc. Agric. Eng. 2011, 53, 53–58. [Google Scholar] [CrossRef]
  13. Shen, H.O.; Zheng, F.L.; Wen, L.L.; Han, Y.; Hu, W. Impacts of Rainfall Intensity and Slope Gradient on Rill Erosion Processes at Loessial Hillslope. Soil Tillage Res. 2016, 155, 429–436. [Google Scholar] [CrossRef]
  14. Dong, J.Z.; Zhang, K.L.; Guo, Z.L. Runoff and Soil Erosion from Highway Construction Spoil Deposits: A Rainfall Simulation Study. Transp. Res. Part D Transp. Environ. 2012, 17, 8–14. [Google Scholar] [CrossRef]
  15. Barbosa, F.T.; Bertol, I.; Werner, R.d.S.; Ramos, J.C.; Ramos, R.R. Critical Slope Length for Water Erosion for Three Crop Residue Types and Rates in Two Sowing Directions in No-Till. Rev. Bras. Ciênc. Solo 2012, 36, 1279–1290. [Google Scholar] [CrossRef]
  16. Nyssen, J.; Vermeersch, D. Slope Aspect Affects Geomorphic Dynamics of Coal Mining Spoil Heaps in Belgium. Geomorphology 2010, 123, 109–121. [Google Scholar] [CrossRef]
  17. Li, L.; Nearing, M.A.; Polyakov, V.O.; Nichols, M.H.; Pierson, F.B.; Cavanaugh, M.L. Evolution of Rock Cover, Surface Roughness, and Its Effect on Soil Erosion under Simulated Rainfall. Geoderma 2020, 379, 114622. [Google Scholar] [CrossRef]
  18. Li, J.; Wang, W.; Guo, M.; Kang, H.; Wang, Z.; Huang, J.; Sun, B.; Wang, K.; Zhang, G.; Bai, Y. Effects of Soil Texture and Gravel Content on the Infiltration and Soil Loss of Spoil Heaps under Simulated Rainfall. J. Soils Sediments 2020, 20, 3896–3908. [Google Scholar] [CrossRef]
  19. Peng, X.D.; Shi, D.M.; Jiang, D.; Wang, S.S.; Li, Y.X. Runoff Erosion Process on Different Underlying Surfaces from Disturbed Soils in the Three Gorges Reservoir Area, China. Catena 2014, 123, 215–224. [Google Scholar] [CrossRef]
  20. Wang, X.Y.; Li, Z.X.; Cai, C.F.; Shi, Z.H.; Xu, Q.X.; Fu, Z.Y.; Guo, Z.L. Effects of Rock Fragment Cover on Hydrological Response and Soil Loss from Regosols in a Semi-Humid Environment in South-West China. Geomorphology 2012, 151–152, 234–242. [Google Scholar] [CrossRef]
  21. Lv, J.; Luo, H.; Xie, Y. Effects of Rock Fragment Content, Size and Cover on Soil Erosion Dynamics of Spoil Heaps through Multiple Rainfall Events. Catena 2019, 172, 179–189. [Google Scholar] [CrossRef]
  22. Luo, H.; Rong, Y.B.; Lv, J.; Xie, Y.S. Runoff Erosion Processes on Artificially Constructed Conically-Shaped Overburdened Stockpiles with Different Gravel Contents: Laboratory Experiments with Simulated Rainfall. Catena 2019, 175, 93–100. [Google Scholar] [CrossRef]
  23. Wen, X.; Zhen, L. Soil Erosion Control Practices in the Chinese Loess Plateau: A Systematic Review. Environ. Dev. 2020, 34, 100493. [Google Scholar] [CrossRef]
  24. Rickson, R.J. Controlling Sediment at Source: An Evaluation of Erosion Control Geotextiles. Earth Surf. Process. Landf. 2006, 31, 550–560. [Google Scholar] [CrossRef]
  25. Mügler, C.; Ribolzi, O.; Janeau, J.-L.; Rochelle-Newall, E.; Latsachack, K.; Thammahacksa, C.; Viguier, M.; Jardé, E.; Henri-Des-Tureaux, T.; Sengtaheuanghoung, O.; et al. Experimental and Modelling Evidence of Short-Term Effect of Raindrop Impact on Hydraulic Conductivity and Overland Flow Intensity. J. Hydrol. 2019, 570, 401–410. [Google Scholar] [CrossRef]
  26. Bhattacharyya, R.; Smets, T.; Fullen, M.; Poesen, J.; Booth, C. Effectiveness of Geotextiles in Reducing Runoff and Soil Loss: A Synthesis. Catena 2010, 81, 184–195. [Google Scholar] [CrossRef]
  27. Whitman, B.; Zech, W.; Donald, W. Improvements in Small-Scale Standardized Testing of Geotextiles Used in Silt Fence Applications. Geotext. Geomembr. 2019, 47, 598–609. [Google Scholar] [CrossRef]
  28. Li, J.; Cao, Y.; Yao, J.; Jia, G.; Quan, X.; Zhai, H. Temporal and spatial variation analysis of soil erosion in Beijing-Tianjin-Hebei region based on RUSLE model. Water Resour. Hydropower Eng. 2024, 55, 186–199. (In Chinese) [Google Scholar] [CrossRef]
  29. Zhang, Z.; Xu, W.; Li, L.; Huang, J.; Deng, L.; Wang, Q. Effects of Temporal Conservation Measures on Water Erosion Processes of Disturbed Soil Accumulation in Construction Projects. J. Clean. Prod. 2021, 319, 128612. [Google Scholar] [CrossRef]
  30. Luo, H.; Zhao, T.N.; Dong, M.; Gao, J.; Peng, X.F.; Guo, Y.; Wang, Z.M.; Liang, C. Field Studies on the Effects of Three Geotextiles on Runoff and Erosion of Road Slope in Beijing, China. Catena 2013, 109, 150–156. [Google Scholar] [CrossRef]
  31. De Baets, S.; Poesen, J.; Knapen, A.; Barberá, G.G.; Navarro, J.A. Root Characteristics of Representative Mediterranean Plant Species and Their Erosion-Reducing Potential during Concentrated Runoff. Plant Soil 2007, 294, 169–183. [Google Scholar] [CrossRef]
  32. Vannoppen, W.; Baets, S.; Keeble, J.; Dong, Y.F.; Poesen, J. How Do Root and Soil Characteristics Affect the Erosion-Reducing Potential of Plant Species? Ecol. Eng. 2017, 109, 186–195. [Google Scholar] [CrossRef]
  33. Yang, S.; Gao, Z.; Li, Y.; Niu, Y.; Su, Y.; Wang, K. Erosion Control of Hedgerows under Soils Affected by Disturbed Soil Accumulation in the Slopes of Loess Plateau, China. Catena 2019, 181, 104079. [Google Scholar] [CrossRef]
  34. Wang, L.J.; Zhang, Y.L.; Jia, J.C.; Zhen, Q.; Zhang, X.C. Effect of Vegetation on the Flow Pathways of Steep Hillslopes: Overland Flow Plot-Scale Experiments and Their Implications. Catena 2021, 204, 105438. [Google Scholar] [CrossRef]
  35. de Almeida, W.S.; Panachuki, E.; de Oliveira, P.T.S.; da Silva Menezes, R.; Sobrinho, T.A.; de Carvalho, D.F. Effect of Soil Tillage and Vegetal Cover on Soil Water Infiltration. Soil Tillage Res. 2018, 175, 130–138. [Google Scholar] [CrossRef]
  36. Li, J.M.; Li, H.; Guo, M.M.; Ding, W.F.; Zhang, C.W.; Liu, J.G.; Xu, W.S.; Tong, X.X.; Sun, B.Y. Influences of Vegetation Types and Near-Surface Characteristics on Hydrodynamics and Soil Erosion of Steep Spoil Heaps under Rainfall and Overland Flow Conditions. Soil Tillage Res. 2025, 247, 106378. [Google Scholar] [CrossRef]
  37. USDA. Predicting Soil Erosion by Water: A Guide to Conservation Planning with the Revised Universal Soil Loss Equation (RUSLE); USDA: Washington, DC, USA, 1997. [Google Scholar]
  38. Wang, L.H.; Dalabay, N.; Lu, P.; Wu, F.Q. Effects of Tillage Practices and Slope on Runoff and Erosion of Soil from the Loess Plateau, China, Subjected to Simulated Rainfall. Soil Tillage Res. 2017, 166, 147–156. [Google Scholar] [CrossRef]
  39. Ricks, M.D.; Horne, M.A.; Faulkner, B.; Zech, W.C.; Fang, X.; Donald, W.N.; Perez, M.A. Design of a Pressurized Rainfall Simulator for Evaluating Performance of Erosion Control Practices. Water 2019, 11, 2386. [Google Scholar] [CrossRef]
  40. ASTM D6459-19; Standard Test Method for Determination of Rolled Erosion Control Product Performance in Protecting Hillslopes from Rainfall-Induced Erosion. ASTM: West Conshohocken, PA, USA, 2015.
  41. Shenzhen Meteorological Bureau; Planning, Land, and Resources Commission of Shenzhen Municipality. Rainstorm Intensity Formula and Calculation Chart of Shenzhen City; Shenzhen Standards Press: Shenzhen, China, 2015. (In Chinese) [Google Scholar]
  42. Li, J.; Li, L.; Wang, W.; Kang, H.; Guo, M.; Huang, J.; Wang, Y.; Lou, Y.; Tong, X.; Nie, H. Hydrological and Erosion Responses of Steep Spoil Heaps to Taproot and Fibrous Root Grasses under Simulated Rainfalls. J. Hydrol. 2023, 618, 129169. [Google Scholar] [CrossRef]
  43. Luk, S.H.; Merz, W. Use of the Salt Tracing Technique to Determine the Velocity of Overland Flow. Use Salt Tracing Tech. Determ. Veloc. Overl. Flow 1992, 5, 289–301. [Google Scholar]
  44. Sha, J.D.; Bai, Q.J. Experimental Study on Hydraulic Characteristics of Rill Flows over Clay Soil Slope. J. Sediment Res. 2001, 6, 39–44. [Google Scholar]
  45. Govers, G.; Giménez, R.; Van Oost, K. Rill Erosion: Exploring the Relationship between Experiments, Modelling and Field Observations. Earth Sci. Rev. 2007, 84, 87–102. [Google Scholar] [CrossRef]
  46. Evaluating Irregular Slopes for Soil Loss Prediction. Available online: https://www.cabidigitallibrary.org/doi/full/10.5555/19741913147 (accessed on 13 September 2024).
  47. Nearing, M.A.; Norton, L.D.; Bulgakov, D.A.; Larionov, G.A.; West, L.T.; Dontsova, K.M. Hydraulics and Erosion in Eroding Rills. Water Resour. Res. 1997, 33, 865–876. [Google Scholar] [CrossRef]
  48. Knapen, A.; Poesen, J.; Govers, G.; Gyssels, G.; Nachtergaele, J. Resistance of Soils to Concentrated Flow Erosion: A Review. Earth Sci. Rev. 2007, 80, 75–109. [Google Scholar] [CrossRef]
  49. Bagnold, R.A. An Approach to the Sediment Transport Problem from General Physics; U.S. Government Printing Office: Washington, DC, USA, 1966. [Google Scholar]
  50. Riley, S.J. Aspects of the Differences in the Erodibility of the Waste Rock Dump and Natural Surfaces, Ranger Uranium Mine, Northern Territory, Australia. Appl. Geogr. 1995, 15, 309–323. [Google Scholar] [CrossRef]
  51. The Central People’s Government of the People’s Republic of China. Available online: https://www.gov.cn/gongbao/content/2023/content_5738894.htm (accessed on 3 April 2023).
  52. Zhang, L.; Dong, J.; Yuan, L.; Zhu, Y.; Huang, Z.; Li, W.; Wang, H.; Tang, L.; Tian, H.; Gao, Z. Sediment-reducing benefits by runoff regulation under engineering measures in steep slope of abandoned soil deposits in Chinese loessial region. Trans. Chin. Soc. Agric. Eng. 2019, 35, 101–109. (In Chinese) [Google Scholar] [CrossRef]
  53. Niu, Y.; Gao, Z.; Liu, Z.; Zhang, S. Experimental study on the effects of slope surface of engineering aceumulation on overland flow and sediment reduction. South-North Water Transf. Water Sci. Technol. 2015, 13, 862–866. (In Chinese) [Google Scholar] [CrossRef]
  54. Yang, S.; Gao, Z.; Li, Y.; Niu, Y.; Kai, W.; Bai, H.; Qi, X.; Li, Y. Erosion resistance effects and mechanism of hedgerows in slope of engineering accumulation. Trans. Chin. Soc. Agric. Eng. 2017, 33, 147–154. (In Chinese) [Google Scholar] [CrossRef]
  55. Gan, Z.; Ye, J.; Zhou, Q.; Zhou, Z.; Shang, Z. Effects of grass vegetations on the processes of soil erosion over slope lands in simulated rainfalls. Acta Ecol. Sin. 2010, 30, 2387–2396. (In Chinese) [Google Scholar] [CrossRef]
  56. Zhang, X.; Li, P.; Li, Z.B.; Yu, G.Q.; Li, C. Effects of Precipitation and Different Distributions of Grass Strips on Runoff and Sediment in the Loess Convex Hillslope. Catena 2018, 162, 130–140. [Google Scholar] [CrossRef]
  57. Liu, J.; Li, P.; Liu, G.; Flanagan, D.C. Quantifying the Effects of Plant Litter in the Topsoil on the Soil Detachment Process by Overland Flow in Typical Grasslands of the Loess Plateau, China. Hydrol. Process. 2020, 34, 2076–2087. [Google Scholar] [CrossRef]
  58. Zhang, Z.; Nie, W.; Xu, W.; Huang, J.; Li, L.; Li, J.; Zhang, W.; Liu, J. Effects of runoff and sediment reduction on engineering accumulation slopes under different soil and water conservation temporary measures. Trans. Chin. Soc. Agric. Eng. 2022, 38, 141–150. (In Chinese) [Google Scholar] [CrossRef]
  59. Xue, D.; Guo, X.; Zhang, X. Runoff and Sediment Reduction Under Different Slope Eeological Restoration Modes of Waste Dump in Arid Mining Area. J. Soil Water Conserv. 2021, 35, 15–21. (In Chinese) [Google Scholar] [CrossRef]
  60. Nie, H.; Wang, W.; Guo, M.; Kang, H.; Li, J.; Bai, Y. Runoff sediment relationship and erosion dynamic characteristies for two types of engineering deposits under rainfall condition. Chin. J. Appl. Ecol. 2020, 31, 3141–3153. (In Chinese) [Google Scholar] [CrossRef]
  61. Zhou, T.; Su, Z.; Liu, G.; Wang, J.; Liu, Y.; Wu, Z.; Wang, L. Effects of typical ecological restoration measures for engineering accumulation on sediment yield and hydrodynamic process. Trans. Chin. Soc. Agric. Eng. 2022, 38, 91–100. (In Chinese) [Google Scholar] [CrossRef]
  62. Li, Y.; Niu, Y.; Wang, Z.; Gao, Z.; Zhang, S.; Liu, Z. Hydrodynamic parameters and their relationships of runoff over engineering accumulation slope. Trans. Chin. Soc. Agric. Eng. 2015, 31, 83–88. (In Chinese) [Google Scholar] [CrossRef]
  63. Li, J.; Zhang, C.; Wang, Z.; Wang, Y.; Xu, W.; Zhang, G.; Pu, J.; Liu, J. Impact of Different Vegetation Types on Runoff Characteristics of Spoil Heaps. J. Yangtze River Sci. Res. Inst. 2021, 38, 60–68. (In Chinese) [Google Scholar]
Figure 1. (a) Experimental flume, (b) Measure types, (c) Experimental plots.
Land 14 00951 g001
Figure 2. Simulated rainfall device.
Land 14 00951 g002
Figure 3. Runoff and sediment yield characteristics of different spoil heaps: (a) The variation of instantaneous runoff rate with time; (b) The variation of instantaneous flow velocity with time; (c) The variation of instantaneous soil loss rate with time.
Land 14 00951 g003
Figure 4. Average runoff and sediment yield characteristics of different spoil heaps. (a) Average runoff rate under different temporary vegetation measures; (b) Average flow velocity under different temporary vegetation measures; (c) Average soil loss rate under different temporary vegetation measures. Lowercase letters represent differences between BS, TF-300 cm, TF-75 cm, GS-300 cm, GS-75 cm, and ST, while uppercase letters represent differences between TF-300 cm, GS-300 cm, and ST. Where the same letter represents a non-significant difference (p > 0.05) and different letters represent a significant difference (p < 0.05).
Land 14 00951 g004
Figure 5. Characteristics of Reynolds number, Froude number, and resistance coefficient with production runoff over time for different spoil heaps: (a) The variation of Reynolds number with time; (b) The variation of Froude number with time; (c) The variation of Resistance coefficient with time.
Land 14 00951 g005
Figure 6. Average hydraulic parameters of different stacks Characterization: (a) Average Reynolds number under different temporary vegetation measures; (b) Average Froude number under different temporary vegetation measures; (c) Average resistance coefficient under different temporary vegetation measures. Lowercase letters represent differences between BS, TF-300 cm, TF-75 cm, GS-300 cm, GS-75 cm, and ST, while uppercase letters represent differences between TF-300 cm, GS-300 cm, and ST. Where the same letter represents a non-significant difference (p > 0.05) and different letters represent a significant difference (p < 0.05).
Land 14 00951 g006
Figure 7. Variation of hydrodynamic parameters with runoff production over time for different stacks Features: (a) The variation of runoff shear stress with time; (b) The variation of runoff stream power with time.
Land 14 00951 g007
Figure 8. Average hydrodynamic parameters of different stacks characterization: (a) Average runoff shear stress under different temporary vegetation measures; (b) Average runoff stream power under different temporary vegetation measures. Lowercase letters represent differences between BS, TF-300 cm, TF-75 cm, GS-300 cm, GS-75 cm, and ST, while uppercase letters represent differences between TF-300 cm, GS-300 cm, and ST. Where the same letter represents a non-significant difference (p > 0.05) and different letters represent a significant difference (p < 0.05).
Land 14 00951 g008
Figure 9. Relationship between erosion rate and runoff power quantification.
Land 14 00951 g009
Figure 10. Unit runoff and runoff power sediment production: (a) Unit sediment yield by runoff under different temporary vegetation measures; (b) Unit sediment yield by runoff stream power under different temporary vegetation measures. Lowercase letters represent differences between BS, TF-300 cm, TF-75 cm, GS-300 cm, GS-75 cm, and ST. Where the same letter represents a non-significant difference (p > 0.05) and different letters represent a significant difference (p < 0.05).
Land 14 00951 g010
Table 1. Runoff and sediment reduction benefits of temporary vegetation measures.
Underlay
Underlying Surface
Runoff YieldingSediment Yielding
Sub-Rainfall Yield/(L·m−2)Runoff Reduction Benefits (%)Sediment Yield Per Rainfall Event (g·m−2)Sediment Reduction Benefits (%)
BS85.42 -606.12-
TF-300 cm40.73 −52.32 7.38−98.78
TF-75 cm42.49 −50.26 41.02−93.23
GS-300 cm46.14 −45.98 47.70−92.13
GS-75 cm48.14 −43.64 110.10−81.83
ST42.75 −49.95 11.31−98.13
Disclaimer/Publisher’s Note: The statements, opinions and data contained in all publications are solely those of the individual author(s) and contributor(s) and not of MDPI and/or the editor(s). MDPI and/or the editor(s) disclaim responsibility for any injury to people or property resulting from any ideas, methods, instructions or products referred to in the content.

