1. Introduction
The ecological environment is the foundation of human survival and social development, and its condition and evolution are directly linked to human existence and sustainable development. Over the past half-century, rapid population growth and advancements in science and technology have accelerated the exploitation of natural resources in both scale and intensity. While these activities have brought substantial material wealth to human society, they have also exacerbated ecological imbalances. Issues such as vegetation destruction, climate change, water shortages, land degradation, and biodiversity loss have become increasingly prevalent, posing significant threats to regional ecological security and economic sustainability [
1,
2,
3]. Accurately understanding and assessing regional ecological conditions, clarifying their changing trends, and identifying driving mechanisms are fundamental to environmental protection. These efforts also serve as a critical basis for formulating environmental policies and resource development plans [
4,
5,
6].
In recent years, remote sensing technology has become an essential tool for regional ecological quality assessment due to its advantages of fast processing speed, wide coverage, and high timeliness. Many scholars have used remote sensing indices to evaluate ecological conditions, such as monitoring changes in vegetation cover through vegetation indices [
7,
8,
9], studying urban heat island effects using surface temperature data [
10,
11], and assessing regional water environments through water indices to extract river information [
12]. However, ecological conditions are a complex system influenced by multiple factors, and independent evaluations based on a single indicator can only reflect a specific aspect of the ecosystem, making it difficult to fully and accurately capture the overall ecological quality [
13,
14,
15,
16]. In response, Professor Xu Hanqiu [
17] proposed the Remote Sensing Ecological Index (RSEI) in 2013. This index, entirely based on remote sensing technology, integrates four indicators: greenness, humidity, heat, and dryness, enabling a comprehensive assessment of ecological conditions. It also visually reflects spatial variations in regional ecological quality and has been widely applied in different regions [
18,
19,
20]. As the application of the RSEI in ecological monitoring has expanded, many scholars have improved the method by refining aspects such as indicator selection [
21,
22], normalization [
23], and indicator synthesis [
24,
25] to meet the ecological assessment needs of various regions. These improvements have enhanced the applicability of the RSEI in regional ecological monitoring, yielding positive results. Therefore, to more accurately monitor and assess regional ecological quality, developing a more refined regional remote sensing ecological index is essential [
26].
The changes in ecological quality are influenced by multiple factors. In addition to natural factors, human activities are considered to be a major driving force behind the decline in ecological quality in some cases [
27,
28,
29,
30]. However, most studies focus primarily on analyzing the ecological quality of a study area and its spatiotemporal changes, with limited exploration of the specific factors driving these changes [
31,
32]. In fact, a thorough analysis of driving factors can more precisely reveal the root causes of ecological issues, providing a scientific basis for ecological protection and sustainable development [
33]. Common methods for analyzing influencing factors include correlation coefficient methods [
34,
35], elasticity coefficient methods [
36], panel quantile regression [
37], and geographically weighted regression [
38]. While these methods can effectively assess the impact of multiple factors, they struggle to uncover the interactions between factors and their combined effects on ecological quality changes. To address this limitation, Wang Jinfeng et al. [
39] proposed the Geographical Detector Model, a statistical method for detecting spatial heterogeneity and revealing underlying driving factors. This model not only quantitatively analyzes the explanatory power of each driving factor on ecological changes but also detects the interaction effects of driving factors on ecological quality. It has been widely applied in fields such as land use [
40], regional economy [
41], meteorology [
42], environment [
43], and public health [
44].
The Guangdong-Hong Kong-Macao Greater Bay Area (GBA) is the fourth largest bay area in the world, following the New York Bay Area, San Francisco Bay Area, and Tokyo Bay Area. It serves as an important spatial platform for the country’s development of a world-class city cluster and participation in global competition. Over the past few decades, the rapid economic development and urban expansion in the GBA have disrupted the original ecological system elements, structure, and functions, presenting severe challenges to ecological civilization construction. Timely and accurate acquisition of the spatiotemporal distribution characteristics, evolution trends, and driving mechanisms of ecological quality in the GBA is of great significance for promoting ecological governance and protection of urban environments. Given that the GBA is located in South China, with a consistently cloudy and rainy climate, and experiences dramatic ecological changes, the use of the RSEI for long-term ecological monitoring and assessment is often affected by cloud cover in optical imagery. This impact influences various aspects, such as regional image stitching, indicator extraction, normalization, and consistency of data acquisition across different time phases, ultimately affecting the spatiotemporal comparability of ecological indices and the accuracy of evolution pattern analysis. In previous studies on long-term ecological quality assessment in the GBA, the comparability of time series has been relatively low, making it difficult to accurately reflect the spatiotemporal distribution and evolution patterns of ecological quality [
45,
46,
47,
48].
To address this issue, based on the RSEI, a Unified Remote Sensing Ecological Index (URSEI) was developed by optimizing data selection, normalizing invariant regional indicators, and integrating multi-temporal principal component analysis. This method is designed for long time series and regions with dramatic ecological changes. Using long-term satellite remote sensing data, this study analyzed the spatiotemporal distribution patterns and evolution trends of ecological environmental quality in the GBA from 1990 to 2020. Spatial autocorrelation analysis was then applied to investigate the spatial clustering of ecological indices in the GBA. Furthermore, the Geographical Detector Model was employed to quantitatively explore the impact mechanisms of natural factors such as topography and climate, and human factors such as land use types and population density, on the spatial differentiation of ecological quality. The findings contribute to a comprehensive understanding of the ecological environment in the GBA and its driving mechanisms, providing a scientific basis for regional ecological protection and governance.
4. Discussion
4.1. Applicability Analysis of the URSEI Model
The RSEI has been widely used due to its easy data acquisition, simple calculation, and the absence of manually assigned weights and thresholds. However, when applying the RSEI for long-term ecological quality assessments, the consistency and comparability of time-series evaluation results are often affected by factors such as data acquisition time and weather variations. Additionally, the multiple normalization processes in the RSEI model make the assessment results more dependent on the relative ecological conditions within the study area. In regions with drastic ecological changes, such as the Guangdong-Hong Kong-Macau Greater Bay Area, this dependence further weakens the consistency and comparability of time-series analysis results.
This study proposed multiple improvements to the Remote Sensing Ecological Index (RSEI) to address the challenge of maintaining temporal consistency in ecological quality assessment for cloudy and rainy regions. Given the persistent cloud cover in the Greater Bay Area, our approach moved beyond reliance on single images by selecting imagery from both growing and non-growing seasons within a three-year window (the target year plus one year before and after). Annual indicator factors were generated through median synthesis followed by averaging, which effectively mitigated the impacts of extreme weather and solar altitude variations while enhancing data stability and representativeness. To address thermal data gaps caused by cloud cover, we employed a random forest model using land cover type, NDVI, and elevation as predictors to reconstruct and correct LST data, ensuring spatial consistency.
In terms of indicator normalization, the traditional RSEI normalizes each temporal dataset independently, making it vulnerable to extreme values and temporal incomparability. Our improved method established a land cover invariant reference layer (1990–2020) and extracted indicator values from these stable areas as global normalization thresholds. This approach simultaneously eliminated extreme value effects and maintained consistent normalization baselines across different time periods. For principal component analysis, the conventional RSEI performs PCA separately for each temporal dataset, resulting in inconsistent weights across periods. Our enhanced method merged indicator factors from all four time periods for unified PCA, generating global eigenvectors. The application of fixed weights across all periods ensured the temporal comparability of the URSEI.
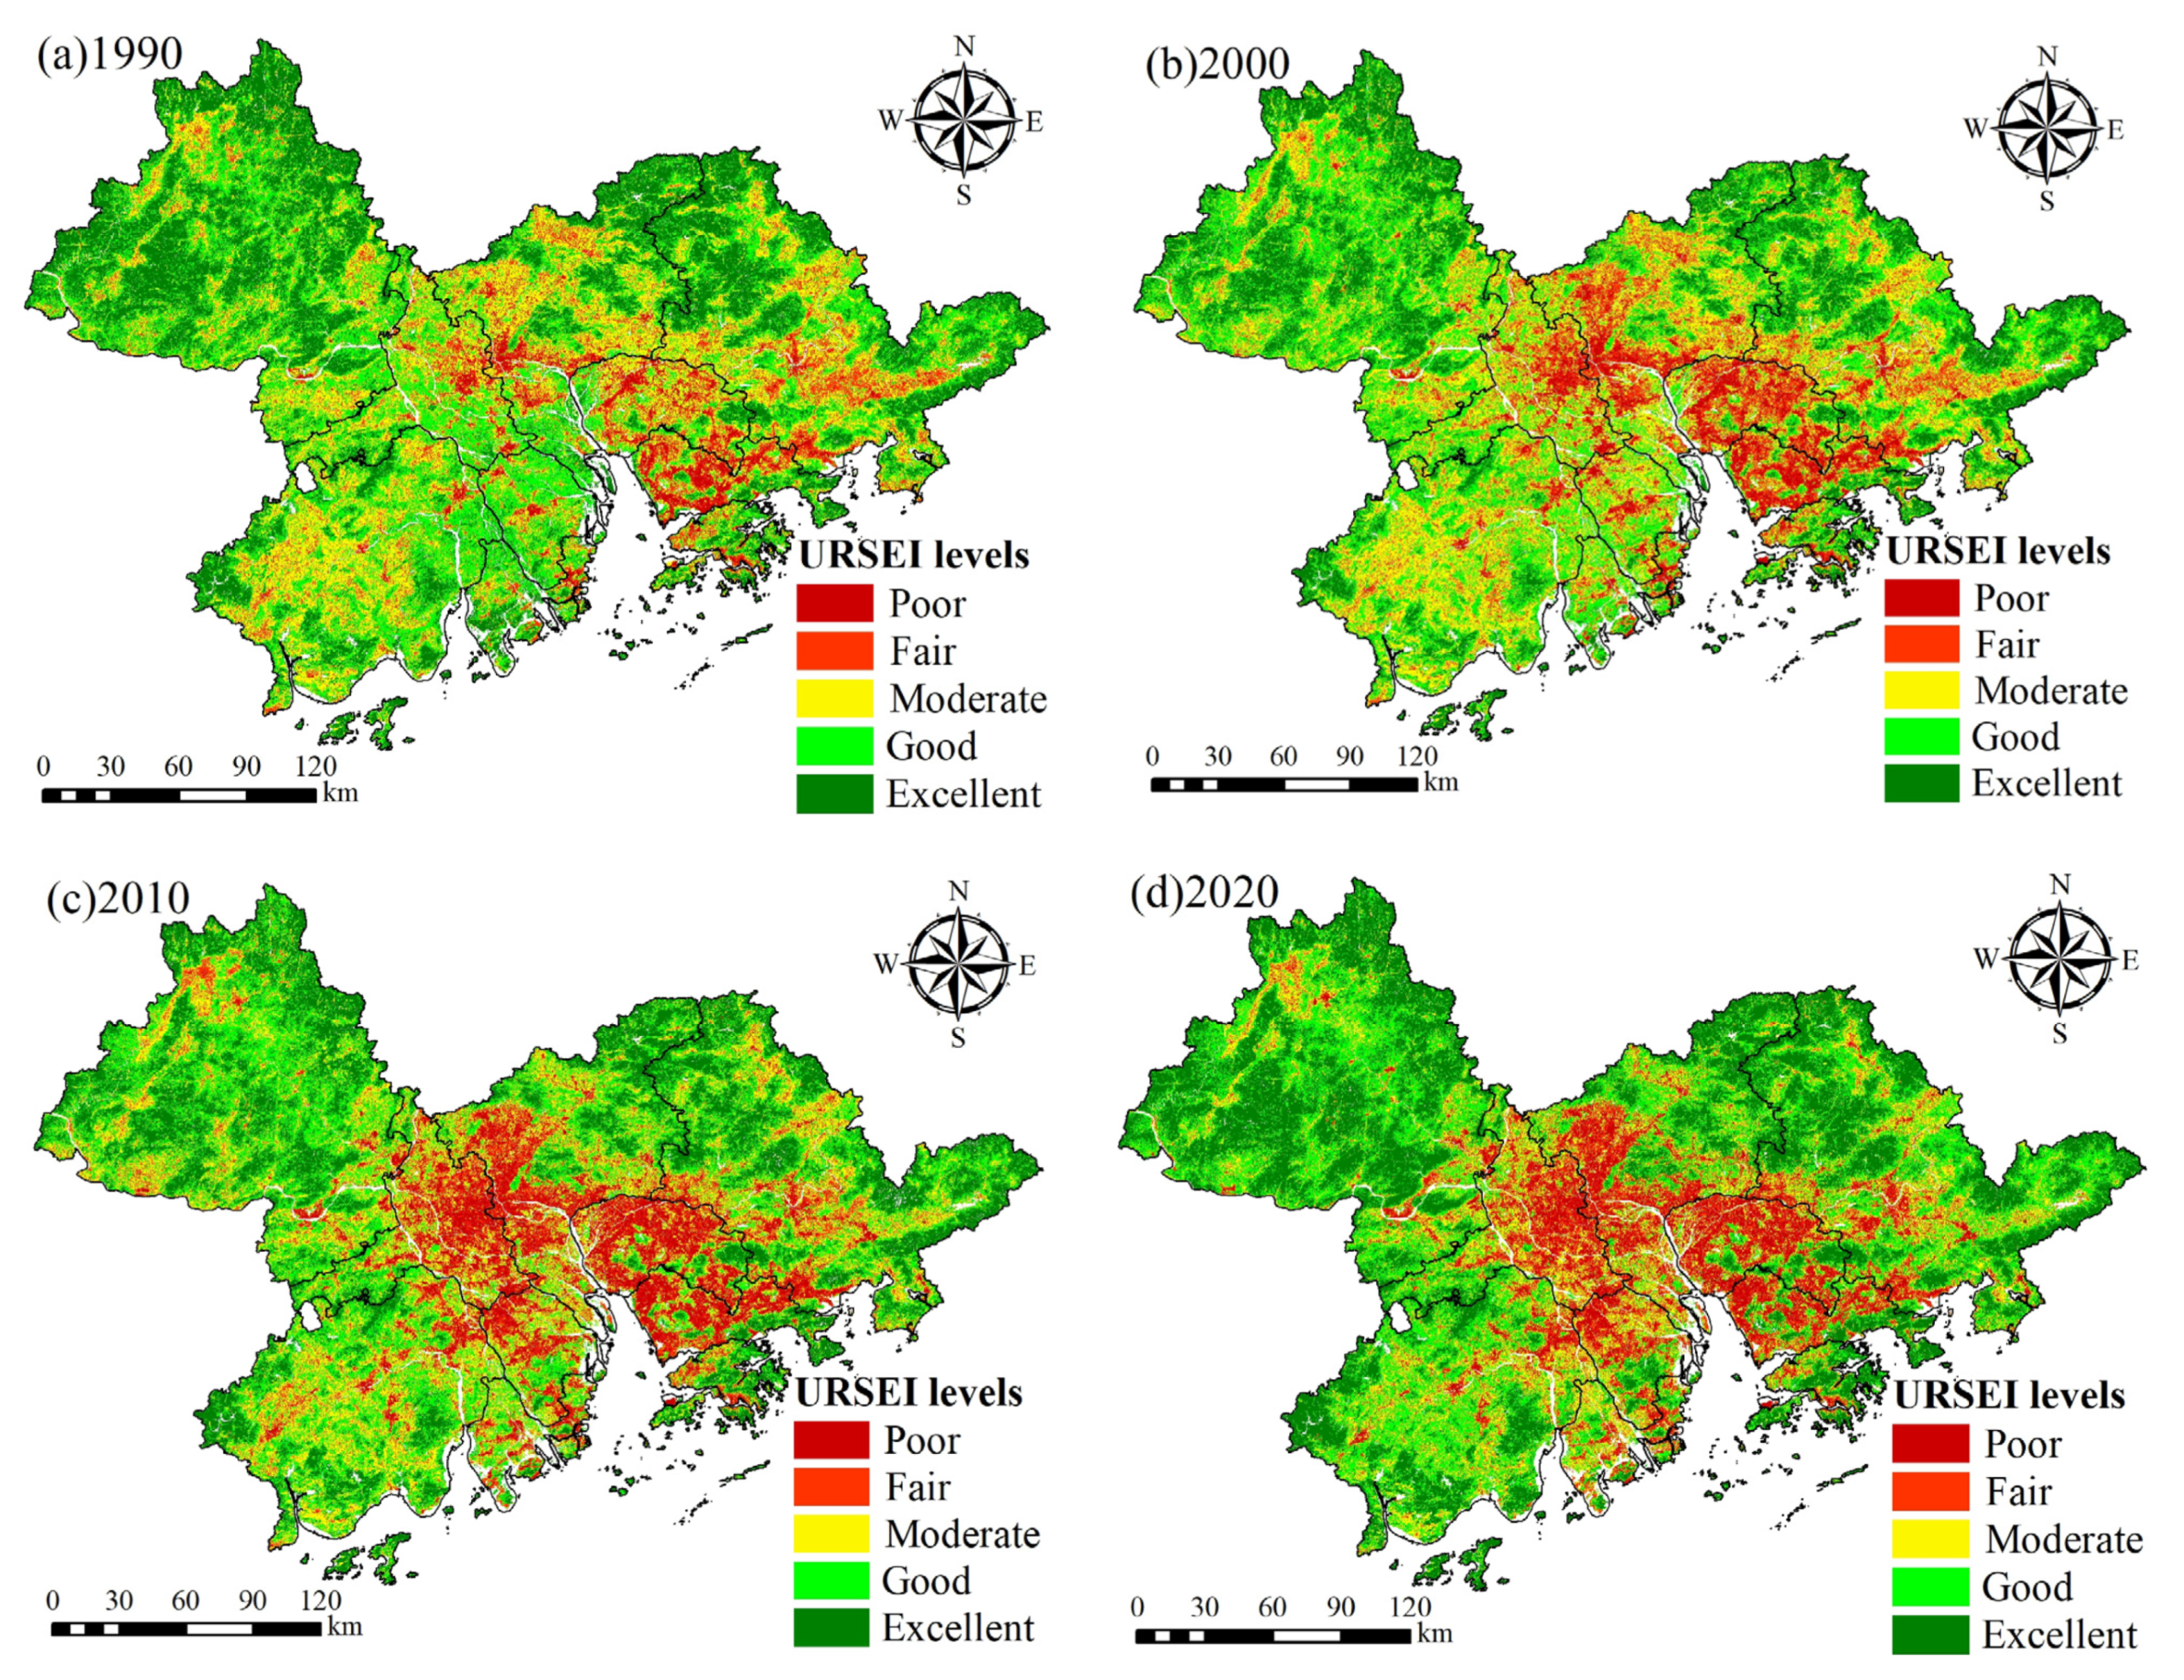
The average correlation test revealed that the URSEI’s correlation with individual indicators was significantly stronger than any single indicator, confirming its superior comprehensive representation capability. Furthermore, the URSEI classification maps of the Greater Bay Area (
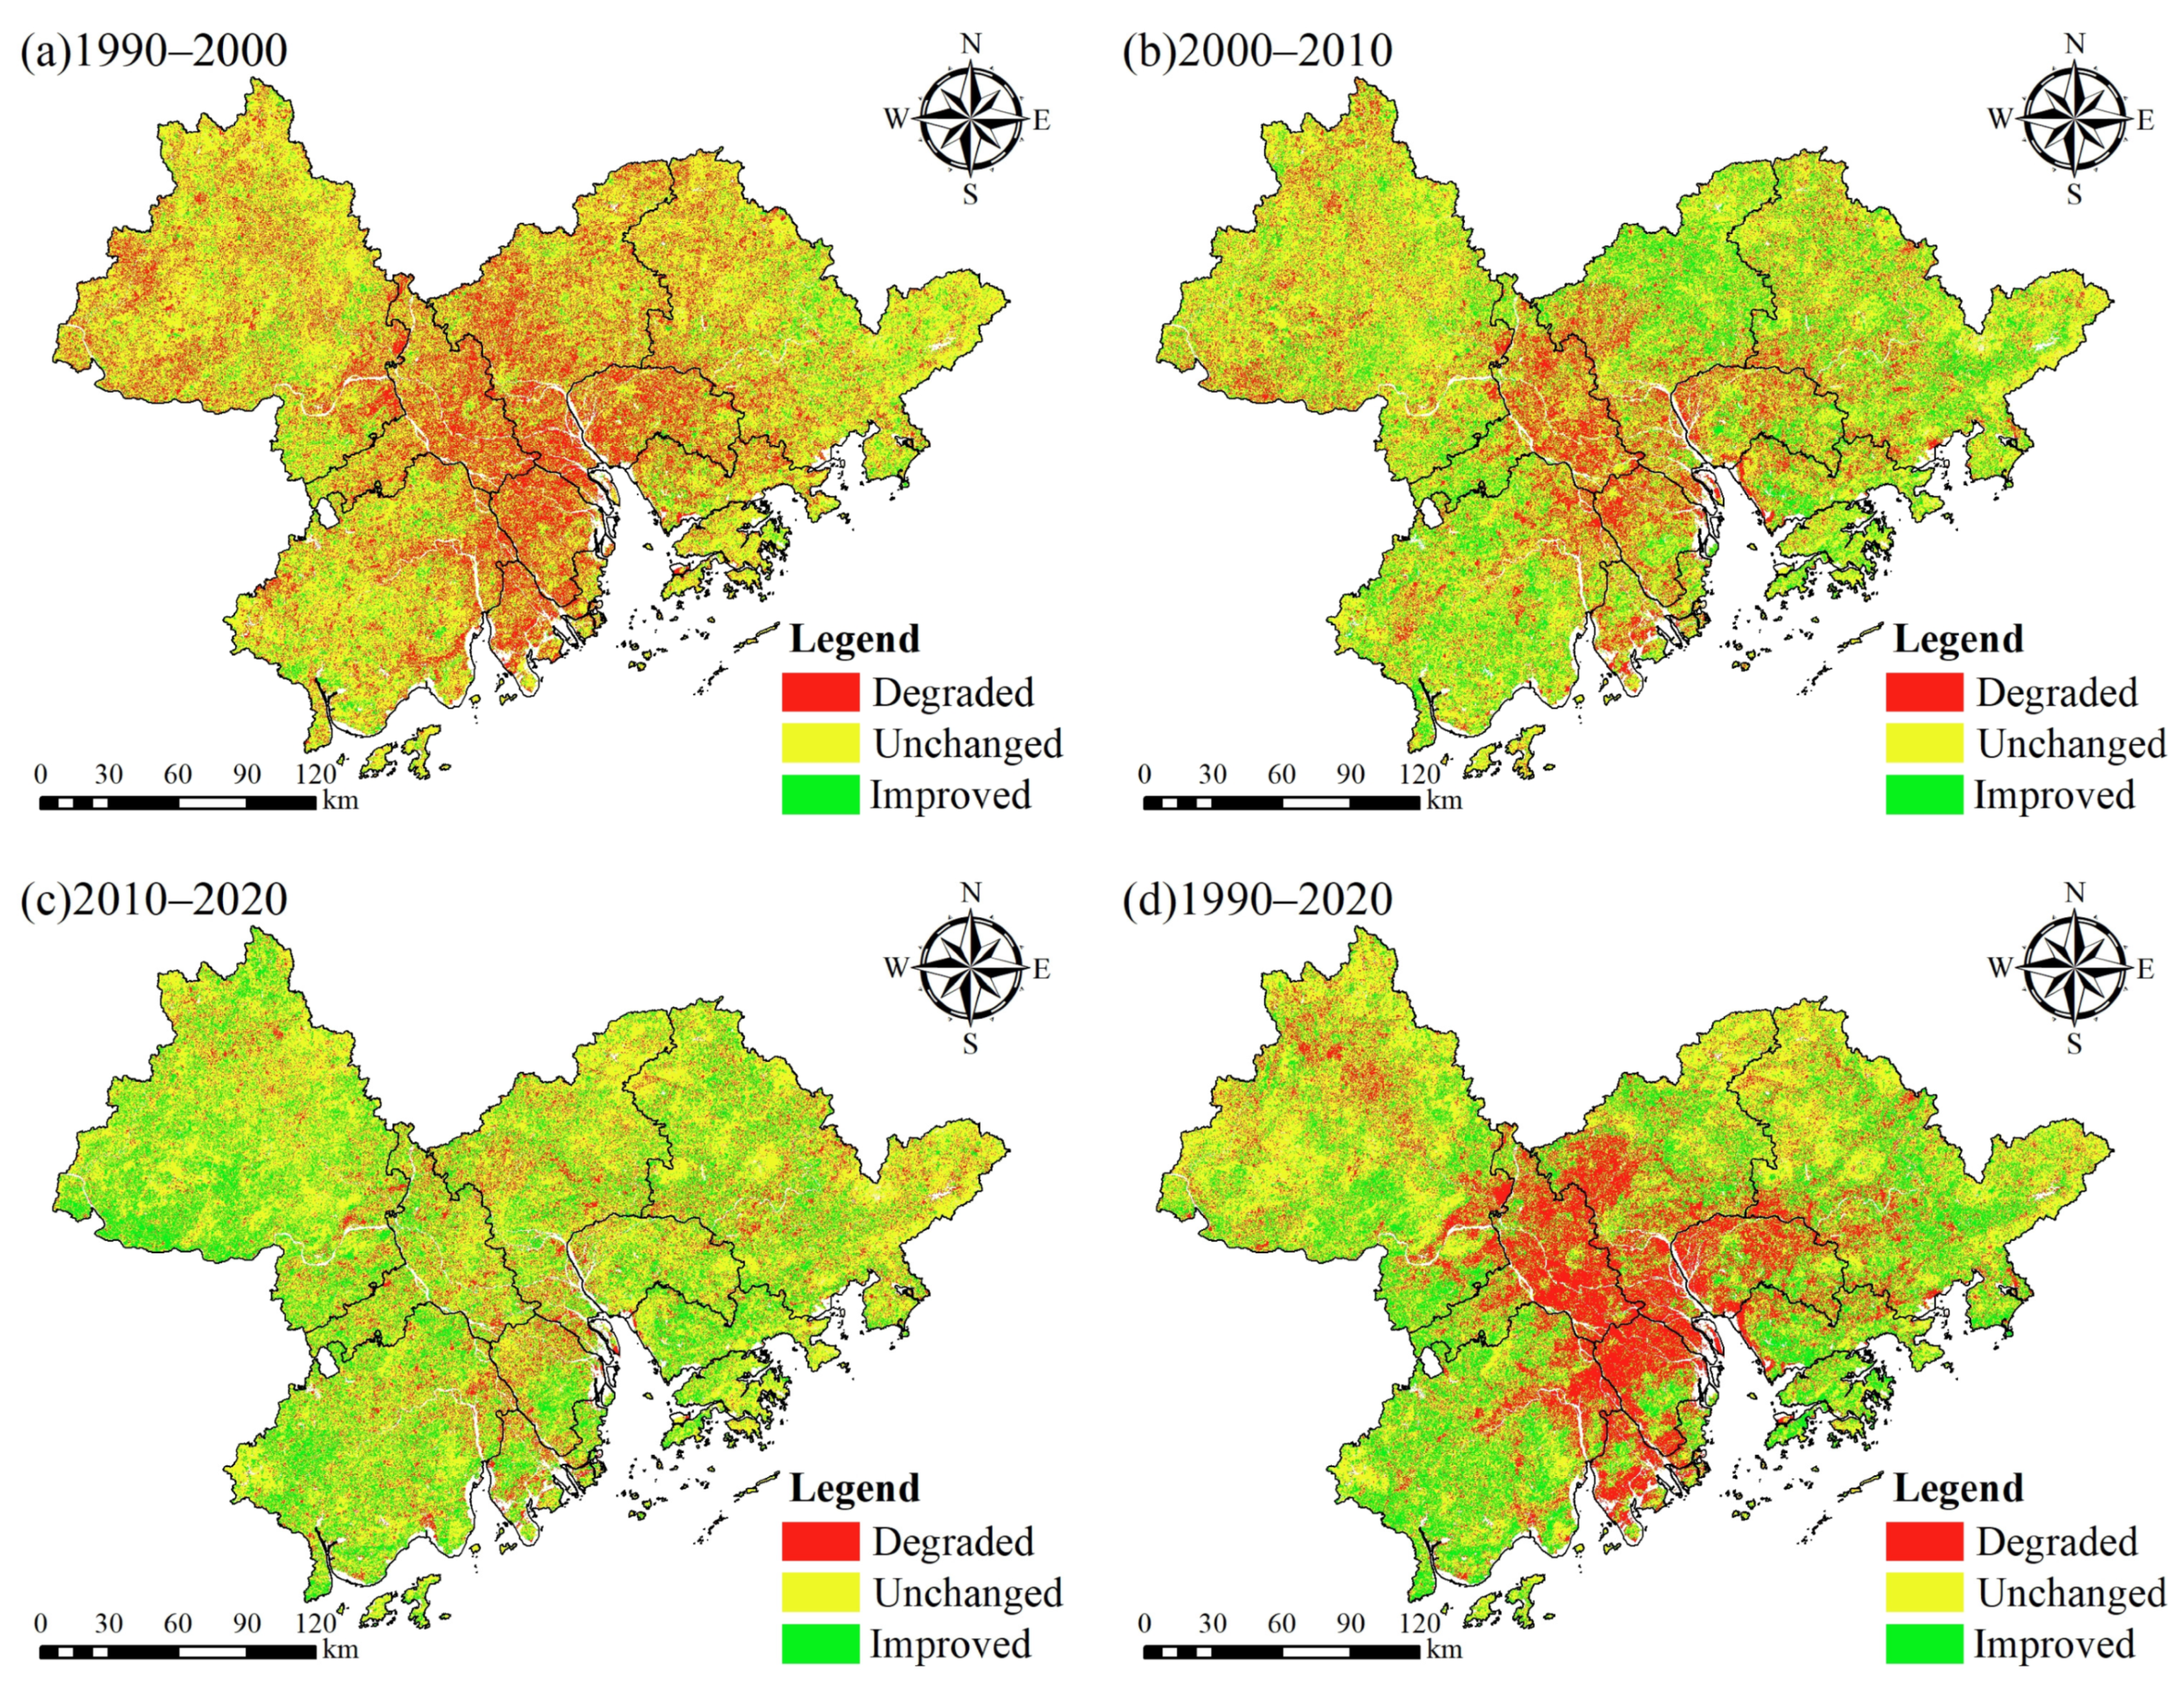
Figure 2) showed no apparent edge-matching or mosaic artifacts, with highly consistent spatial patterns of ecological quality across time periods, ensuring result coherence and integrity while improving visualization effectiveness. Similarly, the ecological quality change detection maps (
Figure 5) exhibited no anomalous regions, with detected changes closely matching actual conditions, demonstrating the URSEI’s effectiveness in maintaining temporal comparability for long-term sequence analysis.
Under the challenging conditions of high cloud cover, frequent rainfall, and rapid ecological changes in the GBA, the URSEI model demonstrates strong applicability and reliability. Its improved normalization method and multi-temporal principal component fusion analysis technique not only enhance the consistency and comparability of ecological quality assessments but also provide robust support for accurately analyzing long-term ecological evolution trends. In future applications, the URSEI model could be extended to other regions exhibiting similar climatic characteristics and ecological dynamics. Particularly suitable candidates include rapidly urbanizing areas such as the Yangtze River Delta urban agglomeration and Chengdu-Chongqing economic zone, which share with the Greater Bay Area both intensive anthropogenic pressures and frequent cloudy/rainy conditions. The model would also prove valuable for monitoring ecological changes in other southeastern coastal regions where persistent cloud cover and precipitation similarly challenge conventional remote sensing assessments of fast-evolving environments.
4.2. Spatiotemporal Evolution Characteristics and Influencing Factors of Ecological Quality in the GBA
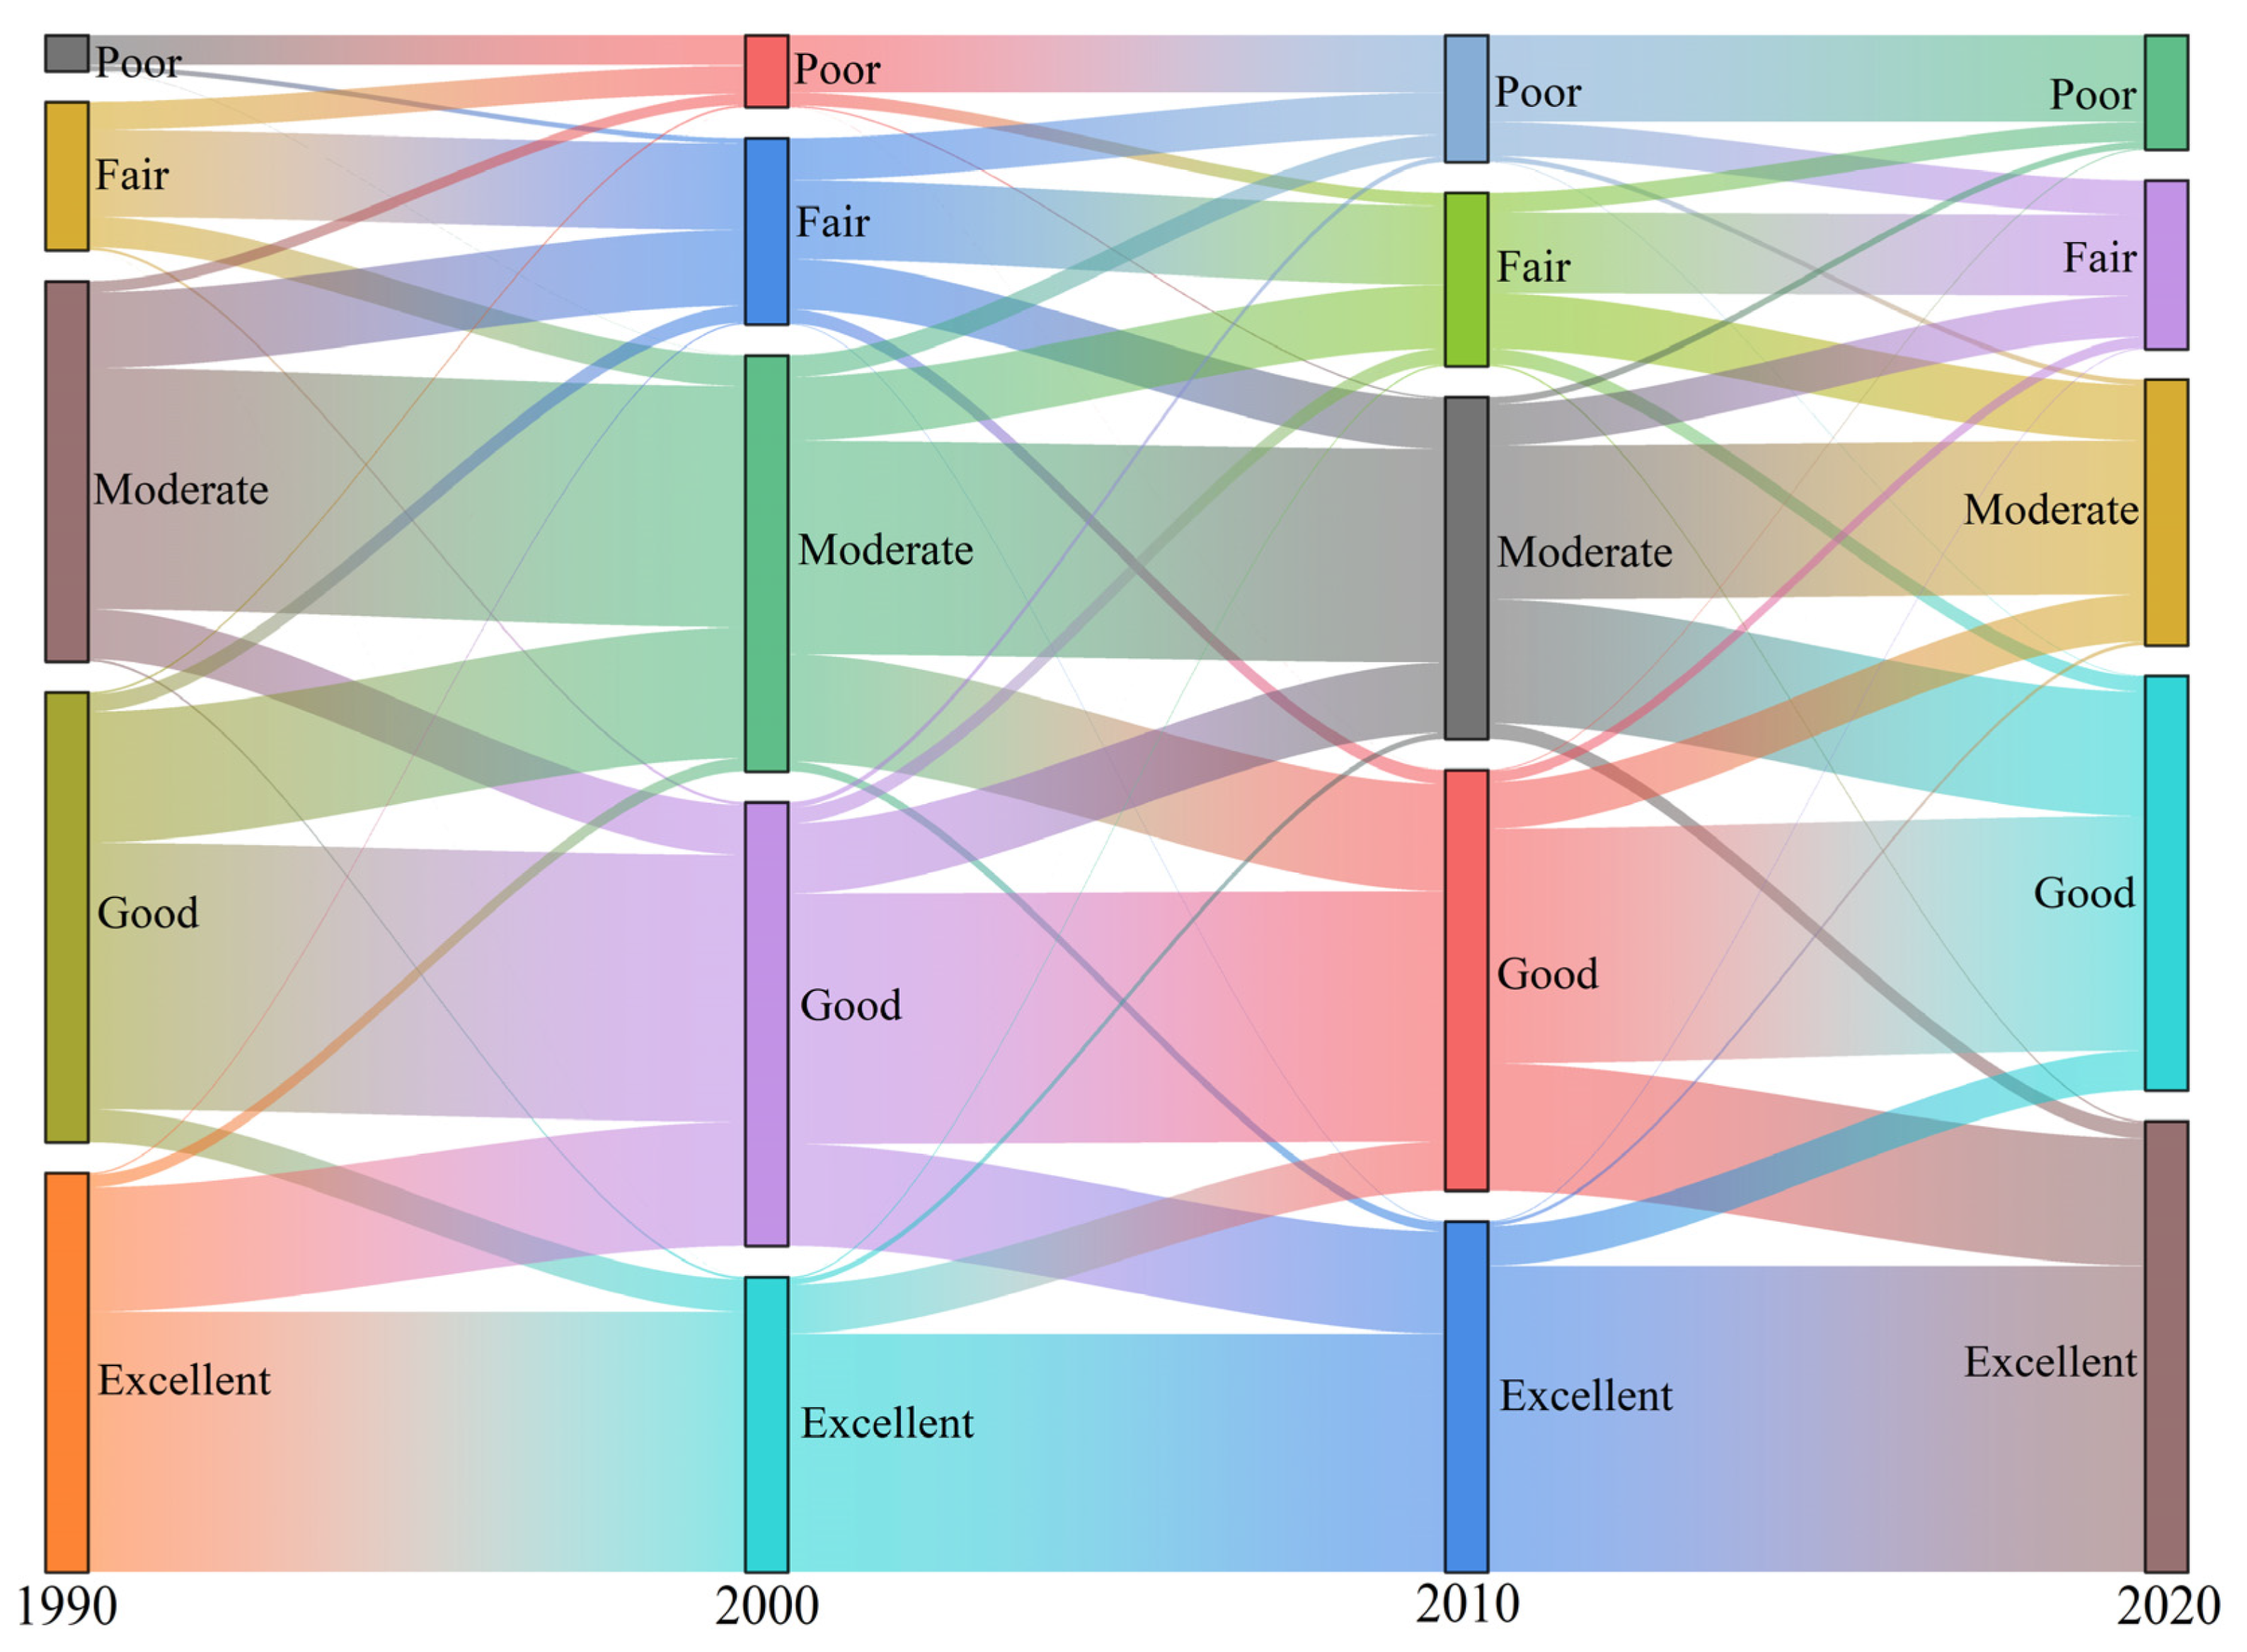
Based on the spatiotemporal variation analysis of the URSEI, this study reveals the significant characteristics and driving mechanisms of ecological quality evolution in the GBA over the past 30 years (1990–2020). The results indicate that ecological quality changes in the GBA exhibit distinct phased characteristics, with 2010 serving as a turning point, dividing the evolution into two stages.
In the first stage (1990–2010), the GBA experienced a significant decline in ecological quality. This trend is closely associated with rapid industrialization and urbanization in the region. During this period, cities on the eastern shore of the Pearl River Estuary, such as Guangzhou, Shenzhen, and Dongguan, served as the frontiers of China’s economic reform, where industrial expansion and urban development progressed simultaneously, leading to a substantial increase in human activity intensity. Unregulated land use practices and declining vegetation cover contributed to severe environmental degradation. Between 2000 and 2010, as industrial relocation and upgrading occurred, low-end manufacturing industries gradually shifted to western cities such as Foshan, Jiangmen, and Zhongshan, further exacerbating regional ecological deterioration.
In the second stage (2010–2020), ecological quality in the GBA showed an improving trend. This shift can be attributed to several key factors. First, the pace of urbanization slowed down, and the expansion of industrial land significantly decreased. Second, after 2010, both national and local governments introduced a series of ecological and environmental protection policies, such as the Outline of the Plan for the Reform and Development of the Pearl River Delta Region (2008–2020) and the Guangdong-Hong Kong-Macao Greater Bay Area Development Plan, which explicitly set ecological conservation and green development as key objectives, thereby promoting the implementation of ecological restoration projects. Lastly, the regional industrial system progressively transitioned toward high-tech industries, while traditional high-pollution, high-energy-consumption industries were either phased out or upgraded, effectively reducing industrial pressure on the ecological environment. For instance, cities like Shenzhen vigorously developed high-tech industries and modern service sectors, leading to decreased industrial pollution emissions.
From a spatial perspective, the ecological quality of the GBA exhibits significant spatial heterogeneity. The central urban cluster, including Guangzhou, Foshan, Dongguan, Shenzhen, and Zhongshan, generally shows lower ecological quality due to intensive human activities. In contrast, the northwestern and northeastern regions, such as Zhaoqing and Huizhou, benefit from favorable topographic conditions, high vegetation coverage, and lower human disturbances, maintaining relatively high ecological quality levels. This spatial differentiation pattern is strongly coupled with regional economic development levels and human activity intensity.
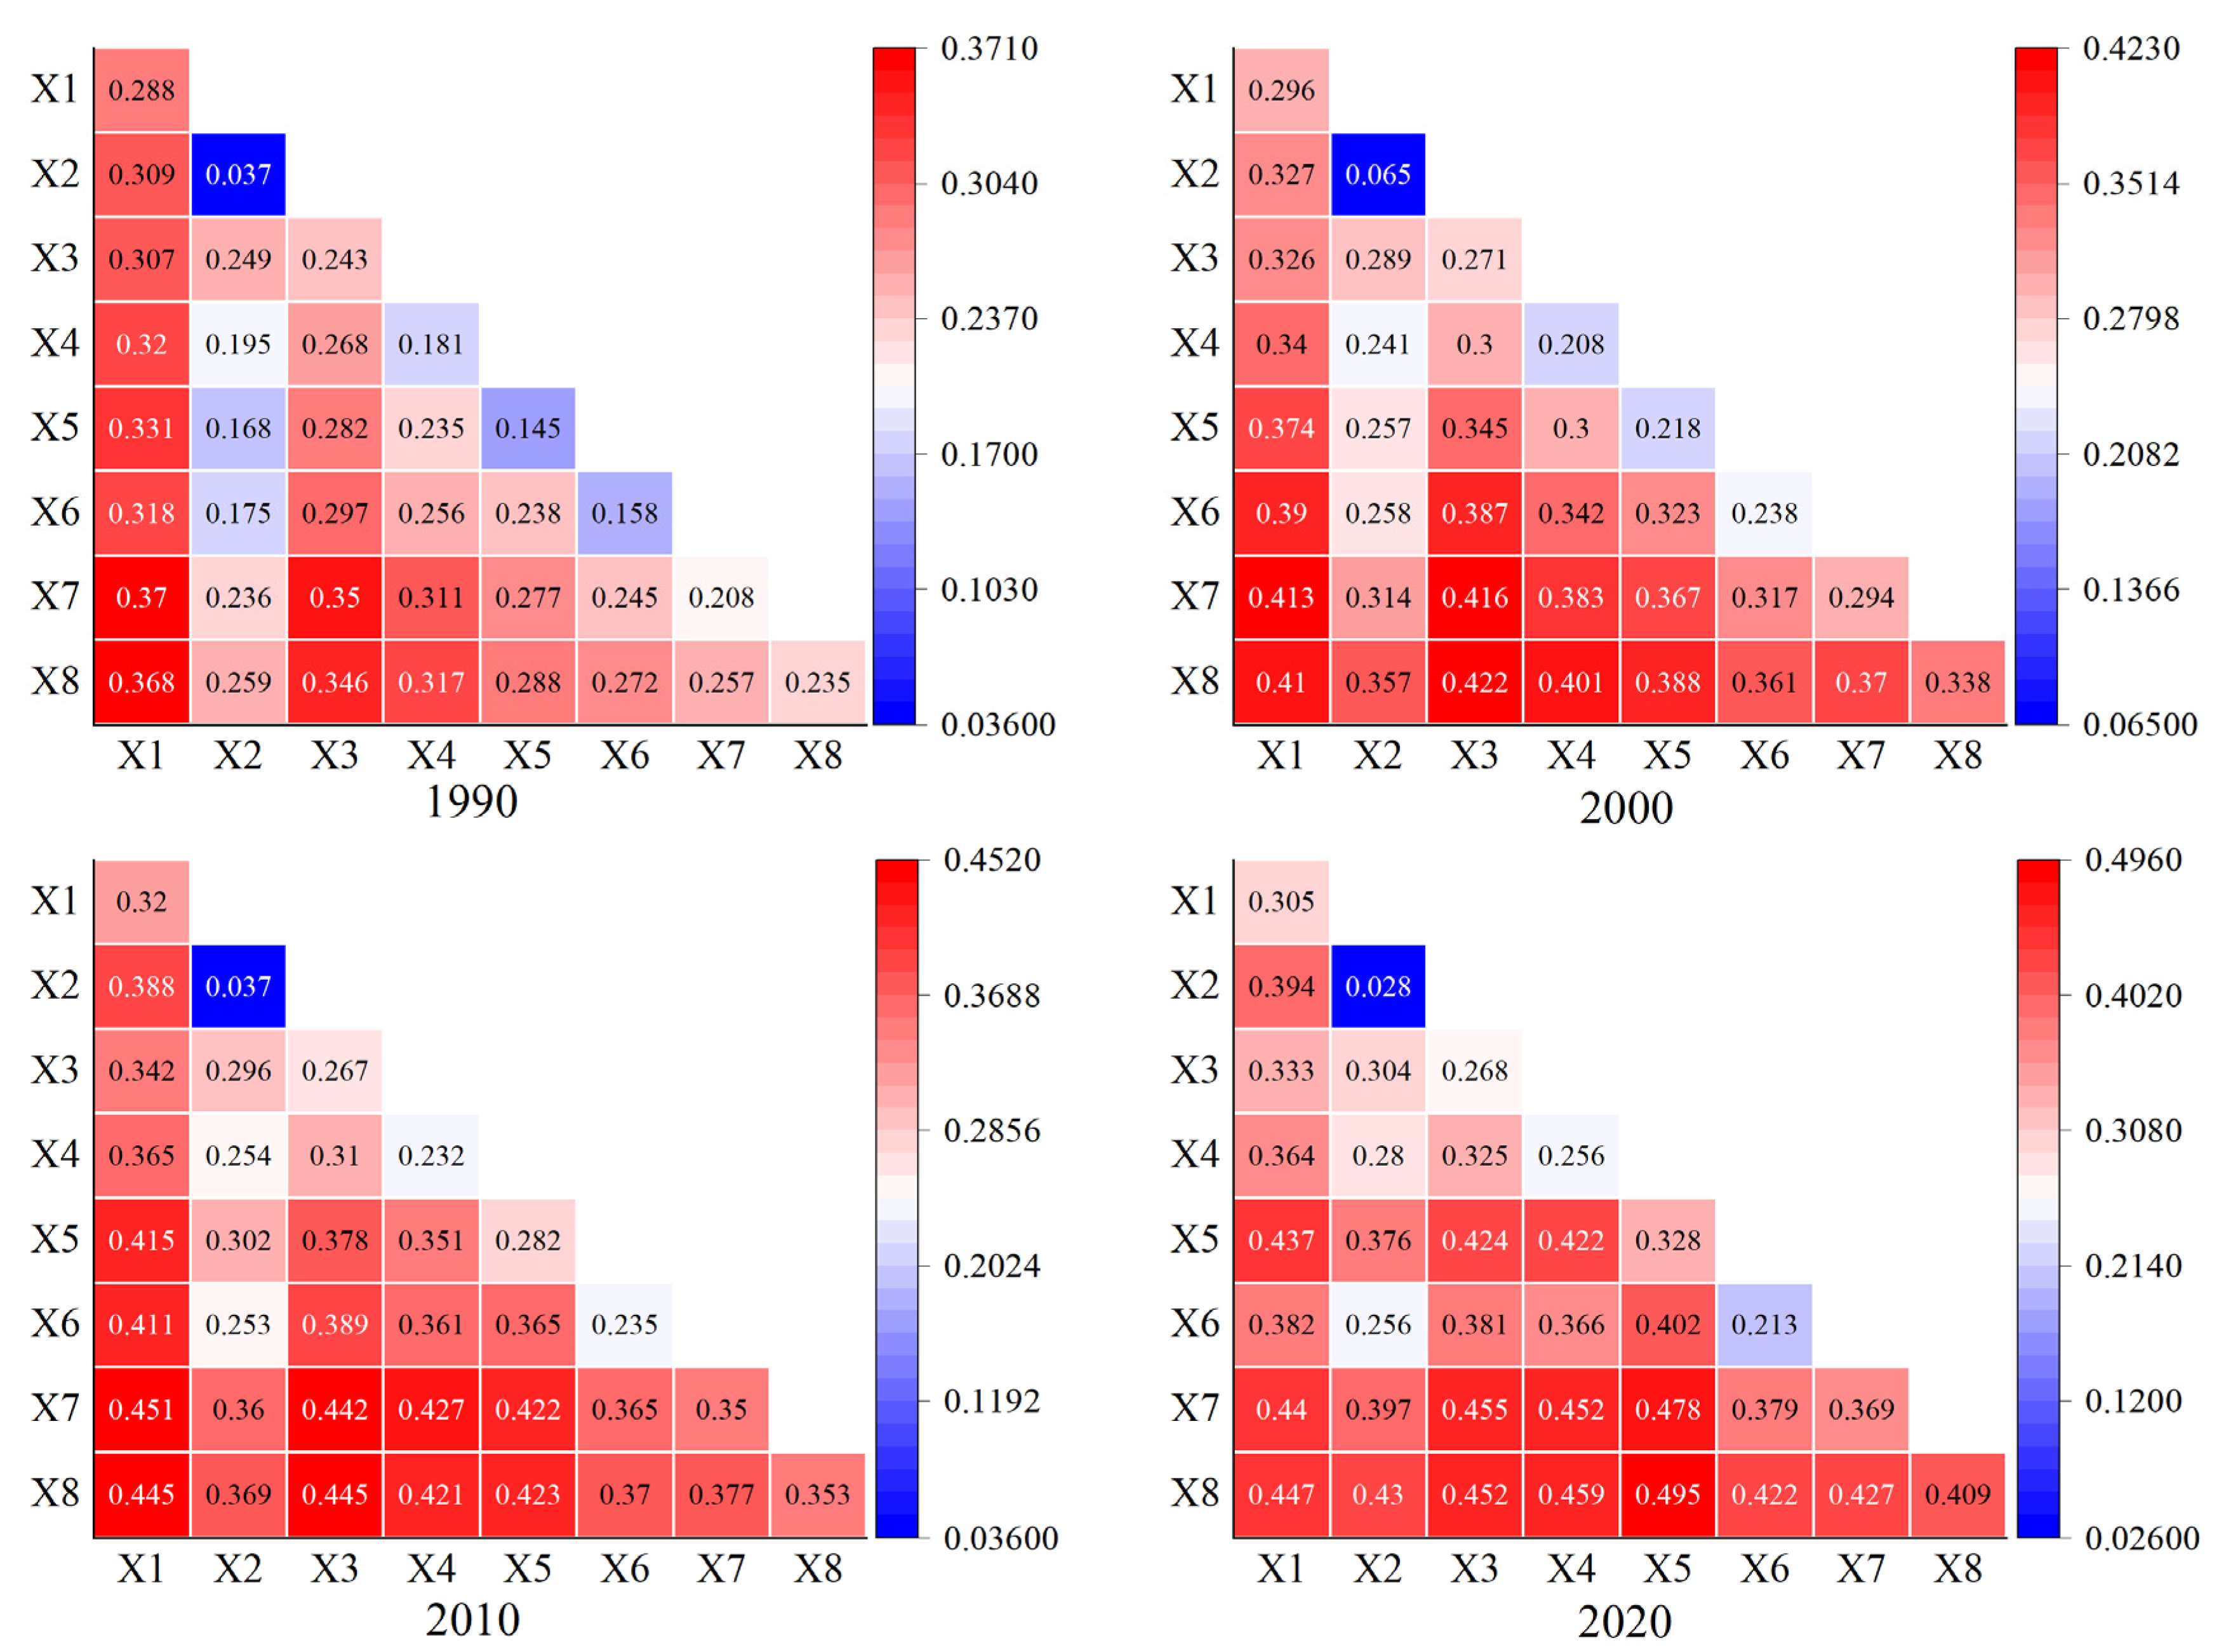
Geographical detector analysis results indicate that the spatial differentiation of ecological quality in the GBA is driven by both natural and anthropogenic factors. Among these, nighttime light intensity, GDP, and temperature are the primary drivers of ecological quality variations. From a temporal perspective, human-activity-related factors, such as land use type, population density, GDP, and nighttime light index, have shown an increasing explanatory power for the URSEI over time, while the influence of natural factors has remained relatively stable. This finding confirms the dominant role of human activities in shaping ecological quality changes in the GBA, reflecting the profound impact of rapid urbanization on the region’s ecological landscape.
4.3. Ecological Protection and Sustainable Development Recommendations for theGBA
Based on the assessment results of the URSEI, the ecological quality of the GBA has undergone significant spatiotemporal changes over the past 30 years. Particularly during the rapid urbanization and industrialization processes, some areas have experienced noticeable ecological degradation. To address these challenges and ensure the sustainable development of the regional ecosystem, this study proposes the following ecological protection and sustainability recommendations tailored to the GBA’s regional characteristics:
(1) The northwestern and northeastern parts of the GBA (e.g., Zhaoqing and Huizhou) exhibit high ecological quality and a distinct high–high clustering pattern. These areas are predominantly high-altitude regions with dense forest coverage and minimal human disturbance, serving as crucial ecological barriers for the region. It is recommended to strengthen ecological redline management, strictly control the expansion of construction land to prevent ecological degradation and enhance the protection of nature reserves and ecological function zones to improve the stability and resilience of regional ecosystems.
(2) The central urban cluster (e.g., Guangzhou, Shenzhen, Foshan, Dongguan, and Zhongshan) exhibits relatively low ecological quality due to intensive human activities. It is recommended that these cities optimize land use structure, curb the disorderly expansion of construction land, and increase green spaces and water bodies to enhance the stability and resilience of urban ecosystems. Specific measures include promoting urban greening projects by expanding parks and green areas, strengthening water body protection by restoring and rehabilitating wetland ecosystems, and advocating for green buildings and low-carbon city development to mitigate the urban heat island effect.
(3) In industrially intensive areas such as Foshan and Dongguan, ecological degradation is particularly evident. It is recommended to continue promoting industrial upgrading, phasing out outdated production capacities, reducing industrial pollution, and improving ecological environmental quality. Specific measures include encouraging enterprises to adopt clean production technologies to minimize pollutant emissions, strengthening environmental supervision of industrial parks to ensure compliance with emission standards, and promoting green manufacturing and a circular economy to enhance resource efficiency.
(4) The GBA encompasses multiple cities and administrative regions, making cross-regional cooperation and coordination essential for improving ecological quality. It is recommended that cities strengthen collaborative governance in ecological protection, jointly addressing environmental challenges to ensure the integrity and sustainability of the regional ecosystem. Specific measures include establishing a cross-regional ecological protection coordination mechanism, formulating unified ecological protection policies and standards, enhancing the sharing and monitoring of ecological data to improve the scientific precision of regional environmental management, and promoting an ecological compensation mechanism to balance environmental protection with economic development.
4.4. Limitations and Future Works
This study systematically analyzed the spatiotemporal evolution characteristics and driving mechanisms of ecological quality in the Guangdong-Hong Kong-Macao Greater Bay Area (GBA) from 1990 to 2020 using the Unified Remote Sensing Ecological Index (URSEI) and the geographical detector model. However, several limitations need to be acknowledged, and future improvements are proposed as follows:
Regarding data limitations, due to constraints in historical data availability, the nighttime light and GDP data for 1990 were substituted with data from 1992. While such substitution is common in long-term ecological studies, it may introduce certain biases in the analysis of early-stage driving factors of ecological quality. Future research could employ data interpolation or modeling approaches to optimize the completeness of early-stage data and reduce potential biases caused by direct substitution.
In terms of analytical dimensions, this study primarily relied on remote sensing data and large-scale driving factors for assessment, with relatively insufficient consideration of micro-level socioeconomic elements (e.g., environmental protection investments, specific policy implementation effects, and corporate pollution control measures). Subsequent studies should incorporate field surveys or socioeconomic statistical data to further refine the analysis of driving mechanisms.
5. Conclusions
This study introduces the URSEI as an enhancement of the traditional RSEI. Through optimization of data selection, normalization of invariant region indicators, and multi-temporal principal component analysis, the URSEI effectively addresses the challenges of ecological quality assessment in the cloudy and rainy climate of the GBA. The dynamic monitoring results from 1990 to 2020 show significant improvements in the consistency and spatial visualization of ecological assessments.
The findings reveal that the ecological quality of the GBA exhibits a spatial distribution characterized by lower values in the central region and higher values in the northwest and northeast areas. The URSEI values over the years show a trend of decline followed by improvement, with an overall slight degradation of ecological quality, as evidenced by a 24.29% improvement area and a 25.95% degradation area. The spatial analysis indicates a significant positive spatial autocorrelation, with high–high and low–low clustering patterns dominating, which align with the changes in URSEI grades.
The spatial differentiation of ecological quality is influenced by both natural and anthropogenic factors. Key drivers of spatial variation include nighttime light intensity, GDP, and temperature, with human factors having a stronger impact, which has increased over time. This study underscores the importance of considering both natural and human influences in long-term ecological monitoring and provides a reliable method for assessing ecological quality in regions with varying climatic and environmental conditions.


 ,
, 


