
Construction and Optimization of the Ecological Security Pattern of Pinglu Canal Economic Zone Based on the InVEST-Circuit Theory Model

Abstract
1. Introduction
2. Materials and Methods
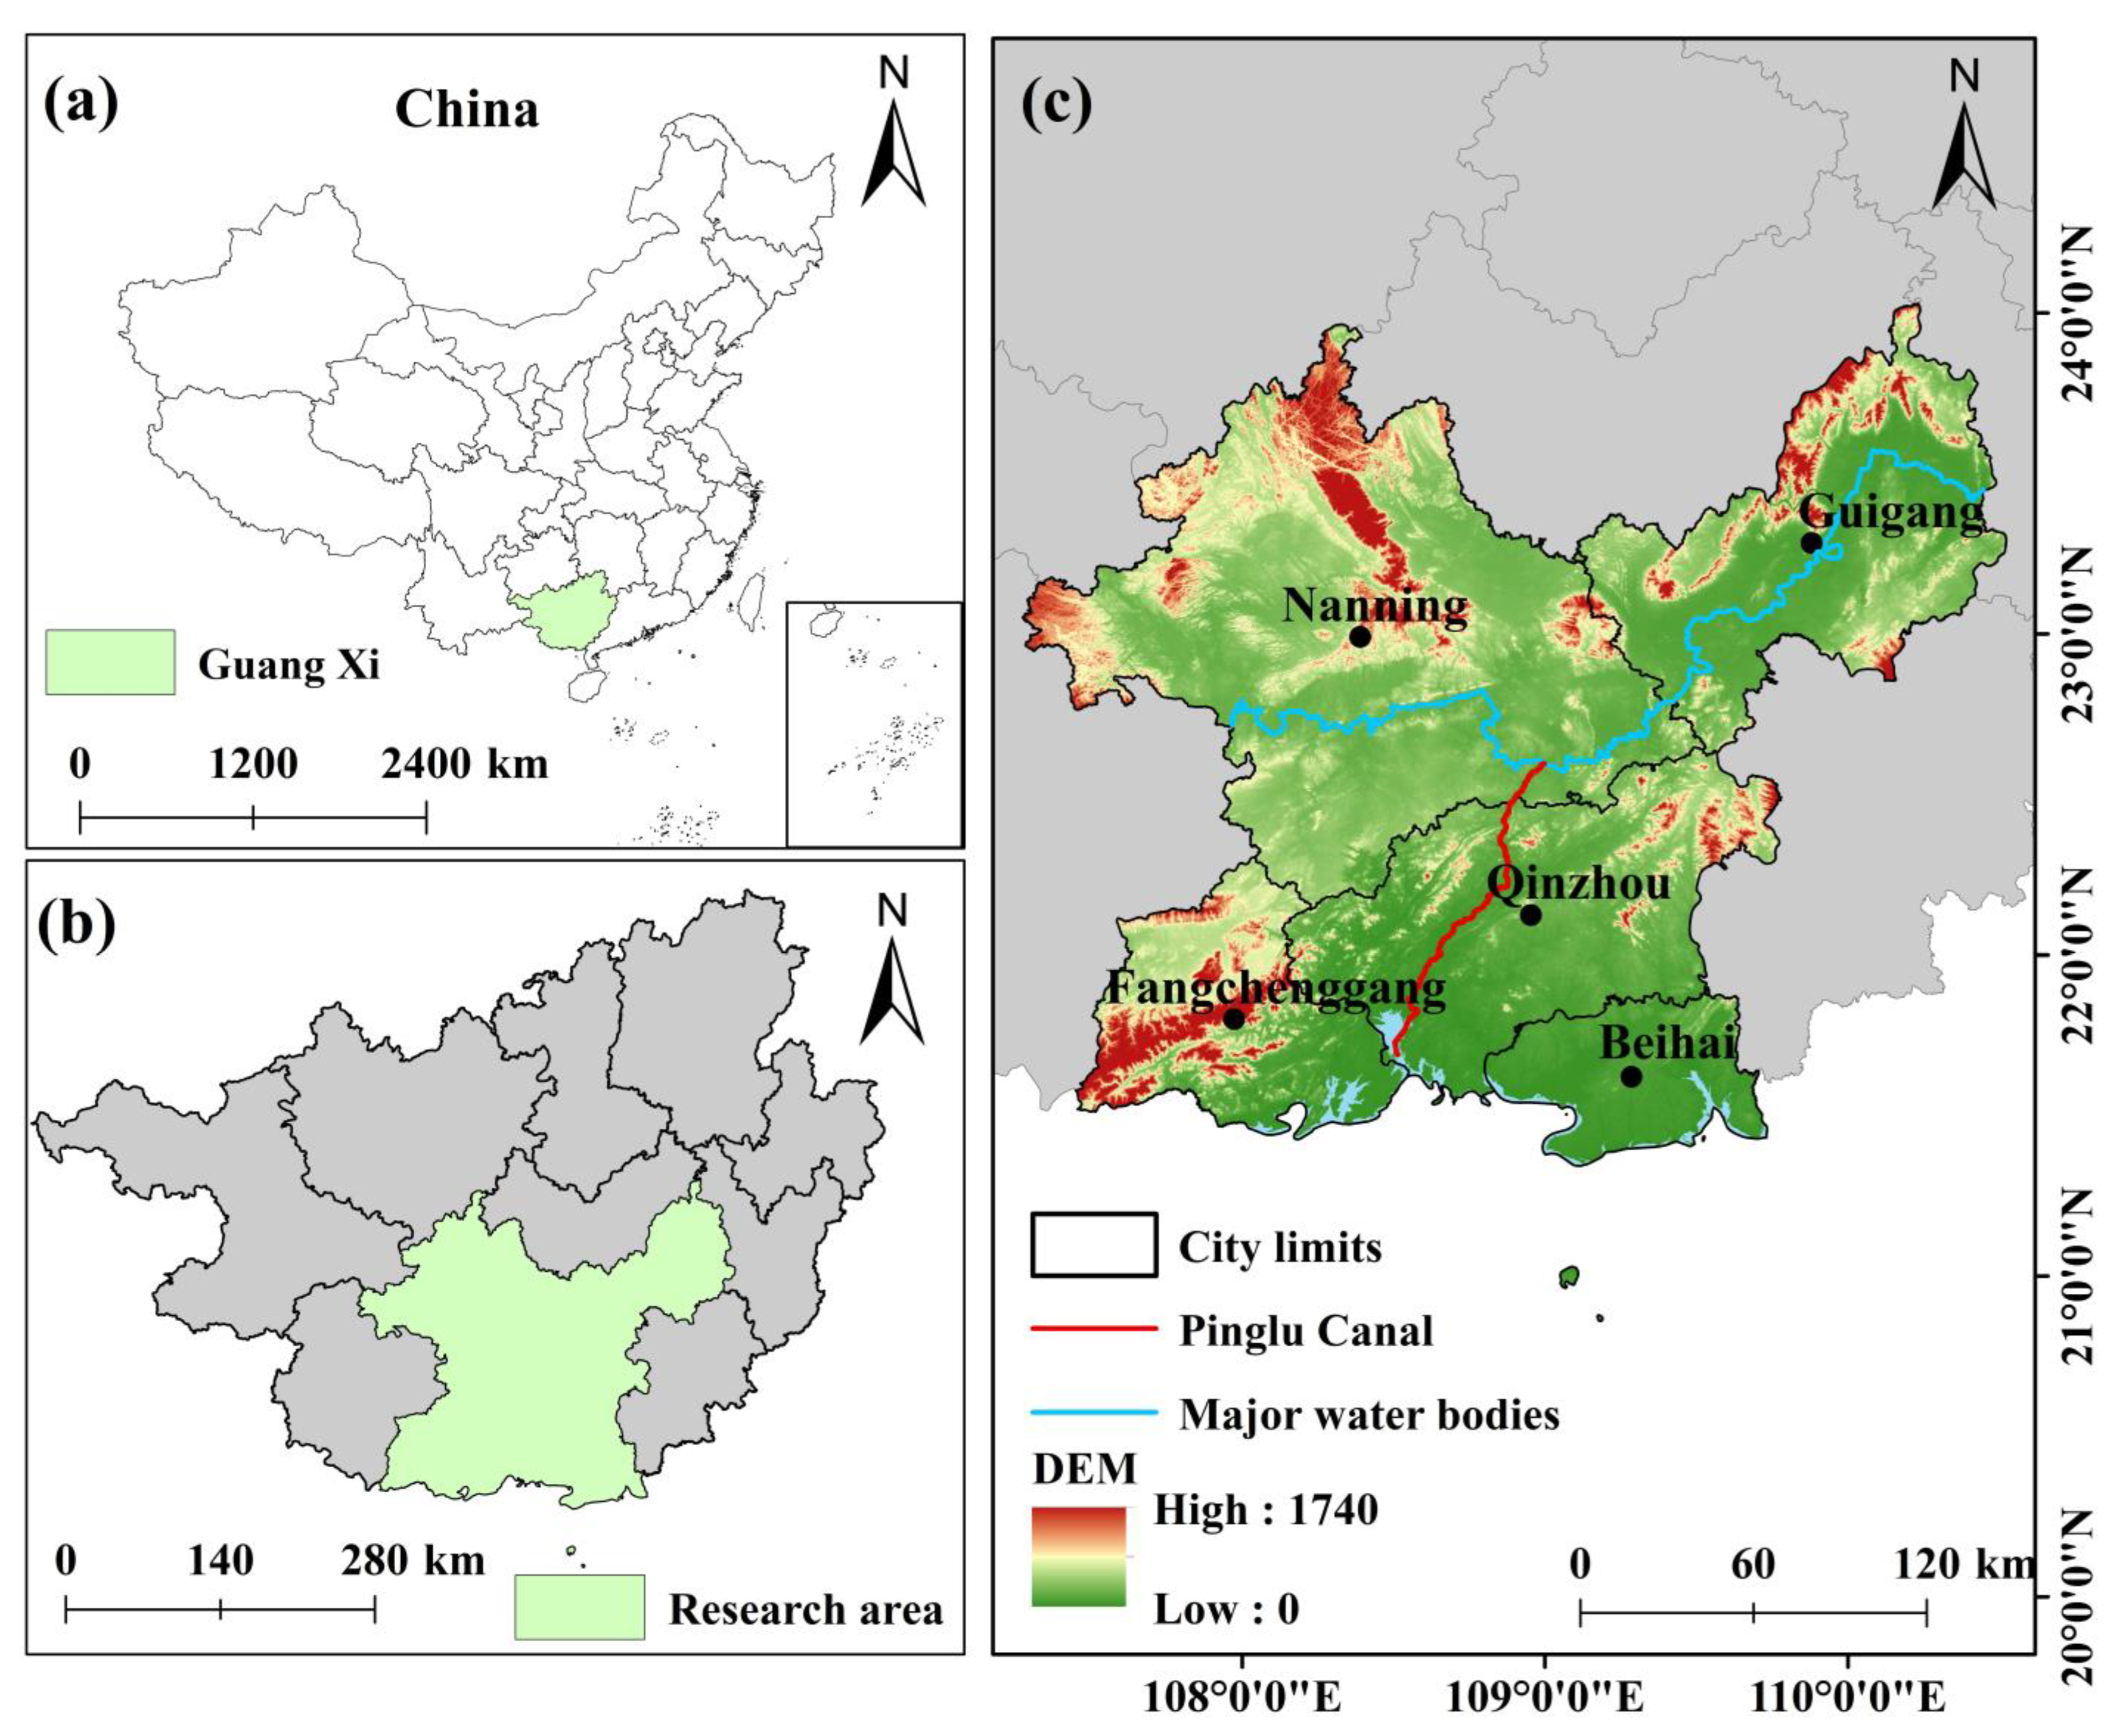
2.1. Study Area
2.2. Data Sources
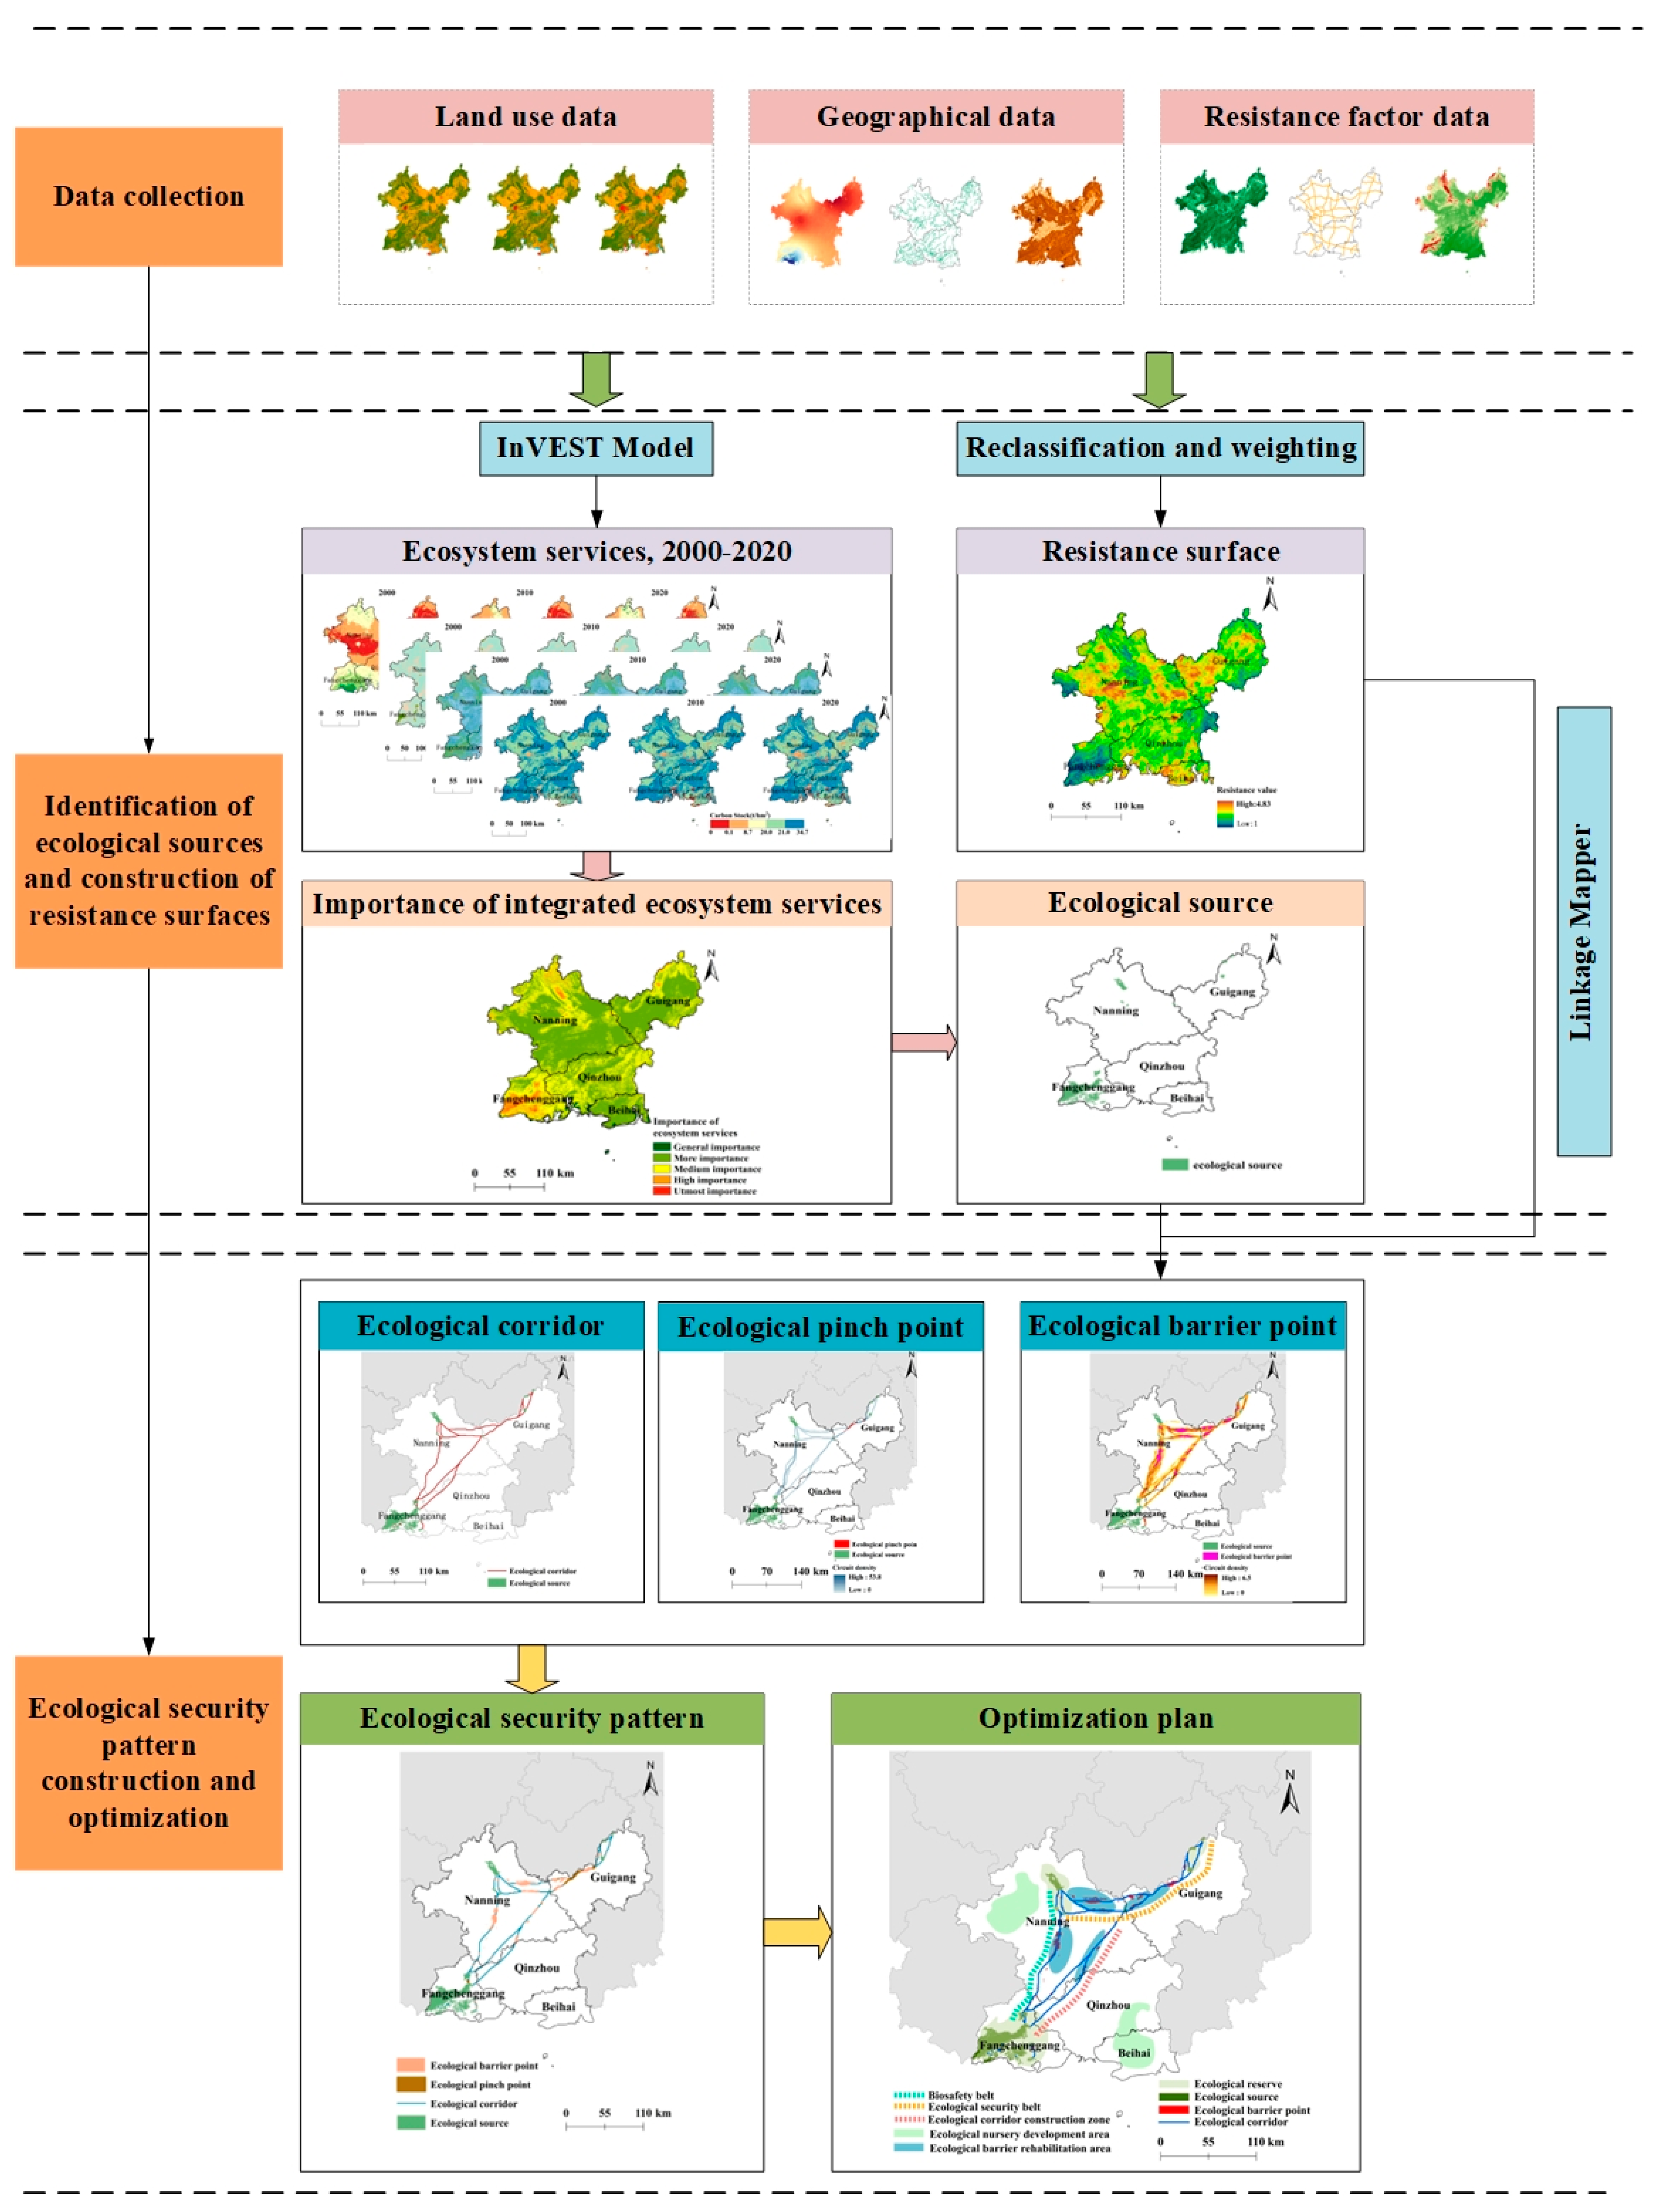
2.3. Methods
2.3.1. Valuation of Ecosystem Services
- (1)
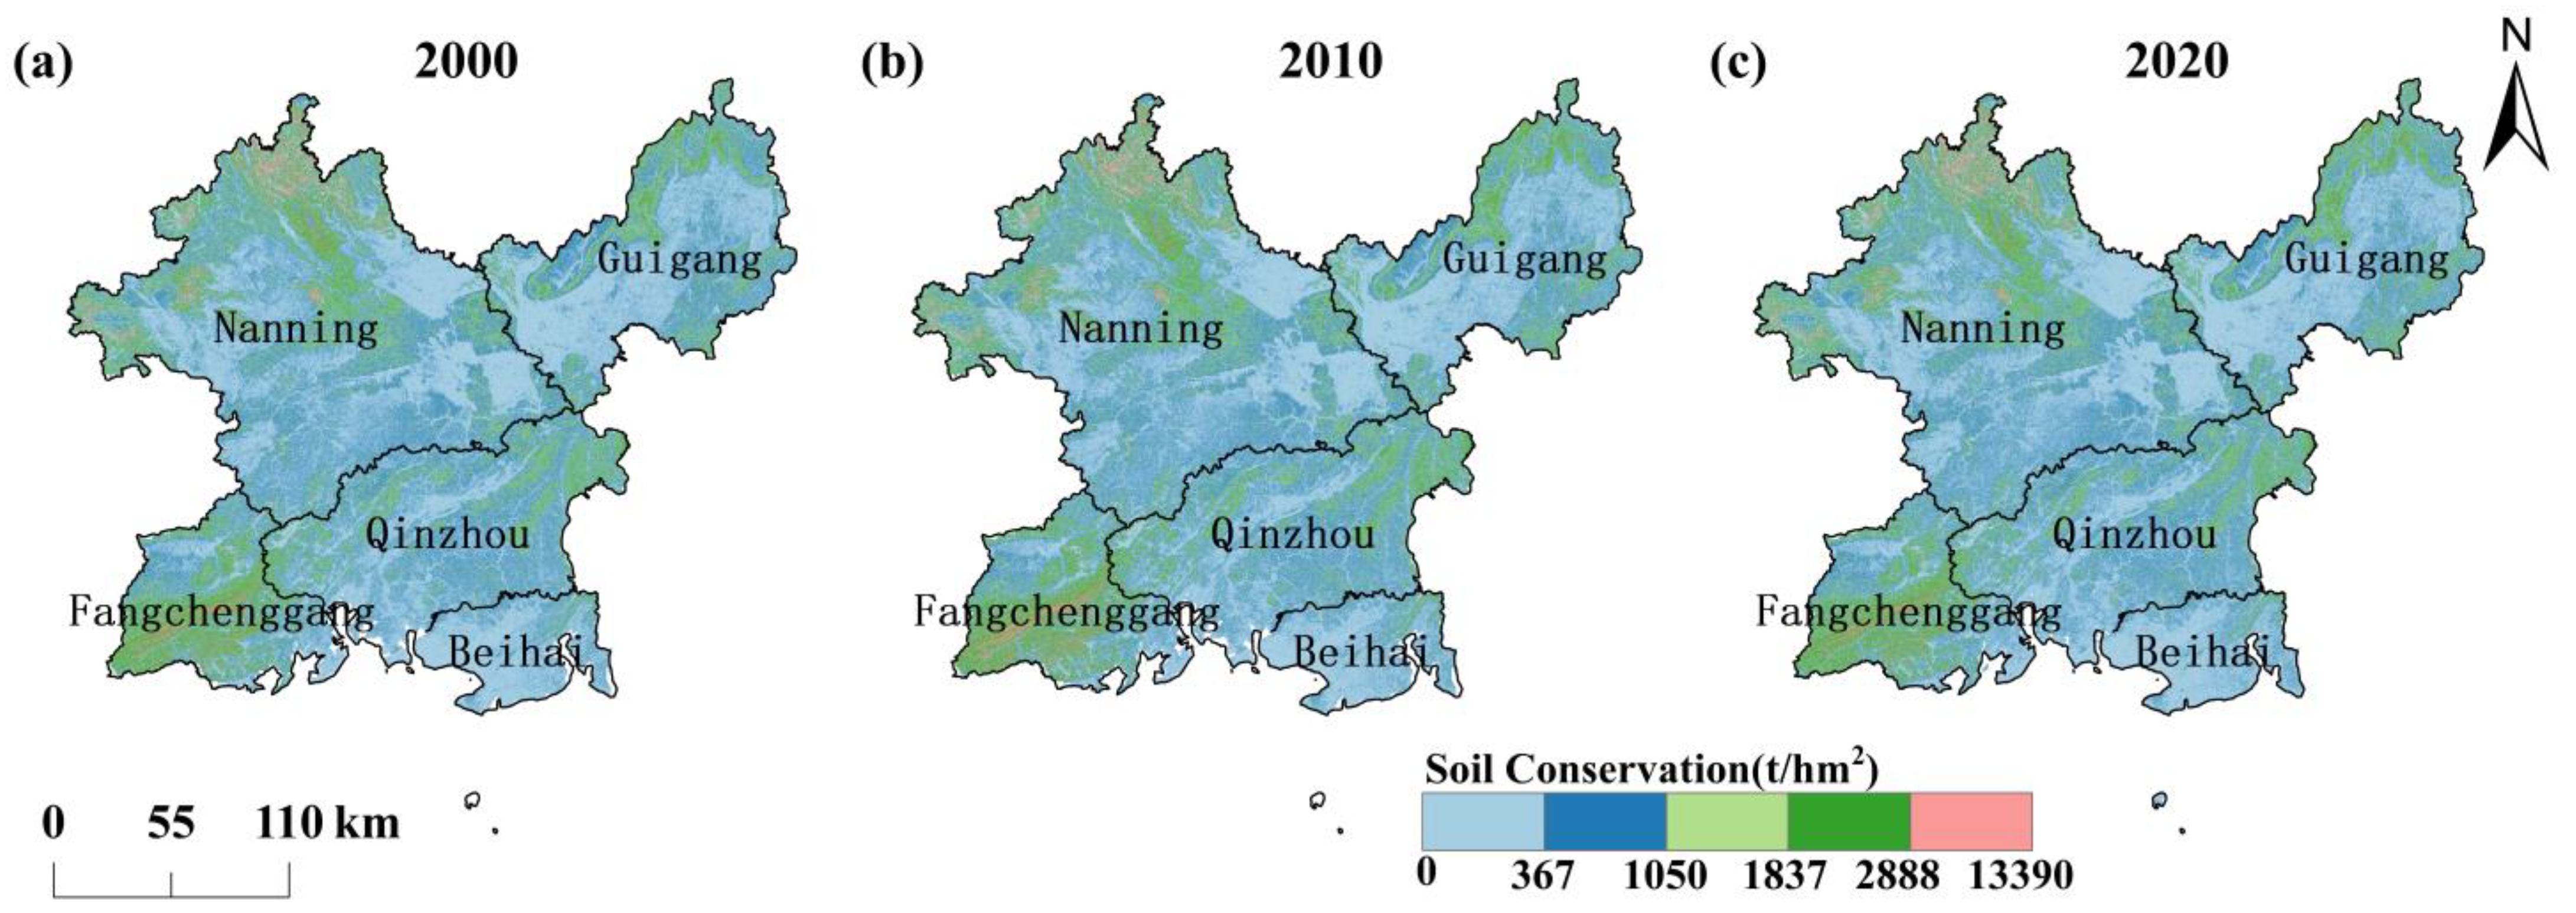
- Soil conservation
- (2)
- Water yield
- (3)
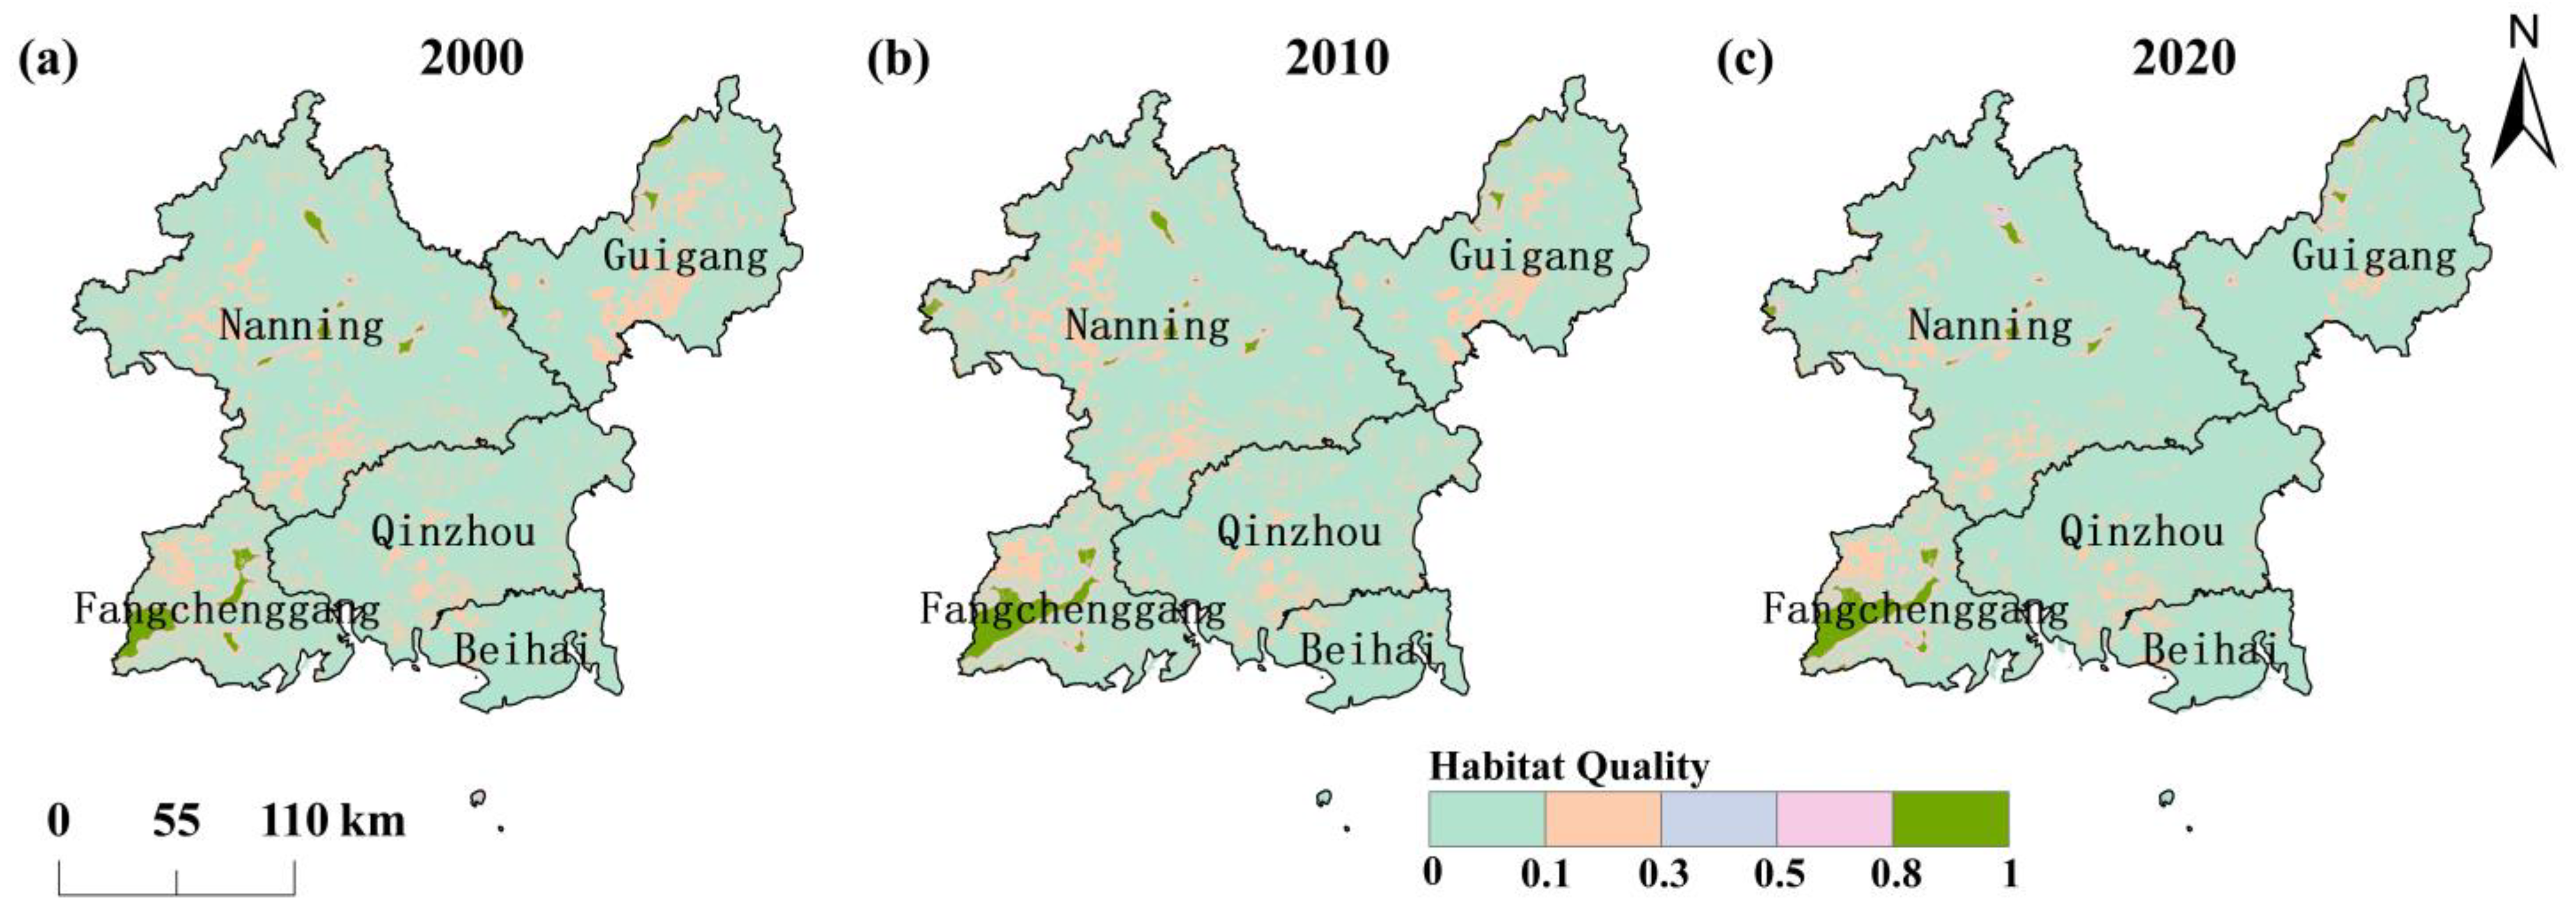
- Habitat quality
- (4)
- Carbon storage
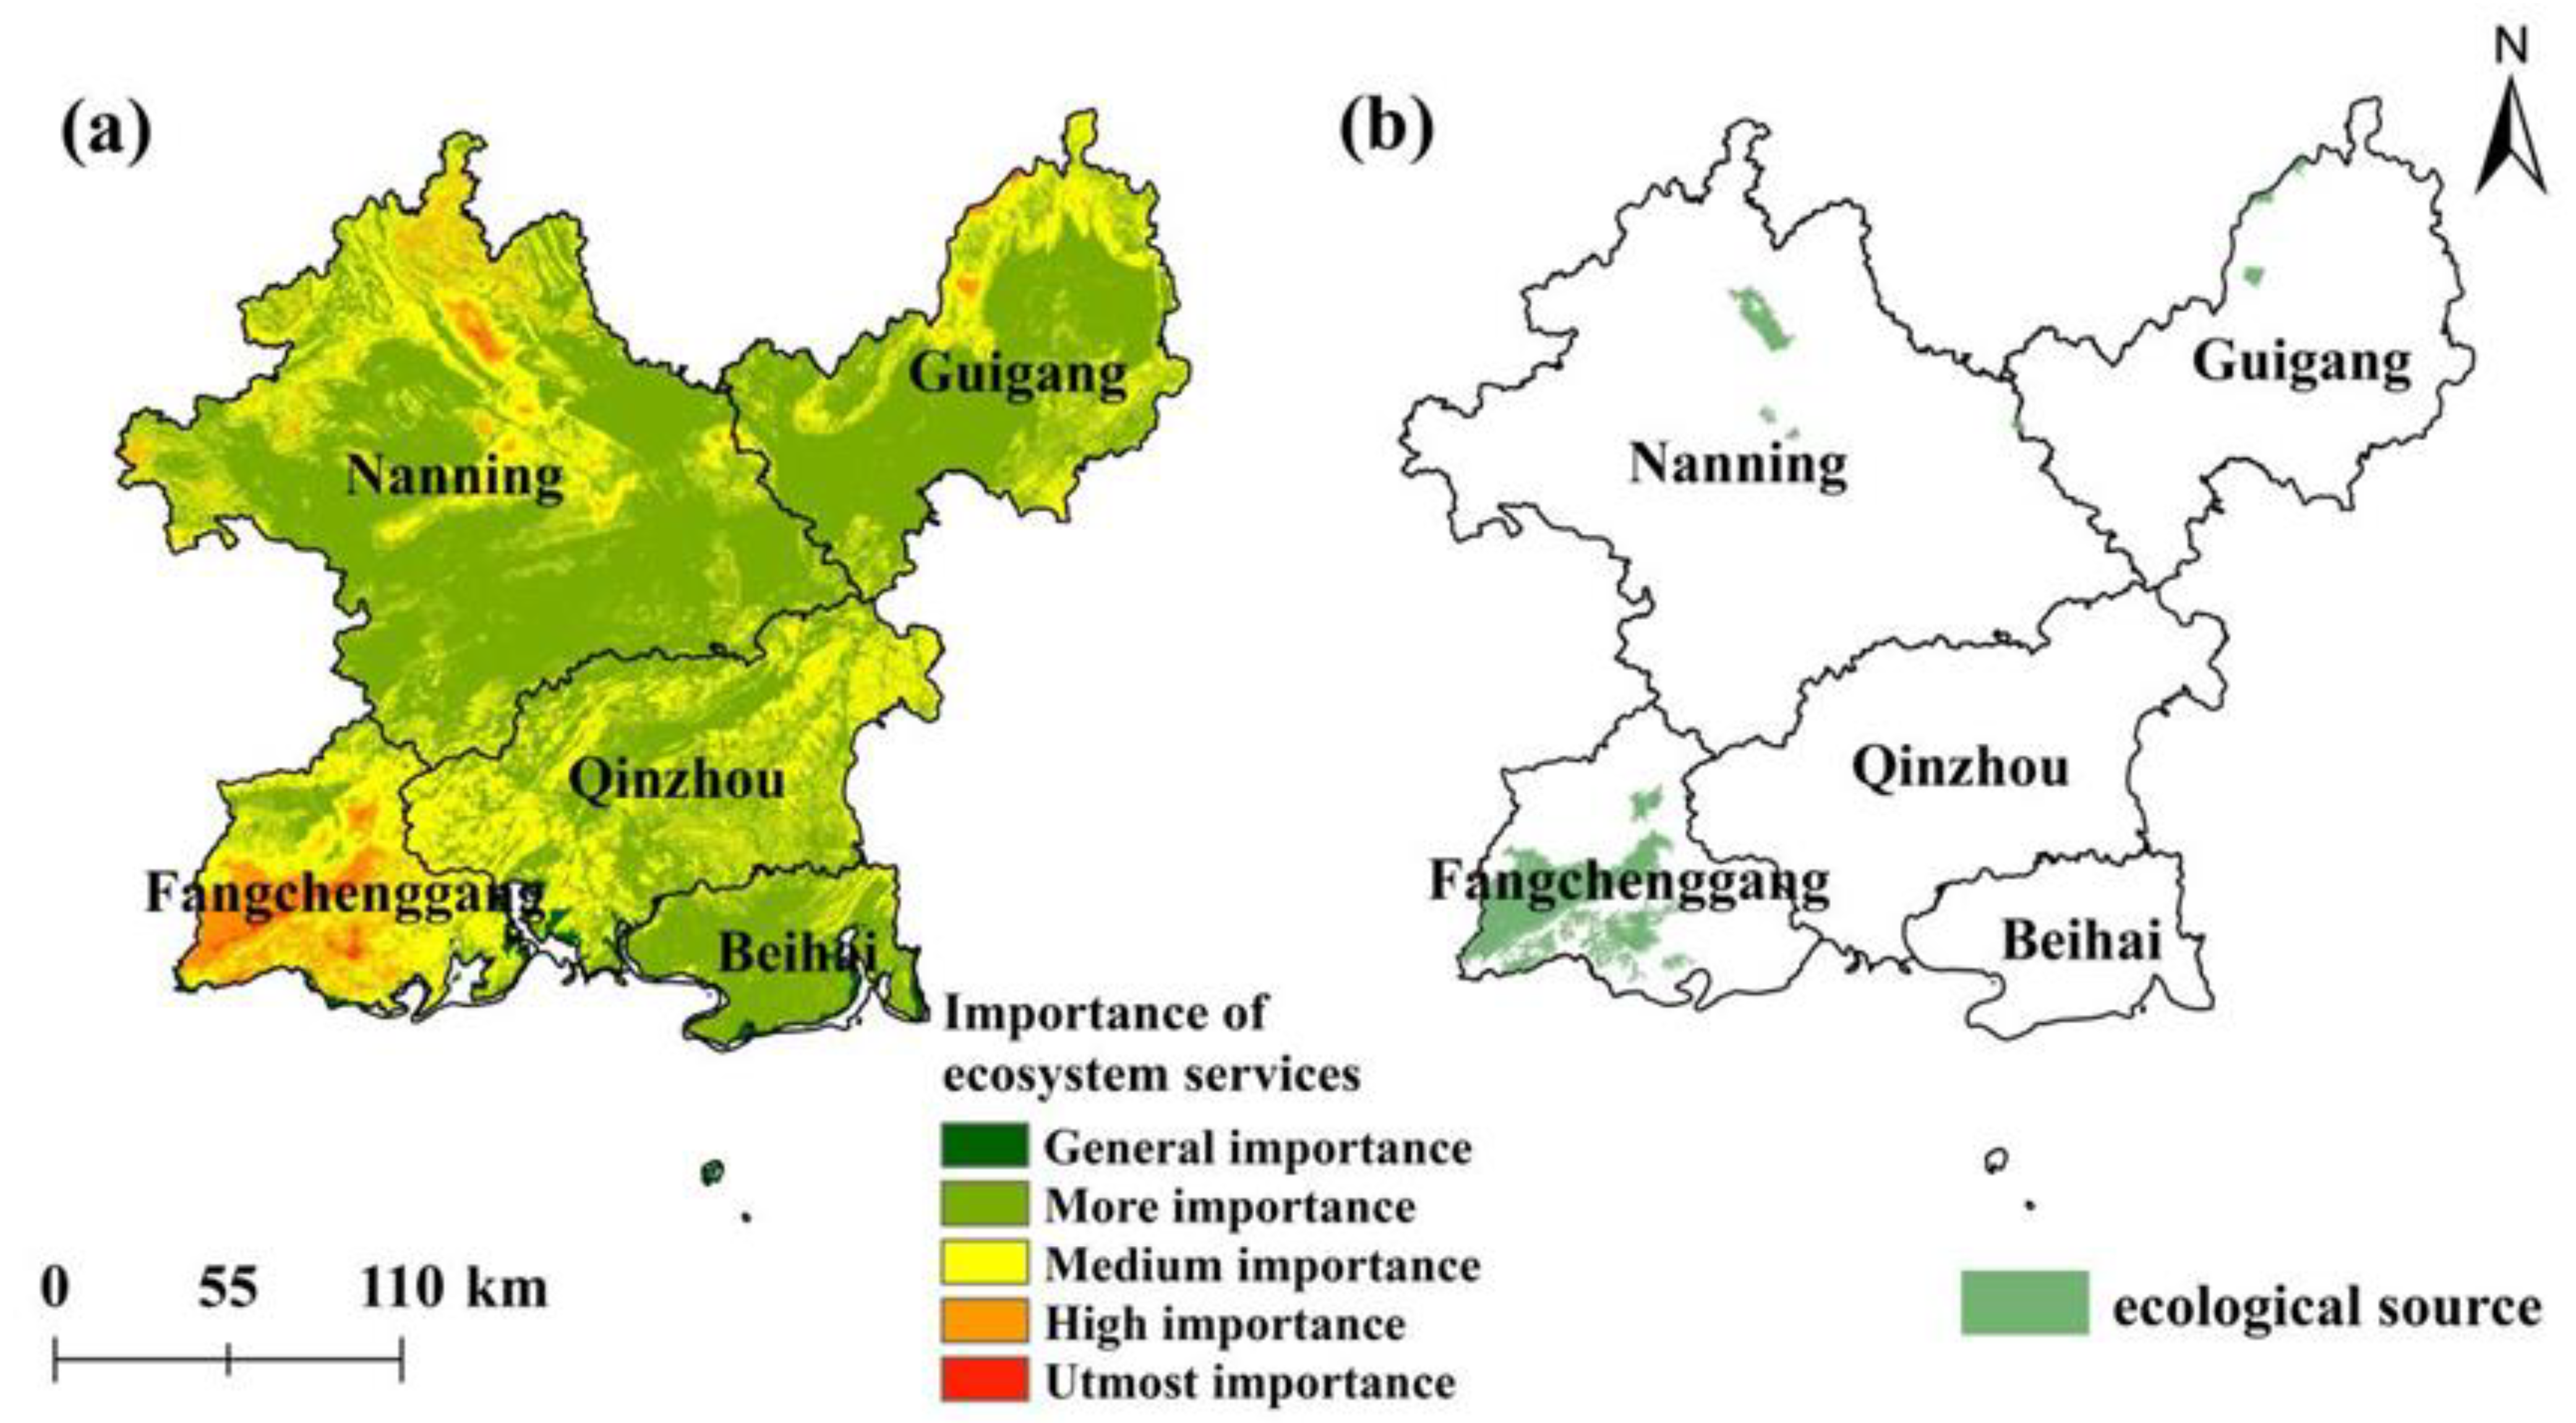
2.3.2. Ecological Source Area Identification
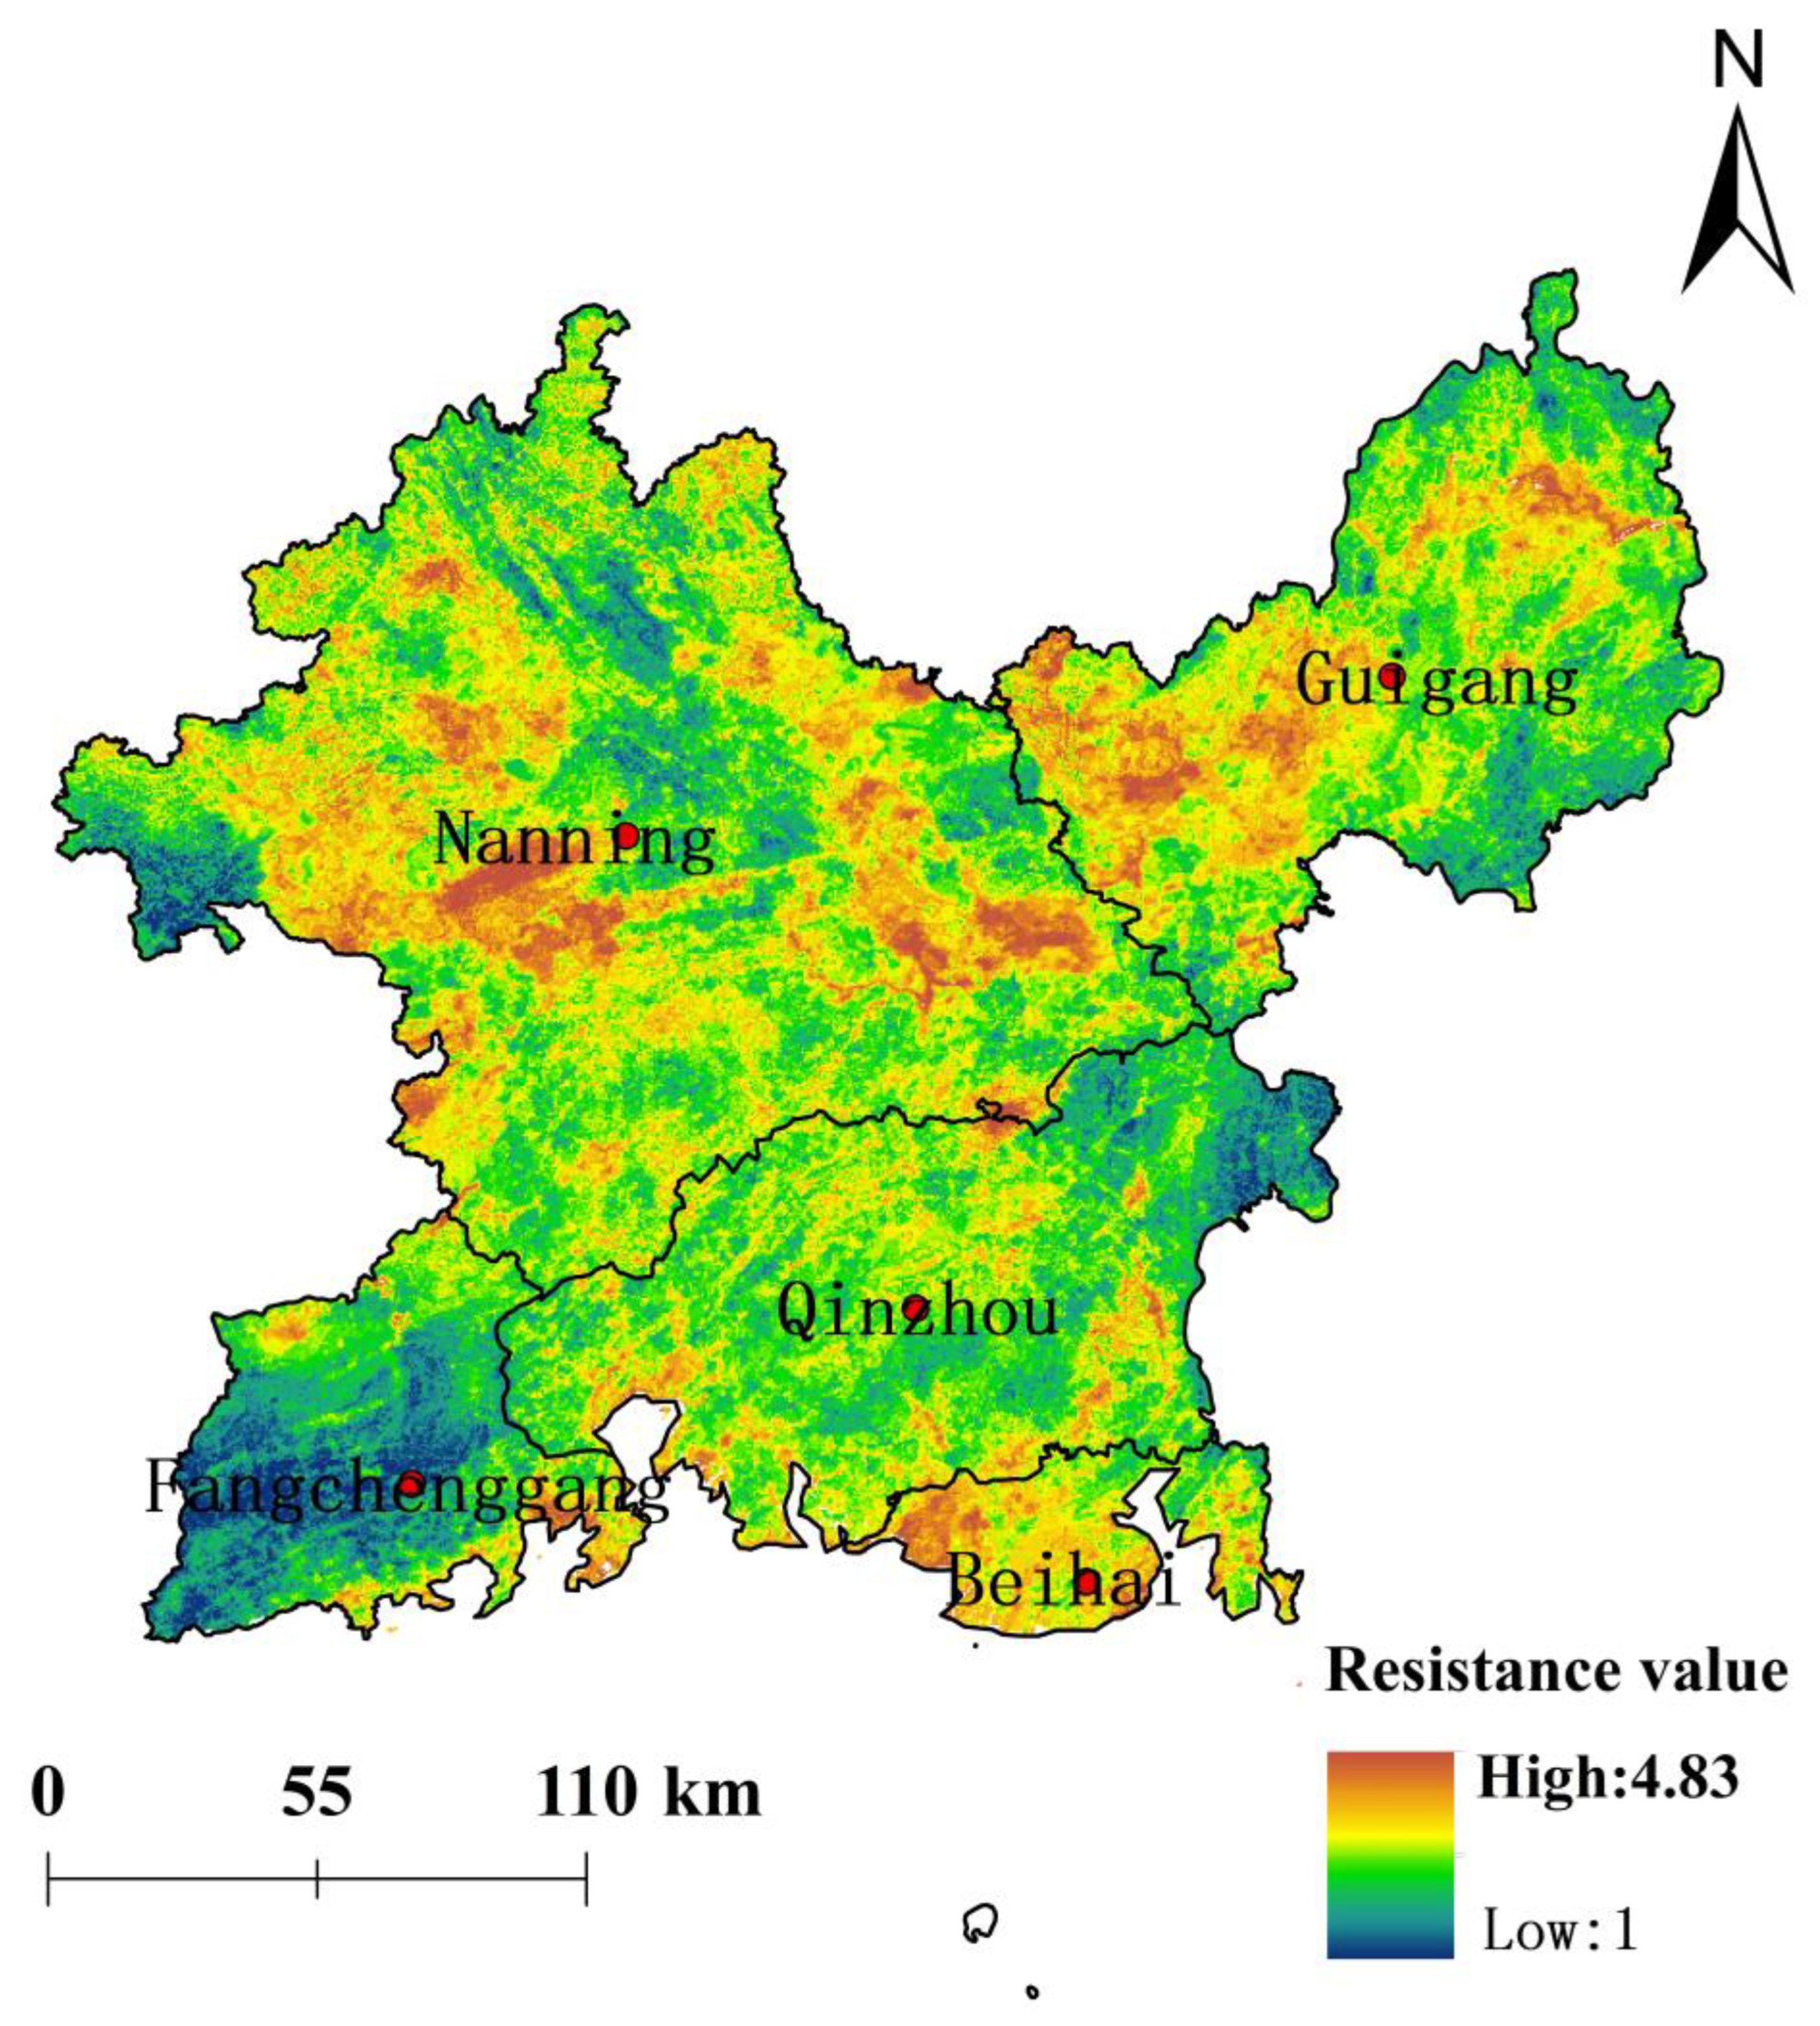
2.3.3. Resistance Surface Construction
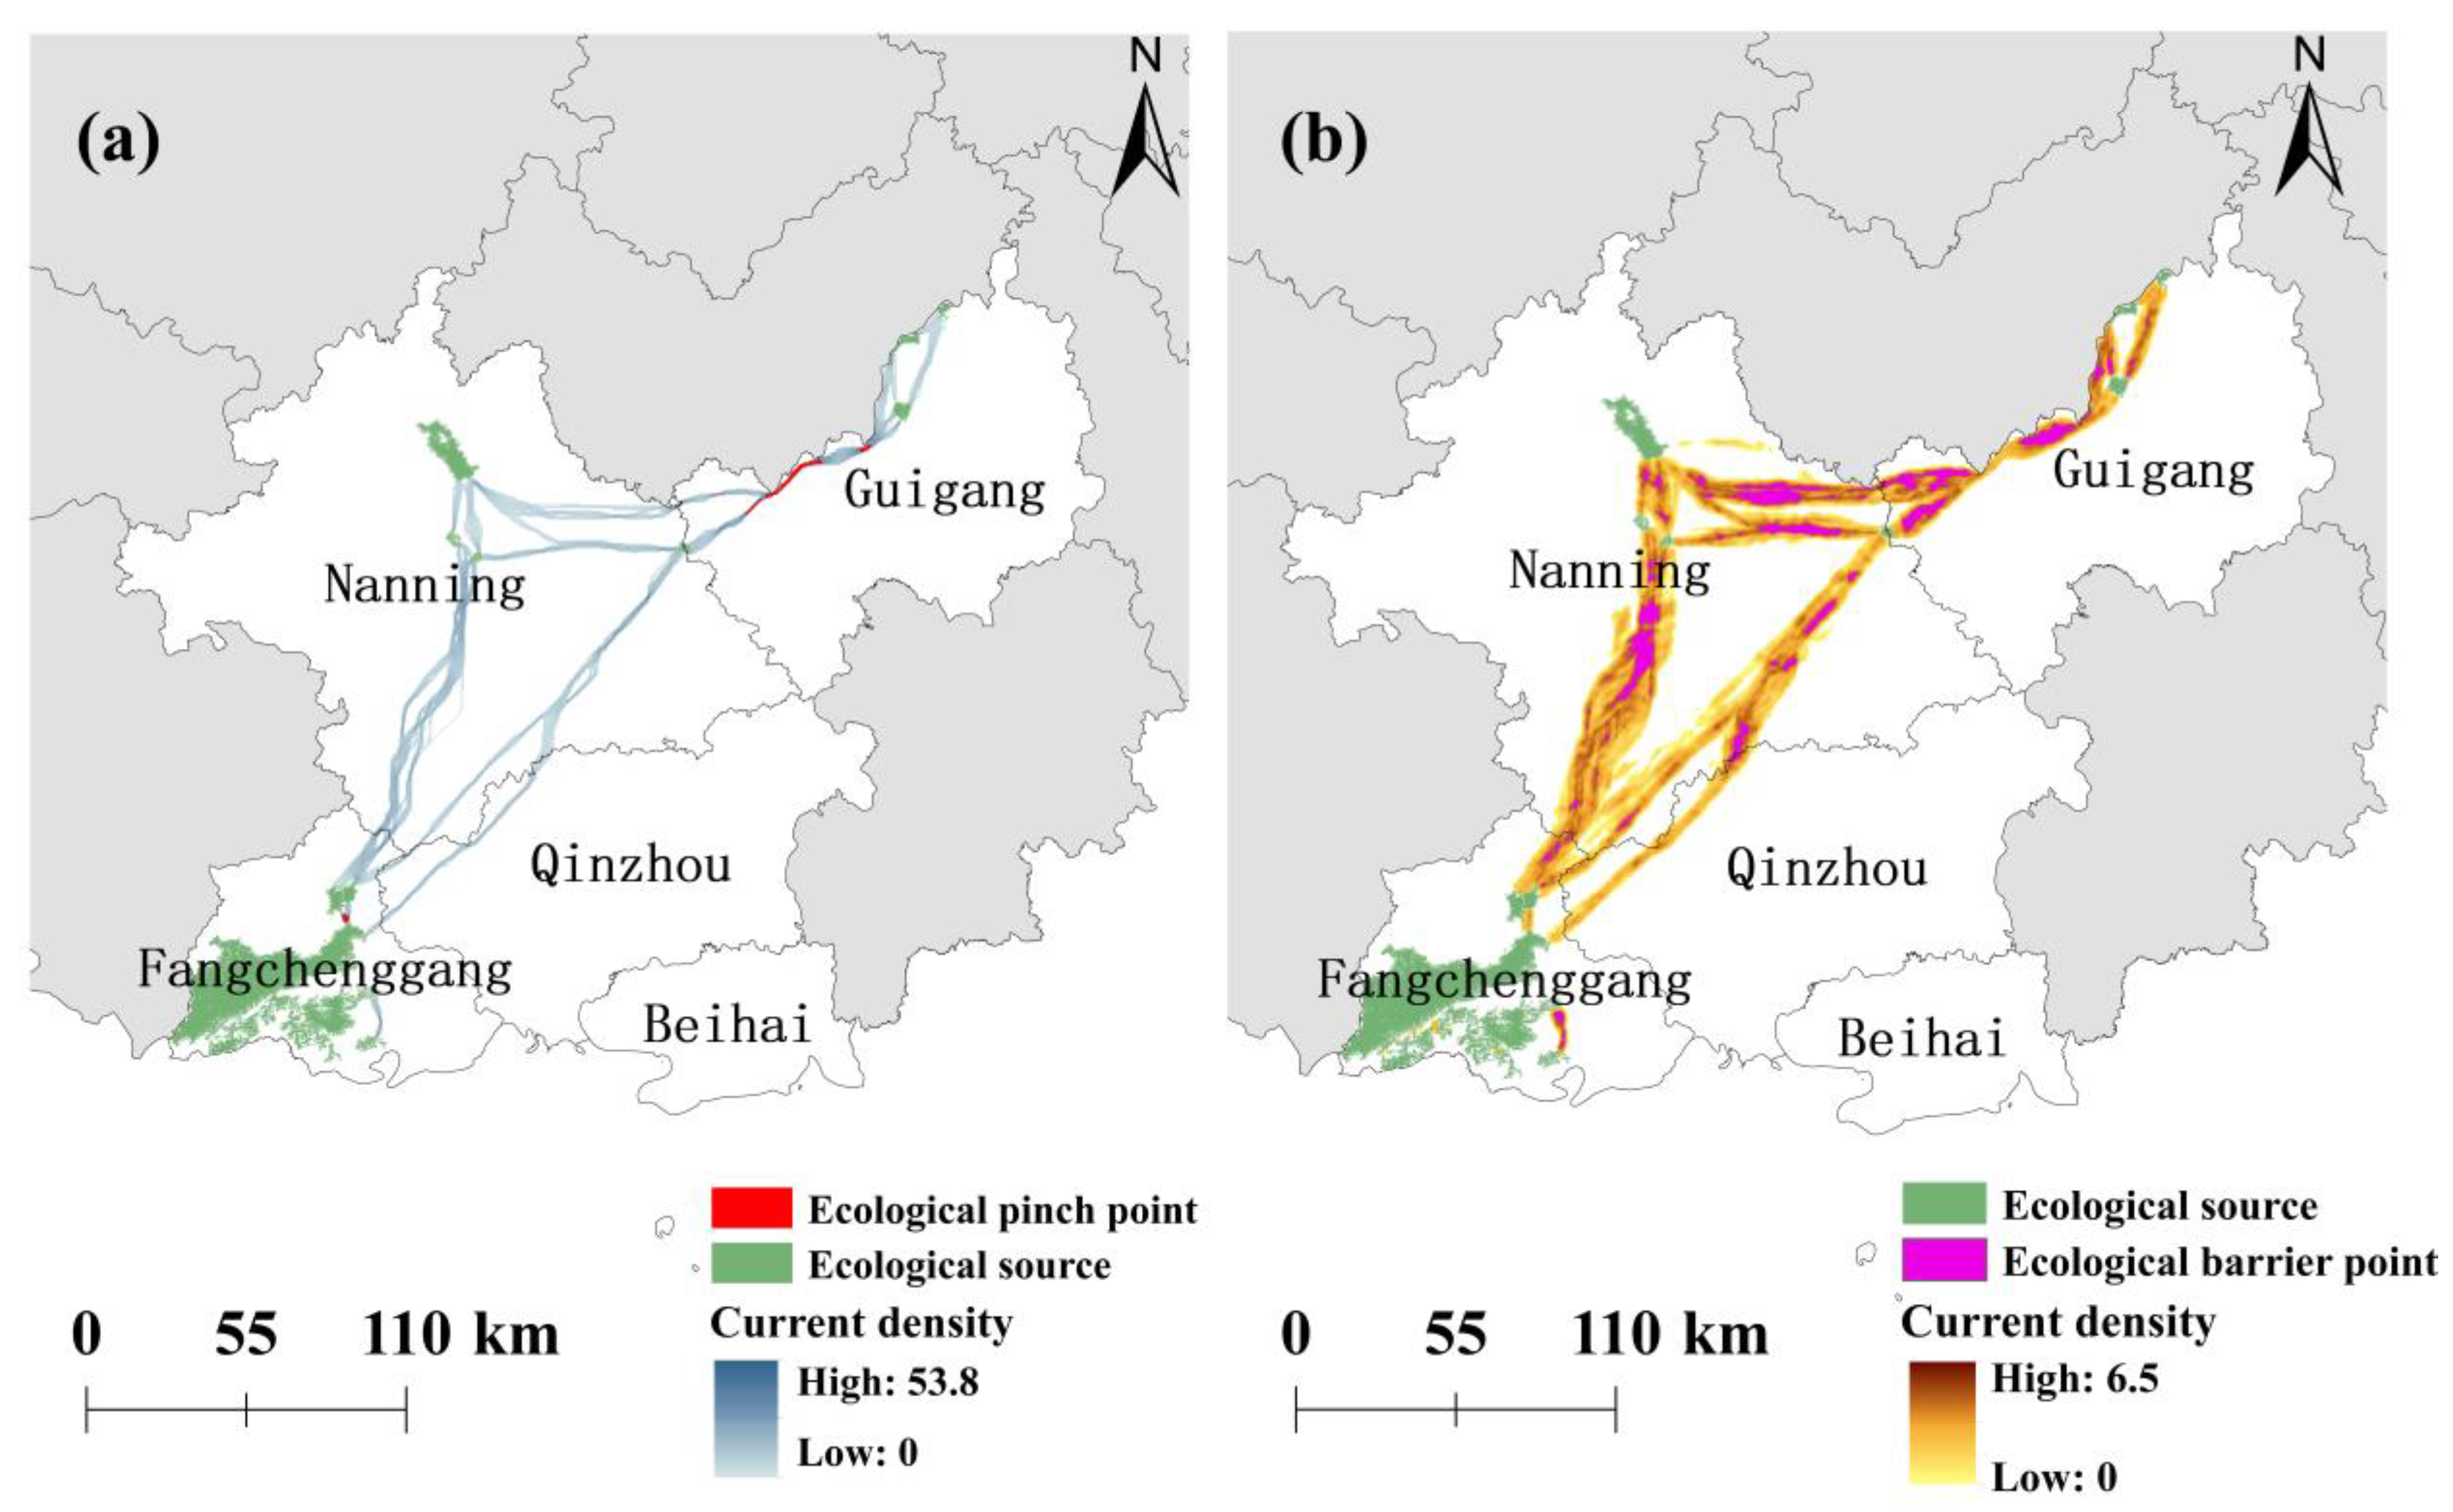
2.3.4. Extraction of Ecological Corridors, Ecological Pinch Points, and Ecological Barrier Points
3. Results
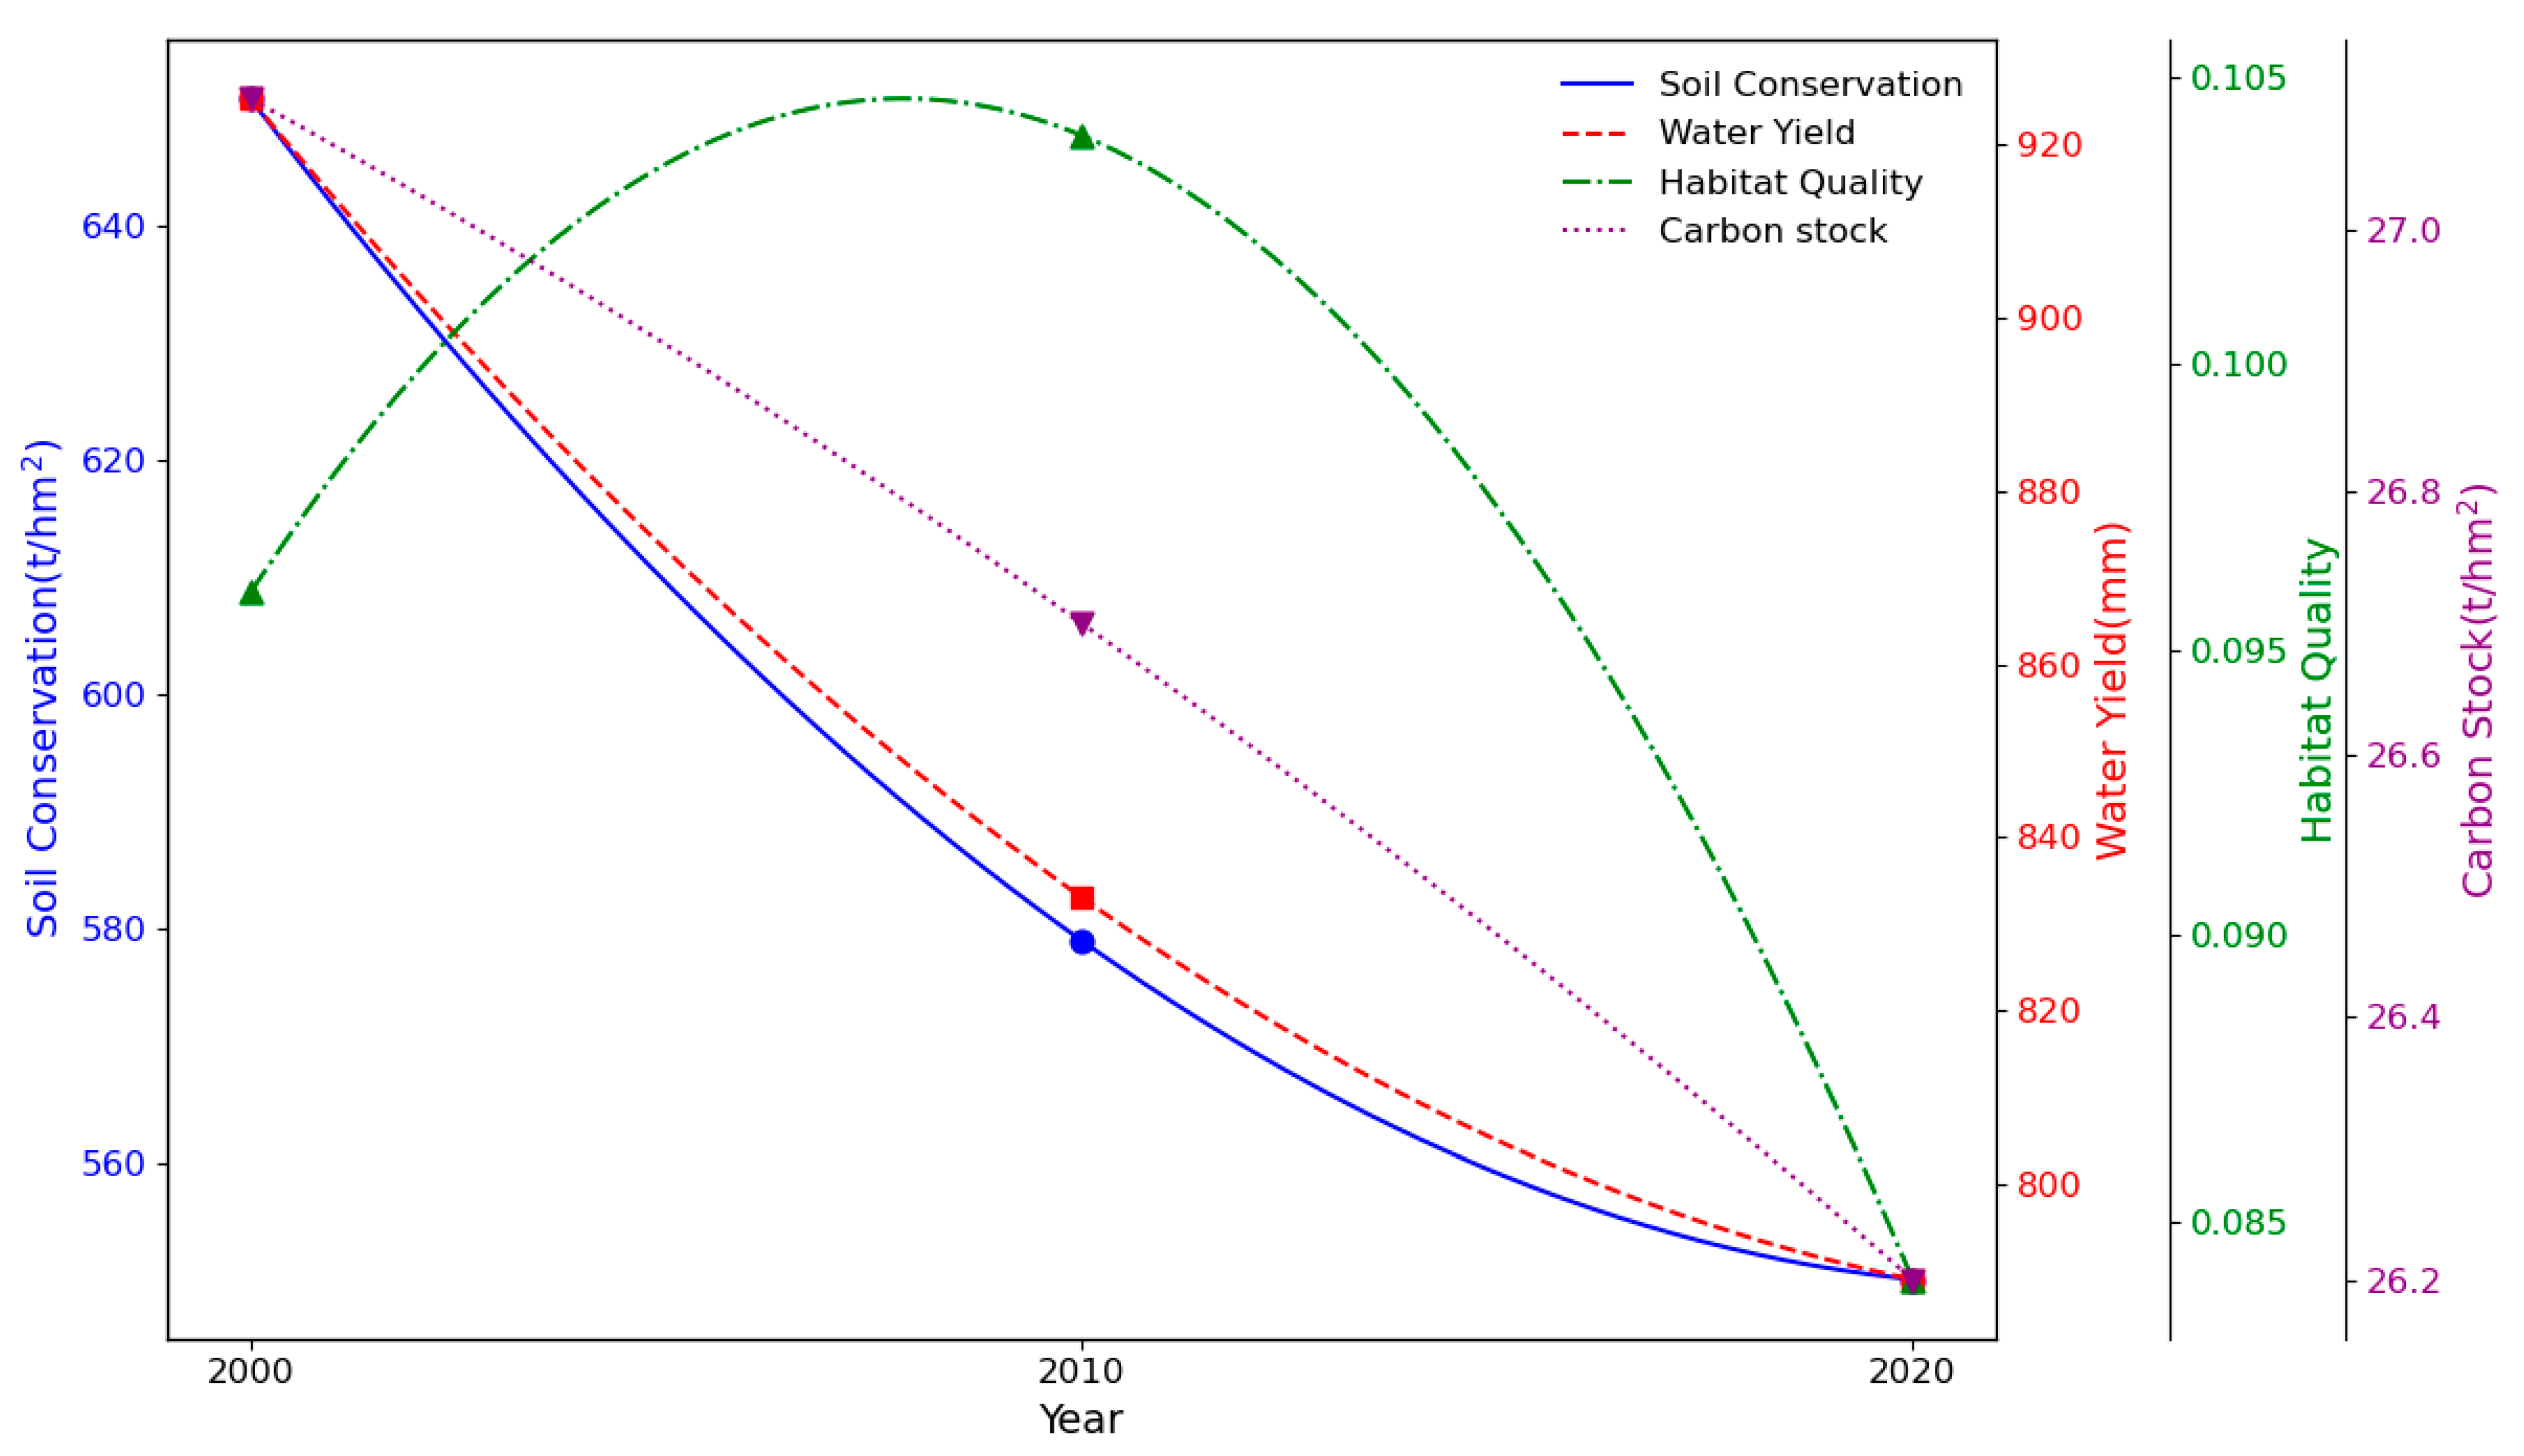
3.1. Spatial and Temporal Evolution of Ecosystem Services
3.2. Resistance Analysis
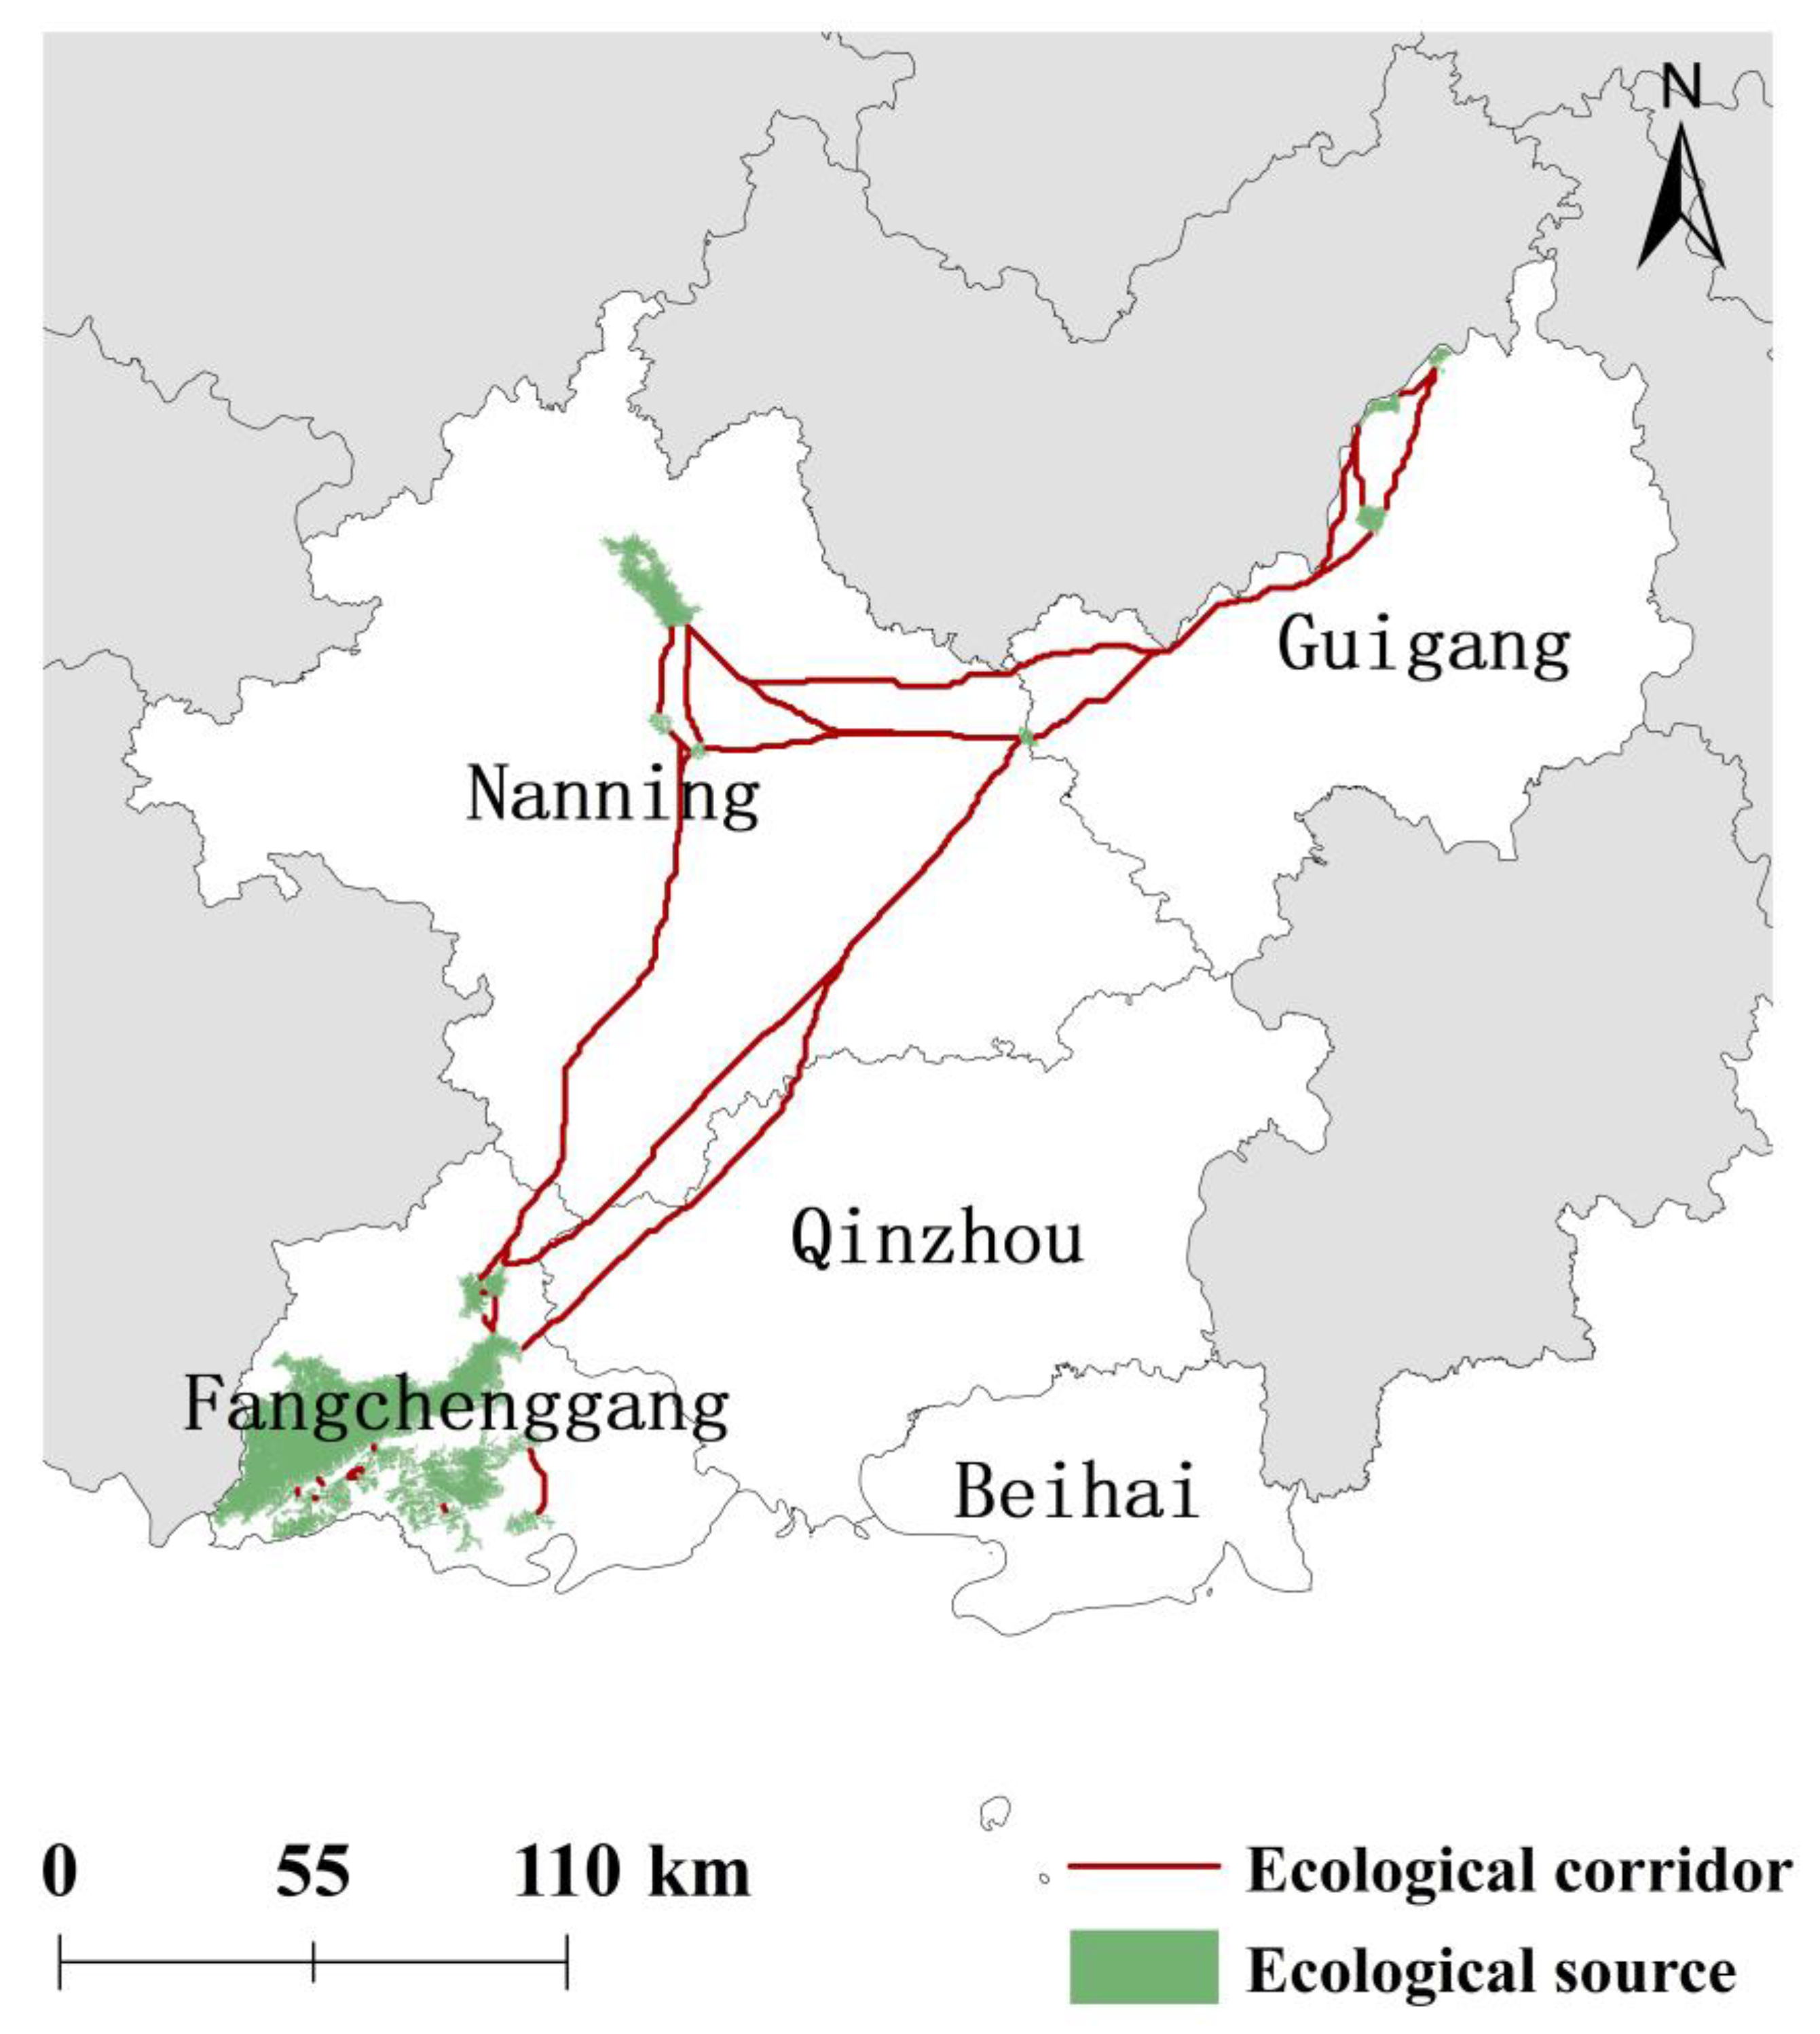
3.3. Ecological Corridor Identification
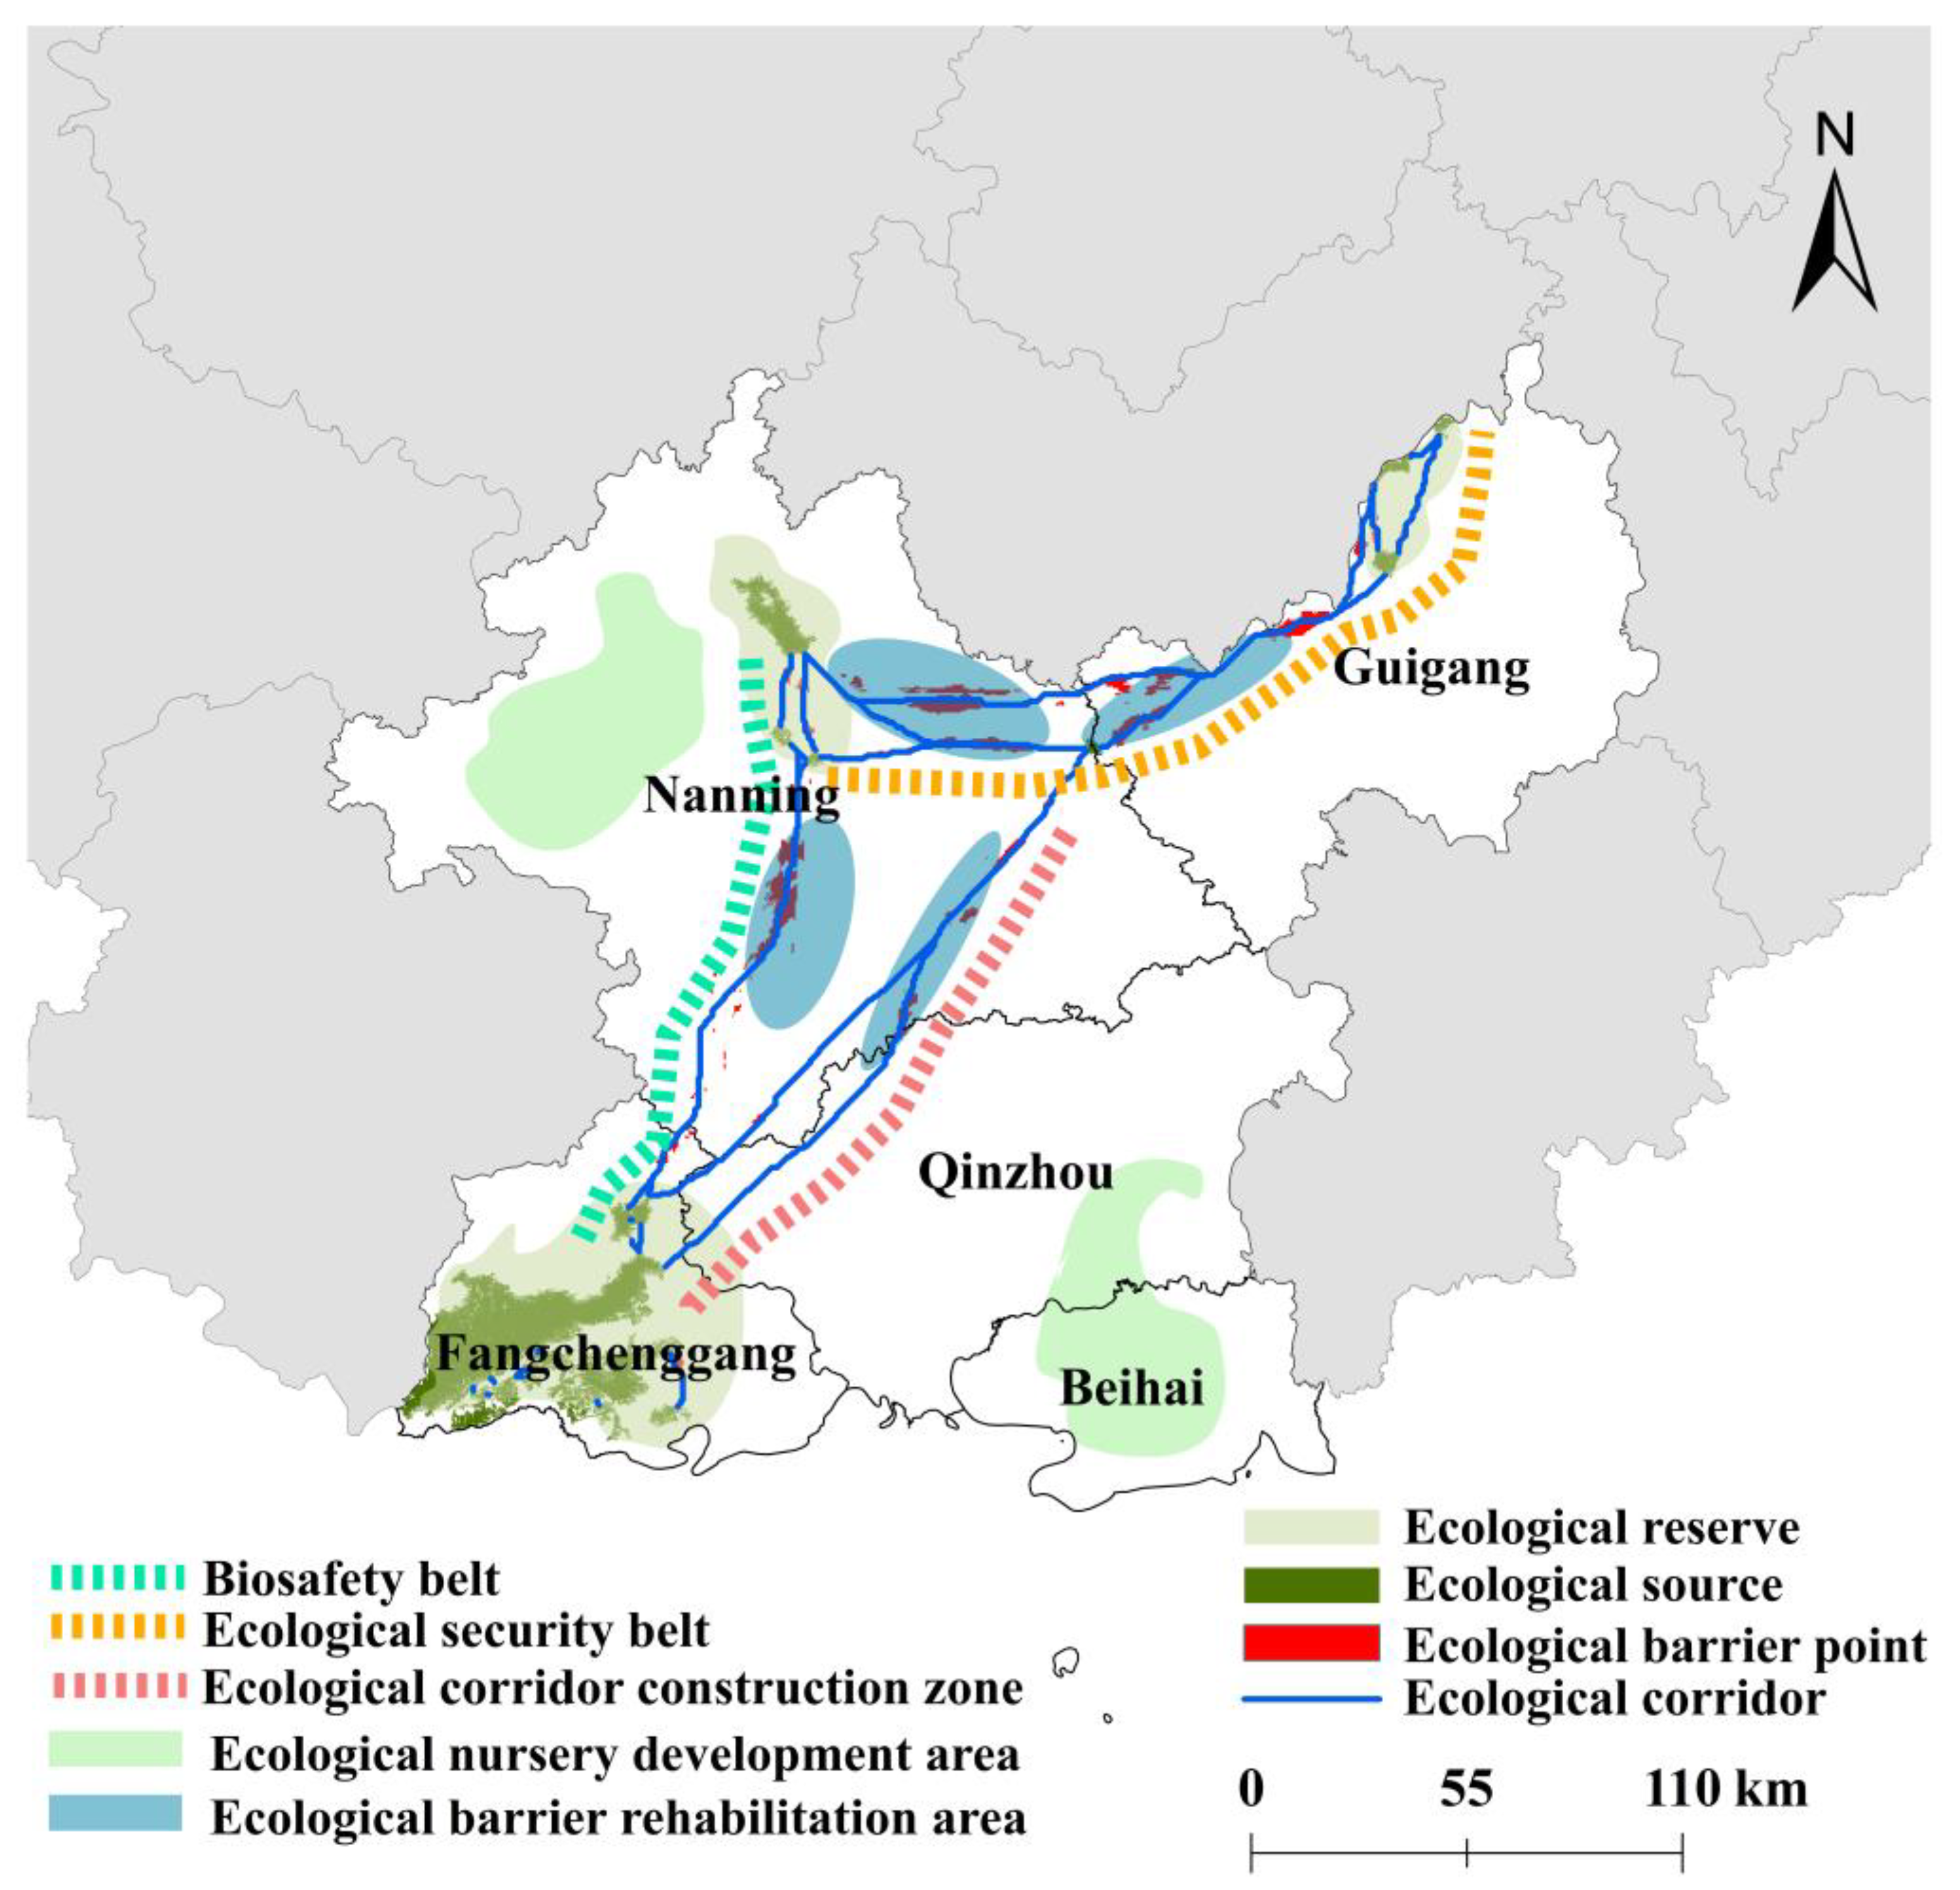
3.4. Ecological Security Pattern Construction
4. Discussion
5. Conclusions
Author Contributions
Funding
Data Availability Statement
Conflicts of Interest
References
- Liu, D.; Chang, Q. Ecological security research progress in China. Acta Ecol. Sin. 2015, 35, 111–121. [Google Scholar] [CrossRef]
- Xiao, D.; Xie, F.; Wei, J. Regional ecological construction and mission of landscape ecology. Ying Yong Sheng Tai Xue Bao 2004, 15, 1731–1736. [Google Scholar]
- Xiang, H.; Zhang, J.; Mao, D.; Wang, M.; Yu, F.; Wang, Z.; Li, H. Optimizing ecological security patterns considering zonal vegetation distribution for regional sustainability. Ecol. Eng. 2023, 194, 107055. [Google Scholar] [CrossRef]
- Li, S.; Zhao, Y.; Xiao, W.; Yue, W.; Wu, T. Optimizing ecological security pattern in the coal resource-based city: A case study in Shuozhou City, China. Ecol. Indic. 2021, 130, 108026. [Google Scholar] [CrossRef]
- Nie, W.; Xu, B.; Yang, F.; Shi, Y.; Liu, B.; Wu, R.; Lin, W.; Pei, H.; Bao, Z. Simulating future land use by coupling ecological security patterns and multiple scenarios. Sci. Total Environ. 2023, 859, 160262. [Google Scholar] [CrossRef]
- Cao, C.; Luo, Y.; Xu, L.; Xi, Y.; Zhou, Y. Construction of ecological security pattern based on InVEST-Conefor-MCRM: A case study of Xinjiang, China. Ecol. Indic. 2024, 159, 111647. [Google Scholar] [CrossRef]
- Liu, M.; Peng, J.; Dong, J.; Jiang, H.; Xu, D.; Meersmans, J. Trade-offs of landscape connectivity between regional and interregional ecological security patterns in a junction area of Beijing-Tianjin-Hebei region. Appl. Geogr. 2024, 167, 103272. [Google Scholar] [CrossRef]
- Peng, J.; Zhao, S.; Dong, J.; Liu, Y.; Meersmans, J.; Li, H.; Wu, J. Applying ant colony algorithm to identify ecological security patterns in megacities. Environ. Model. Softw. 2019, 117, 214–222. [Google Scholar] [CrossRef]
- Zhu, Y.; Liu, Y.; Xiao, Y.; Liu, J.; Zhao, Z.; Li, Y.; Hao, Q.; Liu, C.; Li, J. Construction of Ecological Security Patterns Incorporating Multiple Types of Ecological Service Functions for Developed Coastal Regions: A Case Study in Jinjiang Watershed, China. Land 2024, 13, 1227. [Google Scholar] [CrossRef]
- Zheng, Y.; Tang, P.; Dong, L.; Yao, Z.; Guo, J. Evaluation of ecological carrying capacity and construction of ecological security pattern in West Liaohe River Basin of China. Front. Ecol. Evol. 2024, 12, 1335671. [Google Scholar] [CrossRef]
- Zhai, Y.; Zhai, G.; Yu, Z.; Ma, X.; Lu, Z.; Chen, Y.; Liu, J. Constructing the ecological security pattern of the Daqing River Basin for the high-standard ecological construction of Xiong’an New Area, China. Environ. Dev. Sustain. 2024, 6, 1–24. [Google Scholar] [CrossRef]
- Dong, R.; Zhang, X.; Li, H. Constructing the Ecological Security Pattern for Sponge City: A Case Study in Zhengzhou, China. Water 2019, 11, 284. [Google Scholar] [CrossRef]
- Bi, Y.; Zheng, L.; Wang, Y.; Li, J.; Yang, H.; Zhang, B. Coupling relationship between urbanization and water-related ecosystem services in China’s Yangtze River economic Belt and its socio-ecological driving forces: A county-level perspective. Ecol. Indic. 2023, 146, 109871. [Google Scholar] [CrossRef]
- Zhang, B.; Cao, J.; Chen, D.; Li, X.; Liu, Y.; Wang, J.; Liu, T. Construction of watershed ecological security patterns with integrated of spatial variability: A case study of the Yellow River Basin, China. Ecol. Indic. 2024, 159, 111663. [Google Scholar] [CrossRef]
- Zhang, F.; Jia, Y.; Liu, X.; Li, T.; Gao, Q. Application of MSPA-MCR models to construct ecological security pattern in the basin: A case study of Dawen River basin. Ecol. Indic. 2024, 160, 111887. [Google Scholar] [CrossRef]
- Chen, W.; Liu, H.; Wang, J. Construction and optimization of regional ecological security patterns based on MSPA-MCR-GA Model: A case study of Dongting Lake Basin in China. Ecol. Indic. 2024, 165, 112169. [Google Scholar] [CrossRef]
- Zhang, Y.; Zhao, Z.; Fu, B.; Ma, R.; Yang, Y.; Lü, Y.; Wu, X. Identifying ecological security patterns based on the supply, demand and sensitivity of ecosystem service: A case study in the Yellow River Basin, China. J. Environ. Manag. 2022, 315, 115158. [Google Scholar] [CrossRef] [PubMed]
- Chen, J.; Wang, S.; Zou, Y. Construction of an ecological security pattern based on ecosystem sensitivity and the importance of ecological services: A case study of the Guanzhong Plain urban agglomeration, China. Ecol. Indic. 2022, 136, 108688. [Google Scholar] [CrossRef]
- Peng, J.; Yang, Y.; Liu, Y.; Du, Y.; Meersmans, J.; Qiu, S. Linking ecosystem services and circuit theory to identify ecological security patterns. Sci. Total Environ. 2018, 644, 781–790. [Google Scholar] [CrossRef]
- Han, P.; Hu, H.; Jiang, M.; Wang, M. Construction of Wetland Ecological Security Pattern in Wuhan Metropolitan Core Area Considering Wetland Ecological Risk. Land 2024, 13, 1407. [Google Scholar] [CrossRef]
- Huang, L.; Chen, Z.; Yang, Z.; Chen, M.; Chen, X.; Zhai, T.; Qiu, T. Integrating “quality-risk-demand” framework and circuit theory to identify spatial range and priority area of ecological security pattern in a rapidly urbanizing landscape. Ecol. Inform. 2024, 82, 102673. [Google Scholar] [CrossRef]
- Ma, J.; Mei, Z.; Wang, X.; Li, S.; Liang, J. Ecological Security Pattern Construction and Multi-Scenario Risk Early Warning (2020–2035) in the Guangdong–Hong Kong–Macao Greater Bay Area, China. Land 2024, 13, 1267. [Google Scholar] [CrossRef]
- Dai, L.; Liu, Y.; Luo, X. Integrating the MCR and DOI models to construct an ecological security network for the urban agglomeration around Poyang Lake, China. Sci. Total Environ. 2021, 754, 141868. [Google Scholar] [CrossRef] [PubMed]
- Liu, X.; Su, Y.; Li, Z.; Zhang, S. Constructing ecological security patterns based on ecosystem services trade-offs and ecological sensitivity: A case study of Shenzhen metropolitan area, China. Ecol. Indic. 2023, 154, 110626. [Google Scholar] [CrossRef]
- Huang, K.; Peng, L.; Wang, X.; Deng, W. Integrating circuit theory and landscape pattern index to identify and optimize ecological networks: A case study of the Sichuan Basin, China. Environ. Sci. Pollut. Res. 2022, 29, 66874–66887. [Google Scholar] [CrossRef]
- Zhou, G.; Huan, Y.; Wang, L.; Zhang, R.; Liang, T.; Han, X.; Feng, Z. Constructing a multi-leveled ecological security pattern for improving ecosystem connectivity in the Asian water Tower region. Ecol. Indic. 2023, 154, 110597. [Google Scholar] [CrossRef]
- Cheng, W.; Ma, C.; Li, T.; Liu, Y. Construction of Ecological Security Patterns and Evaluation of Ecological Network Stability under Multi-Scenario Simulation: A Case Study in Desert–Oasis Area of the Yellow River Basin, China. Land 2024, 13, 1037. [Google Scholar] [CrossRef]
- Fu, Y.; Zhang, W.; Gao, F.; Bi, X.; Wang, P.; Wang, X. Ecological Security Pattern Construction in Loess Plateau Areas—A Case Study of Shanxi Province, China. Land 2024, 13, 709. [Google Scholar] [CrossRef]
- Luo, M.; Jia, X.; Zhao, Y.; Wang, H.; Chen, C.; Li, D.; Yang, S.; Li, J. The Temporal and Spatial Characteristics of Ecological Security Pattern in the Loess Plateau, China. Land 2024, 13, 570. [Google Scholar] [CrossRef]
- Wang, N.; Zhao, Y. Construction of an ecological security pattern in Jiangnan water network area based on an integrated Approach: A case study of Gaochun, Nanjing. Ecol. Indic. 2024, 158, 111314. [Google Scholar] [CrossRef]
- Wang, Y.; Qu, Z.; Zhong, Q.; Zhang, Q.; Zhang, L.; Zhang, R.; Yi, Y.; Zhang, G.; Li, X.; Liu, J. Delimitation of ecological corridors in a highly urbanizing region based on circuit theory and MSPA. Ecol. Indic. 2022, 142, 109258. [Google Scholar] [CrossRef]
- Li, S.; Xiao, W.; Zhao, Y.; Lv, X. Incorporating ecological risk index in the multi-process MCRE model to optimize the ecological security pattern in a semi-arid area with intensive coal mining: A case study in northern China. J. Clean. Prod. 2020, 247, 119143. [Google Scholar] [CrossRef]
- Xu, J.; Fan, F.; Liu, Y.; Dong, J.; Chen, J. Construction of ecological security patterns in nature reserves based on ecosystem services and circuit theory: A case study in Wenchuan, China. Int. J. Environ. Res. Public Health 2019, 16, 3220. [Google Scholar] [CrossRef] [PubMed]
- Dickson, B.G.; Albano, C.M.; Anantharaman, R.; Beier, P.; Fargione, J.; Graves, T.A.; Gray, M.E.; Hall, K.R.; Lawler, J.J.; Leonard, P.B. Circuit-theory applications to connectivity science and conservation. Conserv. Biol. 2019, 33, 239–249. [Google Scholar] [CrossRef]
- Xing, P.; Pan, H. New era canal strategy and practice of Pinglu Canal planning andconstruction. Port Waterw. Eng. 2024, 9, 1–6. [Google Scholar]
- Yao, H.; Li, L.; Hu, Y.; Chen, Z.; Sun, P.; Feng, H.; Jin, Z. River-sea intermodal transportation plan of Pinglu Canal in Beibu Gulf Port. Port Waterw. Eng. 2024, 9, 14–19. [Google Scholar]
- Han, W.; Xia, S.; Zhou, W.; Shen, Y.; Su, X.; Liu, G. Constructing ecological security pattern based on ecological corridor identification in Lhasa River Basin. Acta Ecol. Sin. 2023, 43, 8948–8957. [Google Scholar]
- Jahun, B.; Ibrahim, R.; Dlamini, N.; Musa, S. Review of soil erosion assessment using RUSLE model and GIS. J. Biol. Agric. Healthc. 2015, 5, 36–47. [Google Scholar]
- Liu, Z.; Liu, Z.; Zhou, Y.; Huang, Q. Distinguishing the impacts of rapid urbanization on ecosystem service trade-offs and synergies: A case study of shenzhen, China. Remote Sens. 2022, 14, 4604. [Google Scholar] [CrossRef]
- Xue, Q.; Lu, L.; Niu, R.; Zhang, X.; Du, W. Identification and restoration of key areas of ecological security pattern based on sensitivity to geological disasters: A case study of Jinan City. Acta Ecol. Sin. 2021, 41, 9050–9063. [Google Scholar]
- Huang, X. Study on Land Use Change and Ecosystem Services Trade-Off in Karst-Coastal Zone of Southwest Guangxi. Master’s Thesis, Nnaning Normal University, Nanning, China, 2021. [Google Scholar]
- Bai, L.; Feng, X.; Sun, R.; Gao, H. Spatial and temporal responses of habitat quality to urbanization: A case study of Changchun City, Jilin Province, China. Ying Yong Sheng Tai Xue Bao 2020, 31, 1267–1277. [Google Scholar] [PubMed]
- Luo, R.; Yang, S.; Wang, Z.; Zhang, T.; Gao, P. Impact and trade off analysis of land use change on spatial pattern of ecosystem services in Chishui River Basin. Environ. Sci. Pollut. Res. 2022, 29, 20234–20248. [Google Scholar] [CrossRef] [PubMed]
- Chen, X. Estimation of soil organic carbon reserves in Guangxi and comparion study with some provinces in China. Sci. Geogr. Sin. 2014, 34, 1247–1253. [Google Scholar]
- Liao, J.; Jiao, J.; Yan, Z.; Li, J.; Zhang, S. Simulation Effect Analysis of RUSLE Model on Slope Soil Erosion Restored by Reclaimed Vegetation in Loess Plateau. J. Soil Water Conserv. 2024, 38, 97–108. [Google Scholar]
- Chen, W.; Liu, X.; Li, H.; Sun, X.; Wang, Y.; Liu, X.; Xing, L.; Wan, R.; Luo, X.; Wan, C.; et al. Ecosystem service function and security pattern of Tianshan Mountains in Xinjiang from 1990 to 2050. Geol. China 2024, 51, 1644–1663. [Google Scholar]
- Spear, S.F.; Balkenhol, N.; Fortin, M.J.; Mcrae, B.H.; Scribner, K. Use of resistance surfaces for landscape genetic studies: Considerations for parameterization and analysis. Mol. Ecol. 2010, 19, 3576–3591. [Google Scholar] [CrossRef]
- Zhang, Z.; Hu, B.; Jiang, W.; Qiu, H. Construction of ecological security pattern based on ecological carrying capacity assessment 1990–2040: A case study of the Southwest Guangxi Karst-Beibu Gulf. Ecol. Model. 2023, 479, 110322. [Google Scholar] [CrossRef]
- Wang, X.; Chen, T.; Feng, Z.; Wu, K.; Lin, Q. Construction of ecological security pattern based on boundary analysis: A case study on Jiangsu Province. Acta Ecol. Sin. 2020, 40, 3375–3384. [Google Scholar]


| Data | Descriptions | Source |
|---|---|---|
| 2000/2010/2020 land use data | Resolution of 30 m | http://loess.geodata.cn (accessed on 20 August 2024) |
| 2000/2010/2020 precipitation data | 1 km resolution monthly mean precipitation dataset | |
| DEM data | ASTER GODEM elevation data with 30 m resolution | https://www.gscloud.cn/ (accessed on 20 August 2024) |
| Rainfall erosion factor | Reflecting rainfall intensity in the study area | Precipitation data are obtained by applying the formula |
| Soil data | Used to calculate soil erosion factors and plant utilization of water | https://gaez.fao.org/pages/hwsd (accessed on 21 August 2024) |
| NDVI data | For building resistance surfaces | http://loess.geodata.cn (accessed on 21 August 2024) |
| Road data/river network data | Calculation of distances to roads and rivers | OpenStreetMap Data extract (https://www.openstreetmap.org) (accessed on 22 August 2024) |
| Railroad data | Calculate the distance to the railroad |
| Resistance Factor | Resistance Value | Weights | ||||
|---|---|---|---|---|---|---|
| 1 | 2 | 3 | 4 | 5 | ||
| LULC | Water | Forest | Grassland | Cropland | Artificial surface | 0.06 |
| NDVI | 0.67–0.86 | 0.60–0.67 | 0.52–0.60 | 0.39–0.52 | 0.04–0.39 | 0.34 |
| DEM | 703–1740 | 399–703 | 219–399 | 98–219 | 0–98 | 0.11 |
| Slope | 32–73 | 21–32 | 12–21 | 5–12 | 0–5 | 0.09 |
| Distance to the road (m) | >27,370 | 16,572–27,370 | 9683–16,571 | 4468–9682 | <4468 | 0.18 |
| Distance to the water (m) | <2275 | 2275–5149 | 5150–8862 | 8863–14,851 | >14,851 | 0.22 |
Disclaimer/Publisher’s Note: The statements, opinions and data contained in all publications are solely those of the individual author(s) and contributor(s) and not of MDPI and/or the editor(s). MDPI and/or the editor(s) disclaim responsibility for any injury to people or property resulting from any ideas, methods, instructions or products referred to in the content. |
© 2025 by the authors. Licensee MDPI, Basel, Switzerland. This article is an open access article distributed under the terms and conditions of the Creative Commons Attribution (CC BY) license (https://creativecommons.org/licenses/by/4.0/).
Share and Cite
Dang, Z.; Hu, B.; Gao, C.; Wen, S.; Ren, J.; Liang, Y. Construction and Optimization of the Ecological Security Pattern of Pinglu Canal Economic Zone Based on the InVEST-Circuit Theory Model. Land 2025, 14, 1103. https://doi.org/10.3390/land14051103
Dang Z, Hu B, Gao C, Wen S, Ren J, Liang Y. Construction and Optimization of the Ecological Security Pattern of Pinglu Canal Economic Zone Based on the InVEST-Circuit Theory Model. Land. 2025; 14(5):1103. https://doi.org/10.3390/land14051103
Chicago/Turabian StyleDang, Zhanhao, Baoqing Hu, Chunlian Gao, Shaoqiang Wen, Jinrui Ren, and Yunfei Liang. 2025. "Construction and Optimization of the Ecological Security Pattern of Pinglu Canal Economic Zone Based on the InVEST-Circuit Theory Model" Land 14, no. 5: 1103. https://doi.org/10.3390/land14051103
APA StyleDang, Z., Hu, B., Gao, C., Wen, S., Ren, J., & Liang, Y. (2025). Construction and Optimization of the Ecological Security Pattern of Pinglu Canal Economic Zone Based on the InVEST-Circuit Theory Model. Land, 14(5), 1103. https://doi.org/10.3390/land14051103