Abstract
Urban green spaces face increasing pressure to reconcile ecological conservation with rising public demand as urbanization accelerates. Yet the spatial coupling of human needs and natural provisioning in the urban–rural fringe remains insufficiently understood. Focusing on the country park cluster in Beijing’s Huitian region, this study develops an integrated assessment framework—combining ecological importance, ecological connectivity potential, construction suitability, and recreational demand—to evaluate nature suitability and pinpoint spatial mismatches in human–nature interactions. Ecological importance is quantified through ecological sensitivity analysis and InVEST-based habitat-quality modeling, while ecological connectivity potential is estimated via normalized least-cost corridor analysis. Construction suitability is derived from the proportion of artificial surfaces and road network density, and recreational demand is measured by population concentration, facility density, and transport accessibility. These metrics are synthesized to map nature-suitability patterns and reveal divergences between human demand and ecological provisioning. The results show a pronounced north–south gradient in ecological importance, with Dongxiaokou Ditch and Dongxiaokou Forest Park emerging as ecological hotspots. Nineteen ecological source patches are identified, with the strongest connectivity in the southern sector of Dongxiaokou Forest Park. Areas of high construction suitability coincide with well-developed infrastructure, whereas recreational demand clusters around Tiantongyuan and Beiqing Road. Natural and artificial elements intertwine to form an ecological core of 870.74 hm2, yet 13.29% of the study area exhibits mismatches—particularly residential zones lacking green-space access. Over-development within Dongxiaokou Urban Recreation Park likewise falls short of ecological expectations. The study offers targeted recommendations—ecological protection, facility optimization, green-space enhancement, and the integration of multifunctional green infrastructure—and provides a transferable framework for coordinating human and natural systems in other urban–rural fringe contexts.
1. Introduction
1.1. Research Background
The accelerating pace of global urbanization has substantially increased pressure on natural ecosystems, driving up resource consumption, ecological degradation, biodiversity loss, and the decline of ecosystem services [1,2]. These shifts threaten the stability and resilience of urban ecological systems and undermine progress toward sustainable development [3]. As a vital component of urban ecosystems, green spaces deliver multiple ecological functions—including biodiversity conservation, microclimate regulation, and the purification of air and water [4,5]. Simultaneously, they fulfill essential social roles by providing recreational settings that bolster public health, psychological well-being, and overall life satisfaction [6,7]. Yet rapid land-use change and intensifying human activities have disrupted the ecological balance of green spaces, leading to their progressive degradation and fragmentation [8]. Reconciling human needs with natural provisioning has therefore become a central challenge in achieving sustainable and equitable urban development [9,10].
Against this backdrop, urban–rural fringe areas have emerged as critical front lines of ecological and spatial transformation, characterized by mixed land-use, institutional complexity, and socio-environmental tensions [11,12,13]. Country parks—key ecological infrastructures embedded within these transitional zones—maintain biodiversity, uphold ecological stability, curb urban sprawl, and expand residents’ access to nature [14,15,16]. Nevertheless, these parks face mounting threats from habitat fragmentation, ecological disturbance, and a widening mismatch between ecological functions and recreational pressures [17]. Addressing these challenges demands a deeper understanding of the spatial coupling between human activities and ecological processes in country parks, so that conservation objectives can be coordinated with social demand and adaptive governance strategies can guide the sustainable management of green-space systems [18,19].
1.2. Literature Review: Quantification of Human–Nature Relationships
Quantifying human–nature relationships has become a core theme in urban-planning research, especially as urban–rural gradients confront mounting ecological and social pressures [20]. Recent scholarship increasingly advocates multi-dimensional approaches that link landscape structure, ecological function, and human activity [21]. Four interlocking dimensions—ecological importance, ecological connectivity potential, construction suitability, and recreational demand—now underpin many assessments of spatial human–nature coordination.
Ecological importance remains foundational to evaluations of urban landscape sustainability [22]. Ecosystem service frameworks are widely used to gauge the balance between ecological provisioning and human need, serving as proxies for broader ecological sensitivity [23]. Drawing on landscape ecology principles, spatial pattern analyses reveal how urbanization reshapes habitat quality, fragments landscapes, and erodes biodiversity [24]. Fu et al. proposed the “Pattern-Process-Service-Sustainability” paradigm to embed ecological processes within socio-spatial systems [25], signaling a growing consensus on systemic coupling. Parallel work on naturalness—first introduced by Hornstein to capture deviations between actual and potential forest states [26] and later refined by Winter and Kowarik via succession, disturbance, and self-regulation metrics [27,28]—has migrated into urban contexts. Li et al.’s “Urban Spatial Naturalness Degree” links this concept to population dynamics and green-space change [29]. Collectively, these studies underscore the value of spatially explicit ecological indices for identifying high-priority conservation areas.
Moving beyond static measures, ecological connectivity potential is attracting increased attention, particularly in fragmented urban–rural transition zones [30]. Tools such as Morphological Spatial Pattern Analysis (MSPA), delta probability of connectivity (dPC), and least-cost corridor modeling are now common for pinpointing ecological sources, evaluating landscape permeability, and designing dispersal corridors [31,32]. By quantifying the continuity of ecological flows and the structural coherence of landscape mosaics [33], these models mark a methodological shift from snapshot assessments to dynamic spatial analyses that support connectivity restoration.
Research on construction suitability seeks to fold ecological constraints into urban-expansion strategies [34]. Indicators including terrain morphology, land-use intensity, and the proportion of artificial surfaces help characterize spatial development pressure [35], while road network density reveals accessibility-driven ecological stress [36]. Barrette et al. combined slope, vegetation cover, soil texture, and land disturbance into a composite sensitivity model that simultaneously gauges ecological resilience and development potential [37]. Such spatially differentiated suitability analyses provide a foundation for low-impact land-use planning in peri-urban zones where land claim competition is intense.
Finally, recreational demand represents a critical—yet still under-integrated—facet of human–nature relationships [38]. Indicators such as population density, facility distribution, and transport accessibility increasingly quantify residents’ need for green-space access [39,40,41]. Empirical studies reveal profound spatial disparities between green infrastructure supply and social demand [42]. Tong et al. exposed mismatches tied to population heterogeneity, raising equity concerns in recreational resource allocation [43], while Reyes-Riveros et al. highlighted the decisive role of natural environment attributes in public health and psychological well-being [18]. Despite these advances, most analyses still treat recreational demand as an independent social variable, seldom integrating it with ecological supply-side constraints in a spatially explicit manner.
In summary, current scholarship provides a strong conceptual and methodological basis for understanding discrete aspects of human–nature interactions, yet fragmentation persists. A truly integrated spatial-assessment framework that bridges ecological conditions and human needs is essential for pinpointing both conservation priorities and mismatches—an imperative for managing the spatial complexity of urban–rural fringe environments.
1.3. Problem Statement and Objectives
Despite growing scholarly attention to human–nature coordination, current research on the integrated quantitative assessment of human needs and natural provisioning remains limited, which restricts the formulation of effective ecological protection and spatial optimization strategies [44]. Most existing studies tend to address human needs and natural provisioning in isolation, lacking a spatially integrated framework that supports dynamic coordination. This gap is particularly evident in the context of country parks, where fragmented land-use, ecological vulnerability, and increasing recreational demands converge [24]. Therefore, it is essential to develop an analytical framework that integrates ecological foundations, spatial structure, and public use characteristics to reveal the spatial patterns and coordination of human–nature relationships, thereby enabling more targeted and effective green space governance.
The country parks in the Huitian region of Beijing, with their dynamic land-use and ecological significance, serve as a representative case for studying human–nature relationships and guiding spatial optimization [45,46]. This study focuses on these country parks and adopts a human–nature interaction perspective to identify four key elements: ecological importance, ecological connectivity potential, construction suitability, and recreational demand, thereby constructing a multidimensional evaluation framework. The objectives of this work are as follows: (1) to scientifically analyze the spatial distribution pattern of nature suitability in the country parks of the Huitian region; (2) to explore the degree of matching between human needs and natural provisioning within these parks; and (3) to propose spatial protection and optimization strategies to improve ecological functioning and public service delivery in urban–rural fringe landscapes. These efforts aim to strengthen the theoretical foundation and provide practical guidance for ecological restoration, spatial planning, and green space governance in country parks across urban–rural fringe regions.
2. Study Area and Data Sources
2.1. Study Area
This study focuses on the country parks in the Huitian region of Changping District, Beijing, comprising Dongxiaokou Urban Recreation Park, Dongxiaokou Forest Park, Hexin Park, Taiping Country Park, Huoying Park, Banjieta Country Park, and other non-constructed land, totaling 1449.25 hm2 (Figure 1). According to the Changping District Planning (Territorial Spatial Planning) (2017–2035), this area holds strategic significance in optimizing the urban ecological pattern and enhancing ecosystem service functions, serving as a key node between Beijing’s first and second green isolation areas. The Huitian region borders the large residential communities of Huilongguan and Tiantongyuan and faces real challenges such as high population density, limited land resources, and a significant imbalance between residential and natural spaces. The construction and optimization of the country parks play an essential role in meeting the increasing demand for green space among local residents.
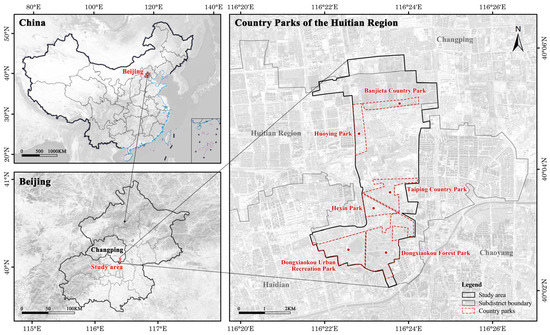
Figure 1.
Location of the study area.
In addition to improving the ecological pattern and addressing residents’ needs for green space, the Huitian region carries cultural significance because of its proximity to the northern extension of Beijing’s historic Central Axis. While its country parks and green spaces are not situated directly on the axis line, they fall within the broader visual and spatial field of the Central-Axis Northern Extension. Planning documents—most notably the Detailed Regulatory Plan for CP2-0101 to CP2-0602 Blocks in Huilongguan and Tiantongyuan Areas, Changping District, Beijing (2020–2035)—build on existing green buffer zones to reinforce the axis’s spatial structure and cultural expression through coherent landscape design and spatial continuity (Figure 2) [45,46,47]. Within this framework, the Huitian country parks act as ecological buttresses, strengthening ecological stability, improving environmental quality, and enhancing spatial governance and public well-being [48].
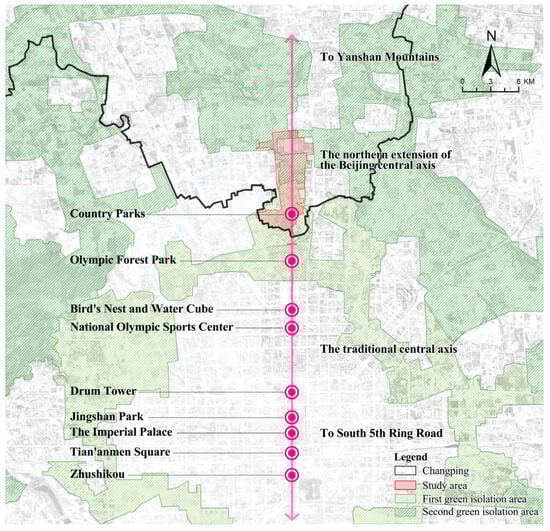
Figure 2.
Spatial distribution of country parks and green isolation areas in the Huitian region.
2.2. Data Sources
This study integrates multiple data sources and systematically preprocesses the data to meet research requirements (Table 1). The 2020 land-use data of Beijing, obtained from the European Space Agency (ESA) at a spatial resolution of 10 m, were classified into seven categories: forestland, grassland, water area, shrubland, cropland, bare land, and construction land [49]. The 2021 Landsat 8 OLI satellite imagery was acquired from the Geospatial Data Cloud with a spatial resolution of 30 m. The imagery underwent atmospheric correction, radiometric calibration, and geometric correction using ENVI 5.3 [50]. Elevation was provided by Geographic remote sensing ecological network platform. Road and water system data were collected using BIGEMAP. Point of interest (POI) data related to shopping, entertainment, recreation, catering, accommodation, and transportation were sourced from Amap. After filtering and reclassification, the POI data were grouped into three categories: residences, transportation sites, and service facilities [51]. To reflect vegetation cover, the Normalized Difference Vegetation Index (NDVI) was used as the main indicator [52]. NDVI data, with a spatial resolution of 30 m, was obtained from the National Ecological Science Data Center. All datasets were uniformly preprocessed and further projected, reclassified, and spatially aligned in ArcGIS 10.6 to ensure consistency in spatial reference and accuracy within the study area. The coordinate system used was WGS_1984_UTM_Zone_50N.

Table 1.
Data sources.
3. Methods
Focusing on the interactions between human needs and natural provisioning, this study develops a nature suitability evaluation framework (Figure 3). The system assesses four key elements: ecological importance, ecological connectivity potential, construction suitability, and recreational demand. The four elements are constructed from a total of eight indicators, and each is scored on a five-point scale to produce an integrated evaluation of human–nature compatibility. The current degree of alignment between human needs and natural provisioning is then calculated to identify rationality and potential deficiencies in resource allocation. Finally, spatial optimization strategies for the country parks are proposed.
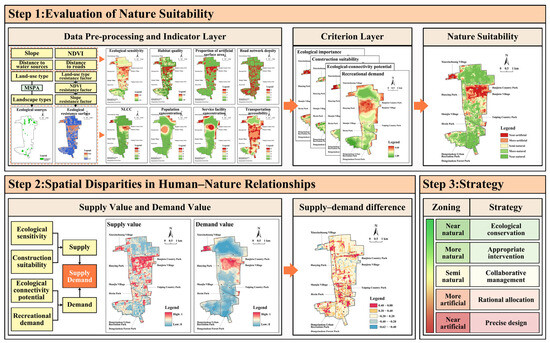
Figure 3.
Framework of this study.
3.1. Ecological Importance Assessment
The ecological importance assessment aims to identify areas that are vital for maintaining ecosystem stability and biodiversity [30]. By integrating ecological sensitivity and habitat quality, the assessment captures regional ecological vulnerability, environmental carrying capacity, and habitat functionality, thereby facilitating the identification of key ecological zones [22].
3.1.1. Ecological Sensitivity
Ecological sensitivity reflects the ability of ecosystems to resist external disturbances and indicates their stability and adaptability [53]. Based on the characteristics of the study area and previous research, four factors were selected to evaluate ecological sensitivity: slope, vegetation cover (NDVI), distance to water sources, and distance to roads [22,54,55].
Slope, as a fundamental topographic factor, impacts ecosystem stability by increasing development costs and reducing disturbance in steeper areas, while flatter regions are more prone to ecological risks due to their accessibility for development [56]. Vegetation cover, as a key determinant of ecological stability and diversity, reduces ecological sensitivity through soil stabilization, runoff regulation, and habitat provision [52]. Distance to water sources is a key spatial factor that impacts ecosystem services, as areas in closer proximity to water bodies contribute more significantly to water conservation, flood regulation, and nonpoint source pollution control [57]. Similarly, distance to roads reflects the degree of ecological fragmentation, and adjacent buffer zones play an essential role in mitigating human disturbances and maintaining ecological connectivity [58]. The indicator values for each factor are provided in Table 2.
Table 2.
Classification and grading of ecological sensitivity indicators.
3.1.2. Habitat Quality
Habitat quality reflects both the nature suitability of a habitat and the degree of external disturbance it experiences [61]. In this study, the InVEST 3.14.3 was employed to assess habitat quality based on two key components: the sensitivity of different land-use types to threat factors and the intensity of external threats. The formula is as follows [62]:
where represents the habitat quality of land-use type j on raster cell x, is the habitat suitability score for type j, z is a scaling factor reflecting spatial heterogeneity, k is a half-saturation constant, and denotes the total threat level of land-use type j on raster cell x.
The study identified cropland and construction land as the two main sources of ecological threats. Research and field observations determined the impact weights and maximum distances of threats (Table 3), which subsequently informed the habitat suitability values and sensitivity assessments for each habitat type (Table 4) [63,64]. Habitat quality was scaled from 0 to 1, corresponding to indicator values ranging from 5 to 1. Lower indicator values indicate higher habitat quality.
Table 3.
Threat factor attribute assignment.
Table 4.
Habitat suitability of different land-use types and their sensitivity to various threat factors.
3.2. Ecological Connectivity Potential Assessment
Ecological connectivity potential measures the accessibility of species migration and material and energy flows [33]. High connectivity potential helps to maintain diversity and ecosystem stability and reduce habitat fragmentation [65].
3.2.1. Ecological Source Extraction
Ecological source areas are key functional zones within ecosystems [53]. In this study, source areas were identified using Morphological Spatial Pattern Analysis (MSPA) in Guidos Toolbox 2.8, with a 60 m edge width and forestland, shrubland, grassland, and water defined as foreground elements [66]. Based on Conefor 2.6, the delta probability of connectivity (dPC) was calculated for core areas larger than 0.5 hm2. The connectivity threshold was set at 2000 m, and the probability of connectivity was set at 0.5 [67]. The dPC was calculated using the following formula [68]:
where dPC represents the delta probability of connectivity, PC is the probability of connectivity index, and is the connectivity value when the target patch is removed.
3.2.2. Ecological Resistance Surface Construction
The resistance surface simulates the degree of species dispersal obstruction [69]. In this study, it is constructed based on three factors: land-use type, NDVI, and slope. The resistance coefficients and weights of each factor are shown in Table 5 [70,71].
Table 5.
Assignment and weights of ecological resistance factors.
3.2.3. Normalized Least-Cost Corridor Identification
Ecological corridors were identified using the Linkage Mapper 3.0.0, based on previously determined ecological source areas and resistance surfaces [72,73]. The resulting raster values were normalized to generate normalized least-cost corridors (NLCC), where lower cell values indicate a higher probability of functioning as effective ecological corridors. The classification criteria for NLCC values are presented in Table 6.
Table 6.
Classification and grading of normalized least-cost corridor values.
3.3. Construction Suitability Assessment
Construction suitability is a key element for evaluating whether regional land development or engineering activities are compatible with ecological, social, and economic requirements [34]. Areas with low construction suitability should be prioritized for ecological protection or restricted from development due to their high ecological value or elevated development costs. In this study, construction suitability was assessed using a 50 × 50 m evaluation grid and was based on two indicators: the proportion of artificial surface area and road network density.
The proportion of artificial surface area reflects the level of infrastructure development and the degree of urbanization within each grid cell [74]. It was calculated as the percentage of built-up and impervious surfaces. Higher proportions indicate a greater concentration of human-made facilities and higher development potential. Road network density represents the accessibility and connectivity of transportation infrastructure, which directly impacts the feasibility and intensity of construction activities [36]. Higher road density is generally associated with improved development potential and construction suitability [75]. The classification and grading criteria for these indicators are presented in Table 7.
Table 7.
Classification and grading of construction suitability indicators.
3.4. Recreational Demand Assessment
The degree of recreational demand reflects both the need for and accessibility to recreational opportunities, and serves as a critical component of cultural ecosystem services [38]. Areas with high recreational demand should be prioritized for recreational development, while those with lower demand may be assigned to lower development priority. In this study, recreational demand was evaluated across three dimensions: population concentration, service facility concentration, and transportation accessibility.
Population concentration reflects the spatial intensity of recreational demand [10]. It was assessed through POI density analysis of residential settlements. The service facility concentration indicates the attractiveness and service level of a given area and was measured using POI density of relevant public service facilities [39]. Transportation accessibility reflects the level of regional connectivity and convenience [40]. It was evaluated by constructing a transportation network using data on residential neighborhoods, POIs of transportation infrastructure, and road network information. Interrupted road segments were corrected to ensure continuity, and accessibility coverage was calculated for each facility point using network analysis [41]. The classification and grading standards for the above indicators are presented in Table 8.
Table 8.
Classification and grading of recreational demand indicators.
3.5. Weighting of Indicators for Evaluating Nature Suitability
The Analytic Hierarchy Process (AHP) is a structured multi-criteria decision-making method that enables quantitative determination of the relative importance of various criteria and sub-criteria through the construction of a hierarchical framework and corresponding judgment matrices [76]. In this study, hierarchical judgment matrices were developed at both the criterion level and the indicator level to reflect the relationships among the components of the evaluation system. Based on these matrices, the weights of eight evaluation indicators were calculated. The final weights reflect the relative contribution of each criterion and its sub-indicators to the overall nature suitability assessment. The detailed weight assignments are presented in Table 9.
Table 9.
Weighting of indicators for nature suitability evaluation based on AHP.
3.6. Evaluation of Human–Nature Relationships Alignment
The spatial alignment between human needs and natural provisioning is evaluated to reveal areas of coordination or mismatch [77]. The natural provisioning dimension includes ecological importance and construction suitability; the former reflects the stability and diversity of the natural environment, while the latter indicates the feasibility and intensity of land development. Human needs are represented by ecological connectivity potential and recreational demand. Ecological connectivity potential reflects the need for species movement corridors, whereas recreational demand captures the need for access to leisure and urban green space.
To enable spatial overlay analysis, both dimensions were normalized. Alignment values were then classified into five categories based on spatial deviation [78]. Values near zero indicate strong alignment between human needs and natural provisioning. Positive deviations suggest an ecological surplus, while negative deviations highlight areas where provisioning falls short of human expectations.
4. Results
4.1. Ecological Importance
Figure 4 illustrates the spatial distribution of ecological sensitivity and its impact factors. As shown in Figure 4a, ecological sensitivity in the study area exhibits a spatial gradient, with higher values in the north and lower values in the south. Low-sensitivity zones are primarily concentrated within Dongxiaokou Ditch and Dongxiaokou Forest Park. Additionally, scattered low-sensitivity areas are observed in the green spaces north of Taipingzhuang Middle Street, within Huoying Park, and in the green areas east of Xiaoxinzhuang Village. In contrast, the highest ecological sensitivity values are mainly distributed around Banjieta Village and Xiaoxinzhuang Village.
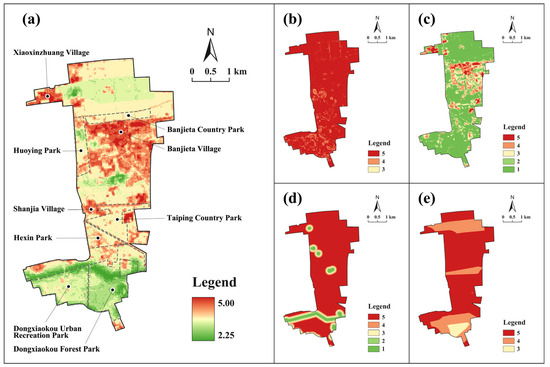
Figure 4.
Spatial distribution of ecological sensitivity and its contributing factors: (a) ecological sensitivity; (b) slope; (c) NDVI; (d) distance to water sources; (e) distance to roads.
Figure 5a shows that the spatial distribution of habitat quality exhibits a pattern of being lower in the northern and southern areas, and higher in the central region. The highest-quality habitats are mainly located on the east side of Dongxiaokou Urban Recreation Park, within Dongxiaokou Forest Park, Hexin Park, Taiping Country Park, the central section of Huoying Park, and Banjieta Country Park along with its adjacent northern forestlands. Among these, Dongxiaokou Forest Park and Banjieta Country Park account for the largest proportion of high-quality habitat areas. In contrast, the lowest habitat quality is found near Banjieta Village, the eastern side of Taiping Country Park, Xiaoxinzhuang Village, Shanjia Village, and Hemu Villas Community. Overall, the spatial distribution of areas with both high and low habitat quality appears relatively balanced.
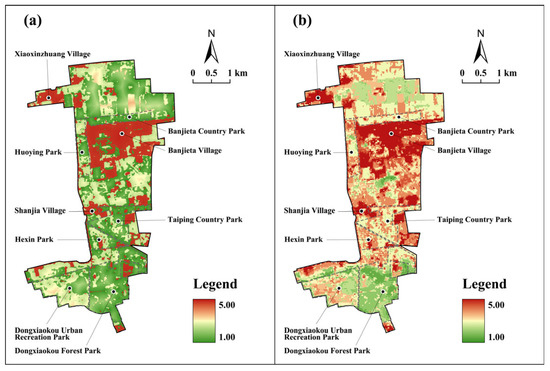
Figure 5.
(a) Habitat quality. (b) Ecological importance.
Figure 5b presents the spatial distribution of ecological importance. With the exception of Dongxiaokou Ditch, Dongxiaokou Forest Park, the eastern side of Dongxiaokou Urban Recreation Park, and the green space north of Taipingzhuang Middle Street, which are identified as areas of low ecological importance, the majority of high-importance zones are concentrated in residential areas and gradually diminish outward. Notably, Dongxiaokou Ditch and Dongxiaokou Forest Park demonstrate significant ecological importance within the study area.
4.2. Ecological Connectivity Potential
4.2.1. Ecological Source
As illustrated in Figure 6a, ecological core areas within the study region are predominantly concentrated in the northern and southern sections, forming the backbone of the regional ecological security pattern. In contrast, core patches in the central area are more fragmented and smaller in scale. To evaluate the ecological connectivity of these core areas, the study calculated the dPC values. A total of 19 ecological source areas with dPC values greater than 0.5 were identified (Figure 6b). Among them, the source area located on the southern side of Dongxiaokou Forest Park was identified as the most critical. This area serves as a key ecological node, playing an essential role in linking the northern extension of the central ecological axis.
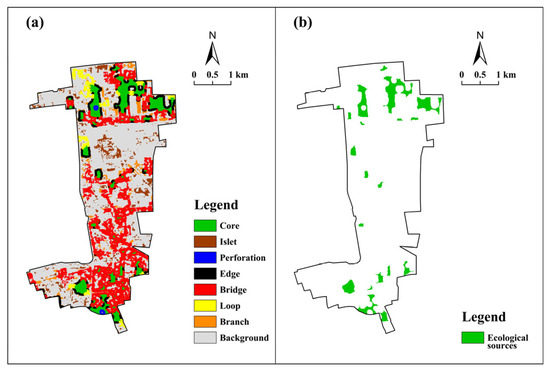
Figure 6.
(a) Landscape types based on MSPA. (b) Ecological sources.
4.2.2. Ecological Resistance Surface
Figure 7 illustrates the spatial distribution of resistance impact factors and the corresponding ecological resistance surfaces within the country parks. By integrating each resistance factor with its assigned weight, the ecological resistance surface of the study area was constructed. The results reveal a clear spatial differentiation in resistance values. Areas with high resistance are primarily concentrated near residential zones, whereas low-resistance areas are mainly located within the country parks and ecological spaces in the northern part of the study area. These low-resistance zones are generally situated at a distance from construction land.
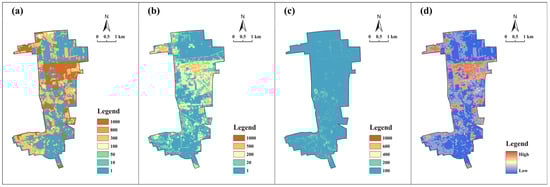
Figure 7.
Spatial distribution of resistance factors and the integrated ecological resistance surface: (a) land-use; (b) NDVI; (c) slope; (d) ecological resistance surface.
4.2.3. Potential Corridors
Figure 8 illustrates the spatial distribution of least-cost pathways and potential ecological corridors. Based on the identified ecological source areas and the ecological resistance surface, a total of 39 least-cost paths were delineated, spanning a cumulative length of 34.09 km (Figure 8a). As shown in Figure 8b, the potential ecological corridors display a distinct linear pattern, with low-resistance zones traversing six country parks along a north–south ecological axis, thereby forming the core spatial structure for regional connectivity. The highest corridor values are primarily concentrated near Xiaoxinzhuang Village and Banjieta Village.
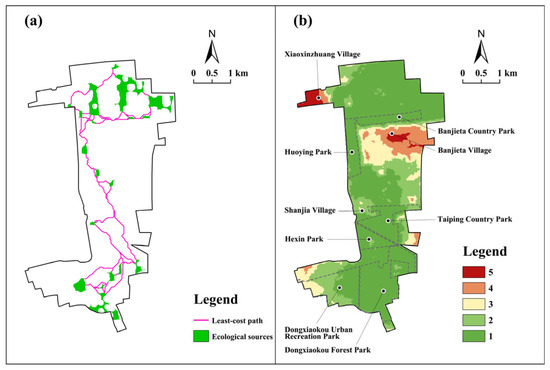
Figure 8.
(a) Least-cost path. (b) NLCC.
4.3. Construction Suitability
Figure 9 illustrates the spatial distribution of the proportion of artificial surface area, road network density, and overall construction suitability. As shown in Figure 9a, artificial surface area exhibits strong spatial polarization. Within the study area, regions classified with indicator values of 1 and 5 account for 67.35% and 18.03% of the total area, respectively, while intermediate values are concentrated along the transitional boundaries. High concentrations of artificial surfaces are observed around Banjieta Village, Xiaoxinzhuang Village, Shanjia Village, and the eastern and northern periphery of Taiping Country Park. This spatial fragmentation is closely aligned with land-use patterns defined by urban planning. Figure 9b reveals a relatively even spatial distribution of road network density, with high-density and low-density areas forming a complementary spatial pattern in relation to artificial surfaces. Figure 9c displays the spatial distribution of construction suitability, where high-suitability zones show a clustered pattern aligned with built-up areas, while low-suitability zones are scattered and correspond to areas of low road network density.
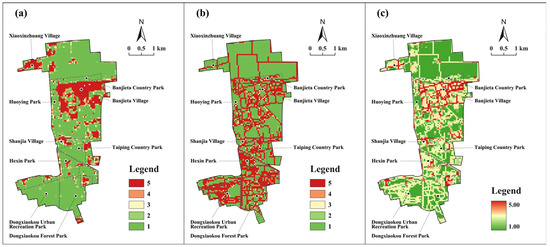
Figure 9.
Spatial distribution of construction suitability and its contributing factors: (a) proportion of artificial surface area; (b) road network density; (c) construction suitability.
4.4. Recreational Demand
Figure 10 presents the evaluation results of population concentration, service facility concentration, transportation accessibility, and recreation demand. Figure 10a,b illustrate the spatial distribution of population and service facilities, respectively. Both exhibit a pattern of higher values in the central area and lower values toward the periphery. High-value zones are primarily concentrated in residential areas located on the north and south sides of Taipingzhuang North Street and in Banjieta Village. Notably, there are spatial differences between the high-value areas of population and service facility concentration. Population concentration is highest near Beiqijia Town on the northeastern side of the study area, while service facility concentration peaks in Xiaoxinzhuang Village on the northwest side and the Tiantongyuan area to the east. Figure 10c shows the spatial distribution of transportation accessibility, which displays a pattern of low values in the north and south and high values in the central region. Areas with low accessibility are mainly located in the southwest of Dongxiaokou Urban Recreation Park and in the forestland and cropland areas north of Banjieta Country Park.
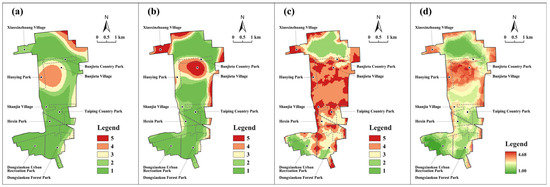
Figure 10.
Spatial distribution of recreational demand and its component indicators: (a) population concentration; (b) service facility concentration; (c) transportation accessibility; (d) recreational demand.
Figure 10d illustrates the spatial distribution of recreation demand. Areas with higher demand form an “H”-shaped pattern, mainly concentrated near residential zones. In contrast, areas with lower demand are located in the Dongxiaokou Urban Recreation Park, Dongxiaokou Forest Park, as well as forestland and cropland north of Banjieta Country Park. These low-demand areas become more widespread as the distance from residential zones increases.
4.5. Nature Suitability
As shown in Figure 11, the nature suitability zoning in the study area exhibits a spatial pattern characterized by natural connectivity interwoven with artificial infiltration. Specifically, the more-natural and near-natural areas are the dominant types, accounting for 30.26% and 29.82% of the total area, respectively, with a combined area of 870.74 hm2 (Table 10). These zones are continuously distributed and cover several key ecological nodes, including Dongxiaokou Urban Recreation Park, Dongxiaokou Forest Park, Hexin Park, Taiping Country Park, the green space north of Shanjia Village, Huoying Park, and Banjieta Country Park. They also include the cropland and forestland north of these areas, forming the core ecological network along the extension of the north central axis. In comparison, the near-artificial area and the more-artificial area occupy the smallest proportions. Apart from the concentrated groups around Xiaoxinzhuang Village and Banjieta Village, these areas mostly show a pattern of spatial penetration, extending from peripheral residential zones into the interior. Semi-natural areas display strong spatial heterogeneity. On the west side of Tiantong Xiyuan Community, they form a relatively centralized and continuous green space. In other regions, their distribution closely aligns with the spatial layout of cropland.
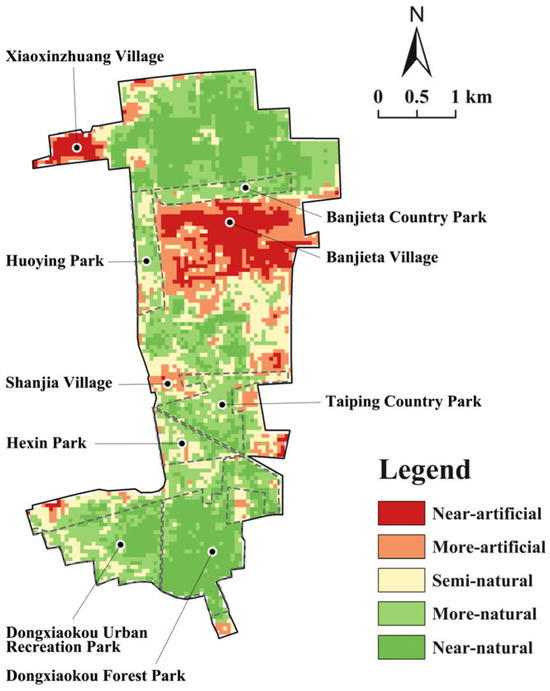
Figure 11.
Spatial distribution of nature suitability levels across the study area.
Table 10.
Area statistics of nature suitability levels in the country parks.
4.6. Spatial Disparities in Human–Nature Relationships
As shown in Figure 12, the spatial mismatch between human needs and natural provisioning is clearly evident within the country parks. From the supply perspective (Figure 12a), areas such as Banjieta Village, Xiaoxinzhuang Village, Shanjia Village, and the eastern and northern edges of Taiping Country Park exhibit higher land-use intensity, indicating greater degrees of artificial development. In contrast, less developed areas are primarily located within the forestlands of the six country parks and to the north of Banjieta Country Park, displaying a more fragmented spatial distribution.
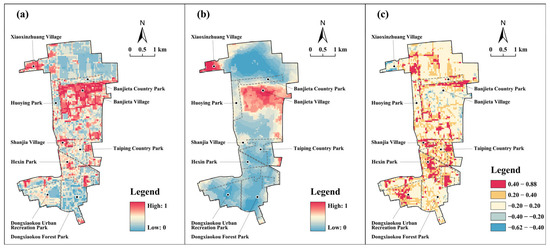
Figure 12.
Spatial alignment between human needs and natural provisioning in the country parks: (a) supply value; (b) demand value; (c) supply and demand difference.
From the demand perspective (Figure 12b), the demand for artificial spaces is most concentrated around Banjieta Village and Xiaoxinzhuang Village, with impact radiating into surrounding residential areas. Conversely, demand for nature-oriented spaces is focused around Dongxiaokou Urban Recreation Park, Dongxiaokou Forest Park, Hexin Park, Taiping Country Park, and the adjacent northern green spaces. This demand also extends into the forestland and cropland areas north of Banjieta Country Park.
Figure 12c and Table 11 further quantify the spatial differences between human needs and natural provisioning. A significant portion of the study area, accounting for 56.69%, falls within the supply and demand balance zone, where supply meets demand. Areas with a supply surplus, represented by the “supply-abundant” and “supply excess” categories, cover 40.17% of the total area. In contrast, under-supplied areas, including both “supply shortage” and “under-supplied” categories, comprise only 3.14%. In these under-supplied zones, natural spaces adjacent to residential communities fail to meet the daily needs of nearby populations. Furthermore, the intensity of localized construction in parks such as Dongxiaokou Urban Recreation Park, Dongxiaokou Forest Park, Hexin Park, and Taiping Country Park is relatively high, leading to limited availability of natural habitat for non-human species. In contrast, balanced areas are mainly distributed in the green spaces east of Dongxiaokou Urban Recreation Park, the southern section of Dongxiaokou Forest Park, the northern part of Taiping Country Park, Xiaoxinzhuang Village, Banjieta Village, as well as the forested and cultivated lands north of Banjieta Country Park.
Table 11.
Classification of spatial relationships between human needs and natural provisioning.
5. Discussion
5.1. Spatial Patterns of Nature Suitability and Human–Nature Imbalances
Based on the results of the nature suitability evaluation (Figure 11), the spatial pattern in the study area shows clear stratification characteristics (Figure 13). The near-natural and more-natural areas exhibit strong spatial continuity (Figure 13a). The width of potential ecological corridors in these areas meets the criteria for optimal ecological corridors, playing a key role in maintaining urban ecological flow and material exchange [79]. These corridors also serve as spatial buffers that protect core ecological sources, such as Taiping Country Park, Dongxiaokou Forest Park, and Dongxiaokou Urban Recreation Park. They help reduce the ecological pressures caused by urban expansion [66]. However, the potential ecological corridors around Huoying Park are relatively narrow. Their connectivity is susceptible to edge effects and urban sprawl, which may threaten the continuity of the ecological network along the north-to-south axis [73].
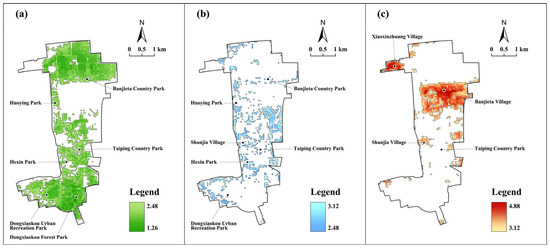
Figure 13.
Spatial patterns of nature suitability zoning: (a) near-natural and more-natural; (b) semi-natural; (c) near-artificial and more-artificial.
In contrast, near-artificial and more-artificial areas display a clear clustered spatial distribution (Figure 13c). These areas expand outward from residential centers. This pattern meets the daily recreational needs of residents and supports the sustainable development of high-density urban activities. Improved accessibility enhances the frequency of residents’ daily use, supporting the effectiveness of the 15 min living circle theory in promoting community vitality [80]. Although the ecological functions of these areas are limited, they provide essential recreational space for urban life.
Additionally, semi-natural areas are scattered in a patchy spatial pattern (Figure 13b). They serve as ecological transition zones between artificial environments and natural ecosystems. However, due to high landscape fragmentation, these areas have limited capacity for ecosystem services such as biodiversity conservation, carbon sequestration, and microclimate regulation [17]. It is also notable that the spatial distribution of these areas significantly overlaps with cropland. This suggests that agricultural activity impacts regional ecological connectivity, aligning with the findings of Kaskevich et al. [81].
There is a strong correlation between ecosystem fragmentation and the spatial disconnect between human needs and natural provisioning in urban–rural fringe areas. This phenomenon reflects a deeper inadequacy in urban planning and policy orientation, particularly in reconciling ecological conservation with public needs. Studies have shown that urbanization not only increases landscape complexity but also exacerbates ecosystem fragmentation, a trend especially evident in fringe areas of cities [4]. Similar issues are observed in major global cities. To curb urban sprawl, metropolitan areas such as London, Paris, and Tokyo have successively established green belts along their urban–rural fringes [82]. However, weak policy enforcement and the powerful economic incentives of real-estate development have allowed these peri-urban green spaces to be steadily encroached upon, resulting in pronounced fragmentation [83]. The insights from this study therefore provide a valuable reference for capital cities with similar characteristics—high economic output, dense populations, strong accessibility, and analogous urban green-space systems.
From the perspective of planning practice, past urban development strategies have prioritized economic efficiency and land development. As a result, they have often overlooked the continuity of ecosystems and the equitable allocation of green space services. This has led to a mismatch between green space resource allocation and residents’ actual needs. Specifically, while country parks offer ample natural space, the lack of supporting facilities often limits their ability to meet the leisure and recreational needs of nearby residents. At the same time, high-density residential areas generally lack decentralized micro-green spaces. This imbalance in spatial distribution has further intensified the contradiction between supply and demand. The root cause of this imbalance lies in the narrow understanding of green space functions during policy formulation. Existing approaches often fail to consider the comprehensive impact of residents’ behavioral patterns and socio-economic conditions [84]. Under the pressures of rapid urbanization, this limitation has become more pronounced. Land expansion and rigid functional zoning have intensified spatial imbalances, posing challenges that traditional planning methods struggle to address [13]. To overcome these issues, future urban planning must emphasize ecosystem integrity and the accessibility of public services. Targeted policy intervention should support the spatial coordination of green infrastructure and community needs, thereby promoting more sustainable and resilient urban development.
5.2. Spatial Protection and Optimization Strategy for the Country Parks
Based on the above analysis of nature suitability and the coordination between human needs and natural provisioning, ecological construction practices in the Huitian region reflect both the effectiveness of current policies and opportunities for further optimization. In recent years, Beijing has promoted active ecological development in the Huitian region through the implementation of the “Huitian Plan”, which has achieved notable results. Since 2018, the plan has created substantial open space through relocation efforts and has led to the construction of parks such as Huoying Park, Hexin Park, and Dongxiaokou Urban Recreation Park. These projects have significantly improved the area’s ecological service capacity [85]. In addition to enhancing the ecological environment, they provide high-quality green spaces that meet the recreational needs of local residents. For example, Dongxiaokou Urban Recreation Park integrates ecological benefits with multifunctional uses, such as recreation and fitness, offering convenient access to green space for the surrounding community. Moreover, the implementation of the non-construction land management policy has provided institutional support for ecological protection. Although the policy currently targets rural areas, its principles of ecological preservation and rational land-use are applicable to the Huitian region as well.
Nevertheless, challenges remain in policy implementation. Ecological fragmentation and misalignments between human needs and natural provisioning still persist. Although green space coverage in Huitian now exceeds the citywide average within a 500 m service radius, some park designs do not fully align with residents’ actual needs. Problems such as inadequate supporting facilities and low usage rates are common. In densely populated areas like Xiaoxinzhuang Village and Banjieta Village, high proportions of construction land create significant ecological resistance, weakening regional ecological connectivity. Additionally, large-scale road reconstruction projects, while aiming to alleviate traffic congestion, have resulted in noise pollution and vegetation loss during construction. Urban renewal efforts have encroached on green spaces, further disrupting the natural environment. As residents’ expectations for commercial and cultural facilities continue to rise, these developments increasingly conflict with ecological protection goals. The structural imbalance between spaces for human needs and natural provisioning has become a major constraint on the stability and sustainable development of the local ecosystem.
In this context of limited land availability, achieving a balanced relationship between human needs and natural provisioning has become a key challenge for urban planning in megacities like Beijing [86]. Based on the distinct characteristics of near-natural areas, more-natural areas, and artificialized areas, the following optimization strategies are proposed to balance ecological protection and spatial utilization. For near-natural areas, such as the forestlands east of Dongxiaokou Urban Recreation Park, the southern edge of Dongxiaokou Forest Park, and the northern boundary of Banjieta Country Park, these zones should be strictly protected as core ecological areas. Large-scale development should be avoided. Establishing ecological corridors and buffer zones can strengthen ecological connectivity and ensure the movement of small wildlife species [71]. Intelligent management tools can also be introduced to monitor ecological conditions in real time and ensure the sustainability of ecological functions. For more-natural areas, such as the green space north of Taiping Country Park, it is recommended to enhance ecological functions by limiting development intensity and optimizing facility layouts. Adding multifunctional spaces, including sports venues and children’s activity areas, can help meet recreational needs while maximizing ecosystem service capacity [78]. In artificialized areas, particularly residential groups, the construction and distribution of small and micro green spaces should be strengthened [87]. Public facilities should be reasonably planned, and green spaces should be designed to fulfill both ecological and recreational functions. Multifunctional designs can enhance resident well-being [88]. Additionally, green infrastructure, such as green roofs and rain gardens, can be integrated to improve microclimate regulation and environmental purification [89]. Through these comprehensive measures, it is possible to achieve more efficient spatial protection and optimal land-use across different zones. This approach supports the coordinated development of the urban ecological environment and social needs.
The practices in the Huitian region will establish a replicable model for other urban-rural fringe areas in Beijing and the Beijing–Tianjin–Hebei urban agglomeration. These regions similarly confront the conflict between ecological conservation and urban expansion [30]. Moreover, interregional development disparities and the siphon effect of core cities have significantly aggravated localized imbalances between ecological protection and social demand [23]. Regional disparities in population density, economic development, natural conditions, and urbanization levels collectively shape nature suitability zoning and spatial optimization strategies. To address sustainability challenges, context-specific governance policies and spatial planning are essential. In affluent urban areas, increasing recreational facilities can meet social demand, while economically disadvantaged regions should prioritize ecological protection by reducing construction intensity and expanding conservation areas to enhance ecosystem services [23].
5.3. Limitations and Future Research
This study proposes a spatial evaluation framework for country parks, focusing on the coordination between human needs and natural provisioning to inform planning and optimization, though some limitations remain and warrant further discussion. First, the evaluation results may be affected by constraints such as limited street-level population data, overlapping land ownership, and dynamic land-use changes. Second, in assessing ecological importance, the selection of ecological sensitivity indicators may lack comprehensiveness, and the weighting process involves a degree of subjectivity. Future research could incorporate additional ecological factors, such as soil erosion and hydrological conditions, and adopt objective weighting methods like the entropy weighting method. Moreover, the selection of ecological resistance factors and the assignment of resistance coefficients may not fully capture actual conditions. Future studies could include variables such as climate and human activity intensity and refining resistance coefficients through field surveys and long-term monitoring. Additionally, the factors used to evaluate construction suitability and recreational demand may not fully reflect the complexity of real-world conditions. Future research is encouraged to include more indicators and improve accuracy through spatial analysis methods, such as geographically weighted regression.
6. Conclusions
This study proposes an integrated framework to examine human–nature relationships in the Huitian region of Beijing by incorporating four key dimensions: ecological importance, ecological connectivity potential, construction suitability, and recreational demand. The results demonstrate a distinct north–south gradient in ecological importance, with higher values in the north and lower in the south. In contrast, habitat quality and ecological sensitivity follow a different spatial pattern, both peaking in the central area. Dongxiaokou Ditch and Dongxiaokou Forest Park are identified as critical ecological zones due to their high sensitivity and habitat quality. Ecological connectivity analysis identified 19 major ecological source areas, with the southern portion of Dongxiaokou Forest Park playing a central role in maintaining connectivity. High ecological resistance is mainly concentrated in residential areas, while lower resistance is observed in country parks and northern ecological spaces. Construction suitability exhibits a clustered distribution in regions with high road network density, whereas low-suitability areas are scattered and tend to overlap with underdeveloped infrastructure. Recreational demand forms an “H”-shaped spatial pattern concentrated around residential communities, while low-demand areas are located in Dongxiaokou Urban Recreation Park, Dongxiaokou Forest Park, and the forestland and cropland north of Banjieta Country Park. The integrated evaluation outlines a spatial structure characterized by natural connectivity interwoven with artificial infiltration, forming an ecological core of 870.74 hm2. Further analysis reveals that 13.29% of the study area experiences spatial mismatches between human needs and natural provisioning, particularly in zones where construction intensity fails to support local recreational demand. These findings provide theoretical support for optimizing the spatial layout and multifunctionality of country parks in the Huitian region, enhancing the delivery of ecological services, and improving residents’ access to green space. More broadly, the proposed framework provides transferable insights for guiding urban green space planning and human–nature coordination in other urban–rural fringe contexts.
Author Contributions
Conceptualization, H.L., Z.L. and A.J.; methodology, A.J. and Z.L.; software, H.L.; validation, Z.L. and A.J.; formal analysis, Z.L. and A.J.; investigation, W.Z.; resources, H.L. and W.Z.; data curation, Z.L. and A.J.; writing—original draft preparation, Z.L. and A.J.; writing—review and editing, H.L., A.J. and Z.L.; visualization, Z.L. and A.J.; supervision, H.L.; project administration, H.L. All authors have read and agreed to the published version of the manuscript.
Funding
This research was funded by the Cultivation and Application Scenario Technological Demonstration of Winter Evergreen and Colored Plants (Z221100005222035).
Data Availability Statement
Data and materials are available from the authors upon request.
Acknowledgments
The authors thank the anonymous reviewers for their valuable comments and suggestions on this article.
Conflicts of Interest
Author Zhenyu Li was employed by the company Shanghai Tongji Urban Planning & Design Institute Co., Ltd. Author Weijie Zhuang was employed by the company PowerChina Huadong Engineering Co., Ltd. The remaining authors declare that the research was conducted in the absence of any commercial or financial relationships that could be construed as a potential conflict of interest.
References
- Cumming, G.S.; Buerkert, A.; Hoffmann, E.M.; Schlecht, E.; Cramon-Taubadel, S.V.; Tscharntke, T. Implications of agricultural transitions and urbanization for ecosystem services. Nature 2014, 515, 50–57. [Google Scholar] [CrossRef] [PubMed]
- Chang, C.H.; Erbaugh, J.T.; Fajardo, P.; Lu, L.; Molnár, I.; Papp, D.; Robinson, B.E.; Austin, K.G.; Castro, M.; Cheng, S.H.; et al. Global evidence of human well-being and biodiversity impacts of natural climate solutions. Nat. Sustain. 2024, 8, 75–85. [Google Scholar] [CrossRef]
- Huang, J.; Bibri, S.E.; Keel, P. Generative spatial artificial intelligence for sustainable smart cities: A pioneering large flow model for urban digital twin. Environ. Sci. Ecotechnol. 2025, 24, 100526. [Google Scholar] [CrossRef] [PubMed]
- Wu, S.; Chen, B.; Webster, C.; Xu, B.; Gong, P. Improved human greenspace exposure equality during 21st century urbanization. Nat. Commun. 2023, 14, 60–64. [Google Scholar] [CrossRef] [PubMed]
- Venter, Z.S.; Hassani, A.; Stange, E.; Schneider, P.; Castell, N. Reassessing the role of urban green space in air pollution control. Proc. Natl. Acad. Sci. USA 2024, 121, e2306200121. [Google Scholar] [CrossRef]
- Delgado-Serrano, M.M.; Melichová, K.; Fadden, I.M.; Cruz-Piedrahita, C. Perception of green spaces’ role in enhancing mental health and mental well-being in small and medium-sized cities. Land Use Policy 2024, 139, 107087. [Google Scholar] [CrossRef]
- Liu, R.; Pan, X.; Xia, Z.; Gou, J.; Han, J.; Cao, K.; Wang, D.; Xue, C. How to lead the optimization of parks spatial patterns more comprehensively with the philosophy of green equity: A case of Chengdu. Habitat Int. 2025, 157, 103318. [Google Scholar] [CrossRef]
- Ortega, U.; Ametzaga-Arregi, I.; Sertutxa, U.; Peña, L. Identifying a green infrastructure to prioritise areas for restoration to enhance the landscape connectivity and the provision of ecosystem services. Landsc. Ecol. 2023, 38, 3751–3765. [Google Scholar] [CrossRef]
- Zoeller, K.C.; Smith, G.S.; Coggan, A.; Grainger, D.; Grigg, N.J.; Szetey, K. Navigating human-nature interactions by exploring plural values across ecosystem states. People Nat. 2025, 7, 434–448. [Google Scholar] [CrossRef]
- Zong, W.; Qin, L.; Jiao, S.; Chen, H.; Zhang, R. An innovative approach for equitable urban green space allocation through population demand and accessibility modeling. Ecol. Indic. 2024, 160, 111861. [Google Scholar] [CrossRef]
- Wang, M.; You, X.-Y.; Zhao, S.-M. Multi-species ecological network based on asymmetric movement: Application in an urban rural fringe. Landsc. Urban Plan. 2025, 254, 105253. [Google Scholar] [CrossRef]
- Cao, L.; Wang, G.; Yang, F.; Li, L.; He, R. Urbanization and plant diversity in urban fringes: Differential responses across life forms. J. Environ. Manag. 2024, 371, 123151. [Google Scholar] [CrossRef]
- Wang, C.; Sun, X.; Liu, Z.; Xia, L.; Liu, H.; Fang, G.; Liu, Q.; Yang, P. A novel full-resolution convolutional neural network for urban-fringe-rural identification: A case study of urban agglomeration region. Landsc. Urban Plan. 2024, 249, 105122. [Google Scholar] [CrossRef]
- Shi, Y.; Zheng, J.; Zheng, B. Multidimensional effect analysis of typical country park construction in Shanghai. Ecol. Indic. 2024, 160, 111866. [Google Scholar] [CrossRef]
- Yang, L.; Lu, Y.; Cao, M.; Wang, R.; Chen, J. Assessing accessibility to peri-urban parks considering supply, demand, and traffic conditions. Landsc. Urban Plan. 2025, 257, 105313. [Google Scholar] [CrossRef]
- Pourtaherian, P.; Jaeger, J.A.G. How effective are greenbelts at mitigating urban sprawl? A comparative study of 60 European cities. Landsc. Urban Plan. 2022, 227, 104532. [Google Scholar] [CrossRef]
- Peco-Costas, C.; Acuña-Alonso, C.; García-Ontiyuelo, M.; Álvarez, X. Assessing ecological connectivity in the Serra do Cando and Serra do Candán area of Galicia: A multitemporal classification and least-cost path modelling approach. Ecol. Inform. 2025, 86, 103049. [Google Scholar] [CrossRef]
- Reyes-Riveros, R.; Altamirano, A.; Barrera, F.D.L.; Rozas-Vásquez, D.; Vieli, L.; Meli, P. Linking public urban green spaces and human well-being: A systematic review. Urban For. Urban Green. 2021, 64, 127105. [Google Scholar] [CrossRef]
- Zhou, K.; Song, Y.; Tan, R. Public perception matters: Estimating homebuyers’ willingness to pay for urban park quality. Urban For. Urban Green. 2021, 64, 127275. [Google Scholar] [CrossRef]
- Musacchio, L.R. Ecologies as a complement to ecosystem services? Exploring how landscape planners might advance understanding about human–nature relationships in changing landscapes. Landsc. Ecol. 2018, 33, 847–860. [Google Scholar] [CrossRef]
- Zhao, X.; Lou, Z.; Chen, C. Multidimensional enhancement of amenity migration well-being: An analysis of the role and strategies of cultural ecosystem services. J. Nat. Conserv. 2025, 84, 126792. [Google Scholar] [CrossRef]
- Gong, J.; Jin, T.; Cao, E.; Wang, S.; Yan, L. Is ecological vulnerability assessment based on the VSD model and AHP-Entropy method useful for loessial forest landscape protection and adaptative management? A case study of Ziwuling Mountain Region, China. Ecol. Indic. 2022, 143, 109379. [Google Scholar] [CrossRef]
- Shen, J.; Li, S.; Wang, H.; Wu, S.; Liang, Z.; Zhang, Y.; Wei, F.; Li, S.; Ma, L.; Wang, Y.; et al. Understanding the spatial relationships and drivers of ecosystem service supply-demand mismatches towards spatially-targeted management of social-ecological system. J. Clean. Prod. 2023, 406, 136882. [Google Scholar] [CrossRef]
- Jiang, S.; Feng, F.; Zhang, X.; Xu, C.; Jia, B.; Lafortezza, R. Driving factors of fragmentation in urban landscapes: Local contributions, spatial relationships, and causal effects. Ecol. Indic. 2025, 174, 113454. [Google Scholar] [CrossRef]
- Fu, B.; Liu, Y.; Zhao, W.; Wu, J. The emerging “pattern-process-service-sustainability” paradigm in landscape ecology. Landsc. Ecol. 2025, 40, 54. [Google Scholar] [CrossRef]
- von Hornstein, F. Theorie und Anwendung der Waldgeschichte. Forstwiss. Cent. 1950, 69, 161–177. [Google Scholar] [CrossRef]
- Winter, S. Forest naturalness assessment as a component of biodiversity monitoring and conservation management. For. Int. J. For. Res. 2012, 85, 293–304. [Google Scholar] [CrossRef]
- Kowarik, I. Urban wilderness: Supply, demand, and access. Urban For. Urban Green. 2018, 29, 336–347. [Google Scholar] [CrossRef]
- Li, J.; Lin, F.; Cui, H.; Yang, S.; Chen, Y. Urban Spatial Naturalness Degree in the Planning of Ultra-High-Density Cities: The Case of Urban Green Open Spaces in Macau. Buildings 2025, 15, 206. [Google Scholar] [CrossRef]
- Liu, M.; Peng, J.; Dong, J.; Jiang, H.; Xu, D.; Meersmans, J. Trade-offs of landscape connectivity between regional and interregional ecological security patterns in a junction area of Beijing-Tianjin-Hebei region. Appl. Geogr. 2024, 167, 103272. [Google Scholar] [CrossRef]
- Hanna, E.; Bruno, D.; Comín, F.A. Evaluating naturalness and functioning of urban green infrastructure. Urban For. Urban Green. 2023, 80, 127825. [Google Scholar] [CrossRef]
- Stahl, A.T.; Fremier, A.K.; Cosens, B.A. Mapping legal authority for terrestrial conservation corridors along streams. Conserv. Biol. 2020, 34, 943–955. [Google Scholar] [CrossRef]
- Laner, P.; Rossi, C.; Luethi, R.; Favilli, F.; Bertoncelj, I.; Plassmann, G.; Haller, R.M. Landscape permeability for ecological connectivity at the macro-regional level: The Continuum Suitability Index and its practical implications. Ecol. Indic. 2024, 164, 112145. [Google Scholar] [CrossRef]
- Li, P.; Liu, C.; Yu, C.; Gao, C.; Sun, W. The delineation and effects of urban development boundaries under ecological constraints: The case of urban Nanjing, China. Ecol. Indic. 2024, 167, 112499. [Google Scholar] [CrossRef]
- Csomós, G.; Szalai, Á.; Farkas, J.Z. A sacrifice for the greater good? On the main drivers of excessive land take and land use change in Hungary. Land Use Policy 2024, 147, 107352. [Google Scholar]
- Pan, J.; Zhao, X.; Guo, W.; Feng, Y.; Liu, Y.; Zhu, J.; Fang, J. Characterizing China’s road network development from a spatial entropy perspective. J. Transp. Geogr. 2024, 116, 103848. [Google Scholar] [CrossRef]
- Barrette, M.; Dumais, D.; Auger, I.; Boucher, Y.; Bouchard, M.; Bouliane, J. Naturalness assessment performed using forestry maps to validate forest management sustainability. Ecol. Indic. 2020, 119, 106832. [Google Scholar] [CrossRef]
- Xia, Z.; Wang, Y.; Lu, Q.; Shen, Z.; Liu, K.; Wei, X.; Yuan, C.; Gao, Y.; Liu, L. Understanding residents’ perspectives on cultural ecosystem service supply, demand and subjective well-being in rapidly urbanizing landscapes: A case study of peri-urban Shanghai. Landsc. Ecol. 2024, 39, 22. [Google Scholar] [CrossRef]
- Hooftman, D.A.P.; Ridding, L.E.; Ridding, L.E.; Willcock, S. National scale mapping of supply and demand for recreational ecosystem services. Ecol. Indic. 2023, 154, 110779. [Google Scholar] [CrossRef]
- Zhang, S.; Zhou, W. Recreational visits to urban parks and factors affecting park visits: Evidence from geotagged social media data. Landsc. Urban Plan. 2018, 180, 27–35. [Google Scholar] [CrossRef]
- Wozniak, M.; Radzimski, A.; Wajchman-Świtalska, S. Is more always better? Evaluating accessibility to parks and forests in 33 European cities using sustainable modes of transportation. Urban For. Urban Green. 2025, 104, 128656. [Google Scholar] [CrossRef]
- Li, M.; Wang, G.; Li, H.; Chen, T.; Tang, S. Identifying the optimization potential for urban GI by linking supply and demand of ecosystem services under multi-scenarios a case study of Tianjin, China. Ecol. Indic. 2023, 154, 110570. [Google Scholar] [CrossRef]
- Tong, A.; Xu, L.; Ma, Q.; Shi, Y.; Feng, M.; Lu, Z.; Wu, Y. Evaluation of the level of park space service based on the residential area demand. Urban For. Urban Green. 2024, 93, 128214. [Google Scholar] [CrossRef]
- Szilassi, P.; Bata, T.; Szabó, S.; Czúcz, B.; Molnár, Z.; Mezősi, G. The link between landscape pattern and vegetation naturalness on a regional scale. Ecol. Indic. 2017, 81, 252–259. [Google Scholar] [CrossRef]
- Zhang, Y.; Zhang, Q. A model approach for post evaluation of adaptive reuse of architectural heritage: A case study of Beijing central axis historical buildings. Herit. Sci. 2023, 11, 57. [Google Scholar] [CrossRef]
- Zheng, S.; Yang, S.; Ma, M.; Dong, J.; Han, B.; Wang, J. Linking cultural ecosystem service and urban ecological-space planning for a sustainable city: Case study of the core areas of Beijing under the context of urban relieving and renewal. Sustain. Cities Soc. 2023, 89, 104292. [Google Scholar] [CrossRef]
- Liu, T.; Yu, L.; Chen, X.; Chen, Y.; Li, X.; Liu, X.; Cao, Y.; Zhang, F.; Zhang, C.; Gong, P. Identifying Potential Urban Greenways by Considering Green Space Exposure Levels and Maximizing Recreational Flows: A Case Study in Beijing’s Built-Up Areas. Land 2024, 13, 1793. [Google Scholar] [CrossRef]
- Qi, T.; Zhang, G.; Wang, Y.; Liu, C.; Li, X. Research on landscape quality of country parks in Beijing as based on visual and audible senses. Urban For. Urban Green. 2017, 26, 124–138. [Google Scholar] [CrossRef]
- Wei, X.; Wu, X.; Wang, D.; Wu, T.; Li, R.; Hu, G.; Zou, D.; Bai, K.; Liu, Y.; Yan, X.; et al. Spatiotemporal changes and management measure to enhance ecosystem services in the Mongolian Plateau. Environ. Dev. 2024, 52, 101103. [Google Scholar] [CrossRef]
- Zhang, L.; Zhang, M.; Wang, Q. Monitoring of subpixel impervious surface dynamics using seasonal time series Landsat 8 OLI imagery. Ecol. Indic. 2023, 154, 110772. [Google Scholar] [CrossRef]
- He, X.; Zhou, Y.; Yuan, X.; Zhu, M. The coordination relationship between urban development and urban life satisfaction in Chinese cities—An empirical analysis based on multi-source data. Cities 2024, 150, 105016. [Google Scholar] [CrossRef]
- Martinez, A.D.L.I.; Labib, S.M. Demystifying normalized difference vegetation index (NDVI) for greenness exposure assessments and policy interventions in urban greening. Environ. Res. 2022, 220, 115155. [Google Scholar] [CrossRef] [PubMed]
- Wu, X.; Pan, J.; Zhu, X. Optimizing the ecological source area identification method and building ecological corridor using a genetic algorithm: A case study in Weihe River Basin, NW China. Ecol. Inform. 2024, 80, 102519. [Google Scholar] [CrossRef]
- Ying, B.; Liu, T.; Ke, L.; Xiong, K.; Li, S.; Sun, R.; Zhu, F. Identifying the Landscape Security Pattern in Karst Rocky Desertification Area Based on Ecosystem Services and Ecological Sensitivity: A Case Study of Guanling County, Guizhou Province. Forests 2023, 14, 613. [Google Scholar] [CrossRef]
- Bhagya, S.B.; Sumi, A.S.; Balaji, S.; Danumah, J.H.; Costache, R.; Rajaneesh, A.; Gokul, A.; Chandrasenan, C.P.; Quevedo, R.P.; Johny, A.; et al. Landslide Susceptibility Assessment of a Part of the Western Ghats (India) Employing the AHP and F-AHP Models and Comparison with Existing Susceptibility Maps. Land 2023, 12, 468. [Google Scholar] [CrossRef]
- Zheng, Y.; Lan, S.; Chen, W.Y.; Chen, X.; Xu, X.; Chen, Y.; Dong, J. Visual sensitivity versus ecological sensitivity: An application of GIS in urban forest park planning. Urban For. Urban Green. 2019, 41, 139–149. [Google Scholar] [CrossRef]
- Kourgialas, N.N.; Ntislidou, C.; Kazila, E.; Filintas, A.; Voreadou, C. An Innovative GIS-Based Policy Approach to Stream Water Quality and Ecological Risk Assessment in Mediterranean Regions: The Case of Crete, Greece. Land 2024, 13, 1801. [Google Scholar] [CrossRef]
- González, Á.N.; Hewitt, R.J.; Vega, J.M. Green Infrastructure Mapping in Almeria Province (Spain) Using Geographical Information Systems and Multi-Criteria Evaluation. Land 2024, 13, 1916. [Google Scholar] [CrossRef]
- GB/T 15772-2008; Comprehensive Control of Soil and Water Conservation–General Rule of Planning. Standards Press of China: Beijing, China, 2008.
- Zhong, J.; Li, Z.; Zhang, D.; Yang, J.; Zhu, J. An evaluation framework for urban ecological compensation priority in China based on meta-analysis and fuzzy comprehensive evaluation. Ecol. Indic. 2024, 158, 111284. [Google Scholar] [CrossRef]
- Wei, Q.; Abudureheman, M.; Halike, A.; Yao, K.; Yao, L.; Tang, H.; Tuheti, B. Temporal and spatial variation analysis of habitat quality on the PLUS-InVEST model for Ebinur Lake Basin, China. Ecol. Indic. 2022, 145, 109632. [Google Scholar] [CrossRef]
- Zhu, C.; Zhang, X.; Zhou, M.; He, S.; Gan, M.; Yang, L.; Wang, K. Impacts of urbanization and landscape pattern on habitat quality using OLS and GWR models in Hangzhou, China. Ecol. Indic. 2020, 117, 106654. [Google Scholar] [CrossRef]
- Liu, J.; Chen, W.; Ding, H.; Liu, Z.; Xu, M.; Singh, R.P.; Liu, C. Changing characteristics of land cover, landscape pattern and ecosystem services in the Bohai Rim region of China. Front. Environ. Sci. 2024, 12, 1500045. [Google Scholar] [CrossRef]
- Liu, Y.; Yao, X.; Tian, Z.; Zhang, Y. Evaluation of the Importance of Ecological Service Function and Analysis of Influencing Factors in the Hexi Corridor from 2000 to 2020. Land 2024, 13, 1283. [Google Scholar] [CrossRef]
- Chen, J.; Xue, J.; Gu, K.; Wang, Y. Balancing urban expansion with ecological integrity: An ESP framework for rapidly urbanizing small and medium-sized cities, with insights from Suizhou, China. Ecol. Inform. 2024, 80, 102508. [Google Scholar]
- Zhang, Q.; Tang, F.; Chen, H.; Li, F.; Chen, Z.; Jiao, Y. Assessing landscape fragmentation and ecological connectivity to support regional spatial planning: A case study of Jiangsu province, China. Ecol. Indic. 2024, 162, 112063. [Google Scholar] [CrossRef]
- Sun, H.; Liu, C.; Wei, J. Identifying Key Sites of Green Infrastructure to Support Ecological Restoration in the Urban Agglomeration. Land 2021, 10, 1196. [Google Scholar] [CrossRef]
- Zhao, J.; Li, Z.; Wu, J.; Xu, Z.; Ja, B. Ecological spatial network optimization of carbon sink patches for enhanced carbon sink in Wuhan Metropolitan Area, China. Ecol. Indic. 2024, 165, 112177. [Google Scholar] [CrossRef]
- Zhang, Y.; Hu, W.; Liu, T.; Liu, F.; Li, S.; Zhang, S. Integrating ecosystem integrity and ES supply–demand process to explore ecological connectivity in Wuhan metropolitan area, China. Ecol. Indic. 2024, 163, 112128. [Google Scholar] [CrossRef]
- Han, P.; Hu, H.; Jiang, M.; Wang, M. Construction of Wetland Ecological Security Pattern in Wuhan Metropolitan Core Area Considering Wetland Ecological Risk. Land 2024, 13, 1407. [Google Scholar] [CrossRef]
- Li, J.; Liang, L.E.; Chao, Y.; Wang, X.; Qiu, M.; Luo, P.; Zhu, Y. Construction of the ecological security pattern of Mu Us sandy land on the basis of the “Source—Resistance—Corridor” theory. Ecol. Indic. 2025, 171, 113162. [Google Scholar] [CrossRef]
- Belote, R.T.; Dietz, M.S.; McRae, B.H.; Theobald, D.M.; McClure, M.L.; Irwin, G.H.; McKinley, P.S.; Gage, J.A.; Aplet, G.H. Identifying Corridors among Large Protected Areas in the United States. PLoS ONE 2016, 11, e0154223. [Google Scholar] [CrossRef] [PubMed]
- Hou, W.; Zhou, W.; Li, J.; Li, C. Simulation of the potential impact of urban expansion on regional ecological corridors: A case study of Taiyuan, China. Sustain. Cities Soc. 2022, 83, 103933. [Google Scholar] [CrossRef]
- Rui, J.; Xu, Y.; Cai, C.; Li, X. Leveraging large language models for tourism research based on 5D framework: A collaborative analysis of tourist sentiments and spatial features. Tour. Manag. 2025, 108, 105115. [Google Scholar] [CrossRef]
- Guo, Y.; Fu, B.; Wang, Y.; Xu, P.; Liu, Q. Identifying spatial mismatches between the supply and demand of recreation services for sustainable urban river management: A case study of Jinjiang River in Chengdu, China. Sustain. Cities Soc. 2022, 77, 103547. [Google Scholar] [CrossRef]
- Pradhan, S.; Lahlou, F.Z.; Ghiat, I.; Bilal, H.; McKay, G.; Al-Ansari, T. A comprehensive decision-making approach for the application of biochar in agriculture to enhance water security: A GIS-AHP based approach. Environ. Technol. Innov. 2024, 36, 103801. [Google Scholar] [CrossRef]
- Xu, L.; Hang, Y.; Jin, F. Evaluating the supply-demand relationship for urban green parks in Beijing from an ecosystem service flow perspective. Urban For. Urban Green. 2023, 85, 127974. [Google Scholar]
- Tang, R.; Hou, G.; Chen, Y.; Liu, X.; Chu, S.; Li, L. Spatial and temporal characteristics and driving mechanisms of recreational ecosystem services supply-demand mismatch in rapidly urbanizing areas: Evidence from the Yangtze River Delta. Ecol. Indic. 2025, 171, 113153. [Google Scholar] [CrossRef]
- Ford, A.T.; Sunter, E.J.; Fauvelle, C.; Bradshaw, J.L.; Ford, B.; Hutchen, J.; Phillipow, N.; Teichman, K.J. Effective corridor width: Linking the spatial ecology of wildlife with land use policy. Eur. J. Wildl. Res. 2020, 66, 69. [Google Scholar] [CrossRef]
- Rui, J.; Li, X. Decoding vibrant neighborhoods: Disparities between formal neighborhoods and urban villages in eye-level perceptions and physical environment. Sustain. Cities Soc. 2024, 101, 105122. [Google Scholar] [CrossRef]
- Kaskevich, V.; Villoslada, M.; Ward, R.D.; Sepp, K. Analyzing the structural elements, ecological characteristics, and impact assessment of local green infrastructure in the coastal zone of Estonia. Ecol. Indic. 2024, 169, 112824. [Google Scholar] [CrossRef]
- Hwang, B.; Ko, C.; Im, D.; Kang, W. Network-based assessment of urban forest and green space accessibility in six major cities: London, New York, Paris, Tokyo, Seoul, and Beijing. Urban For. Urban Green. 2025, 107, 128781. [Google Scholar] [CrossRef]
- Zhao, S.; Shao, Q.; Zhou, X. Greenbelt investment with temporal preference in uncertain environments. Sustain. Cities Soc. 2023, 96, 104675. [Google Scholar] [CrossRef]
- Nie, H.; Zhao, Y.; Zhu, J.; Ning, A.; Zheng, W. Ecological Security Pattern Construction in Typical Oasis Area Based on Ant Colony Optimization: A Case Study in Yili River Valley, China. Ecol. Indic. 2024, 169, 112770. [Google Scholar] [CrossRef]
- Jia, C.; Wu, L.; Ma, L.; Qiu, W. The moderating influence of safety on green space’s health benefits in Chinese urban communities. J. Environ. Manag. 2025, 375, 124232. [Google Scholar] [CrossRef]
- Yang, J.; Guo, R.; Li, D.; Wang, X.; Li, F. Interval-thresholding effect of cooling and recreational services of urban parks in metropolises. Sustain. Cities Soc. 2022, 79, 103684. [Google Scholar] [CrossRef]
- Lin, P.; Lau, S.S.Y.; Qin, H.; Gou, Z. Effects of urban planning indicators on urban heat island: A case study of pocket parks in high-rise high-density environment. Landsc. Urban Plan. 2017, 168, 48–60. [Google Scholar] [CrossRef]
- Campbell-Arvai, V.; Lindquist, M. From the ground up: Using structured community engagement to identify objectives for urban green infrastructure planning. Urban For. Urban Green. 2021, 59, 127013. [Google Scholar] [CrossRef]
- Pille, L.; Säumel, I. The water-sensitive city meets biodiversity: Habitat services of rain water management measures in highly urbanized landscapes. Ecol. Soc. 2021, 26, 23. [Google Scholar] [CrossRef]
Disclaimer/Publisher’s Note: The statements, opinions and data contained in all publications are solely those of the individual author(s) and contributor(s) and not of MDPI and/or the editor(s). MDPI and/or the editor(s) disclaim responsibility for any injury to people or property resulting from any ideas, methods, instructions or products referred to in the content. |
© 2025 by the authors. Licensee MDPI, Basel, Switzerland. This article is an open access article distributed under the terms and conditions of the Creative Commons Attribution (CC BY) license (https://creativecommons.org/licenses/by/4.0/).