Article

Urban Spatial Blessing: Effect of Land Use Intensity on Human Development Index

1
School of Public Administration, Central China Normal University, Wuhan 430079, China
2
School of Physical Education, China University of Geosciences, Wuhan 430074, China
3
School of Economics and Business Administration, Central China Normal University, Wuhan 430079, China
*
Author to whom correspondence should be addressed.
Land 2025, 14(5), 1085; https://doi.org/10.3390/land14051085
Submission received: 5 April 2025 / Revised: 6 May 2025 / Accepted: 14 May 2025 / Published: 16 May 2025
(This article belongs to the Section Land Use, Impact Assessment and Sustainability)

Abstract

:
Urban land use is characterized by pronounced externalities. In most developing countries, economic welfare considerations drive the changes in land use intensity, leading to the spatial reallocation of resources and thereby affecting the enhancement of urban welfare. This study combined multi-source data to construct a panel dataset of 284 prefectural-level and above cities in China from 2011 to 2022, and employed the spatial Durbin model, spatial heterogeneity model, and spatial mechanism model to systematically analyze the spatial spillover effects of urban land use intensity (ULUI) on urban welfare (Human Development Index, HDI), its heterogeneity, and the underlying influencing mechanisms. The study concluded that: (i) Both HDI and ULUI have shown certain improvement despite some distinct regional heterogeneity; (ii) ULUI significantly contributes to local urban welfare, yet exerts a negative spatial spillover effect on neighboring cities, and the effective boundary of this spillover effect is 400 km. (iii) Spatial spillover heterogeneity analysis revealed that the spillover effect of ULUI on HDI is negative for non-eastern and non-megacities, whereas it is positive for eastern and megacities, though the estimated coefficients are relatively small. (iv) In terms of the spatial influencing mechanism, industrial rationalization, industrial advancement, and economic agglomeration in the market dimension, as well as expenditure scaling, expenditure structuring, and public serviceability in the non-market dimension, are essential channels for ULUI to affect the HDI of both local and neighboring cities. The results indicate that the current “land-based” land use is not conducive to the enhancement of regional welfare, and there is an urgent need for better understanding the principles of factor allocation and agglomeration, establishing cross-regional synergistic mechanisms, and fully leveraging the comparative advantages of geographic conditions and scale effects across different cities, so as to improve the urban space welfare.

1. Introduction

With the development of modern cities, there is a prevailing tendency of converting large amounts of natural, open, or agricultural land into human-dominated construction land [1], and the urbanization of land is progressing at a significantly faster rate than that of the population in most countries and regions worldwide [2]. During this process, particularly in developing countries, the challenges for urban development arising from the rapid urbanization of land oriented towards economic well-being have become increasingly prominent. Although intense land use can foster economic growth and improve living conditions in the short term, it can also generate a range of long-term negative externalities, including traffic congestion, resource scarcity, inequality, the “heat island” effect, and urban air quality deterioration [3], all of which pose potential threats to urban welfare. Therefore, it is crucial to develop effective land use strategies and public welfare policies to balance urban land demands with sustainable development.
Land use intensity is a spatial mapping of urbanization levels, integrating urban development strategies and land use levels. Previous studies exploring the impact of land use on economic activities, ecological well-being, and residents’ health [4], as well as human capital [5], have provided empirical support for understanding the relationship between land use intensity and urban welfare changes. However, land use is not only a decision-making process that combines top-down governance with bottom-up actions but also a spatial process involving high concentration and frequent interaction of various production factors within a city. This inevitably imparts a significant “spatial” characteristic to the policy effect of land use. Specifically, the externality generated due to the increase in land use intensity typically arises from the horizontal expansion and vertical growth of cities [6]. This is not only the result of the combined influence of multiple local urban socio-economics, natural geography, and cultural factors but also determined by the spatial spillover effects of the spatial interactions between cities [7]. These spatial spillover effects may vary across different spatial environments and scales. If these spillover (heterogeneity) effects are not considered, it is possible to misestimate the impact of land use intensity on spatial welfare. Recent research has started to focus on the role of spatial factors in enhancing urban economic and ecological welfare [8]. However, the spatial spillover (heterogeneity) effects of land use intensity on the comprehensive welfare of urban space and the underlying mechanisms remain to be explored at the urban scale. To address these gaps, this study adopts the perspective of “spatial welfare” and systematically examines both the spatial welfare effects and mechanisms of urban land use intensity from the theoretical and empirical levels.
The current characteristics of land use and related public policies in China provide an excellent opportunity to explore and verify the relationship between land use and spatial welfare. First, there is a significant heterogeneity in regional resource endowments. Eastern cities and megacities are recognized as regions with higher development levels, while central and western China, as well as small and medium-sized cities, relatively lag behind in development. The heterogeneous spatial environment and scale effects play a crucial role in improving China’s overall urban spatial welfare. Second, there is an interaction among the externalities’ public welfare policies. There is a spatial mismatch of land factors arising from the tendentious allocation of construction land indices in China. Local protectionism has been intensified due to the poor factor mobility and spatially imbalanced development under the traditional household registration system and the economic competition under the decentralized system. The spatial discrepancy between the enhancement of land use intensity and the improvement of urban spatial welfare arises from distinct factor allocation patterns and unique characteristics of the land market. Thirdly, China’s unique land use practices are shaped by the dual pressures of political promotion and economic performance [9], among other factors. Although the early reform period has brought about rapid economic development and urbanization, some policy distortions and effects have caused negative externalities that may exacerbate the long-term loss of urban spatial welfare, such as the loss of economic growth and efficiency under market segmentation, the lack of interconnection of infrastructure between regions, and the difficulty in sustainable development of regional ecosystems. Specifically, China’s construction land area generally shows a continuous expansion trend. In 2022, the urban construction land area of the three major urban agglomerations accounted for 22.18% of the national total, and shows a slight increase compared with that in 2000 (21.08%) and 2011 (22.15%). During the period of 2000–2022, the spatial distribution of construction land continued to show a typical and persistent “center-periphery” trend (Figure 1).
Thus, it is essential to elucidate whether land use intensity in China at this stage enhances urban spatial welfare, whether it has certain spatial spillover (heterogeneity) characteristics, and what the channels are for it to contribute to urban welfare. Answering these questions not only involves correct interpretation of China’s regional factor allocation and agglomeration patterns in the future but also can offer rational policy guidance for sustainable urban development. Moreover, it can provide valuable insights into the interactive development and relative balance between regions in developing countries.
Specifically, the marginal contributions of this paper can be summarized into three main aspects. First, by integrating multi-source geospatial data, it comprehensively measures urban land use intensity across construction density, economic density, and facility density, which can effectively mitigate the endogeneity and covariance issues inherent in multi-indicator measurements, thereby more accurately capturing the spatial and temporal characteristics of urban land use intensity [11]. Second, the use of the official Human Development Index (HDI) to characterize the welfare levels in Chinese cities provides a more comprehensive and multidimensional perspective of “human well-being” at the urban scale, further advancing the “people-centered” model of urban development. Third, drawing on China’s reform and development experience, this study utilizes a panel dataset of 284 prefecture-level and above cities from 2011 to 2022, focusing on the spatial spillover (heterogeneity) effects of land use intensity on urban welfare. This study for the first time examines the spatial impact mechanisms through market-based channels (structuring and agglomeration) and non-market-based channels (supporting and serviceability), which can fully account for spatial multi-factor interactions and externality constraints, providing systematic logical support and empirical evidence for regional policy implementation and reform.
This paper is organized as follows. The second chapter provides a literature review of related fields and a normative analysis of the spatial welfare effects of urban land use intensity; the third chapter describes the empirical strategy and the data sample; the fourth chapter analyzes the results of the empirical tests; and the final chapter is the discussion and conclusions.

2. Literature Review, Theoretical Analysis, and Research Hypotheses

2.1. Literature Review

Research on urban development has been traditionally focused on economic welfare. Since Pigou introduced the concept of “welfare” into economics, a growing body of literature has confirmed that economic development, often measured by GDP growth and related indicators, directly contributes to the improvement in life quality and overall welfare [12]. While income increases may be achieved in a relatively short period, urban welfare improvement cannot be accomplished in a short time. Costanza et al. argued that Gross Domestic Product (GDP) is merely a monetary indicator of production levels and should not be viewed as an end in itself; instead, it should serve as a means to improve living standards as well as a necessary condition for the advancement of urban welfare [13]. In other words, GDP alone is far from sufficient to fully explain the long-term, holistic, and multidimensional development process of a country or region, and also cannot capture the broader goal of maximizing the well-being of its population. Particularly in developing countries, urban development strategies that prioritize high rates of economic growth at the expense of other critical factors may turn out to be short sighted. As a result, modern urban economics no longer views economic growth as the sole determinant of urban development, and development measures must encompass broader dimensions of human well-being [14].
Due to the above reasons, several alternatives for measuring urban development from this perspective have emerged. The first category includes GDP and its related indicators, such as the Index of Sustainable Economic Welfare (ISEW) and the Genuine Progress Indicator (GPI), which are, in essence, market-based welfare measures [15]. The second category consists of composite welfare indices that encompass a broad range of factors influencing welfare. However, these indices tend to be highly subjective, suffer from issues related to data completeness and availability [16], and are often overly aggregated, making them difficult to operationalize at the regional level. In contrast, HDI, which was introduced by the United Nations Development Programme (UNDP) in 1990 and grounded in Amartya Sen’s capability approach to welfare measurement, can serve as a more representative alternative. Specifically, the official HDI comprises three sub-indices, including the health index (representing a long and healthy life), education index (indicating access to knowledge), and income index (reflecting a decent standard of living). These indices together capture the core dimensions of urban welfare, including both economic welfare based on national income and non-economic welfare derived from social choices [17]. Despite some criticisms regarding the selection of variables and aggregation methods, such as those by Sagar and Najam, who argued that HDI overlooks environmental aspects of development and only focuses on average achievements rather than the distribution of human development within a country [18], the initial motivation for the creation of HDI was to shift the development discourse from an economic-centric perspective to a more holistic “human development” perspective. This shift is exactly aligned with the core concept of urban spatial welfare, which highlights the enhancement of city sustainability through the interactive evolution of ordered spaces (natural, economic, and cultural) while ensuring basic safety and livelihoods [19]. Given the typicality of its core indicators and the simplicity of its calculation, HDI has emerged as a prominent measure for assessing the level of development and welfare in a country or region [20].
An increasing body of research has underscored the intricate relationship between urban welfare and land use. It has been highlighted that land use aligns synergistically with several Sustainable Development Goals (SDGs), including quality education, good health and well-being, poverty eradication, sustainable cities and communities, and inequality reduction [21]. With rapid urbanization, the increasing demand for and extensive utilization of peripheral land often result in elevated land use intensity, which is characterized by more concentrated land use and higher development levels. However, there have been increasingly pronounced conflicts between intensive land use and urban growth, which may exacerbate social inequalities and large-scale environmental pollution, ultimately threatening the sustainability of urban welfare.
It remains a pertinent and critical question how land use intensity affects the enhancement of urban welfare. Previous research has offered insights predominantly from unidimensional perspectives of economic, environmental, and social welfare associated with land use. Firstly, some studies have directly examined the economic welfare effects of urban land use. As both a spatial platform for socio-economic activities and a critical instrument for local governments in urban management and economic development [22], increasing land use intensity can enhance economic growth. This growth exhibits significant heterogeneity in marginal elasticity, thereby enabling the provision of improved public services to the residents.
Secondly, the global urbanization process has been significantly accelerated, with diversified and complex transfer trajectories between different land use types [23,24], which have not only reshaped the spatial structure of cities but also exerted far-reaching impacts on the ecological environment and health and well-being. Particularly in urban areas, transformation of a large amount of natural land cover into impervious built-up land has been recognized as an important cause of biodiversity loss, the heat island effect, and climate warming, which weakens the carbon sink function of ecosystems and threatens sustainable urban development [25]. Further, land use intensity plays a significant role in shaping the built environment. Through the housing market and urban planning, land use exerts great influence on the quality of the urban natural environment, the physical activity levels of residents, and their social interactions, providing direct implications for both ecological conditions and public health. Saelens et al. demonstrated that residents in neighborhoods characterized by higher levels of mixed land use, walkability, and other related factors tend to exhibit greater physical activity, lower disease incidence, reduced physical and mental stress, and improved overall health [26]. However, rapid changes in natural capital can hinder a city’s ability to enhance welfare. For instance, Ebisu et al. found that higher land use intensity in urban areas impedes the dispersion of gases and particulate matter, increasing the likelihood of asthma, which negatively affects the residents’ health [4].
Furthermore, the enhancement of land use intensity is closely related to social welfare outcomes, such as the equitable distribution of educational resources and improvement in education quality. At the macro level, increased land use intensity is often associated with the concentration of educational resources, adjustment of educational expenditures, and regulation of land market prices, all of which influence both the quantity and quality of education within a region. At the micro level, educational progress is not immediate [27] but rather occurs through the accumulation of human capital over time. For example, land reform can have a significant impact on educational outcomes. Exposure to China’s family responsibility reform during childhood or adolescence increases parents’ investment in their children’s education. This in turn influences income, wealth, and human capital, which affects family education expenditures alongside improvements in public goods resulting from land reform [28]. These changes have long-term effects on human capital development and then on the labor market [5].
Although the above studies have revealed the impact paths of land use on urban economic output, the ecological environment, and social welfare, the fragmentation of analytical perspectives and lack of spatial dimensions have made it difficult to reveal the systematic and regional interaction mechanisms of welfare formation. For one thing, a single-dimension explanation apparently cannot fully explain the relationship between land use intensity and urban welfare. There is a lack of a theoretical framework that integrates multidimensional urban well-being into a holistic system of well-being and ignorance of the interdependence and synergies between different dimensions, which can lead to an “illusion” of policy governance, inducing governments and urban planners to make suboptimal decisions, thereby exacerbating inequality and constraining urban development potential. In their study of Pakistan, a developing economy, Birdsall and Londono highlighted that land distribution is not merely a matter of resource allocation but also a reflection of the distribution of political power within a province [29]. They found that high inequality in landholdings significantly hampers economic growth and development.
For another thing, the spillover effects of land use intensity and the mechanisms driving these effects are more profound factors influencing the changes in welfare. Urban land use intensity essentially represents the outcomes of land allocation and utilization, and can comprehensively reflect the disparities in urban land use policies. It exhibits pronounced externalities and regional heterogeneity. Its impact on urban spatial welfare is not limited to the local area but may also spread among neighboring cities through population flows, industrial transfers, and resource allocation, forming a complex spatial spillover effect [30]. Neglecting the spatial information within and between cities when examining the impact of land use intensity on urban welfare may lead to biased measurement results. Notably, the higher incomes resulting from increased land use intensity do not necessarily mean enhanced quality of life or improved urban welfare. Recent studies have increasingly recognized the importance of spatial factors in urban development [8]. For instance, Fan et al. examined the urban redevelopment and land use in Hong Kong, demonstrating that land use changes generate significant positive spillover effects on local housing prices [31]. And the magnitude of the spillover effect diminishes with the proceeding of redevelopment projects. The direction and extent of these externalities are determined by the trade-off between changes in local amenities and the level of competitiveness of the local housing market. However, it remains to delve into its linkage mechanism on the overall pattern of urban welfare and welfare disparities. Existing research has not provided robust empirical evidence regarding whether and how land use intensity contributes to urban spatial welfare, particularly with respect to its heterogeneity and its operation mechanisms. There is an urgent need to introduce a spatial perspective under the comprehensive welfare assessment framework to identify the spatial externality of land use intensity on urban welfare and its action paths, and then provide a more precise theoretical support and empirical evidence basis for urban spatial optimization and equitable governance.

2.2. Spatial Spillover Effect of Land Use Intensity on Urban Welfare

2.2.1. Local Facilitation Effects of Land Use Intensity

Land is a “spatial” carrier of urban welfare, and its use intensity has direct implications for local welfare. From the income perspective, increased land use intensity is typically correlated with the agglomeration of production factors, which will foster a “labor pool” effect and generate economies of scale. These effects not only promote employment and raise the residents’ income levels [32] but also directly stimulate economic growth. Additionally, rationally planned land use, particularly in commercial, industrial, and service sectors, can significantly enhance land value, which can provide more benefits to landowners and investors and further improve property incomes. From the perspective of health care, moderate land use intensity can optimize the spatial distribution of medical facilities, increase green space, and enhance the accessibility and equity of public services, thereby fostering a better community interaction environment [26], and contributing to improved public health outcomes. From the perspective of education, optimal land use intensity ensures adequate space for educational infrastructure and supports substantial educational investments [28], which also influences household education expenditure and human capital investment [33], thereby improving the overall educational level of the city. Based on these considerations, this paper posits the following research hypothesis.
H1: 
Land use intensity positively influences urban welfare (HDI) within the region.

2.2.2. Spatial Spillover Effects of Land Use Intensity

The influence of land use intensity on neighboring cities primarily stems from economic, environmental, and social spillovers.
First, the economic spillover effect entails the ripple or diffusion of economic growth and employment opportunities. Based on the theory of cumulative causation and the core–periphery model, high-intensity land use is typically concentrated in core cities, where capital, labor, and technology tend to agglomerate. This spatial concentration drives local economic growth but may simultaneously trigger a siphoning effect on adjacent, less-developed cities, which is characterized by the outflow of human and material resources, thereby weakening their development capacity and producing negative spatial feedback. However, when core cities are faced with resource constraints, environmental pressures, or diminishing marginal returns to production factors, certain industries and populations may spill over into neighboring regions, resulting in a diffusion effect that promotes coordinated regional development.
Second, the environmental spillover effect is associated with environmental impacts and ecological balance. The negative environmental externalities of land development are primarily attributed to the expansion of construction land [30], which often leads to increases in impervious surfaces [34] and vegetation fragmentation. These changes tend to have cross-regional transmissibility, which may cause ecological degradation in adjacent areas. According to the “ecological footprint” theory, intensive development may overdraw natural capital, inducing the spreading of ecological risks within urban agglomerations [35]. Nonetheless, under effective governance mechanisms, inter-regional cooperation through ecological compensation and joint environmental governance can yield positive environmental spillover effects, thereby contributing to ecological equilibrium at a regional scale.
Third, the social spillover effect refers to the pressure or optimization in infrastructure and public services. On the one hand, high-intensity land use is often accompanied by prioritized provision of infrastructure and public services, exacerbating intercity inequalities and producing welfare “crowding out” or “substitution” effects on surrounding cities. On the other hand, if cities are well connected or share service mechanisms, improvement in public services such as education and healthcare in the core city can exert radiation and driving effects on neighboring areas, ultimately enhancing overall regional welfare.
These observations suggest that the spatial spillover of land use intensity is not unidirectional; rather, it is jointly conditioned by factors such as geographic location and urban hierarchy. Therefore, the spatial welfare outcomes may follow two contrasting mechanisms. The positive pathway entails synergistic governance and shared resource construction that improve the well-being of neighboring cities, a phenomenon akin to “living in harmony with neighbors”. Conversely, under regional imbalance, institutional fragmentation, or dominance of a strong core and weak periphery, increasing land use intensity may amplify factor concentration and ecological degradation, leading to a “beggar-thy-neighbor” pattern of negative spillovers.
In addition, according to Tobler’s First Law of Geography, spatial spillovers are subjected to constraint by distance decay, and regions located beyond the effective radiation range of the core city are unlikely to benefit from its land use externalities [36]. Specifically, with increasing distance from the core, policy coordination will be weakened, and the timeliness and accuracy of cross-boundary land monitoring will decline, resulting in pronounced geographical attenuation in the welfare spillovers of land use intensity. Moreover, GDP-oriented performance evaluation systems and fiscal dependence on land revenue tend to reinforce localized development preference, further entrenching the spatial locking effect in land use governance. Under the current land management framework, local governments often impose differentiated land supply conditions or raise barriers to inter-jurisdictional land transfers, leading to higher institutional costs for regional factor optimization and impeding the diffusion of land-intensive use practices, technologies, and management models across administrative boundaries. As a result, these dynamics shape the spatial boundaries of land use intensity spillovers.
Based on the above analysis, this study proposes the following research hypothesis:
H2a: 
Land use intensity exerts a significant spatial spillover effect on the urban welfare (HDI) of neighboring regions.
H2b: 
Such spillover exhibits a geographically bounded pattern characterized by distance-based attenuation.

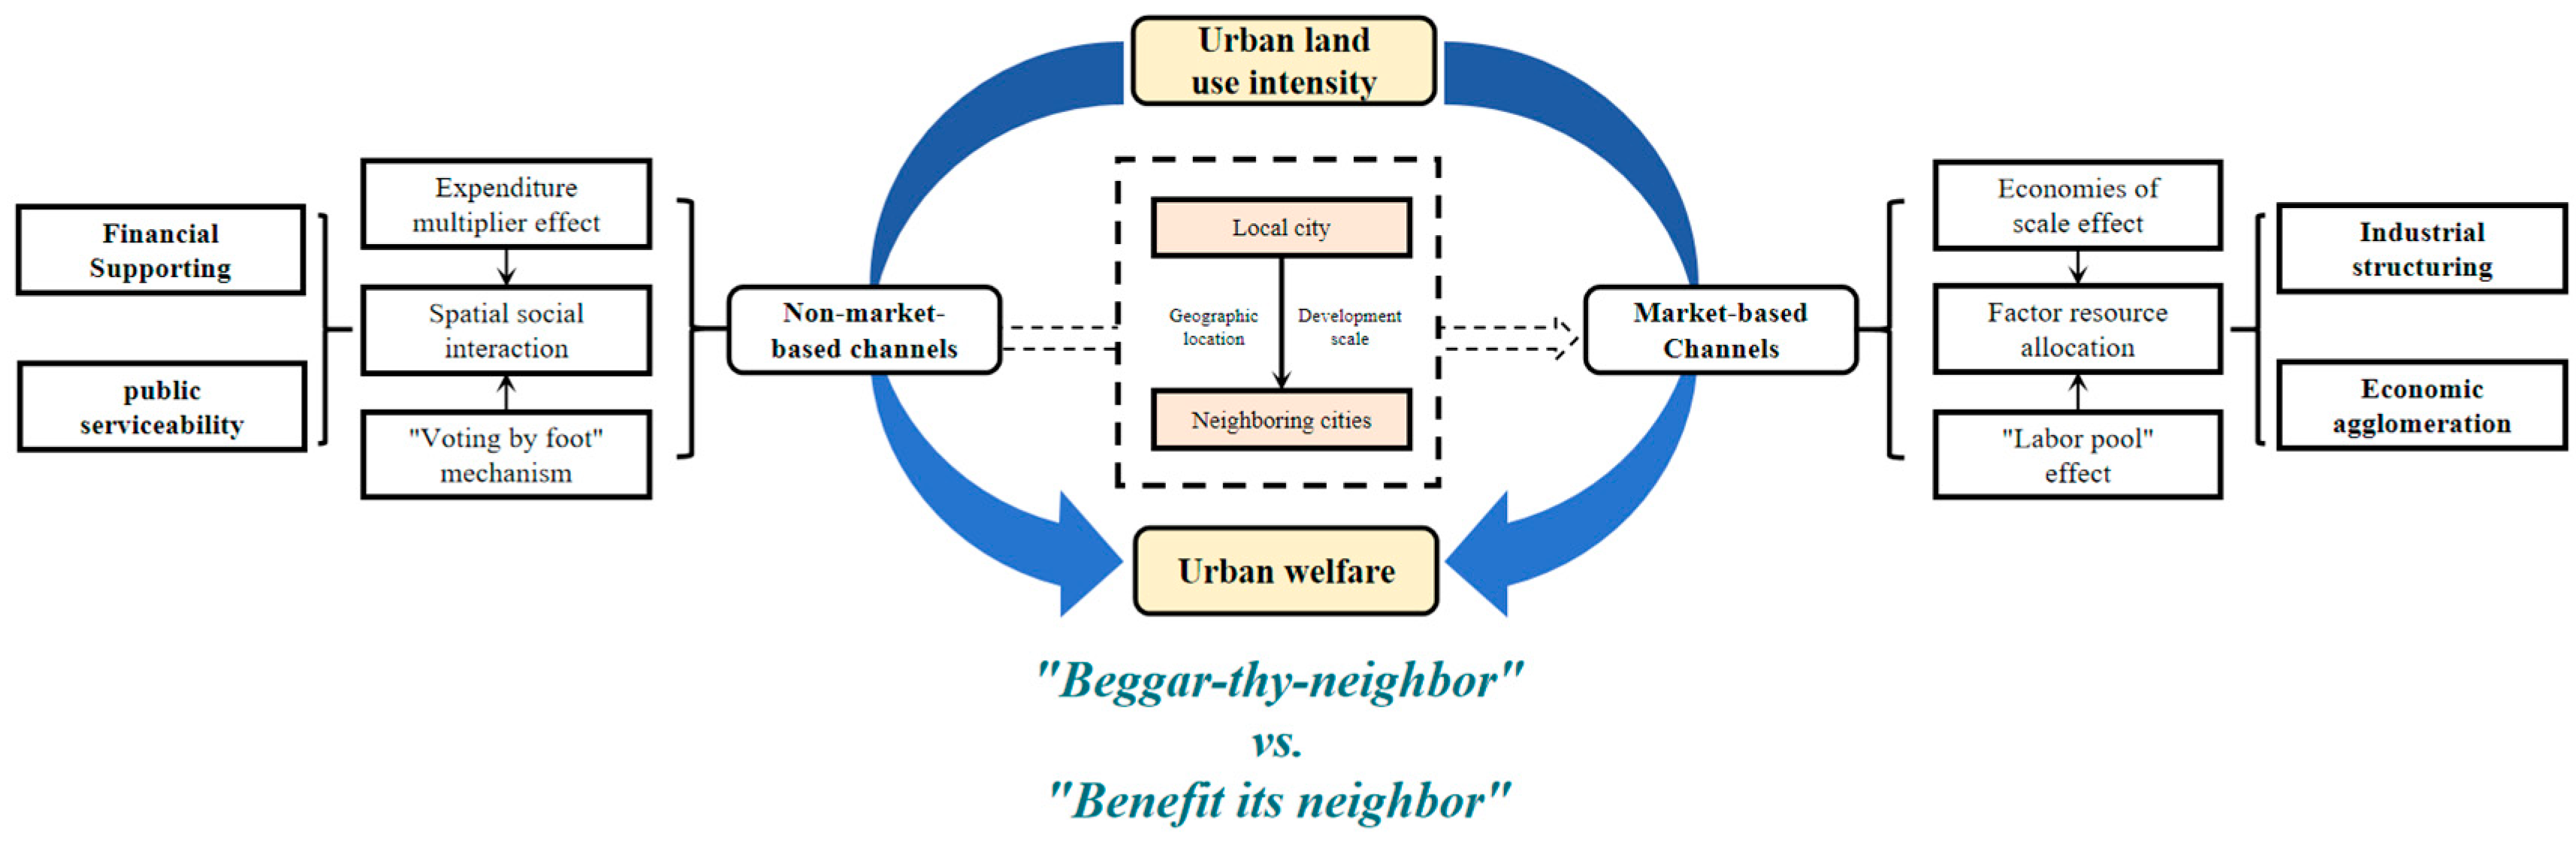
2.3. Spatial Impact Mechanisms of Land Use Intensity on Urban Welfare

From the perspectives of urban economic geography and land resource allocation theory, this study constructs a theoretical analytical framework under the “resource-welfare” mechanism, based on the functional connotation of land use intensity, namely “(policy regulation capacity + space) × resource allocation capacity = urban welfare enhancement capacity” (Figure 2). Different from previous studies focusing on a single mechanism, this research, grounded on China’s dual system of “market mechanisms and government regulation”, emphasizes both spatial and institutional dimensions. Specifically, it considers the overall urban welfare at the spatial scale and incorporates both market-based channels (structuring and agglomeration) and non-market channels (supporting and serviceability) through which land use intensity reshapes the inter-industry and spatial distribution of resources, thereby influencing urban welfare. This allows comprehensive exploration of the coordinated pathway between efficiency-driven “market efficiency mechanisms” and equity-oriented “institutional safeguard mechanisms”.

2.3.1. Market-Based Channels: Industrial Structuring and Economic Agglomeration

Land use intensity can affect the level of urban welfare through industrial structure optimization and economic factor agglomeration. (i) Optimization of industrial structure. Optimization of industrial structure includes rationalization of industrial structure and advancing industrial structure. Rationalization of industrial structure is reflected in the degree of coordination among industries and the improvement of resource utilization efficiency; advancing industrial structure refers to the transformation process of industrial structure from low-level forms to high-level forms. According to the law of diminishing marginal returns, increasing land use intensity can facilitate the migration of production factors (such as labor, capital, technology, and information) both within and across industries, thereby altering the relative significance of the three major industrial sectors [37]. This process improves resource allocation efficiency and the quality of industrial aggregation through the interactive and synergistic development of different sectors (industrial rationalization). Furthermore, it promotes the transition of the industrial structure from low-energy to high-energy sectors (industrial advancement), thereby enhancing the region’s innovation capacity and service capabilities. The resulting “structural dividend” not only enhances the welfare level in the local urban area but also exerts a positive impact on neighboring regions. (ii) Economic factor agglomeration. Increased land use intensity can attract various production factors and foster the agglomeration of diverse economic activities, particularly by exerting a strong attraction on labor and capital [33]. This process not only contributes to the growth of total employment but also generates economies of scale and promotes broader social development. Moreover, due to geographic proximity or economic linkages, these effects will extend beyond the immediate area, creating spillover effects on surrounding regions. In this light, the following hypothesis is proposed.
H3a: 
Land use intensity can affect urban welfare (HDI) through three market-based channels, including industrial structure optimization (industrial rationalization and industrial advancement) and economic factor agglomeration (economic agglomeration).

2.3.2. Non-Market-Based Channels: Financial Supporting and Public Serviceability

Land use intensity can promote the reallocation of social resources, exert the multiplier effect of public financial expenditures, and promote the equalization of basic public services, thus significantly contributing to the enhancement of urban welfare. (i) Public fiscal expenditures. Public fiscal expenditures include two dimensions: the scale and structure of fiscal expenditures. Firstly, areas with higher land use intensities usually have higher densities of economic activities and tax revenues, endowing more financial resources to the government to provide more public products with positive externalities, which directly enhance the quality and coverage of urban public services, and thus improving the overall welfare level of the residents. Secondly, increased land use intensity stimulates the growing demand for public services and goods, prompting the government to invest in various infrastructures such as public services, scientific and technological research and development, education, healthcare, and other high-quality public services. The optimization of fiscal expenditure structure contributes to economic development through the expenditure multiplier effect and mitigates the congestion effects associated with the excessively rapid rise in land use intensity [38], thereby enhancing urban welfare. Additionally, the demonstration effect of basic public services plays a critical role. If local public services are inferior to those of neighboring regions, the mechanism of “voting with feet” may come into play, whereby the labor force is relocated to areas with better public services. This migration can harm the local economy and reduce tax revenue. In response, local governments are compelled to enhance the quality of public services to retain residents and promote urban welfare. (ii) Public service provision. Aside from the traditional “voting with feet” mechanism, increased public spending can foster urban vitality, thereby improving urban welfare. From the perspective of urban planning, the shaping of the urban form by the government (such as functional mixtures, density of road networks, and public spaces) invariably enhances the “spatial social interactions” of the elements, which in turn results in a greater variety of social needs (diversity) and public services at hand (accessibility). Empirical studies have also revealed that the built environment not only has a very significant positive impact on social welfare but also enhances the public’s trust in the government, which is conducive to the improvement of governance [39]. These are important indicators of the improvement of welfare in the process of sustainable urban development. On this basis, the following hypothesis can be proposed.
H3b: 
Land use intensity can affect urban welfare (HDI) through three non-market channels, including public financial support (expenditure scaling and expenditure structuring) and public service provision (public serviceability).

3. Methods and Data

3.1. Setting of Econometric Model

3.1.1. Spatial Durbin Model

As discussed above, urban land use intensity based on the allocation of land elements has strong externalities, which impose impacts on the welfare of the area and the surrounding areas. Furthermore, the more “spatially proximate” an area is, the more significant the effect will be. Obviously, ignoring this inherent spatial spillover effect may lead to biased empirical results. This spatial correlation may stem from both the explanatory variables themselves and the explanatory variables and error terms. The spatial Durbin model (SDM) can precisely reflect the spatial correlation of different sources, and can also be transformed into the common spatial lag model and spatial error model under different coefficient setting conditions. Therefore, we verify the spatial spillover effect of land use intensity on urban welfare by constructing an SDM of Equation (1):
H D I i t = α 1 + ρ 1 W H D I j t + β 1 U L U I i t + δ 1 W U L U I j t + λ 1 C o n t r o l s i t + λ 2 W C o n t r o l s j t + ε i t
In the equation, subscripts i and j stand for cities; t stands for year; α1 and εit are constant term and random error term, respectively; HDI is the explanatory variable, representing urban welfare at the macro level; ULUI is the urban land use intensity, the core explanatory variable of the paper; Controls are other control variables; W is a non-negative spatial weight matrix, and in order not to lose the generality, we adopt the geographic adjacency matrix based on queen’s law, i.e., wij = 1 when the two regions are geographically adjacent, otherwise wij = 0; ρ1 is the spatial autoregressive coefficient; and β1 and δ1 are the coefficients to be estimated for the core explanatory variables. The estimates are further decomposed using the partial differential form, which yields direct effects to indicate the impact of the explanatory variables on the region and indirect effects to indicate the impact on neighboring regions, i.e., “spatial spillovers” [40].

3.1.2. Spatial Heterogeneity Model

Theoretical analyses show that both urban geography and the scale of development play a role in land use intensity and thus have an impact on urban welfare. Hence, this paper incorporates the interaction term (ULUIit × Pit) between city-level characteristic variables and land use intensity on the basis of the baseline regression model (1). Specifically, the regression model is shown below:
H D I i t = α 2 + ρ 2 W H D I j t + β 2 U L U I i t + δ 2 W U L U I j t + β 3 P i t U L U I i t + δ 3 W P j t U L U I j t + λ 3 C o n t r o l s i t + λ 4 W C o n t r o l s j t + ε i t
In the equation, Pit represents the characteristic variables of city i, including the longitude of the city and the population size of the city in turn; δ2 and δ3 are the coefficients to be estimated; and the rest of the model has the same meaning as that of the baseline regression model as follows.

3.1.3. Spatial Mechanism Model

In the previous section, the transmission mechanism for land use intensity to affect urban welfare has been theoretically analyzed from both market and non-market dimensions. In order to test the hypothesis, the mechanism model including spatial factors is constructed as follows in reference to Jiang [41]:
M i t = α 3 + ρ 3 W M j t + β 4 U L U I i t + δ 4 W U L U I j t + λ 5 C o n t r o l s i t + λ 6 W C o n t r o l s j t + ε i t
In this equation, we replace HDIit in Equation (1) with the channel variable Mit, which denotes the outcome of the mechanism of city i at time t, where M is, in order, industrial rationalization, industrial advancement, and economic agglomeration in the marketization dimension, and expenditure scaling, expenditure structuring, and public serviceability in the non-marketization dimension, and β4 and δ4 are the coefficients to be estimated.

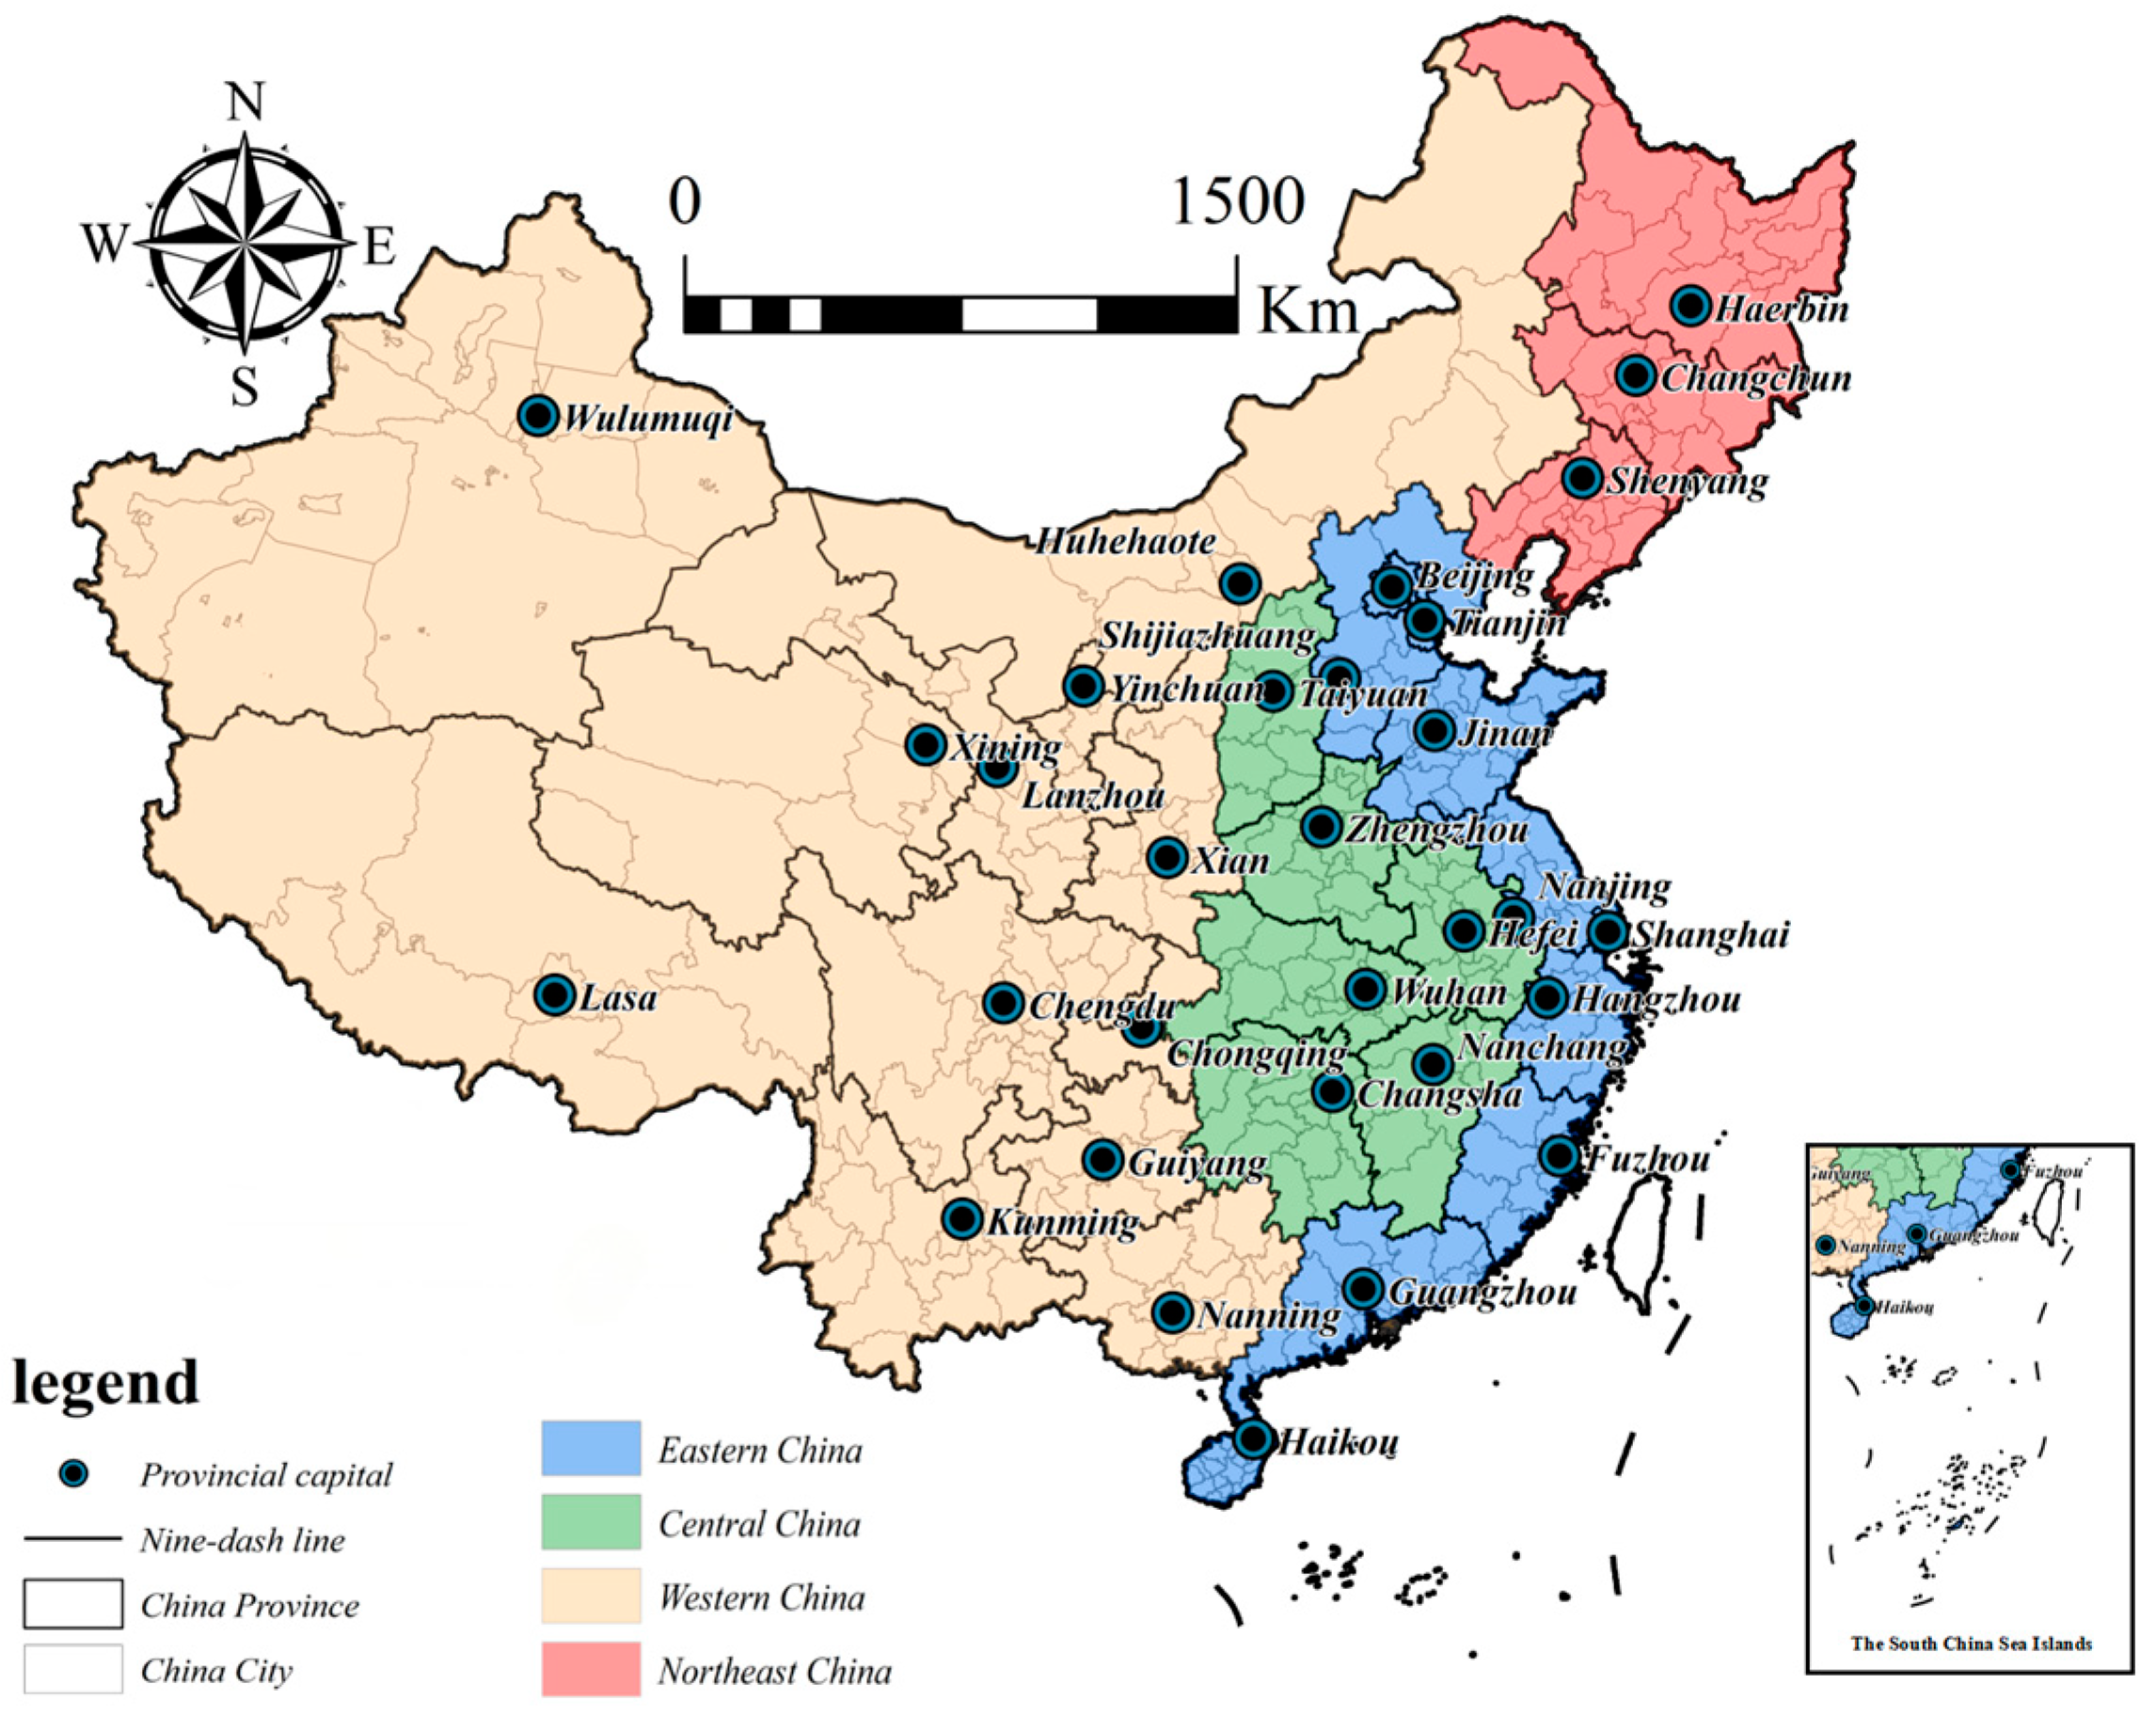
3.2. Variables and Data Sources

3.2.1. Explained Variable

The explained variable is the level of urban welfare characterized by HDI. In conjunction with the official HDI proposed by UNDP, we mainly use four important variables to construct three secondary indicators, including Life Expectancy Index (LEI), Education Index (EI), and Income Index (II), which are then constructed into a complete H D I = L E I × E I × I I 3 by geometric averaging. Specifically, the three secondary indicators are:
L E I = M S / max ( M S )
E I = ( M Y S / 15 + E Y S / 18 ) / 2
I I = ln ( G N I p c ) ln ( 100 ) / ln ( 75000 ) ln ( 100 )
In particular, (i) Medical Service (MS). Considering the availability of life expectancy data at the prefecture level, and by referring to the indicator improvement of Yang et al. [42], we use the number of health technicians per 10,000 people as a proxy indicator for the health index of each prefecture-level city. (ii) Mean Years of Schooling (MYS). Calculation is made with reference to the formula of the China Human Development Report (2019)1, followed by correction with the data of the 7th National Population Census, and then the data of MYS of each prefecture-level city are obtained. (iii) Expected Years of Schooling (EYS). Due to the high correlation between EYS and MYS, assuming that the proportionality between MYS and EYS in each city is consistent with that of the country as a whole, the EYS in each prefecture-level city can be estimated by utilizing national-level education data, and national-level data from the China Statistical Yearbook. (iv) Purchasing power-adjusted real Gross National Income per capita (GNIpc). Based on the national-level data (from the UNDP website), the proportionality between the GDP per capita data measured in RMB prices in the current year and the Gross National Product (GNP) data measured in Purchasing Power Parity (PPP) prices in 2011 is obtained, i.e., the exchange rate conversion coefficient, and the data for the prefectures and cities are obtained through this conversion coefficient.

3.2.2. Explanatory Variable

The core explanatory variable is urban land use intensity (ULUI). Different from the traditional research that adopts a single indicator or statistical data to evaluate the indicator system [43], this paper starts from the definition of the number of urban functions carried by per capita area. According to the key features of urban land use intensity, global artificial impervious surface data, night lighting data, and Point of Interest (POI) data are used to measure the construction density, economic density, and facility density sub-dimensions of urban land use intensity, so as to finely depict the regional human–land system, and provide a data context for research on the human–land relationship and regional development.
U L U I i = a u c i / u l i + b u n i / u l i + c u p i / u l i
In the equation, ULUI is urban land use intensity; uc is the impervious surface data; un is nighttime lighting data; up is POI data; and ul is the total area of administrative area. The entropy value method is used to determine the weights of each dimension indicator, and a, b, and c are calculated to be 0.521, 0.336, and 0.143, respectively.
The following part will provide a detailed account of the data sources. (i) Construction land data (uc) are selected from the first Chinese annual China Land Cover Dataset (CLCD) on the Google Earth Engine platform to characterize the urban construction land area (https://zenodo.org/record/5816591, accessed on 17 July 2024). Compared with existing land use datasets, this dataset not only has obvious advantages in spatial (30 m) and temporal resolution but also possesses improved spatial and temporal consistency and higher credibility and timeliness [10]. (ii) Nighttime light data (un): This study employs the extended time series of global NPP-VIIRS-like nighttime light (NTL) data developed through cross-sensor calibration, which is available via the Harvard Dataverse platform (https://dataverse.harvard.edu/dataset.xhtml?persistentId=doi:10.7910/DVN/YGIVCD, accessed on 17 July 2024) to extract the dynamic characteristics of urban land-based socio-economic activities. The dataset is characterized by high accuracy (>85%) and strong spatiotemporal consistency, with a spatial resolution of 500 m [44]. Following the thresholding strategies and empirical findings of Fan et al. [45] and Si et al. [46], a threshold value of 10 was ultimately adopted to extract the data of urban areas from the dataset. (iii) POI data (up): Baidu Maps and other platforms (https://map.baidu.com, accessed on 17 July 2024) are used as data sources to obtain the POI data during the study period. In addition, considering the possible existence of data redundancy, duplication, and crossover, we acquire the density of POI data using the quadrat method to more accurately capture urban land spatial functions [47].

3.2.3. Mediating Variables

Consistent with Hypothesis 3a and 3b, we incorporate both marketization and non-marketization dimensions to systematically examine the mechanisms through which land use intensity influences urban welfare.
First, the market-oriented channels include industrial rationalization, industrial advancement, and economic agglomeration. (i) Industrial Rationalization (lnRat) is measured using the Theil Index and reflects the level of industrial structure rationalization. For further comparison, the reciprocal of the Theil Index for industrial structure is taken, with a higher value indicating a more rational industrial structure [48]. (ii) Industrial Advancement (lnAdv) is expressed by the ratio of the added value of the tertiary industry to the added value of the secondary industry [49]. (iii) Economic Agglomeration (lnAgg) is characterized by the ratio of the sum of the number of employed persons and the number of private/self-employed individuals per unit of built-up area in urban regions [50].
Non-market channels encompass expenditure scaling, expenditure structuring, and public serviceability. (i) Expenditure scaling (lnSca) is characterized by local financial expenditure within the general budget. (ii) Expenditure structuring (lnStr). Fiscal expenditure is not only manifested in the increase in scale but also in the optimization of structure, especially in the dimension of livelihood expenditure to meet the public needs of society and fair income distribution. Measured by the ratio of livelihood expenditures to public fiscal expenditures, the livelihood expenditures include four typical areas: science and technology expenditures, education expenditures, medical health and family planning, and social security and employment [51]. (iii) Public Service Degree (lnPub) is characterized by the ratio of the number of employees in public administration and social organizations to the area of the built-up area [52].

3.2.4. Control Variables

Urban welfare is not only affected by the intensity of land use but also closely associated with the socio-economic and information technology factors of each city. To minimize omitted variable bias and better strip out the impact of urban land use intensity on urban welfare, the following characterizing factors are controlled with reference to established studies [53,54,55]: (i) Urbanization level (urb), represented by the ratio of the urban resident population to the total population; (ii) the scale of economic development (lnGDP), measured by per capita real regional GDP; (iii) the scale of foreign investment (lnFD), characterized by the amount of actual foreign investment used in the year; (iv) the level of information and communication (lnIC), represented by the number of Internet users per 10,000 people; and (v) the level of medical protection (lnMed), represented by the number of beds in hospitals and health centers.
To ensure the continuity and availability of the sample data, and considering the adjustment of administrative divisions and missing data, 284 cities were retained as research units after excluding cities that were “withdrawn and established” during the study period (Chaohu, Laiwu, Haidong, Bijie, Tongren, Sansha, and Danzhou) and those with serious data deficiencies (Turpan and Hami, all prefectural-level cities in the Tibet Autonomous Region, Hong Kong, Macao, and Taiwan). Figure 3 is the map of the study area. The statistical data were mainly obtained from the China Urban Statistical Yearbook, the China Urban Construction Statistical Yearbook, and provincial and municipal statistical yearbooks, and the individual areas with missing data of the year were filled in by interpolation. GDP values for each year were deflated using 2011 as the base period. Additionally, all variables were logarithmized or rescaled to mitigate the effects of heteroscedasticity. Table 1 presents the definitions and descriptive statistics for each variable from 2011 to 2022. To avoid biased regression results due to potential interactive relationships among variables, multicollinearity diagnostics was performed on the core explanatory and control variables. The variance inflation factor (VIF) for all variables was found to be below 5, indicating that multicollinearity is not a concern.

4. Empirical Results and Interpretation

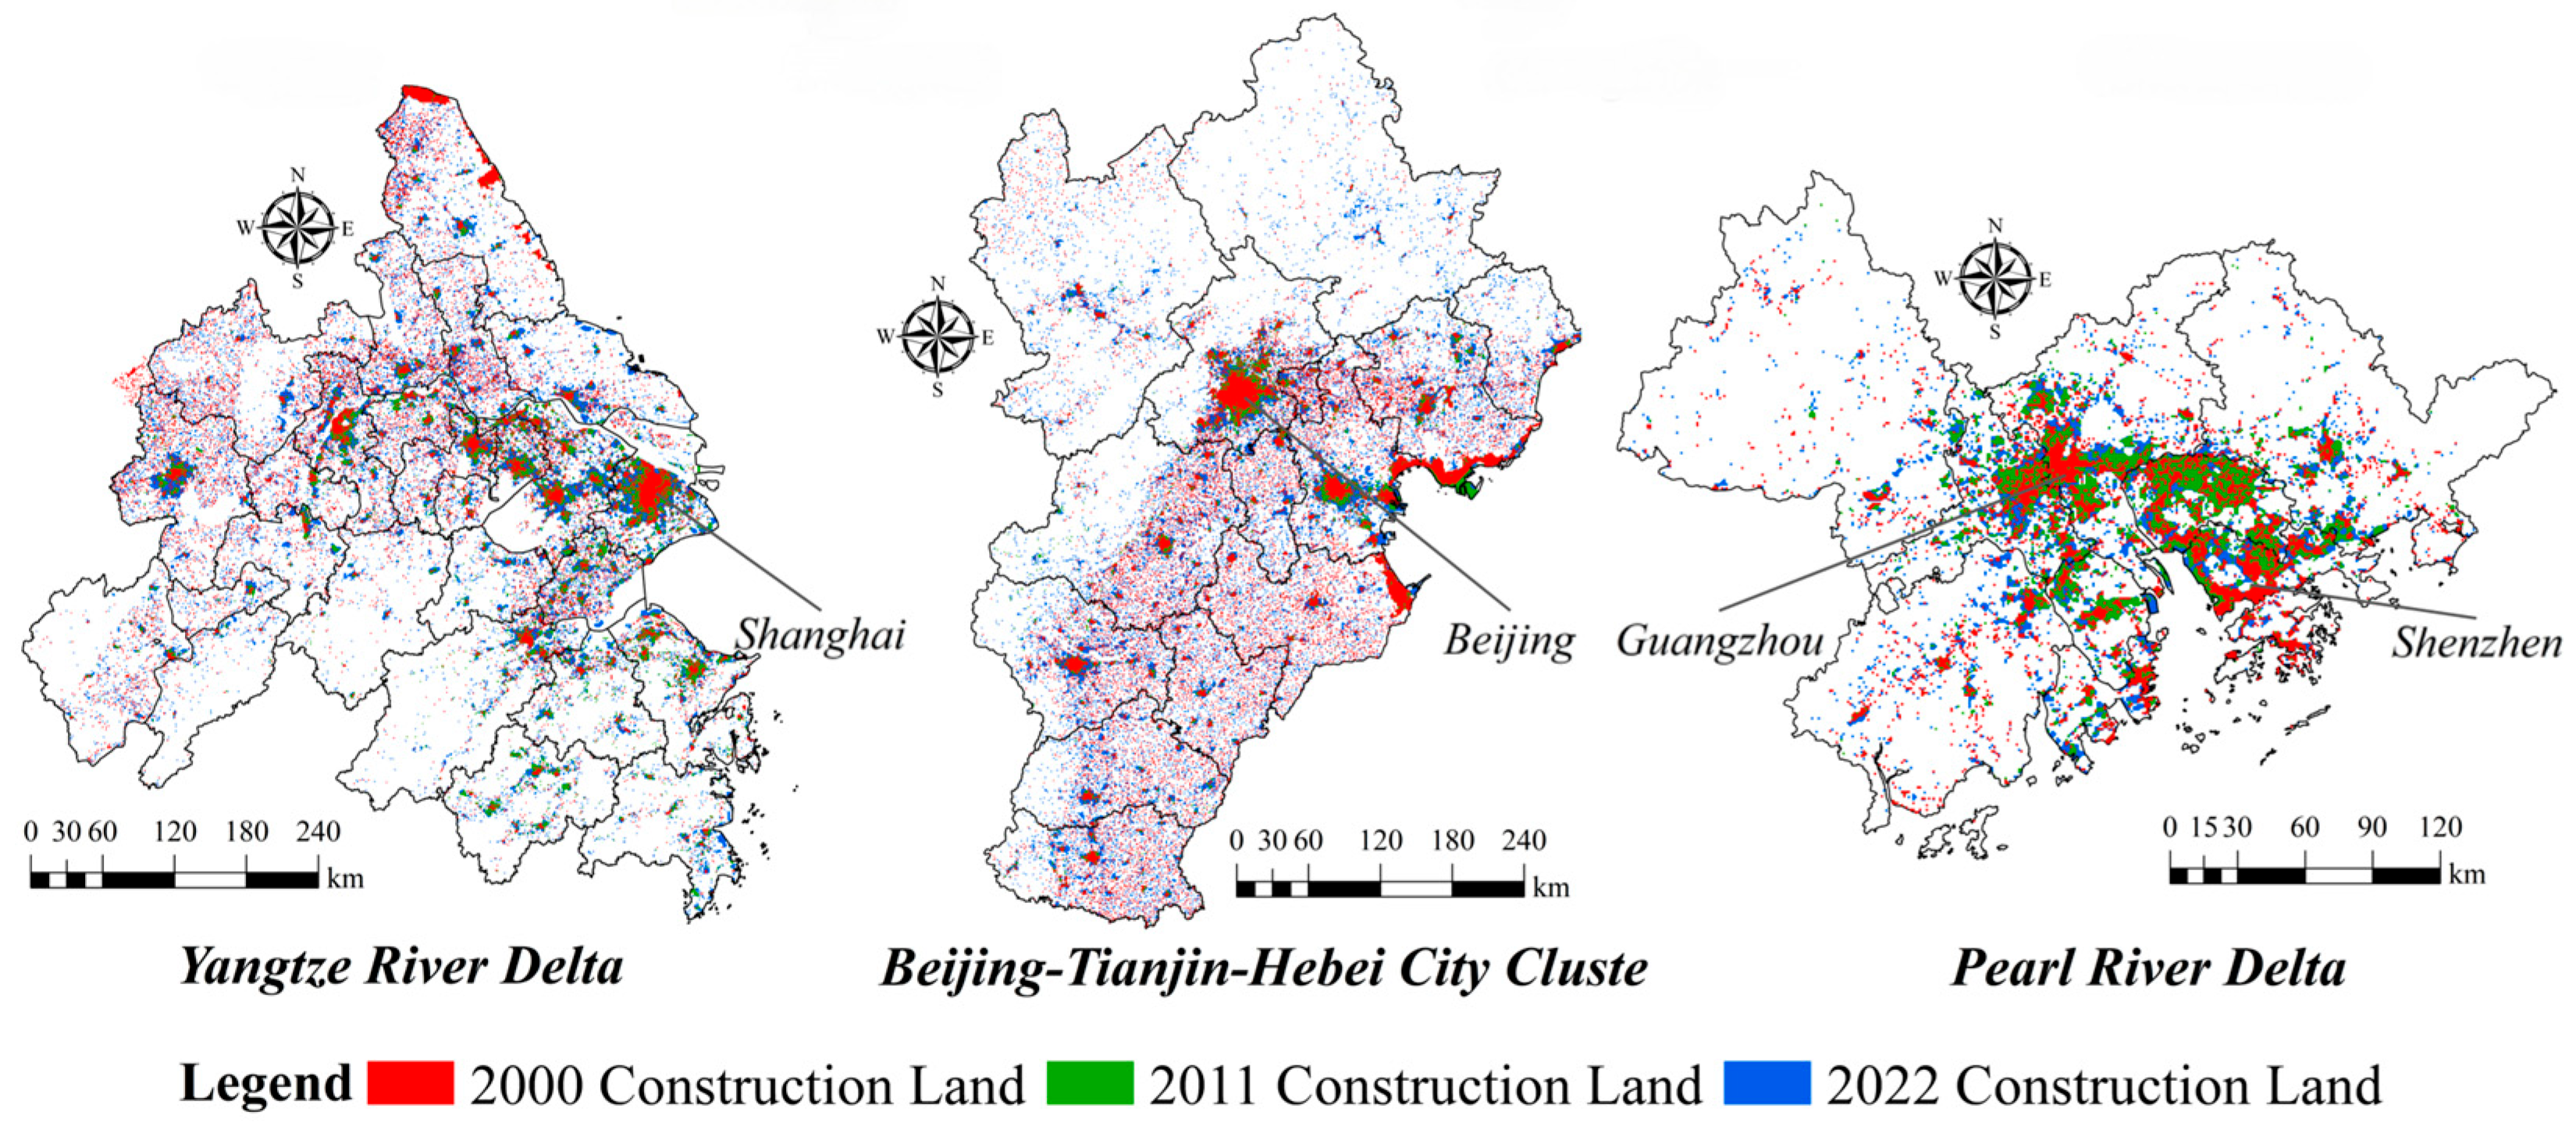
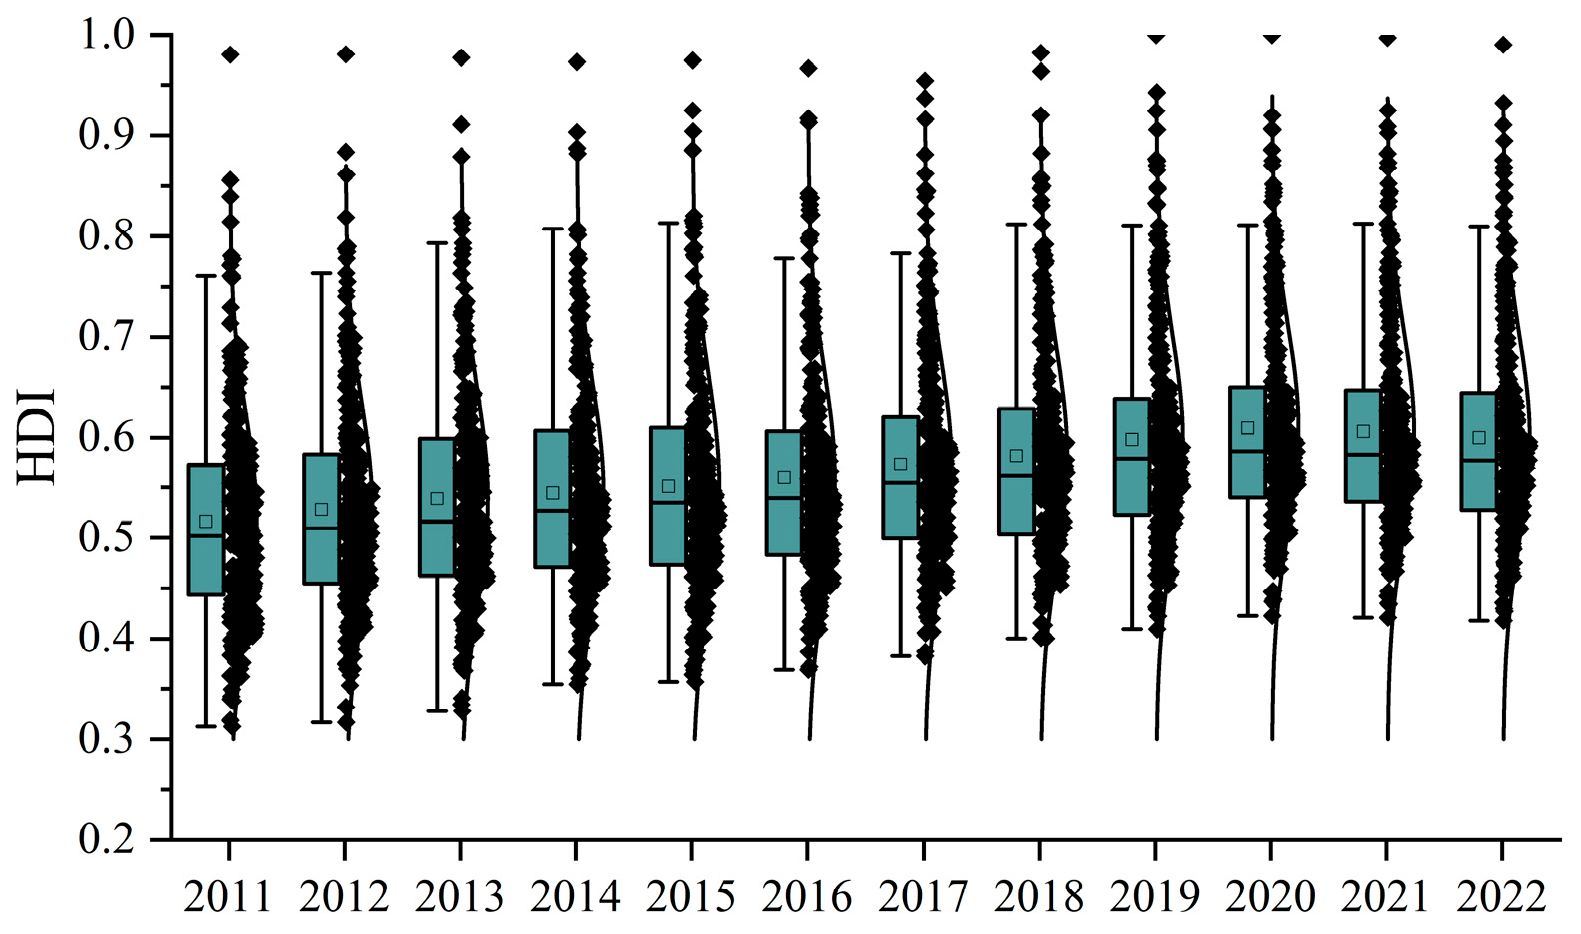
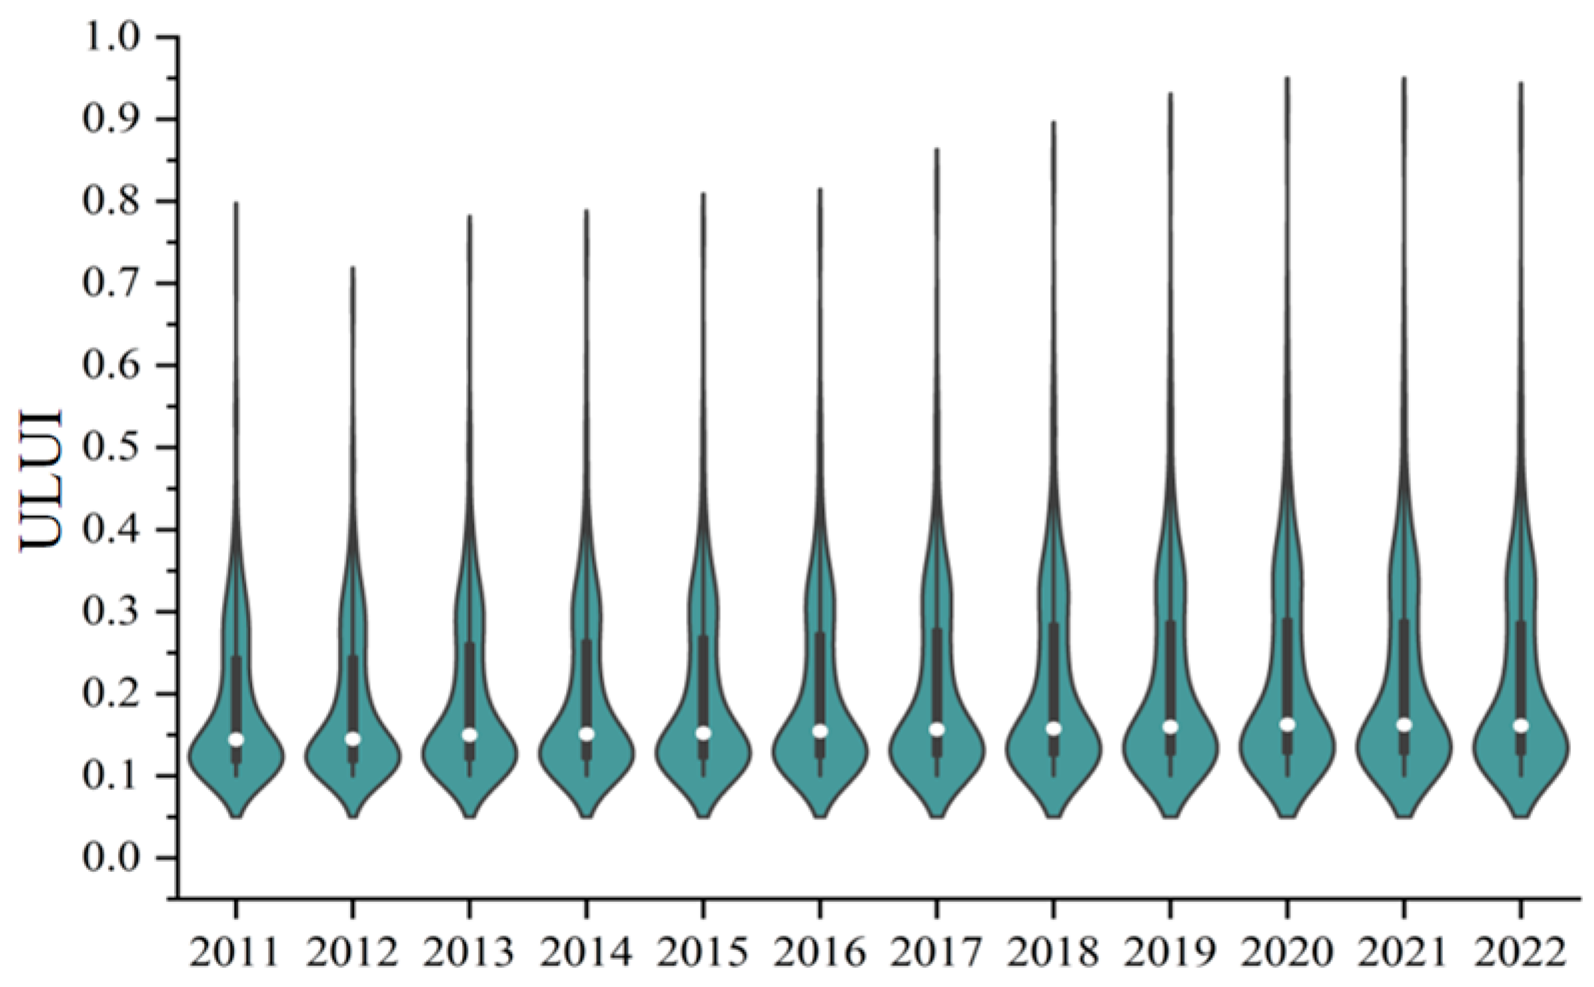
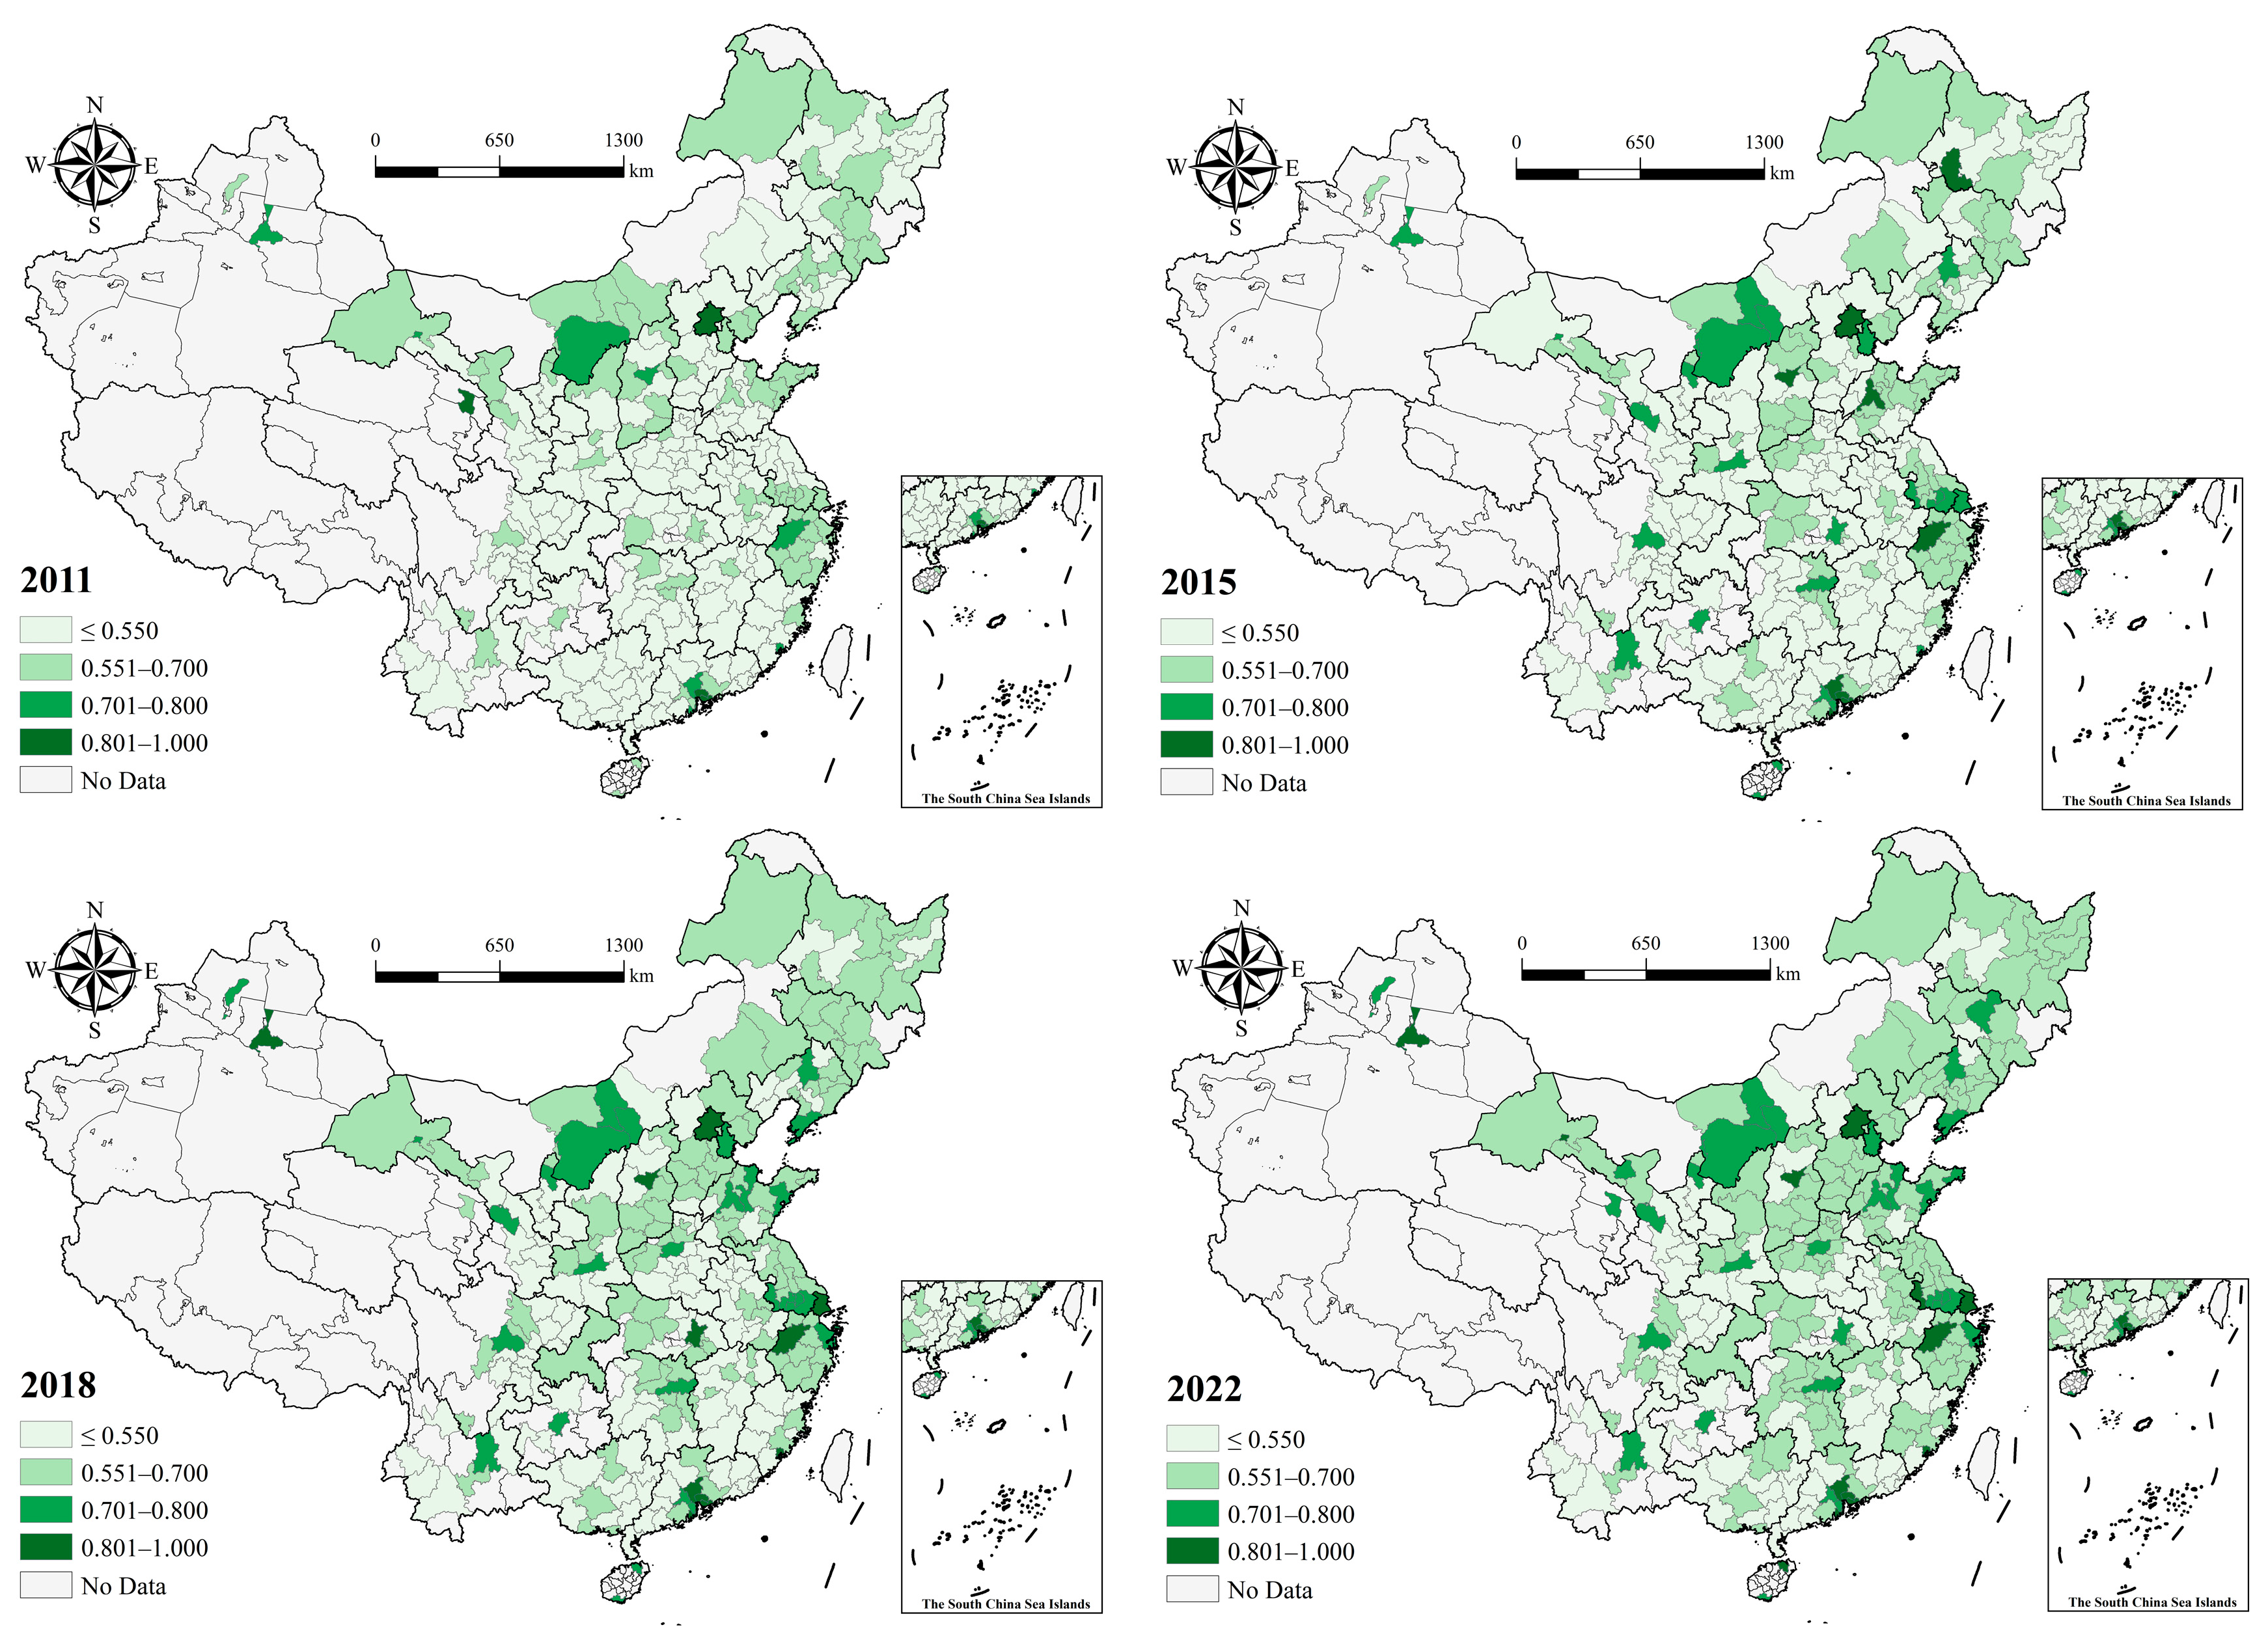
4.1. Spatiotemporal Pattern Analysis

In terms of time series, the characteristics of urban welfare (Figure 4) and urban land use intensity (Figure 5) were analyzed using box plots and violin plots, respectively. The box plot of urban welfare shows that from 2011 to 2022, the kernel density curve of HDI follows a “single peak” shape and shifts upward each year. The upper trailing tail is gradually lengthened and thickened, while the lower trailing tail is shortened and thickened, indicating a continual increase in the number of cities with high HDI values and, correspondingly, a decrease in those with low values. This phenomenon suggests that the welfare gap between cities is converging. As shown in the land use intensity violin plot, the kernel density curve of ULUI during the study period exhibits a “double peak” pattern, with continuous extension of the height of the box. The solid line above the box is longer than the solid line below, indicating that the concentration of low land use intensity values is significantly greater than that of high values. This suggests expansion of the absolute difference in land use intensity among cities over time.
Spatially, four representative years, 2011, 2015, 2018, and 2022, were selected to visualize urban spatial welfare (Figure 6) and land use intensity (Figure 7) using the ArcGIS 10.8 software.
First, most of the urban welfare transitions from the first to the second or third level, exhibiting obvious spatial differentiation characteristics. Specifically, (i) during the study period, the first level included 190 cities in 2011, accounting for 66.90% of the total. By 2022, the number of cities in the first level decreased to 96, accounting for 33.80% of the total. (ii) Cities with higher levels of urban welfare were primarily located in the Yangtze River Delta (YRD) urban agglomeration, the Beijing–Tianjin–Hebei (BTH) urban agglomeration, and the Pearl River Delta (PRD) urban agglomeration, as well as in some central cities. This can be attributed to the fact that the Beijing–Tianjin–Hebei urban agglomeration serves as an important political and cultural center of China, while the Yangtze River Delta and Pearl River Delta urban agglomerations function as economic and trade hubs. The higher degree of regional integration in these areas has contributed to the overall improvement in urban welfare through spillover effects. (iii) Some central and western cities, such as Shaotong, Longnan, and Anshun, remain at lower welfare levels, exhibiting a certain degree of regional persistence. Despite the Chinese government’s continued efforts in recent years to enhance fiscal transfers, infrastructure investment, and industrial support for central and western regions, cities in these areas are still faced with multiple structural constraints, including limited resource endowments, a weak industrial basis, severe talent outflows, and relatively peripheral geographic locations. These factors hinder the effective transformation of external support into sustained endogenous growth momentum. Moreover, the path dependence of regional development has further solidified their positions within the spatial economic network, preventing the formation of effective positive interactions with core regions. As a result, these cities exhibit limited growth inertia and a weak capacity to absorb spatial spillovers in the evolution of urban welfare.
Second, ULUI exhibits the spatial agglomeration characteristics of “east > non-east” and “mega > non-mega” (Figure 7). Specifically, (i) consistent with the findings of Chen et al. [57], the Yangtze River Delta, Pearl River Delta, and Beijing–Tianjin–Hebei urban agglomerations, which are representatives of eastern cities, have become high-value clusters of ULUI, including cities such as Shenzhen, Shanghai, Beijing, and Nanjing. This can be attributed to the fact that these cities are often the pioneers of China’s reform, opening-up, and economic development. After undergoing a phase of rapid urbanization, their land use patterns have shifted from “external expansion” to “internal exploration”. Rational allocation and structural optimization of land resources in these cities have contributed to steady increases in land use intensity. (ii) The regions represented by the Shandong Peninsula, Liao–Zhongnan urban agglomeration, Chengdu–Chongqing urban agglomeration, Central Plains urban agglomeration, and Jinzhong urban agglomeration exhibit the second-highest urban land use intensity and growth rate, which aligns with our observations of China’s regional development patterns. This can be attributed to the strategic importance of these regions in the national development plan, where rapid industrialization and urbanization have fostered a high concentration of production factors, creating a cyclical cumulative effect to increase the land use intensity. At the same time, these results further demonstrate the representativeness and feasibility of using multi-source geographic data to measure land use intensity. Overall, most cities in China are still at the stage of low land use intensity, highlighting the urgent need to optimize the allocation and utilization of regional land resources to promote the overall improvement of urban land use intensity.

4.2. Model Selection and Testing

Based on the geographic adjacency matrix, a spatial autocorrelation test was conducted to calculate the Moran’s I statistical values for the HDI and ULUI across 284 prefecture-level cities in China from 2011 to 2022. The results in Table 2 indicate that all Moran’s I values are positive and statistically significant at the 1% level, suggesting that the spatial distribution of HDI and ULUI is non-random and exhibits stable positive spatial dependence, thereby supporting the appropriateness of employing a spatial econometric model for further analysis.
Prior to estimating the parameters of all spatial panel models, the residuals from the corresponding Ordinary Least Squares (OLS) estimation results were tested for spatial correlation (Table 3). The results reveal that both the Lagrange Multiplier (LM) and Robust LM tests were statistically significant at the 1% level, indicating the presence of significant spatial lag and spatial error. This finding underscores the necessity of addressing the research questions within a spatial panel modeling framework. Subsequently, a simplification test for the spatial Durbin model (SDM) was performed. The results of the Likelihood Ratio (LR) and Wald tests reject the null hypothesis at the 1% significance level, suggesting that the SDM could not be simplified into a Spatial Autoregressive Model (SAR) or a Spatial Error Model (SEM). Therefore, SDM was deemed to be appropriate for this analysis. Furthermore, the Hausman test produced a chi-square value of –715.66, which is less than zero, indicating that the random effects specification outperforms the fixed effects alternative [58]. To ensure the robustness of the findings, we have reported the estimation results of the spatial Durbin model under random and fixed effects at the same time in the benchmark regression.

4.3. Spatial Spillover Effects

4.3.1. Spatial Baseline Regression

Table 4 presents the results of the benchmark regressions conducted in this study. Column (1) provides the estimation results without incorporating spatial effects, revealing that the coefficient of ULUI is 0.086 and statistically significant at the 1% level, indicating that an increase in land use intensity has a significant positive effect on urban welfare. As the primary focus of this study is the spatial spillover effect of urban land use intensity, the subsequent analysis focuses on the results derived from the SDM. Using the geographic neighborhood matrix, the spatial autocorrelation coefficient (ρ) in column (2) is significantly positive, highlighting a strong spatial dependence between urban land use intensity and urban welfare. Regarding the core explanatory variables, the coefficients of ULUI and its interaction term (W* ULUI) with HDI both pass the 1% significance test. These results suggest that increased urban land use intensity not only enhances urban welfare within the region but also generates adverse spatial spillover effects on urban welfare in neighboring areas. These findings are in agreement with the existing literature [59] and provide preliminary support for Hypotheses H1 and H2a. In addition, the estimation results of SDM models based on fixed effects presented in column (3) of Table 4 further confirm the robustness of the parameter estimates for the variables.

4.3.2. Spatial Effect Decomposition

Although the coefficient of ULUI is significantly positive and the coefficient of its spatial interaction term (W*ULUI) is significantly negative in the SDM model, these results do not directly reflect the marginal effect of land use intensity on urban welfare. Therefore, to better understand the direct and indirect effects, the outcomes of the SDM model under the geographic adjacency matrix were further decomposed using the partial differentiation method based on the SDM estimation results presented in Table 5.
The first is the local promotion effect. Combining the results in Table 1 and Table 5, it can be calculated that under the random effects model and fixed effects model, every 1 unit increase in urban land use intensity raises the local urban welfare level by 0.3772 and 0.215, respectively, indicating that land use intensity positively influences urban welfare within the study period, thereby supporting Research Hypothesis H1. This can be attributed to the “official promotion tournament” governance model in China, where local officials often have strong incentives to foster economic growth. Increasing land use intensity on limited available land can yield higher income and economies of scale, thereby enhancing regional social welfare. Moreover, regions with higher land use intensity tend to possess stronger economic and fiscal capacity, which enables greater allocation of resources towards public services such as education, healthcare, and social security, rather than solely focusing on investment expenditures. High-quality public goods and services can improve community interaction, elevate educational levels, and mitigate welfare loss and spatial imbalance caused by the crowding effect of increased land use intensity. Additionally, this mechanism strengthens the “labor pool” effect, where the “voting with feet” phenomenon ensures that urban welfare is a race to the top in the long run.
The second is the spatial spillover effect. The estimated coefficients of the indirect effect of ULUI on the impact of HDI are significantly negative, whether based on random effects or fixed effects models. For every 1 unit increase in urban land use intensity, the level of urban welfare in the neighboring areas decreases by 0.242 and 0.069, suggesting that an increase in land use intensity during the study period actually inhibits urban welfare improvement in neighboring areas, thus supporting Research Hypothesis H2a. This can be explained from two perspectives. The first is the echo effect of factor agglomeration and economic growth. As discussed in the theoretical analysis, a higher land use intensity is accompanied by the inflow of production factors, which enhances the region’s attractiveness and competitiveness. This in turn creates a “siphoning” effect on neighboring areas to detract their welfare. The second is regional inequality in public expenditure and services. Under China’s current decentralized governance model, local governments often prioritize investment in regions with high land use intensity and economic activity. While this preferential investment promotes local development, it also exacerbates the disparity across regions in access to public goods and services, thereby hindering the balanced development of urban welfare. Moreover, in less developed regions, the local governments have fewer incentives to improve public welfare, which explains why public policies focusing solely on economic growth tend to be ineffective in enhancing the overall welfare from a spatial welfare perspective.
Additionally, for the control variables, the direct and indirect effects of the urbanization level (urb), economic development scale (lnGDP), information development level (lnIC), and medical protection level (lnMed) are significantly positive, indicating that improvements in these four indicators contribute to enhanced urban welfare in both the local and neighboring areas. This can be explained by the agglomeration of production factors, which drives economic growth. In contrast, the direct and indirect effects of the foreign direct investment scale (lnFD) are significantly negative, indicating that many cities still exhibit uneven capacity to absorb foreign investment during the study period. This suggests a need to accelerate collaborative technological innovation and optimize resource allocation [60].

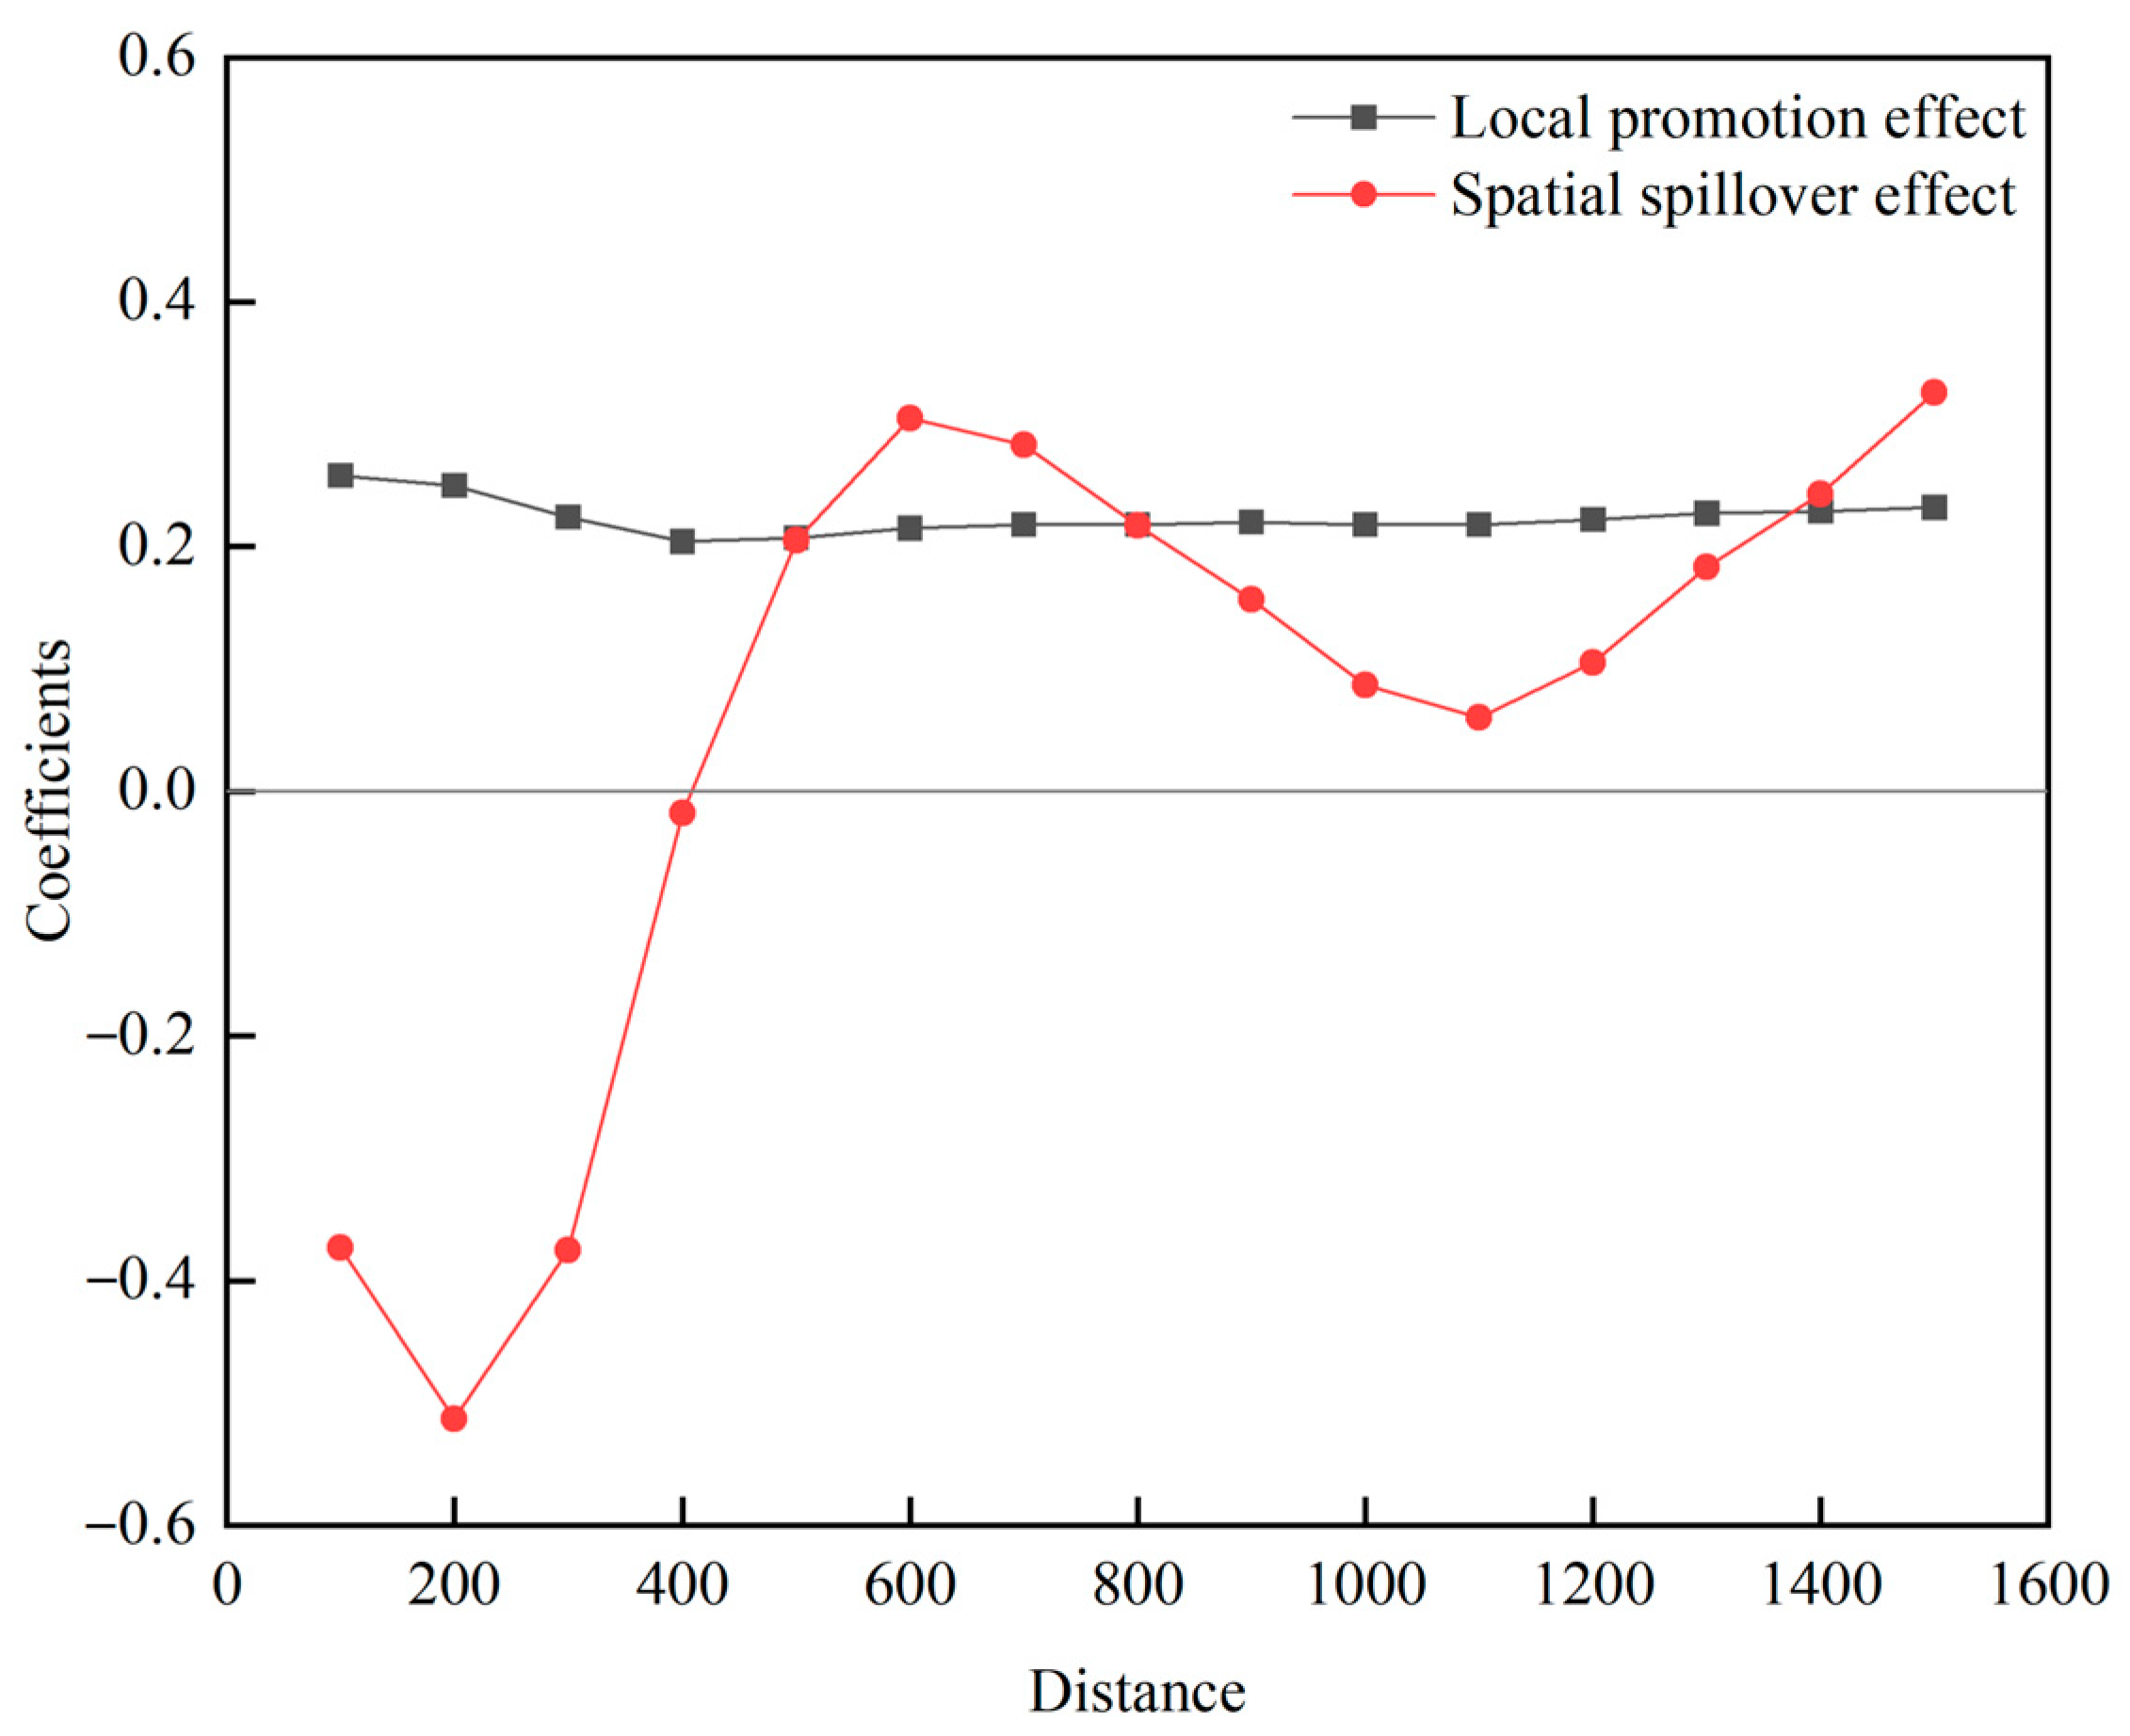
4.3.3. The Analysis of the Regional Boundary of the Spatial Spillover Effect

Considering that the spatial spillover effect tends to be weakened with increasing spatial distance, it is particularly necessary to further explore the spatial decay boundary of the role of land use intensity in urban spatial welfare. Although spatial relatedness depends on the interconnection of elements under geographic neighborhoods to a certain extent, the geographic neighborhood matrix defined by shared boundaries or vertices under Queen’s law may be too strict in practice. In this part, by setting different distance thresholds, it is assumed that city j from city i is outside the distance threshold d and takes the value of 1 / d i j 2 , otherwise it is 0. The specific formula is as follows:
W = 1 / d i j 2 , d i j d 0 , d i j < d
By referring to established studies [61,62], this paper sets 100 to 1500 km as the metric range, and utilizes the SDM to perform successive regression based on Equation (1) at 100 km intervals, so as to estimate the spillover effects of urban land use intensity on urban spatial welfare under different spatial distance thresholds (Figure 8).
The local promotion effect of land use intensity on urban welfare shows a slight decreasing trend. With the increase in spatial distance threshold, the overall neighborhood effect of land use intensity on urban spatial welfare is characterized by attenuation. Within 0–400 km, the land use intensity has significant negative spillover on the urban spatial welfare of neighboring cities, and the negative effect gradually decreases with increasing spatial distance; after 400 km, the spillover effect turns from negative to positive; in the range of 500–1500 km, the coefficient of spillover shows a “V”-shape fluctuation, but the absolute value of its influence intensity is generally lower than that of the coefficient in the range of 0–300 km. This indicates that the spatial impact of land use intensity on urban spatial welfare is characterized by a boundary effect and geographic attenuation; that is, the action is more pronounced at a closer distance, and tends to decline or even become insignificant at a far distance. This phenomenon may be due to the fact that the agglomeration of urban land use intensity has increased during the study period, leading to a regional resource squeeze effect and factor siphoning effect. Instead, more distant cities may benefit from the radiation-driven effect of strong central cities through industrial chain linkage and population relocation due to the lack of direct competition between them.

4.3.4. Robustness Test

To further validate the robustness of the spatial spillover effects of ULUI on HDI, this study re-estimates the baseline regression model from the following five aspects. First, replacing the weight matrix. Considering that urban welfare may be jointly influenced by both economic connections and geographic proximity, this study employs a nested “economic–geographic” distance matrix that captures both regional economic linkages and spatial characteristics to conduct robustness checks. Second, adjusting control variables. Given that intercity infrastructure and population mobility may affect both ULUI and HDI, two additional control variables are introduced: road network density (LnRoad) and population mobility rate (LnPop) [63], in order to more comprehensively capture key influencing factors. Third, the core variables were re-measured. (i) Revision of the weighting method. In light of the limitations of the official equal-weighting method, this study adopts the entropy method to assign new weights to HDI components. The weights assigned to the three secondary indicators, namely LEI, EI, and II, are 0.334, 0.316, and 0.349, respectively. (ii) Recomputing of the explained variables. Following the relevant study of Yang et al. [42], this study recalculates HDI using the number of hospital beds per capita, average years of schooling, and per capita regional GDP as proxy variables for LEI, EI, and II, respectively. Corresponding control variables that are overlapped are removed to eliminate multicollinearity. (iii) Incorporation of environmental dimension. Considering the potential influence of ecological quality on urban welfare, this study further includes the urban green coverage ratio (LnGre) into HDI construction and re-estimates the model based on the extended index system. Fourth, excluding exogenous events. Considering that the outbreak of COVID-19 in 2020 may have had certain impacts on China’s urban welfare, in order to avoid the impact of this exogenous event, we excluded the relevant data from 2020–2022 to re-test the model. Fifth, lagging core variables. To alleviate potential endogeneity arising from bidirectional causality, the ULUI variable is lagged by three periods before being reintroduced into the regression model [36].
The results in columns (1)–(7) of Table 6 all show positive standardized coefficients for the direct effects and negative standardized coefficients for the indirect effects of the explanatory variable ULUI, which are consistent with the results of baseline regression, suggesting that the conclusions concerning the negative spatial spillover effects of land use intensity on urban spatial welfare are reliable and robust.
In order to address the potential problems of omitted variables and measurement bias that may lead to endogeneity, this study further took the spatial spillovers of urban welfare into account, i.e., the highest fourth-order spatial lagged terms of the explanatory variables were used as instrumental variables, and the generalized spatial two-stage least squares GS2SLS method was used for the robustness discussion [64]; the specific regression results are shown in column (8) of Table 6. First, in the regression results of this instrumental variable, the first-stage F-value is greater than 10, which meets the instrumental variable test requirements recognized by the Staiger and Stock Institute, rejects the premise hypothesis of weak instrumental variables, and verifies the reliability of the instrumental variable selection in this study. Second, the regression results based on the consideration of the urban spatial welfare spillovers show that the welfare effect of the urban land use intensity remains robust.

4.4. Analysis of Spatial Heterogeneity

Geographic conditions and economies of scale play a crucial role in enhancing spatial welfare. In particular, the spatial welfare impact of land use intensity in China is more significantly shaped by the “siphon effect” than the “radiation effect”, probably due to the underutilization of comparative advantages between regions. Therefore, we explored the spatial heterogeneity by examining urban geographic location and population size, considering the governance strategies and the development of land use-related public welfare policies in China.

4.4.1. Geographic Location Heterogeneity

To verify the role of geographic location in enhancing spatial welfare in China, we conducted a heterogeneity analysis using the cross-multiplier term of land use intensity and longitude (ULUI*P), as presented in column (1) of Table 7. The estimated parameters show that both the direct and indirect effects of ULUI*P are significantly positive, suggesting that a city closer to the east (i.e., a greater longitude) generally has more pronounced positive impact of land use intensity on both the local and neighboring areas. However, the spillover effect is relatively weak, which may indicate a spatial mismatch of resources in China that warrants further attention.
To further explore the regional heterogeneity of the impact of ULUI on HDI, we categorized Chinese cities into eastern and non-eastern based on their geographic locations, as shown in columns 2 and 3 of Table 7. Regarding the local promotion effect, under geographic location heterogeneity, the direct effect of ULUI on HDI is significantly positive in both regions. The standardization coefficient of the non-eastern region was 0.461, much larger than the national level of 0.377 and eastern region of 0.187. This discrepancy can be attributed to China’s land supply policy, which has been particularly favorable to the central and western regions (especially small and medium-sized cities) since 2003. By lowering land grant prices, these regions have attracted increased investment and development in the short term.
From the perspective of spatial spillovers, compared with the standardization coefficient of the spatial spillover effect at the national level, which is −0.242, the spillover effect in the eastern region is not significant but positive (the standardization coefficient is 0.088), and the spillover effect in the central and western regions is significantly negative (the standardization coefficient is −0.402). A plausible explanation is the substantial misinterpretation in China’s land supply policy during the study period, particularly in efforts to balance regional development before 2017. A large number of urban construction land targets were allocated to regions that lack the production capacity to compete in the construction of industrial parks, development zones, and new cities in the central and western regions. In fact, many of these areas are outflow regions or small- to medium-sized cities, where “tendentious” and “excessive” investment measures are proved to be inefficient, resulting in a loss of spatial welfare together with their lack of radiative capacity.
Conversely, the eastern region, as a pioneer of reform and opening up, experienced a rapid increase in land use intensity, which, theoretically, could have a strong radiation effect on neighboring cities through economies of scale and agglomeration. However, the distortion caused by the mismatch of land resources and the deviation from urban development laws have hindered the effective realization of these effects in these economically developed eastern regions, particularly in large cities. This situation further supports the notion that the neglect of regional comparative advantages and imposition of “tendentious” regional development policies have actually acted as a counterforce [65], attempting to offset the geographic disadvantages of less-developed regions in order to achieve balanced inter-regional development.

4.4.2. Development Scale Heterogeneity

First, we incorporated the interaction term between land use intensity and urban population size (ULUI*P) in the benchmark regression, as shown in column (4) of Table 7. The results indicate that both the direct and indirect effects of this interaction term are significantly positive, suggesting that a larger urban population amplifies the positive impact of land use intensity on urban welfare, both within the region itself and in neighboring regions. Specifically, with increasing urban population size, land use intensity can facilitate agglomeration and economies of scale, which can optimize the industrial structure, stimulate innovation, and enhance economic vitality, thereby promoting urban welfare. Furthermore, spatial welfare effects are further enhanced through economic spillovers, knowledge and technology diffusion, and infrastructure sharing. However, it is notable that the estimated coefficients for both the direct and indirect effects are relatively small. This phenomenon can be attributed to the continued limitations on labor mobility within Chinese cities, despite years of reform on the household registration system. In particular, labor mobility remains restricted, particularly in larger cities, meaning that the full potential of urban population size has not been fully realized yet.
A following question is: what are the specific impacts of different city sizes on this effect? Based on the Circular on Adjusting the Criteria for the Division of City Size issued by the State Council of China in 2014, city size is categorized into megacities (with populations over 5 million) and non-megacities (with populations under 5 million), using the data from the Seventh Population Census of China. Spatial econometric estimation was conducted using the SDM model, and the results are presented in columns 5 and 6 of Table 7.
The results indicate that land use intensity (ULUI) increases the urban welfare (HDI) in both mega- and non-megacities. The standardization coefficient of megacities (0.205) is greater than that of non-megacities (0.187); from the perspective of the spatial spillover effect, the standardization coefficients of ULUI for HDI in megacities and non-megacities are 0.046 and −0.056, respectively. This suggests that megacities benefit from economies of scale and externalities, which positively contribute to the welfare of both the local and neighboring areas. The improvement in ULUI can promote coordinated development of surrounding cities through mechanisms such as industrial relocation, service spillovers, and enhanced transportation connectivity, exhibiting typical characteristics of a “growth pole”. For instance, megacities such as Guangzhou, Shenzhen, and Shanghai have improved the quality of their built environment while simultaneously exporting high-quality resources and development experience to neighboring cities such as Foshan and Nantong, thereby contributing to the overall enhancement of regional welfare levels. In contrast, the development of most non-megacities is often driven by the radiation effects of adjacent megacities. However, due to their limited absorptive capacity and high functional homogeneity, these cities are more likely to pursue local development by absorbing talent, capital, and other factors from nearby areas when optimizing their urban spatial structures, which may result in a “siphon effect” to suppress the HDI of neighboring cities. This pattern aligns with broader observations of urban development trends across many countries. Duranton and Puga used the equilibrium city size of the United States in 2010 as a comparative benchmark and conducted a counterfactual estimation based on changes in urban regulations (allowing larger cities to grow even bigger), and found that lowering the cost of access to the top seven U.S. cities could lead to a 7.95% increase in per capita output [66]. In other words, population growth in more productive cities contributes to the improvement in the spatial distribution of the population, thereby enhancing the overall welfare.
It is noticeable that the estimated coefficients of both spatial spillover effects are not significant, and the possible explanation is that public welfare policies linked to household registration have posed persistent and stricter policy constraints on the development of eastern regions (especially megacities). Until 2014, the “Opinions of the State Council on Further Promoting the Reform of the Household Registration System” still emphasized the need to strictly control the population of megacities and encouraged resource allocation to the central and western regions, potentially hindering the process of spatial welfare in China’s cities. While “land-based” public policies and urban-size-based household registration policies have allowed for short-term and localized exchanges of efficiency for equality, inefficient investments and lack of incentives have resulted in the loss of overall efficiency and an imbalance in development.
A significant feature of this dynamic is the tendency of megacities to attract a greater number of jobs, exerting a stronger economic pull. However, at present, the decreasing land supply, rising land and housing prices, and increasing living costs have created barriers to labor inflow. Consequently, the size of many cities remains insufficient to fully capitalize on the agglomeration effects and economies of scale associated with megacities [67], ultimately leading to a loss of efficiency and welfare. Empirical evidence from Wang and Qiao supports this notion, who showed that Chinese cities exhibit a flattening population distribution, with the relative population size of the top 50 cities being much smaller than that of U.S. metropolitan areas [68]. In contrast, the relative population size of small- and medium-sized cities in China is slightly larger than that in the United States, resulting in a noticeably lower Gini coefficient for urban space in China. These findings clearly indicate that urban scale should be further optimized in the future to unlock the spatial reallocation benefits of population mobility and enhance the impact of “people-oriented” public welfare policies.

4.5. Further Analysis: Spatial Impact Mechanisms

Building upon the theoretical analysis and research hypotheses presented in Chapter 2.3, we further estimated the spatial measures of various channels through which land use intensity affects urban spatial welfare from six aspects, including industrial rationalization, industrial advancement, and economic agglomeration in the market dimension, and expenditure scaling, expenditure structuring, and public serviceability in the non-market dimension. Table 8 reports the main effect, direct effect, and spatial spillover effect of land use intensity on each channel variable.

4.5.1. Market-Based Channels

Regarding the main effects, the results from models (1), (2), and (3) indicate that the coefficients of ULUI are 4.299, 1.329, and 0.145, respectively, which are statistically significant, at least at the 10% level. These results suggest that improvement in land use intensity can significantly contribute to industrial rationalization, industrial advancement, and economic agglomeration.
In the decomposition of spatial effects, the direct effect of ULUI on industrial rationalization (lnRat) and industrial advancement (lnAdv) is positive, while the spatial spillover effect is significantly negative, suggesting that land use intensity effectively enhances industrial rationalization and advancement within the city but has an inhibitory impact on neighboring regions. The positive direct effect is attributed to the optimal allocation of urban resources and the development of industrial agglomeration, which is further supported by local government policies such as tax incentives, land supply security, and other forms of policy guidance. These factors collectively contribute to the superiority and upgrading of the local industry. However, the neighboring regions are faced with challenges due to insufficient “market power” and “supportive power”, making it difficult for them to compete for regional resources. Moreover, through the “demonstration and imitation” effect, these regions may blindly replicate the economic development model of the city, which does not align with their own economic context. This will cause low-level, repetitive construction, industrial homogenization, and resource mismatches, ultimately hindering the optimization and upgrading of their industrial structures.
As for economic agglomeration (lnAgg), both the direct and indirect effects of ULUI are positive, indicating that land use intensity fosters economic agglomeration in both the local and neighboring areas. This demonstrates that the beneficial effects of urban land use intensity can extend beyond the immediate region to offer broader benefits. Increasing investment and output per unit area of land can create more jobs, which subsequently generates spillover effects to neighboring regions, particularly through the industries within the local industry chain, including upstream and downstream supporting industries. Thus, the improvement in land use intensity primarily results in industrial rationalization, industrial advancement, and economic agglomeration, confirming the validity of Hypothesis H3a that optimization of industrial structure and economic agglomeration acts as a significant channel.

4.5.2. Non-Market-Based Channels

From the main effects, the results of Models (4), (5), and (6) reveal that the coefficients of ULUI are 1.611, 0.068, and 0.035, which are all significant at least at the 5% level. These findings indicate that the enhancement of land use intensity significantly contributes to the scaling up of expenditures, restructuring of expenditures, and improvement of public service delivery.
Further analysis of the decomposition of spatial effects reveals that both the direct effect and spatial spillover effect of ULUI are notably positive in terms of expenditure scaling (lnSca) and expenditure structuring (lnStr). Specifically, to meet the growing demand for infrastructure and public service facilities with increasing land use intensity, governments at various levels in China have expanded their expenditure scales, increasing investments in science, education, culture, and healthcare. This helps address the shortcomings of “GDP-oriented” development models. The optimized public expenditure structure fosters a multiplier effect to enhance the local urban welfare. Furthermore, positive spillovers are magnified through inter-regional infrastructure connectivity, which is facilitated by the “demonstration effect” of public expenditures and the “cross-border externalities” associated with the provision of public goods across regions.
In the context of public serviceability (lnPub), the positive direct effect of ULUI and the significantly negative spatial spillover effect suggest that while increasing land use intensity can enhance local public serviceability, it may also place pressure on the public resources of neighboring regions. This pressure may lead to higher economic costs for these regions, prompting them to reduce the proportion of public service personnel and focus on improving the quality of public services. This adjustment is aimed at mitigating the inefficiency caused by the expansion of government services. As a result, the overall impact of increasing land use intensity is reflected in expenditure scaling, expenditure restructuring, and the improvement in public serviceability. This finding supports Hypothesis H3b that financial support and public serviceability act as key channels for land use intensity to influence urban welfare.
The above estimation results further indicate that the impact of land use intensity on the welfare of both local and neighboring areas is a comprehensive reflection of the six channels of action. Therefore, from the perspective of a synergistic effect, we constructed the synergistic index (lnSyn) by applying the entropy value method to the six channel variables, and similarly applied the empirical strategy of Equation (3) to identify the channel effect of the synergistic mechanism of the impact of land use intensity, so as to comprehensively examine the overall force of the six mechanism variables. The results in column (7) of Table 8 show that land use intensity has a direct and significantly positive effect on the synergy mechanism, indicating that it can enhance the overall urban welfare level by improving the efficiency of resource allocation and the ability of institutional supply, while the spatial spillover effect is significantly negative, suggesting that there may be a “siphoning” phenomenon of the high-intensity utilization of land resources at the regional level, which may have a squeezing effect on the welfare level of neighboring cities.

5. Discussion

5.1. Further Interpretation of Results

Land is a scarce public resource and an essential carrier of socio-economic activities, playing a significant role in shaping resource allocation and structural optimization within regions. Changes in land use intensity can have strong spatial interaction and spillover effects across boundaries to affect urban welfare. Additionally, spatial environments and scale effects exhibit heterogeneous characteristics. However, existing research on the welfare effects of land use intensity has largely ignored spatial heterogeneity, and the specific relationships are still “black boxes”.
The findings of this study provide empirical support for enhancing spatial welfare through effective land use strategies. Notably, the increase in land use intensity during the study period led to welfare reduction in neighboring areas via the “siphon effect” rather than generating spatial spillover benefits. A plausible explanation is that economic competition under the current decentralized system has intensified local protectionism. Additionally, the widespread phenomenon of the “official promotion tournament” in China is largely driven by the allocation of land as a critical resource.
Second, the analysis of spatial spillover heterogeneity underscores the critical influence of urban geography and economies of scale in enhancing urban spatial welfare. However, the current “land-based” public governance framework has partially diminished the investment efficiency, leading to a significant misalignment between land supply and population mobility. This misalignment may explain why substantial and comprehensive improvements in China’s spatial welfare remain challenging. As a response, the central government has recently initiated some policy adjustments, such as linking the increase in construction land quotas to population flow direction and establishing a nationwide inter-regional construction land trading mechanism. These measures indicate that with the relaxation of the restrictions from household registration systems, regional interactions will be intensified to foster more integrated spatial development.
Third, land use in China exhibits a pronounced policy-driven effect. Land use intensity reflects the spatial allocation shaped by non-market forces, with local governments influencing regional planning and public services through non-market mechanisms, thereby redefining the space of local governance. Concurrently, governments also influence the resource allocation via market channels. The mechanism tests conducted in this study from both market and non-market dimensions demonstrate that changes in land use intensity can restructure the spatial distribution of resources through the interplay of these two channels, ultimately influencing regional welfare development. Furthermore, this research highlights the intrinsic value and decision-making potential of multi-source geospatial data, which can offer objective and precise spatial insights for analyzing complex inter-regional interactions in the future.

5.2. Policy Recommendations

There is no doubt that improving urban space welfare is continuous and regional work. To address land use externalities, it is essential to establish a stable, differentiated land use management framework and supportive public welfare policies that align with regional development strategies. Specifically, the following actions are recommended. (i) Prioritization of people-oriented, quality-enhancing, and potential-maximizing approaches, so as to optimize new urban construction land allocation based on urban population growth dynamics [65], advance reforms in inter-regional land use trading and household registration systems, enhance the agglomeration potential in regions with significant population inflows (such as eastern cities and megacities), and strengthen the dynamic and integrated management of urban land use to improve cities’ carrying and absorption capacities. (ii) Enhancing neighbor relations and benefit sharing. On the one hand, public investment should be increased to optimize the allocation of public spending on essential services such as healthcare and education, and foster a positive demonstration effect of public services. On the other hand, traditional administrative boundaries should be dismantled to facilitate inter-regional factor circulation and service interoperability. For instance, it is necessary to focus on the resource crowding out and factor siphoning effect of core cities, strengthen the regional coordination mechanism, promote the orderly spillover of the functions of central cities, facilitate cross-regional industrial synergies and reasonable population flows, explore mechanisms for sharing the benefits of high-quality services such as healthcare, education, and infrastructure with neighboring areas, and create a comprehensive, multifaceted, and diversified model of collaborative development. Regions with geographical disadvantages and limited economies of scale should focus on strengthening their unique local assets, actively integrate into regional markets, and strategically utilize their comparative advantages to enhance the overall spatial welfare.

5.3. Limitations and Constraints

In addition, this study has some limitations and suggested directions for further research. First, given the rapid expansion of urban construction land during the study period, we adopted the definition of urban land use intensity as “the number of urban functions per unit of land area”. Accordingly, we utilized multi-source remote sensing and geospatial data to measure the land use intensity from three dimensions: construction density, economic density, and facility density. Compared with conventional macro-level indicators from statistical yearbooks, this approach enables a more effective capture of the spatial heterogeneity of land use intensity. However, it should also be noted that the selected indicators primarily reflect the spatial distribution of the built environment and may be deficient in capturing the dynamic processes of functional transformation and structural evolution in land use. Future research can integrate additional metrics such as the Urban Expansion Index, Land Use Dynamic Degree, and Land Use Transition Matrix to construct a more comprehensive index system that can better reflect the full spectrum of “intensity-structure-evolution” in urban land use. For example, based on the dominant type and proportion of land cover, urban land systems can be further classified into functional subsystems such as human settlement systems, farmland systems, forest systems, and wetland systems [69], which can realize more systematic and structured assessment of urban land use intensity.
Second, when measuring urban welfare, this study adopts the three core dimensions of the official HDI, including income, health, and education, providing certain degrees of representativeness and comparability. However, with increasing diversification of urban governance goals, development assessment has been expanded to encompass broader issues such as fulfillment of basic human needs, economic growth, well-being, and environmental sustainability [12]. Therefore, future research can aim to construct a more comprehensive and dynamic multidimensional evaluation framework of urban welfare by incorporating indicators such as environmental quality (e.g., air quality, green space coverage) and social equity (e.g., accessibility and equality of public services). Methodologically, it is also important to examine the interactions between different dimensions, particularly with respect to the setting of weights and the treatment of spatial dependence. In addition, attention should be paid to maintaining a balance between simplicity and informational completeness in the indicator system, so as to better capture the mechanisms through which spatial factors influence urban welfare dynamics.
Third, although this study primarily investigates the spatial welfare effects and mechanisms of land use intensity, from a welfare economics perspective, urban welfare may exhibit a “threshold effect”. There may be a critical threshold of land use intensity, beyond which its impact on urban welfare is not linear. This suggests the potential existence of a “lock-in boundary” effect, where increases in land use intensity cease to have a positive effect on urban welfare, which is a topic that warrants further investigation. Moreover, considering the potential lag effects between policy changes and urban welfare outcomes, future research can explore the role of different policies in mediating the relationship between land use intensity and urban welfare by leveraging exogenous shocks. Such an approach may offer more actionable insights for policymakers seeking to enhance the effectiveness of urban land governance.

6. Conclusions

This study focuses on a representative region of China, and examines the spatial welfare effects and influencing mechanisms of urban land use intensity to promote sustainable urban development. Specifically, a panel dataset of 284 cities at the prefecture level and above in China from 2011 to 2022 is constructed by integrating multi-source data. The evolutionary characteristics of ULUI and HDI are analyzed from both spatial and temporal dimensions. The study employs the spatial Durbin model, spatial heterogeneity model, and spatial mechanism model to investigate the spatial spillover (heterogeneity) effects of land use intensity on urban welfare and its underlying mechanisms. The findings can be summarized as follows. (i) Over time from 2011 to 2022, HDI is generally improved with a trend towards convergence between cities. ULUI is partially improved, with a significantly higher concentration of low values than high values, and the absolute difference in land use intensity between cities is enlarged over time. (ii) Spatially, the HDI of most cities transitions from the first to the second or third level, displaying significant spatial differentiation. ULUI shows notable spatial agglomeration, with higher values concentrated in the eastern and megacities. (iii) The results of the spatial benchmark regression demonstrate that land use intensity significantly enhances urban welfare locally, while it negatively affects the welfare levels in neighboring regions, and the effective boundary of this spillover effect is 400 km. This conclusion remains robust after a series of tests. (iv) Regarding spatial spillover heterogeneity, geography and economies of scale are crucial in the enhancement of spatial welfare. The spillover effect of ULUI on HDI is positive, but the estimated coefficients are insignificant or small for eastern and megacities, while the spillover effect is significantly negative for central, western, and non-megacities. A potential explanation is that the current preferential allocation of new construction land, combined with public welfare policies linked to household registration, hampers the promotion of urban spatial welfare in China. (v) From the perspective of spatial influencing mechanisms, land use intensity influences urban welfare through six channels, including industrial rationalization, industrial advancement, and economic agglomeration in the market dimension, and expenditure scaling, expenditure structuring, and public serviceability in the non-market dimension.

Author Contributions

Conceptualization, X.L. (Xiang Luo) and J.Q.; data curation, J.Q., S.N. and L.J.; formal analysis, S.N., J.Q. and Y.T.; funding acquisition, X.L. (Xiang Luo) and Y.T.; investigation, J.Q. and L.J.; methodology, S.N., J.Q. and X.L. (Xin Li); project administration, X.L. (Xiang Luo) and J.Q.; resources, S.N., J.Q. and X.L. (Xiang Luo); software, S.N., J.Q. and X.L. (Xin Li); supervision X.L. (Xiang Luo), S.N., L.J. and Y.T.; validation, X.L. (Xiang Luo), S.N. and J.Q.; visualization, J.Q. and S.N.; writing—original draft, J.Q.; writing—review and editing, X.L. (Xiang Luo), J.Q., X.L. (Xin Li), L.J. and Y.T. All authors have read and agreed to the published version of the manuscript.

Funding

This research was financially supported by the National Natural Science Foundation of China (42171286; 71974071).

Data Availability Statement

The original contributions presented in the study are included in the article. Further inquiries can be directed to the corresponding author.

Conflicts of Interest

The authors declare no conflicts of interest.

Notes

1
Mean Years of Schooling = (6 × Pelementary school + 9 × Pmiddle school + 12 × Phigh school + 16 × Ppost-secondary or above)/(Total population over 6 years of age); Pi is the number of students enrolled in that type of school.
2
This is the standardized coefficient, 0.377 = 0.354 × 0.116 (standard deviation of the explanatory variables) ÷ 0.109 (standard deviation of the explained variables), below.

References

  1. Angel, S.; Parent, J.R.; Civco, D.L.; Blei, A.; Potere, D. The Dimensions of Global Urban Expansion: Estimates and Projections for All Countries, 2000–2050. Prog. Plan. 2011, 75, 53–107. [Google Scholar] [CrossRef]
  2. Ruan, L.L.; He, T.T.; Xiao, W.; Chen, W.Q.; Lu, D.B.; Liu, S.C. Measuring the Coupling of Built-up Land Intensity and Use Efficiency: An Example of the Yangtze River Delta Urban Agglomeration. Sustain. Cities Soc. 2022, 87, 104224. [Google Scholar] [CrossRef]
  3. Schuppe, S.; Haase, D.; Kötter, T. Towards sustainable settlement growth: A new multi-criteria assessment for implementing environmental targets into strategic urban planning. Environ. Impact Assess. Rev. 2012, 32, 195–210. [Google Scholar] [CrossRef]
  4. Ebisu, K.; Holford, T.; Belanger, K.; Leaderer, B.; Bell, M.L. Urban Land-Use and Respiratory Symptoms in Infants. Environ. Res. 2011, 111, 677–684. [Google Scholar] [CrossRef]
  5. Albertus, M.; Espinoza, M.; Fort, R. Land reform and human capital development: Evidence from Peru. J. Dev. Econ. 2020, 147, 102540. [Google Scholar] [CrossRef]
  6. Frolking, S.; Mahtta, R.; Milliman, T.; Esch, T.; Seto, K.C. Global urban structural growth shows a profound shift from spreading out to building up. Nat. Cities 2024, 1, 555–566. [Google Scholar] [CrossRef]
  7. Zeng, C.; Yin, Y.Z.; Guo, L.Y.; Liu, C.; Zhang, Y.; Huang, Z. Integrating the administrative spillover effect into the spatial governance system to revisit land development: A study in urban-rural fringe areas of Wuhan and neighboring cities, China. Land Use Policy 2024, 139, 107060. [Google Scholar] [CrossRef]
  8. Liu, C.; Tu, J.; He, Y. Measurement of China’s Human Development Index and Analysis of Its Influencing Factors from the Perspective of New Development Concept. Soc. Indic. Res. 2023, 167, 213–268. [Google Scholar] [CrossRef]
  9. He, C.F.; Huang, Z.J.; Wang, R. Land use change and economic growth in urban China: A structural equation analysis. Urban Stud. 2014, 51, 2880–2898. [Google Scholar] [CrossRef]
  10. Yang, J.; Huang, X. The 30 m annual land cover dataset and its dynamics in China from 1990 to 2019. Earth Syst. Sci. Data 2021, 13, 3907–3925. [Google Scholar] [CrossRef]
  11. Deng, J.; Wang, K.; Hong, Y.; Qi, J.G. Spatio-temporal dynamics and evolution of land use change and landscape pattern in response to rapid urbanization. Landsc. Urban Plan. 2009, 92, 187–198. [Google Scholar] [CrossRef]
  12. Basel, S.; Gopakumar, K.U.; Rao, R.P. Broad-based index for measurement of development. J. Soc. Econ. Dev. 2020, 22, 182–206. [Google Scholar] [CrossRef]
  13. Costanza, R.; Hart, M.; Posner, S.; Talberth, J. Beyond GDP: The Need for New Measures of Progress; Pardee Working Paper, 4; Boston University: Boston, MA, USA, 2009; Available online: https://hdl.handle.net/2144/22665 (accessed on 17 July 2024).
  14. Sen, A.; Anand, S. Human Development and Economic Sustainability. World Dev. 2000, 28, 2029–2049. [Google Scholar] [CrossRef]
  15. Lawn, P.A. A Theoretical Foundation to Support the Index of Sustainable Economic Welfare (ISEW), Genuine Progress Indicator (GPI), and Other Related Indexes. Ecol. Econ. 2003, 44, 105–118. [Google Scholar] [CrossRef]
  16. Bagavandas, M. Development of multifactor index for assessing quality of life of a tribal population of India: Multilevel analysis approach. BMC Public Health 2021, 21, 383. [Google Scholar] [CrossRef]
  17. Qasim, M.; Pervaiz, Z.; Chaudhary, A.R. Do Poverty and Income Inequality Mediate the Association Between Agricultural Land Inequality and Human Development? Soc. Indic. Res. 2020, 151, 115–134. [Google Scholar] [CrossRef]
  18. Sagar, A.D.; Najam, A. The human development index: A critical review. Ecol. Econ. 1998, 25, 249–264. [Google Scholar] [CrossRef]
  19. Qiu, Q.; Sung, J.; Davis, W.; Tchernis, R. Using spatial factor analysis to measure human development. J. Dev. Econ. 2018, 132, 130–149. [Google Scholar] [CrossRef]
  20. Natoli, R.; Feeny, S.; Li, J.; Zuhair, S. Aggregating the Human Development Index: A Non-compensatory Approach. Soc. Indic. Res. 2024, 172, 499–515. [Google Scholar] [CrossRef]
  21. Song, W.; Cao, S.S.; Du, M.Y.; Lu, L. Distinctive roles of land-use efficiency in sustainable development goals: An investigation of trade-offs and synergies in China. J. Clean. Prod. 2022, 382, 134889. [Google Scholar] [CrossRef]
  22. Jiao, J.L.; Jin, Y.X.; Yang, R.R. An approach to exploring the spatial distribution and influencing factors of urban problems based on Land use types. Sustain. Cities Soc. 2024, 104, 105321. [Google Scholar] [CrossRef]
  23. Liu, Y.; Zhang, Y. Responses of Ecosystem Services to Land Use/Cover Changes in Rapidly Urbanizing Areas: A Case Study of the Shandong Peninsula Urban Agglomeration. Sustainability 2024, 16, 6100. [Google Scholar] [CrossRef]
  24. Zhang, M.; Chen, E.; Zhang, C.; Liu, C.; Li, J. Multi-Scenario Simulation of Land Use Change and Ecosystem Service Value Based on the Markov–FLUS Model in Ezhou City, China. Sustainability 2024, 16, 6237. [Google Scholar] [CrossRef]
  25. Ahmad, E.A.; Kafy, A.; Saha, M.; Fattah, M.A.; Almulhim, A.I.; Faisal, A.-A.; Al Rakib, A.; Jahir, D.M.A.; Rahaman, Z.A.; Bakshi, A.; et al. Modelling the impacts of land use/land cover changing pattern on urban thermal characteristics in Kuwait. Sustain. Cities Soc. 2022, 86, 104107. [Google Scholar] [CrossRef]
  26. Saelens, B.E.; Sallis, J.F.; Black, J.B.; Chen, D. Neighborhood-based differences in physical activity: An environment scale evaluation. Am. J. Public Health 2003, 93, 1552–1558. [Google Scholar] [CrossRef]
  27. Lundberg, M.; Squire, L. The simultaneous evolution of growth and inequality. Econ. J. 2003, 113, 326–344. [Google Scholar] [CrossRef]
  28. Wang, H.N.; Cheng, Z.M.; Smyth, R. Parental early-life exposure to land reform and household investment in children’s education. World Dev. 2024, 173, 106391. [Google Scholar] [CrossRef]
  29. Birdsall, N.; Londono, J.L. Asset Inequality Matters: An Assessment of the World Bank’s Approach to Poverty Reduction. Am. Econ. Rev. 1997, 87, 32–37. Available online: https://www.jstor.org/stable/2950879?seq=1 (accessed on 13 May 2025).
  30. Liu, Z.Y.; Chang, Y.H.; Pan, S.Q.; Zhang, P.; Tian, L.; Chen, Z. Unfolding the spatial spillover effect of urbanization on composite ecosystem services: A case study in cities of Yellow River Basin. Ecol. Indic. 2024, 158, 111521. [Google Scholar] [CrossRef]
  31. Fan, Y.; Fu, Y.Q.; Qian, Z.H. Time-varying and land use-induced spillover effects of urban redevelopment: Evidence from Hong Kong. Cities 2024, 146, 104760. [Google Scholar] [CrossRef]
  32. Qi, F.Y.; Guo, D.; Xu, Y.P.; Liu, X.; Liu, P.; Xie, Y. How does circulation industry agglomeration help close the income gap between urban and rural areas?—Evidence from China. Socio-Econ. Plan. Sci. 2024, 94, 101952. [Google Scholar] [CrossRef]
  33. Xu, H.Y. The long-term health and economic consequences of improved property rights. J. Public Econ. 2021, 201, 104492. [Google Scholar] [CrossRef]
  34. Wu, W.J.; Zhao, S.Q.; Zhu, C.; Jiang, J. A comparative study of urban expansion in Beijing, Tianjin and Shijiazhuang over the past three decades. Landsc. Urban Plan. 2015, 134, 93–106. [Google Scholar] [CrossRef]
  35. Yohannes, H.; Soromessa, T.; Argaw, M.; Dewan, A. Spatio-temporal changes in habitat quality and linkage with landscape characteristics in the Beressa watershed, Blue Nile basin of Ethiopian highlands. J. Environ. Manag. 2021, 281, 111885. [Google Scholar] [CrossRef]
  36. Ge, K.; Wang, Y.; Liu, X.; Hu, L.; Ke, S.; Jiang, X.; Zhang, W. Spatial effects and influence mechanisms of urban land use green transition on urban carbon emissions. Ecol. Indic. 2025, 172, 113261. [Google Scholar] [CrossRef]
  37. Yu, H.; Zheng, C.F. Environmental regulation, land use efficiency and industrial structure upgrading: Test analysis based on spatial durbin model and threshold effect. Heliyon 2024, 10, e26508. [Google Scholar] [CrossRef]
  38. Xu, X.F.; Yu, W.Q.; Zhao, X.J.; Xu, W. Reassessing the linkage between natural resources and economic growth in China: Delving into the impacts of national resource taxes, renewable energy, financial advancements, and provincial fiscal expenditures. Resour. Policy 2023, 86, 104293. [Google Scholar] [CrossRef]
  39. Ott, J.C. Government and Happiness in 130 Nations: Good Governance Fosters Higher Level and More Equality of Happiness. Soc. Indic. Res. 2011, 102, 3–22. [Google Scholar] [CrossRef]
  40. LeSage, J.; Pace, R.K. Introduction to Spatial Econometrics, 1st ed.; Chapman and Hall/CRC: New York, NY, USA, 2009. [Google Scholar] [CrossRef]
  41. Jiang, T. Mediating Effects and Moderating Effects in Causal Inference. China Ind. Econ. 2022, 05, 100–120. [Google Scholar] [CrossRef]
  42. Yang, J.; Li, Z.G.; Zhang, D.; Yu, K.; Zhong, J.; Zhu, J. Spatial distribution characteristics and variability of urban ecological welfare performance in the Yangtze River economic Belt: Evidence from 70 cities. Ecol. Indic. 2024, 160, 111846. [Google Scholar] [CrossRef]
  43. Xia, C.Y.; Dong, Z.Y.Z.; Wu, P.; Dong, F.; Fang, K.; Li, Q.; Li, X.; Shao, Z.; Yu, Z. How urban land-use intensity affected CO2 emissions at the county level: Influence and prediction. Ecol. Indic. 2022, 145, 109601. [Google Scholar] [CrossRef]
  44. Chen, Z.Q.; Yu, B.L.; Yang, C.S.; Zhou, Y.; Yao, S.; Qian, X.; Wang, C.; Wu, B.; Wu, J. An extended time series (2000–2018) of global NPP-VIIRS-like nighttime light data from a cross-sensor calibration. Earth Syst. Sci. Data 2021, 13, 889–906. [Google Scholar] [CrossRef]
  45. Fan, J.; Zhou, L. Three-dimensional intergovernmental competition and urban sprawl: Evidence from Chinese prefectural-level cities. Land Use Policy 2019, 87, 104035. [Google Scholar] [CrossRef]
  46. Si, W.T.; Zhang, N.H.; Ye, H.P.; Li, Y. Urbanization in the Beijing-Tianjin-Hebei urban agglomeration in China based on long-term nighttime light data. Resour. Sci. 2022, 44, 2114–2124. [Google Scholar] [CrossRef]
  47. Xu, R.; Yue, W.; Wei, F.; Yang, G.; He, T.; Pan, K. Density pattern of functional facilities and its responses to urban development, especially in polycentric cities. Sustain. Cities Soc. 2021, 76, 103526. [Google Scholar] [CrossRef]
  48. Yu, B. Industrial structure, technological innovation, and total-factor energy efficiency in China. Environ. Sci. Pollut. Res. 2020, 27, 8371–8385. [Google Scholar] [CrossRef]
  49. Li, C.; Li, Q.; Hong, T. How can local government capacity lift the ‘resource curse’? A study from the perspective of industrial structure transformation. J. Environ. Manag. 2024, 370, 122633. [Google Scholar] [CrossRef]
  50. Yu, C.Z.; Jin, H. Labor Agglomeration, Industrial Structure Upgrading and Low-carbon Economic Development. Financ. Res. Lett. 2024, 74, 106703. [Google Scholar] [CrossRef]
  51. Meng, X.; Ding, T.; Wang, H.S. Incentives for local government expenditures on people’s livelihood: The role of high-speed rail. Socio-Econ. Plan. Sci. 2023, 89, 101700. [Google Scholar] [CrossRef]
  52. Xiao, P.; Liu, Y.W.; Dai, L.T. How Does the Supply of Urban Public Services Promote Regional Innovation: A Test Based on the Agglomeration Effects of Talents and Industries. Econ. Surv. 2024, 41, 3–15. [Google Scholar] [CrossRef]
  53. Khan, N.H.; Ju, Y.; Hassan, S.T. Investigating the determinants of human development index in Pakistan: An empirical analysis. Environ. Sci. Pollut. Res. 2019, 26, 19294–19304. [Google Scholar] [CrossRef] [PubMed]
  54. Mustafa, G.; Rizov, M.; Kernohan, D. Growth, human development, and trade: The Asian experience. Econ. Model. 2017, 61, 93–101. [Google Scholar] [CrossRef]
  55. Xie, X.X.; Peng, L.; Yan, Z.; Zhou, W.; Zou, J.; Wang, X.; Wang, L.; Guo, T.; Ma, P.X.; He, Y.; et al. Equity of health resource distribution in China during 2009–15: An analysis of cross-sectional nationwide data. Lancet 2017, 390, S6. [Google Scholar] [CrossRef]
  56. Lei, Q.; Najam, H.; Oskenbayev, Y.; Alisher, S.; Hairis, K. Impact of rapid urban construction land expansion on spatial inequalities of ecosystem health in China: Evidence from national, economic regional, and urban agglomeration perspectives. Ecol. Indic. 2025, 172, 113196. [Google Scholar] [CrossRef]
  57. Chen, W.X.; Zeng, J.; Li, N. Change in land-use structure due to urbanisation in China. J. Clean. Prod. 2021, 321, 128986. [Google Scholar] [CrossRef]
  58. Chen, Q. Advanced Econometrics and Stata Applications, 2nd ed.; Higher Education Press: Beijing, China, 2014. [Google Scholar]
  59. Wei, G.; He, B.; Liu, Y.; Li, R. How does rapid urban construction land expansion affect the spatial inequalities of ecosystem health in China? Evidence from the country, economic regions and urban agglomerations. Environ. Impact Assess. Rev. 2024, 106, 107533. [Google Scholar] [CrossRef]
  60. Iamsiraroj, S. The foreign direct investment-economic growth nexus. Int. Rev. Econ. Financ. 2016, 42, 116–133. [Google Scholar] [CrossRef]
  61. Wen, Y.; Yu, Z.; Xue, J.; Liu, Y. How heterogeneous industrial agglomeration impacts energy efficiency subject to technological innovation: Evidence from the spatial threshold model. Energy Econ. 2024, 136, 107686. [Google Scholar] [CrossRef]
  62. Cao, B.; Meng, F.; Li, B. Spatial effects of innovation ecosystem development on low-carbon transition. Ecol. Indic. 2023, 157, 111277. [Google Scholar] [CrossRef]
  63. Guo, D.J.; Yu, B.X. Empirical study on family planning and insufficient demand for resident consumption-Theory of life cycle under the dual economic structure. Economist 2016, 08, 29–37. [Google Scholar] [CrossRef]
  64. Luo, N.S.; Xiong, S.P.; Li, J.M.; Zhu, X.Y. Research on the Impact and Mechanism of Digital Inclusive Finance on Urban Pollution Reduction and Carbon Reduction. J. Manag. 2024, 37, 95–111. [Google Scholar] [CrossRef]
  65. Lu, M.; Yang, R.D.; Xu, X.X. The Economics of Great Powers: Toward a Long-Term, Global, and Multidimensional Development of China, 1st ed.; Shanghai People’s Publishing House Co., Ltd.: Shanghai, China, 2023. [Google Scholar]
  66. Duranton, G.; Puga, D. Urban Growth and Its Aggregate Implications. Econometrica 2023, 91, 2219–2259. [Google Scholar] [CrossRef]
  67. Au, C.; Henderson, J.V. Are Chinese Cities Too Small? Rev. Econ. Stud. 2006, 73, 549–576. [Google Scholar] [CrossRef]
  68. Wang, L.L.; Qiao, X. Internal Migration, City Size and Productivity in China. Q. J. Econ. 2020, 19, 165–188. [Google Scholar] [CrossRef]
  69. Fu, M.; Jiao, L.; Su, J. Urban land system change: Spatial heterogeneity and driving factors of land use intensity in Wuhan, China. Habitat Int. 2025, 159, 103380. [Google Scholar] [CrossRef]
Figure 1. Changes in urban construction land in typical regions of China. Note: (1) Based on the Department of Natural Resources Standard Map Service website GS (2019)1822 (http://bzdt.ch.mnr.gov.cn/, accessed on 17 July 2024). Standard maps were produced with no modification to the base map boundaries, same as below; (2) extraction of urban built-up land area with impervious surface data from Harvard Dataverse [10].
Land 14 01085 g001
Figure 2. Theoretical framework for the impact of land use intensity on urban spatial welfare.
Land 14 01085 g002
Figure 3. Research area map. Note: According to the socio-economic development situation and the development orientation of each economic subregion, Chinese cities are divided into four categories: eastern region, central region, western region, and northeastern region [56].
Land 14 01085 g003
Figure 4. Box plot of urban welfare (HDI).
Land 14 01085 g004
Figure 5. Violin plot of land use intensity (ULUI).
Land 14 01085 g005
Figure 6. Spatial differentiation pattern of urban spatial welfare (HDI).
Land 14 01085 g006
Figure 7. Spatial differentiation pattern of ULUI.
Land 14 01085 g007
Figure 8. Geographic decay processes in the spatial impact of ULUI on HDI.
Land 14 01085 g008
Table 1. Descriptive statistics of variables.
Variable CategoriesVariablesObsMeanSdMinMaxVIF
Explained variableHDI34080.5670.1090.3131.000--
Explanatory variableULUI34080.2050.1160.1000.9291.90
Mediating variableslnRat34081.6731.057−0.2137.5892.10
lnAdv34081.0900.6130.1145.3481.61
lnAgg34080.0790.2630.0045.1472.40
lnSca340813.9771.05710.10118.2414.72
lnStr34080.4170.0560.1590.6101.42
lnPub34080.0180.0320.0010.4852.47
Control variablesurb340857.31514.83620.788100.0004.59
lnGDP340810.7550.5618.77312.4564.83
lnFD34089.8882.092−0.62214.9412.32
lnIC34087.6260.5715.5839.1422.87
lnMed34089.6830.7237.20912.0862.69
Table 2. Spatial autocorrelation test.
YearHDIULUIYearHDIULUI
20110.326 ***0.606 ***20170.310 ***0.610 ***
(8.30)(15.47)(7.88)(15.54)
20120.311 ***0.624 ***20180.323 ***0.609 ***
(7.90)(15.88)(8.21)(15.52)
20130.325 ***0.611 ***20190.307 ***0.609 ***
(8.25)(15.57)(7.81)(15.51)
20140.303 ***0.616 ***20200.304 ***0.613 ***
(7.70)(15.67)(7.72)(15.62)
20150.305 ***0.616 ***20210.306 ***0.612 ***
(7.75)(15.67)(7.77)(15.61)
20160.301 ***0.615 ***20220.309 ***0.612 ***
(7.66)(15.66)(7.87)(15.60)
Note: *** stands for the significance of 1% levels; the z-statistics is shown in parenthesis.
Table 3. Results of model identification tests.
Test TypeSEMSARResults
LM test532.065 ***8.904 ***SDM
Robust LM test648.798 ***125.636 ***
LR test28.29 ***30.90 ***SDM
Wald test85.65 ***102.59 ***SDM
Hausman testchi2(6) = −715.66 < 0
Note: *** stands for the significance at the 1% levels; the z-statistics is shown in parenthesis.
Table 4. Baseline estimate results.
Variables(1)(2)(3)
OLSSDM-RESDM-FE
ULUI0.086 ***0.357 ***0.203 ***
(7.44)(10.30)(11.14)
urb0.004 ***0.004 ***0.003 ***
(36.69)(19.54)(11.00)
lnGDP0.055 ***0.031 ***0.021 ***
(16.69)(9.36)(6.48)
lnFD−0.006 ***−0.002 ***−0.002 ***
(−9.25)(−5.31)(−4.40)
lnIC0.006 **0.008 ***0.007 ***
(2.51)(3.83)(3.00)
lnMed0.022 ***0.022 ***0.027 ***
(12.40)(7.38)(7.14)
W* ULUI −0.244 ***−0.081 ***
(−5.35)(−3.37)
ρ 0.086 ***0.105 ***
(4.47)(4.49)
R20.7870.7610.505
Observations340834083408
Note: *** and ** stand for the significance of 1% and 5% levels; the z-statistics is shown in parenthesis.
Table 5. Decomposition of spatial effects (SDM).
VariablesSDM-RESDM-FE
Direct EffectIndirect EffectTotal EffectDirect EffectIndirect EffectTotal Effect
ULUI0.354 ***−0.227 ***0.127 ***0.202 ***−0.065 ***0.137 ***
(10.16)(−5.03)(4.21)(11.00)(−2.74)(8.16)
urb0.004 ***0.000 ***0.004 ***0.003 ***0.000 ***0.004 ***
(20.30)(4.21)(19.54)(11.62)(4.15)(11.82)
lnGDP0.031 ***0.003 ***0.033 ***0.021 ***0.002 ***0.024 ***
(9.66)(4.04)(9.73)(6.67)(3.66)(6.70)
lnFD−0.002 ***−0.000 ***−0.003 ***−0.002 ***−0.000 ***−0.002 ***
(−5.51)(−3.59)(−5.58)(−4.53)(−3.08)(−4.52)
lnIC0.007 ***0.001 ***0.008 ***0.007 ***0.001 ***0.007 ***
(4.05)(3.17)(4.10)(3.17)(2.72)(3.22)
lnMed0.022 ***0.002 ***0.024 ***0.027 ***0.003 ***0.030 ***
(7.48)(3.71)(7.44)(7.27)(3.48)(7.09)
Note: *** stands for the significance of 1% levels; the z-statistics is shown in parenthesis.
Table 6. Robustness test results.
Variables(1)(2)(3)(4)(5)(6)(7)(8)
Replacing the Weight MatrixAdjusting Control VariablesRevising Weighting MethodRecomputing Explained VariablesIncorporating Environmental DimensionExcluding Exogenous EventsLagging Core VariablesIV
(GS2SLS)
W.HDI −0.009 ***
(−3.73)
ULUI0.227 ***0.180 ***0.336 ***2.268 ***1.423 ***0.359 ***0.335 ***0.226 ***
(8.08)(4.06)(12.75)(12.36)(2.74)(8.86)(9.72)(10.58)
W* ULUI−0.316 ***−0.171 ***−0.348 ***−2.282 ***−1.258 *−0.268 ***−0.249 ***
(−3.16)(−3.22)(−9.61)(−8.97)(−1.89)(−5.15)(−5.52)
Direct effect0.227 ***0.180 ***0.313 ***2.168 ***1.432 ***0.357 ***0.332 ***
(7.95)(4.01)(12.38)(12.08)(2.71)(8.73)(9.57)
Indirect effect−0.436 **−0.166 ***−0.327 ***−2.130 ***−1.218 *−0.256 ***−0.237 ***
(−1.97)(−3.03)(−7.00)(−8.04)(−1.91)(−4.95)(−5.27)
Total effect−0.2090.014−0.0140.0390.2140.101 ***0.095 ***
(−0.99)(0.41)(−0.33)(0.19)(0.52)(2.94)(3.24)
ρ0.505 ***0.045 **0.474 ***0.276 ***0.040 ***0.068 ***0.075 ***
(8.90)(1.99)(30.50)(14.44)(2.57)(3.13)(3.82)
R20.7560.7980.5140.3600.4350.7590.770
F-statistic 898.166
Observations34081988340834083408255631243408
ControlsYesYesYesYesYesYesYesYes
Note: ***, **, and * stand for the significance of 1%, 5%, and 10% levels; the z-statistics is shown in parenthesis.
Table 7. Estimates of spatial heterogeneity.
Variables(1)(2)(3)(4)(5)(6)
City LongitudeEastern CitiesNon-Eastern CitiesCity
Scale
MegacitiesNon-Megacities
Direct effect, ULUI0.323 ***0.176 ***0.433 ***0.331 ***0.193 ***0.176 ***
(9.16)(4.66)(6.07)(8.43)(5.31)(3.26)
Indirect effect, ULUI−0.193 ***0.083−0.378 ***−0.212 ***0.043−0.053
(−4.08)(1.34)(−4.17)(−4.62)(1.08)(−0.79)
Total effect, ULUI0.130 ***0.258 ***0.0550.119 ***0.236 ***0.123 **
(3.82)(5.42)(0.98)(3.70)(6.36)(2.53)
Direct effect, ULUI*P0.011 ** 0.000 ***
(2.48) (2.68)
Indirect effect, ULUI*P0.001 ** 0.000 **
(2.17) (2.29)
Total effect, ULUI*P0.012 ** 0.000 ***
(2.48) (2.70)
ρ0.088 ***0.185 ***0.081 ***0.073 ***0.138 ***0.083 ***
(4.64)(4.91)(2.70)(3.79)(4.56)(3.38)
R20.7690.8170.7560.7730.8580.686
Observations340813682040340810802328
ControlsYesYesYesYesYesYes
Note: (1) *** and ** stand for the significance of 1% and 5% levels; the z-statistics is shown in parenthesis; (2) due to space constraints, only the results of the spatial effects decomposition are reported in this section.
Table 8. Estimation results of spatial impact mechanisms.
Variables(1)(2)(3)(4)(5)(6)(7)
lnRatlnAdvlnAgglnScalnStrlnPubLnSyn
ULUI4.299 ***1.329 ***0.145 *1.611 ***0.068 **0.035 **0.214 ***
(7.84)(4.15)(1.84)(4.48)(2.09)(2.50)(8.95)
Direct effect4.166 ***1.233 ***0.155 **1.678 ***0.078 **0.033 **0.209 ***
(7.83)(3.99)(1.98)(4.73)(2.45)(2.43)(8.97)
Indirect effect−2.680 ***−1.959 ***0.211 *1.409 ***0.142 ***−0.055 ***−0.118 ***
(−3.18)(−3.86)(1.84)(2.59)(3.08)(−2.76)(−3.26)
Total effect1.486 **−0.727 *0.366 ***3.087 ***0.219 ***−0.0220.091 ***
(2.24)(−1.89)(4.72)(8.03)(5.76)(−1.62)(3.25)
ρ0.328 ***0.313 ***0.176 ***0.203 ***0.359 ***0.180 ***0.296 **
(15.25)(15.08)(8.30)(8.93)(19.05)(6.35)(13.22)
R20.3680.3580.0010.7430.2020.0430.346
Observations3408340834083408340834083408
ControlsYesYesYesYesYesYesYes
Note: (1) ***, **, and * stand for the significance of 1%, 5%, and 10% levels; the z-statistics is shown in parenthesis; (2) due to space constraints, only the results of the spatial effects decomposition are reported in this section; (3) in the synergy index constructed based on the entropy weight method, the weights of the variables lnRat, lnAdv, lnAgg, lnSca, lnStr, and lnPub are 0.236, 0.231, 0.155, 0.232, 0.085, and 0.061, respectively.
Disclaimer/Publisher’s Note: The statements, opinions and data contained in all publications are solely those of the individual author(s) and contributor(s) and not of MDPI and/or the editor(s). MDPI and/or the editor(s) disclaim responsibility for any injury to people or property resulting from any ideas, methods, instructions or products referred to in the content.

