1. Introduction
Rural areas in the EU are an essential part of the European way of life, widely appreciated for their role in food production, natural resource management, landscape preservation, and opportunities for recreation and tourism [
1]. Life in many rural areas is closely tied to agriculture, with over 40% of rural land dedicated to agricultural use [
2]. Agriculture and rural development are closely interconnected. While agriculture primarily fulfills its fundamental role of food production, it also significantly influences rural development, food security, and soil quality [
3,
4,
5]. Moreover, it contributes to national income, generates employment, shapes foreign trade, supplies food to the population, provides raw materials for industry, and plays a crucial role in environmental protection [
6,
7,
8,
9,
10]. Agricultural systems have traditionally been recognized as key drivers in balancing and integrating economic, social, and environmental objectives [
11,
12].
For these reasons, rural development has become a key priority within the EU’s Common Agricultural Policy (CAP) emphasizing the multi-functionality of agriculture, economic diversification, innovation and knowledge transfer, and the preservation of cultural and environmental heritage [
13]. Furthermore, the importance of agriculture in promoting rural development is underscored by its contribution to achieving several Sustainable Development Goals (SDGs), particularly SDG 1 (No Poverty), SDG 2 (Zero Hunger), SDG 8 (Decent Work and Economic Growth), SDG 12 (Responsible Consumption and Production), and SDG 15 (Life on Land) [
14]. These goals reflect agriculture’s vital role in ensuring food security, generating employment, supporting sustainable livelihoods, and preserving natural resources in rural areas.
Despite these policy efforts, EU rural areas continue to face persistent challenges. Predominantly rural regions cover nearly half of the European Union’s territory (44.7%) and are home to 20.8% of the EU’s population [
15]. In 2023, agriculture (including forestry and fisheries) accounted for 17.6% of all rural employment—down from 23.36% in 2010, with the number of people employed in the sector falling from 11.59 million in 2010 to 8.98 million in 2023 [
16]. Over the past few decades, European agriculture has seen a steady decline in the number of agricultural holdings, accompanied by a trend towards larger holdings [
17]. Between 2010 and 2020, the number of farms in the EU significantly decreased, dropping from 12,008,480 to 9,067,300. By 2020, this figure represented only 75.5% of the total number of farms in 2010 [
18]. The rates of decline in both the number of farm holdings and average farm size vary from one country to another, highlighting notable differences between Eastern European, Mediterranean, and Western countries. Despite this decline in employment and the number of holdings, agriculture’s contribution to rural gross value added (GVA) has remained relatively stable, averaging around 4% over the same period [
19]. In parallel, the rural economy has become increasingly diversified, with other sectors—such as services (e.g., agri-tourism and recreation)—gaining prominence and signaling a structural shift in many rural EU economies [
1]. Although gross domestic product (GDP) per capita in rural regions has significantly increased since 2010 (from EUR 17,000 to EUR 24,180) and the gap between rural and urban areas has narrowed, rural GDP per capita remained substantially lower in 2021, reaching only 58.6% of the EU urban average [
20]. Moreover, statistical data show that the at-risk-of-poverty rate in 2022 was higher in rural areas (17.5%) compared to towns and suburbs (15.9%) and cities (16.3%), and in twelve EU countries, the poverty rate in rural areas has risen since 2010 [
21]. Furthermore, empirical studies [
22,
23,
24,
25] have also highlighted that, for a long time, rural areas in the EU have faced numerous socio-economic and demographic challenges, such as poverty, social exclusion, high unemployment, low income levels, an aging and declining population, and a strong dependence on the agricultural sector.
Although the agricultural sector’s share in rural economies and employment has declined over time, its unique characteristics and multi-functionality continue to make it essential for ensuring food security in the EU and supporting sustainable development [
7,
26,
27]. The sector is marked by constant changes and considerable regional variation across the EU and fulfills diverse roles within the national economies of member states [
8,
28,
29,
30]. These evolving dynamics and regional disparities are largely influenced by differences in the structural characteristics, production capacities, and efficiencies of agricultural holdings [
9,
31,
32].
There is a broad recognition that the structural characteristics of agricultural holdings can influence agricultural performance and broader rural development, including economic, physical, and labor sizes; investment levels; EU subsidies; the agricultural training of farm managers; and input intensity [
32,
33,
34,
35]. The debate over whether small farms perform better than large farms, or whether farms receiving more EU funding outperform those receiving less, in terms of economic, social, and environmental sustainability remains a relevant and widely discussed issue globally. In this context, analyzing the structural characteristics of agricultural holdings is essential for understanding changes and disparities across EU countries. This analysis provides critical insights into the sector’s performance, regional inequalities, and potential pathways for sustainable development within the EU’s agricultural sector.
Building on this context, the aim of this paper is to examine the impact of structural characteristics of agricultural holdings on their performance and contribution to sustainable rural development across EU member states over the period of 2010–2020. The study focuses on key indicators, such as the economic, physical, and labor sizes of farms; investment levels in machinery and equipment; EU subsidy levels; the agricultural training of farm managers; and farms with input intensity per hectare. Additionally, two key environmental indicators aligned with the EU’s sustainability goals are analyzed: the area under organic farming (SDG 2.40) and ammonia emissions from agriculture (SDG 2.60). By analyzing data from the past decade, this paper seeks to uncover patterns and trends that highlight the role of structural factors in shaping the sustainability and competitiveness of the agricultural sector.
This paper presents a novel and comprehensive analysis of the ways in which structural changes in EU agriculture over the past decade have influenced rural development outcomes, using a combination of statistical techniques, including paired samples t-tests, PCA, cluster analysis, and hierarchical regression. The study classifies 23 EU countries into five distinct clusters based on farming models and performance indicators. By moving beyond generalized EU-level assessments, it highlights heterogeneity, the uneven pace of agricultural transformation across member states, and the dual-speed nature of modernization. The paper critically addresses the socio-economic disparities that continue to affect rural regions, and its multidimensional clustering represents a significant contribution as it uncovers nuanced patterns and challenges that a one-size-fits-all policy approach cannot adequately address.
Although this study relies on national-level aggregated data and is constrained to the 2010–2020 period due to data availability, it provides a robust and policy-relevant snapshot of long-term structural shifts. Importantly, the analysis identifies common trends and country-specific divergences and offers valuable insights for the design of more differentiated and context-sensitive policy responses. By integrating structural agricultural data with rural development indicators, the study offers a timely contribution to debates on post-2020 CAP reforms and the future of EU rural policy. It emphasizes the need for inclusive modernization strategies that consider not only productivity but also equity, social cohesion, and environmental and territorial balance.
2. Theoretical Background and Research Hypotheses
The agricultural sector creates strong multiplier effects and drives socio-economic development in rural areas by supporting employment, income, and positive spill-overs across upstream and downstream rural sectors like local services, manufacturing, and tourism [
36,
37]. Agriculture, through its links with other economic sectors, plays a key role in integrated rural development. Moreover, the newly implemented Common Agricultural Policy (CAP) impacts not only the primary sector but also regional output, employment, and household income [
38].
An efficient agricultural sector is regarded as a cornerstone of a highly competitive food industry, which makes it a vital component of the economy and trade, with significant influence on international markets [
4,
27]. Agriculture is crucial in maintaining food security and guaranteeing access to affordable food throughout the EU member states [
9,
39]. The role of agricultural productivity growth as a key catalyst for economic development, through its link between agricultural transformation and rural transformation, has long been recognized by economists and policymakers [
40]. Growth in agricultural productivity has a stronger poverty-reducing effect in poorer countries than in developed ones. This impact diminishes as average incomes rise due to agriculture’s shrinking role in the economy and the decreasing effectiveness of productivity gains in reducing poverty [
41]. An attribution analysis conducted by Erumban and de Vries [
42], which covers 42 developing countries in Asia and sub-Saharan Africa from 1990 to 2018, suggests that structural change and rising agricultural productivity played a significant role in reducing poverty.
The role, performance, and competitiveness of the agricultural sector within the national economy vary considerably across EU regions [
7,
8,
28,
30]. These regional disparities are reflected in key indicators such as the sector’s contribution to total GVA, the share of agricultural workers in overall employment, and the productivity of agricultural production factors [
4,
10,
25,
43].
Studies [
31,
34,
44] have highlighted that agricultural performance and competitiveness are influenced by various factors, among which the structural characteristics and performance of agricultural holdings play a key role. According to Sauer and Moreddu [
32], farms or agricultural holdings as production units vary across numerous characteristics, including dimension, production structure, input intensity, capital resources, production diversity, market orientation, openness to cooperation, environmental impact, innovation practices, and individual farmer characteristics such as age and education, as well as geographic and locational factors.
The development of agriculture and rural areas depends on the efficient use of key production factors—land, labor, and technology. Studies [
35,
44,
45,
46,
47] highlight a complex relationship between farm size and factor productivity, shaped by economies of scale, management efficiency, and access to technology. Farm size can be assessed by economic output, land area, or labor input. The interaction of these factors influences productivity, efficiency, and sustainability.
Agricultural competitiveness is closely linked to farm size and the advantages of operating at scale, with clear connections between production systems, efficiency, and productivity [
7]. Chiarella et al. [
45], using standardized data from 32 developing countries between 2005 and 2020, highlighted that labor productivity and technical efficiency increase with farm size, while land productivity and labor intensity decrease nonlinearly as farm size grows. In a study on thirteen countries, Sauer and Moreddu [
32] found that the most productive farms tend to be larger than average and rely more heavily on hired labor. In contrast, the least productive farms are typically smaller and depend primarily on family labor. Additionally, farms that invest in innovation, through new technologies and the development of new activities, are more likely to achieve higher productivity levels. Moreover, investment in agricultural holdings is crucial for boosting farm competitiveness and promoting sustainable development as it supports food security while minimizing environmental impact [
26,
48,
49,
50].
Noack and Larsen [
51] showed that agricultural income tends to increase with farm size. The authors also emphasized that increasing stable incomes from agriculture and food production in developing countries plays a key role in reducing global poverty. According to Antošová et al. [
52], farm size and production orientation are key factors that influence agricultural income differences across EU countries. They also highlight the role of the economic status of individuals working in agriculture and note that the highest agricultural incomes are found in countries where agricultural workers are primarily employees (e.g., Ireland and Slovakia), while the lowest incomes occur in countries with a high number of agricultural households and predominantly self-employed farmers (e.g., Romania). The relatively low agricultural income compared to national income is largely due to lower labor efficiency in agriculture compared to the secondary and tertiary sectors. Although agricultural income has increased in absolute terms, partly due to CAP subsidies and direct payments, income gaps persist, as input productivity in industry and services has grown faster than agricultural productivity [
43].
Farm size, determined by the land area utilized, has significant economic, social, and environmental implications. Excessive land fragmentation often leads to low farmer incomes, outdated technologies, limited production, and weak capital accumulation, all of which hinder competitiveness. In contrast, excessively large farms can exert pressure on the environment, reduce rural employment opportunities, undermine local food traditions, and encourage unsustainable agricultural practices that negatively impact quality of life [
53]. Therefore, a major challenge for farmers is to optimize the size of their agricultural holdings to use resources efficiently and ensure long-term farm sustainability.
The role of small farms in the economy has often been debated in the literature [
5,
35,
54,
55]. Some studies highlight their reliance on traditional technologies, inefficient use of limited resources, and association with poverty [
10,
41,
42]. They are commonly perceived as having low efficiency and productivity, along with limited market integration, which contributes to inadequate household income [
29,
56]. Recent studies emphasize that the role of small family farms in rural and economic development should not be underestimated. In the 21st century, their importance has grown, which reflects a broader shift in agribusiness priorities, from promoting large-scale industrial agriculture to supporting more sustainable models. Small farms play a vital role in this context as they contribute not only to food production but also to the provision of social and environmental public goods [
54,
56,
57,
58,
59]. Sulewski et al. [
60] highlights that family farms (small farms) are crucial to the long-term sustainability of rural areas focused on agriculture. This is due to their distinctive socio-economic characteristics, heightened awareness of natural resource use, and commitment to environmentally friendly practices. According to Borychowski et al. [
56], small-scale farming is considered more environmentally friendly as it offers benefits such as biodiversity conservation, reduced use of fertilizers and pesticides, and improved animal welfare. Research has also highlighted the role of small farms in reducing rural poverty and depopulation while contributing to the provision of environmental benefits [
55,
61].
The implications of farm size on farm performance across the EU remain insufficiently explored. Therefore, this paper seeks to address that gap by examining the relationship between economic, physical, and labor sizes and the socio-economic performance of agricultural holdings.
The trajectory of agrarian change in the EU has been influenced by a combination of factors, including technological advancements, environmental challenges, global trade dynamics, and multi-level policy interventions. Among the various forces shaping the EU agri-food sector and the structure and performance of farms, the Common Agricultural Policy plays a central role [
47,
62]. Several studies [
46,
63,
64] have highlighted the role of agricultural subsidies in farm development and rural advancement and noted that subsidies remain a contentious issue in the global policy debate. The importance of direct payments under the Common Agricultural Policy in EU countries is highlighted by their role in ensuring the productivity of the farming sector and maintaining the standard of living for farmers [
65].
Mishra et al. [
64] offer a comprehensive review of the existing literature and data analysis to assess the effectiveness of various subsidy programs in boosting agricultural output and stabilizing incomes across the world, with a specific focus on Asia and India. Their findings indicate that while subsidies have led to short-term improvements in production and farmer incomes, their long-term effects on profitability and sustainability are less clear. Similarly, Staniszewski and Borychowski [
66], while analyzing the impact of subsidies on farm efficiency in Poland, found a statistically significant positive effect only among the largest farms. Guth et al. [
67] show that subsidies influence agricultural income by favoring large farms, thereby contributing to growing disparities within the EU agricultural sector. Mamun [
63], using a long time series on the nominal rate of assistance for 42 countries, representing over 80% of global agricultural production, highlighted that different subsidy instruments have heterogeneous effects, which vary depending on the chosen measure of productivity. Overall, empirical evidence on the relationship between subsidies and productivity growth is mixed, with studies reporting negative, insignificant, or positive effects [
46,
63].
Farm economic performance is partly influenced by the individual characteristics of agricultural workers, such as age, experience, and education [
32,
33,
68]. Giannakis and Bruggeman [
33], in their analysis of EU agricultural sector performance, which was measured by indicators such as gross value added, land, and labor productivity, found that countries with a younger and better-trained agricultural workforce tend to achieve significantly higher economic outcomes. In fact, economic performance is nearly nine times greater in countries with a highly trained farm workforce, such as the Netherlands and Germany, compared to those with lower levels of training. Education also plays a critical role in the adoption of improved agricultural practices. Better-educated farmers are more likely to understand the importance of climate-smart agriculture and, as a result, better address climate change and improve input use efficiency [
69,
70]. Furthermore, the EPRS Report [
68] identified a positive correlation between farmers’ training levels and farm size across EU countries. Thus, the proportion of farm managers with full agricultural training increases with farm size and is over eight times higher on large farms than on small ones.
Empirical studies [
24,
28,
29,
32,
43,
71] have highlighted that the agricultural sector across European Union countries is characterized by significant heterogeneity, with both the structural characteristics of farms and agricultural performance varying from one country to another. This diversity necessitates tailored policy approaches to effectively achieve sustainable rural development.
The literature review highlights the essential role of agriculture in shaping socio-economic dynamics across rural areas in the European Union. The performance of agricultural holdings, measured by productivity, income generation, and competitiveness, is strongly influenced by structural characteristics such as farm size, investment in innovation and technology, the education levels of farmers, and access to capital. While larger and more capital-intensive farms tend to exhibit higher productivity and income levels, smaller farms also significantly contribute to environmental sustainability, food security, and social cohesion in rural areas. Moreover, disparities in agricultural performance and income distribution across EU member states suggest that structural characteristics play an uneven role in determining outcomes, all of which are further shaped by policy interventions, particularly Common Agricultural Policy subsidies.
Despite these insights, there remains a lack of comprehensive comparative analysis of how the structural characteristics of farms translate into performance outcomes and impacts on rural development across EU countries. This research aims to address that gap by empirically investigating the relationship between the structural dimensions of agricultural holdings and their socio-economic outcomes, both at the sectoral and rural levels. Accordingly, the hypotheses of this study are grounded in the literature’s emphasis on the evolving nature of EU agriculture, the role of structural efficiency, and the complex interaction between farm-level dynamics and macro-level rural development.
Based on this background, the following hypotheses (H) are proposed to guide the empirical investigation:
H1. There have been significant changes in the structural characteristics of agricultural holdings and agricultural performance across EU countries over the past decade.
H2. Higher efficiency in the structural characteristics of agricultural holdings—such as a larger average farm size, greater investment in innovation and technology, and higher levels of agricultural training—is positively associated with agricultural performance across EU countries.
H3. EU countries exhibit both distinct differences and common patterns in the relationship between the structural characteristics of agricultural holdings and agricultural performance.
H4. Rural development indicators—such as rural GDP per capita, the at-risk-of-poverty rate in rural areas, and the in-work at-risk-of-poverty rate among self-employed persons—have undergone significant changes across EU countries over the past decade.
H5. Growth in agricultural performance significantly contributes to rural development outcomes in EU countries.
These hypotheses aim to capture both temporal changes and cross-country heterogeneity in the EU agricultural sector and to test whether structural improvements in agricultural holdings lead to measurable performance gains and rural development benefits.
4. Results and Discussion
An overview of the role of agriculture in the national economy can be illustrated by the share of agriculture in the GVA and employment, as well as by family farm income relative to average wages in the overall economy. The results of the paired samples
t-test (
Table 2) indicate that, on average, in the EU-23 countries, employment in agriculture (as the % of total employment) significantly decreased (
p = 0.006) between 2010 and 2020, from 7.12% to 5.58%. Meanwhile, agriculture’s overall contribution to GVA remains relatively stable at approximatively 2.5% of the total GVA, suggesting that other sectors of the economy were growing at a similar or faster pace.
Figure 1 shows large disparities between EU countries in terms of both employment and GVA in agriculture for the years 2010 and 2020. The highest share of employment in agriculture was recorded in Romania (21.6%), followed by Bulgaria (16.7%), Greece (10.4%), and Poland (8.9%). Regarding the share of agriculture in GVA, the highest value was recorded in Latvia (4.7%), followed by Romania (4.5%) and Greece (4.5%). A significant and persistent gap is evident between the share of agriculture in employment and its contribution to GVA across EU countries. This discrepancy can be attributed to differences in the economic performance of the agricultural sector, as well as to the structural characteristics of agricultural holdings [
10,
30]. Similar results were reported by Kolodziejczak [
90], who highlighted the relatively high level of overemployment in agriculture, particularly in less developed but agriculturally active EU countries such as Romania, Bulgaria, and Poland, which negatively impacts labor productivity.
Family farm income compared to the average wages in the whole economy significantly increased from 56.35% in 2010 to 72.90% in 2020 (
p = 0.019), which reflects that, in the analyzed period, family farm incomes were catching up with wages in other sectors, thereby making agriculture more financially competitive. Due to the significant increase in this indicator, our results confirm that the average income of farmers is converging toward the average non-agricultural income, as also highlighted by other authors [
52,
67]. Some authors [
43,
91] have pointed out that this positive trend has been strongly influenced by CAP support. However, the distribution of this support has tended to favor larger farms, increasing disparities within the agricultural sector. Moreover, the data in
Figure 2 highlight notable differences between Eastern and Western countries. This may be due to a larger gap in labor productivity between farmers and workers in other sectors of the national economy in Eastern European countries compared to their Western counterparts [
10,
43].
The results of the paired samples t-test indicate statistically significant differences in the structural characteristics of EU farms between 2010 and 2020 for nearly all nine indicators analyzed, except for the labor size of holdings and agricultural training (
Table 3). Specifically, the average economic and physical size of holdings significantly increased, while the share of subsistence farms and small-scale farms (in physical terms) significantly decreased. There was increased investment in machinery and equipment per farm (GFCF/farm), rising from EUR 11.53 thousand to EUR 17.43 thousand per holding, as well as a higher level of EU subsidies per farm (EAGF/farm), increasing from EUR 8.19 thousand to EUR 10.24 thousand per holding. The share of UAA managed by farms with high input intensity per hectare also rose significantly, from 33.36% to 44.26%, indicating a shift toward more intensive farming practices. Despite the growth in economic and physical farm size, the average labor size per holding remained relatively stable, showing no significant change (from 1.29 to 1.38 AWUs per holding). While the percentage of farms with managers that had agricultural training increased from 37.23% to 42.87%, the change was not statistically significant during the analyzed period.
Our results confirm the general trend in the EU of a declining share of farms with a Standard Output of less than EUR 2000 per holding (subsistence farms), as well as a decrease in the share of farms with less than 5 hectares of UAA (small-scale farms), accompanied by a shift toward larger economic and physical holdings. This trend is also supported by findings from other empirical studies [
34,
36,
61]. It is important to mention here that at the EU-23 level, the number of total farms in 2020 represents only 75.5% of the total number of farms in 2010; thus, the number decreased by almost 3 million farms (from 11.77 to 8.8 million farms) [
18]. Moreover, despite the recognized importance of small farms for the sustainability of agriculture [
54,
55], statistical data show a continuous decline in their number. Between 2010 and 2020, the number of farms with less than five hectares decreased by 31% in the EU-23, falling by 2.60 million—from 8.24 million to 5.64 million.
Figure 3 illustrates the disparities between EU countries in the structural characteristics of farms and highlights differences both in levels and in changes over time.
Also, the results of the paired samples
t-test (
Table 3) show how agricultural performance indicators evolved over the past decade. All three agricultural performance indicators, namely labor productivity (GVA per annual work unit), land productivity (GVA per hectare of UAA), and agricultural factor income (per AWU), respectively, significantly increased in 2020 compared to 2010.
Figure 3 also illustrates significant differences between EU countries in both the level of these indicators and their progress over the analyzed period. For instance, in terms of labor productivity, Greece experienced a decline between 2010 and 2020, from EUR 16.6 thousand per AWU to EUR 12 thousand per AWU. Romania recorded the smallest improvement, with labor productivity increasing by only EUR 3 thousand per AWU. This placed it last among the EU-23 countries, significantly behind Sweden, which ranked first with a labor productivity level of EUR 118 per AWU, approximately 15 times higher than Romania. As for land productivity, the smallest progress was made by Estonia, where land productivity increased by only EUR 0.065 thousand per hectare of UAA compared to Greece, which achieved the highest increase of EUR 1.103 thousand per hectare of UAA. Among EU countries, the Netherlands ranked first, with land productivity exceeding EUR 6 thousand per hectare of UAA. This reflects a significant difference compared to the EU average of EUR 1.26 thousand per hectare of UAA.
We can conclude that there has been a structural shift in EU agriculture over the past decade toward larger, more productive, and capital-intensive farms, accompanied by a decline in small-scale and subsistence farming. Therefore, our results confirm that significant changes in the structural characteristics of agricultural holdings and agricultural performance across EU countries over the past decade have occurred, a fact that validates Hypothesis 1.
This overall trend in the development of the EU agricultural sector, characterized by increased concentration and consolidation, a decline in the number of farms (particularly small ones), and the expansion of larger farms, has also been identified in other empirical studies [
5,
34,
36], albeit for different periods of analysis.
The results of the correlation analysis (
Table 4) highlight that, at the EU level, in both 2010 and 2020, labor productivity and the real agricultural income are strongly and positively correlated with economic size, investment in machinery (GFCF/farm), and EU farm subsidies (EAGF/farm). Conversely, they are strongly and negatively correlated with the share of subsistence farms and small farms in the total number of farms. These results show that EU countries with high levels of investment in machinery, farms with a larger economic size, and high levels of EU farm subsidies, combined with a lower proportion of subsistence and small farms, tend to achieve higher labor productivity and real agricultural income, and vice versa.
Land productivity is strongly and positively correlated with the economic size of farms (r = 0.626) and investment in machinery (r = 0.791), and moderately and negatively correlated with the share of subsistence farms in the total number of farms (r = −0.495).
The physical size of farms shows no significant positive correlation with agricultural performance variables, suggesting that physical size alone does not determine land productivity, labor productivity, or real agricultural income. However, it is observed that positive correlations with labor productivity and real agricultural income became stronger in 2020 compared to 2010. This may indicate that physically larger farms tend to achieve higher income and labor productivity, although the relationship is not as strong as that observed with economic size.
The labor size of farms showed a moderate positive correlation with real agricultural income only in 2020 (r = 0.453). This suggests that increased mechanization and more efficient labor allocation may be contributing to improved farm efficiency, particularly in larger operations. As a result, a shift toward more mechanized labor may reduce the reliance on manual work.
In 2020 compared to 2010, the correlation between EU subsidies (EAGF/farm) and labor productivity (from r = 0.522 to r = 0.503), land productivity (r = 0.249 → r = 0.091), and real income (r = 0.688 → r = 0.622) indicates that while subsidies still support farm income, their impact on productivity appears to be decreasing. This may suggest inefficiencies in subsidy allocation and highlights the need for reforms that better target productive investments. Additionally, the lack of a significant correlation between EU agricultural subsidies and land productivity suggests that financial support alone does not directly lead to increased productivity per hectare. Furthermore, the 2020 correlation results show that EU subsidies were positively correlated with farms’ physical size (r = 0.931), economic size (r = 0.632), and labor size (r = 0.632), while they were negatively correlated with small farms (r = −0.649) and subsistence farms (r = –0.577). These results indicate that larger farms received more EU subsidies than smaller farms, a finding confirmed by other studies [
46,
51,
67]. The positive correlation between EU subsidies and investment in machinery (r = 0.524) suggests that financial support through subsidies plays a significant role in encouraging technological advancements and improving the operational efficiency of farms.
The relationship between high-input farming (measured as the percentage of UAA managed by farms with high input intensity per hectare of total UAA) and all three agricultural performance variables became negative in 2020 compared to 2010. However, only in the case of real income did this relationship become statistically significant (r = 0.11 → r = −0.495). Thus, at the EU level, a higher input intensity per hectare does not necessarily lead to higher labor and land productivity or higher real income; instead, it may even indicate inefficiencies.
The share of farms whose managers have formal agricultural training (basic + full) showed moderate positive correlations with real agricultural income and land productivity (r = 0.445). This suggests that countries with better-trained farm managers (such as the Netherlands, Germany, and France) have higher real income and land productivity. Additionally, the correlation results show that this variable is positively associated with investment in machinery (r = 0.702), economic farm size (r = 0.643), and farm labor size (r = 0.520). These findings are consistent with those of Giannakis and Bruggeman [
33] and the EPRS [
68], who demonstrated that better-trained farmers, particularly those managing larger farms, tend to achieve higher economic performance by being more likely to introduce technological innovations and create new jobs.
The correlation analysis confirms a strong and consistent relationship between structural characteristics and agricultural performance across EU countries. Specifically, countries with larger farms (in economic terms), higher investment in machinery and equipment, and greater levels of EU subsidies per farm tend to achieve significantly higher labor productivity and agricultural income. Conversely, a higher prevalence of small and subsistence farms is negatively associated with these performance indicators. These findings suggest that the structural transformation of agriculture—toward economically larger, capital-intensive, and better-supported farms—is a key driver of improved productivity and income. Additionally, the positive association between agricultural training and performance indicators supports the importance of human capital in enhancing farm efficiency and innovation uptake. While some variables, such as physical farm size and labor input, show weaker correlations, the overall pattern is clear: structural efficiency is a critical determinant of performance. Notably, the declining effectiveness of subsidies on land productivity over time indicates that financial support alone is insufficient unless aligned with structural improvements and productive investment. Therefore, based on this evidence, Hypothesis 2 is confirmed.
To test Hypothesis 3, we considered the cumulative influence of twelve variables related to agricultural performance and the structural characteristics of agricultural holdings (see
Table 1) using Principal Component Analysis (PCA) and cluster analysis.
Table 5 and
Table 6 present the results of the PCA for 2010 and 2020. PCA was applied to reduce the dimensionality of the dataset by identifying key components (factors) that explain the most variance in the data. All variables were subjected to PCA with Varimax rotation (Kaiser normalization).
In 2010, the twelve variables were grouped into two main components (factors) (see
Table 5 and
Table 6), which, together, explain 73.52% of the total variance. Component 1 (PC1), which accounts for 46.85% of the variance, is strongly positively correlated with agricultural income per worker, capital investment in machinery (GFCF/farm), land and labor productivity, economic farm size, and the share of farms whose managers have formal agricultural training (Agric_train). It is also strongly negatively correlated with the share of subsistence farms and a small physical farm size. Therefore, EU countries with high PC1 values tend to have larger, modernized, and highly productive farms, while those with low PC1 values are more dependent on subsistence farming and small-scale holdings. Component 2 (PC2), which explains 26.67% of the variance, is positively correlated with the structural aspects of farms, such as physical farm size, farm labor size, EU subsidies (EAGF per farm), and farms with high input intensity (Farm_int.). Countries with high PC2 values tend to have larger farms, greater labor involvement, and higher reliance on EU subsidies. Consequently, at the EU level, larger farms with more labor tend to receive more EU support. Thus, PC1 can be interpreted as reflecting farm efficiency and the modernization of agriculture (“Agricultural Efficiency and Modernization”), while PC2 captures the structural characteristics of farms, including physical size, subsidy dependence, and labor intensity.
In 2020, a Principal Component Analysis reduced the twelve agricultural indicators into three main components, explaining 83% of the total variance (
Table 5). Component 1 (PC1), which accounts for 30.9% of the variance, is strongly and positively correlated with land productivity, capital investments in machinery (GFCF/farm), economic farm size, and the share of farms where the manager has received formal agricultural training (Agric_train). This component reflects highly productive and capital-intensive farms. Component 2 (PC2), which explains 27.6% of the variance, is strongly and positively associated with physical farm size, EU subsidies (EAGF/farm), and labor farm size. Countries with larger farms, both in terms of land and labor, and higher levels of EU agricultural support tend to score higher on PC2. Component 3 (PC3), which accounts for 24.5% of the variance, is negatively correlated with high-input-intensity farms (Farm_int.), subsistence farming, and a small physical farm size, while being positively correlated with labor productivity and agricultural income per worker. PC3 reflects the divide between high-input, capital-intensive farming and traditional, labor-intensive farming. Thus, in 2020, PC1 continues to represent farm efficiency and the modernization of agriculture (similar to 2010), PC2 reflects farm structure (as in 2010), and PC3, labeled “Input Intensity and Small-Scale Farming”, emerges as a new factor distinguishing high-input farms from small-scale, traditional farms.
As a result, more of the variance in 2020 is explained by input intensity and farm size rather than solely by productivity and EU subsidies. This indicates a growing diversification in European agriculture, marked by a clear split between large, high-input farms and smaller, traditional farms.
In the next step, the two principal components (PC1–PC2) from 2010 and the three principal components (PC1–PC3) from 2020 were used in the cluster analysis to group the EU countries. Hierarchical cluster analysis (Ward’s method and Euclidean distance) and K-means analysis were applied to determine the number of clusters and their composition [
87]. The results in
Figure 4 and
Table 7 show that, in both 2010 and 2020, the EU countries were grouped into five clusters.
According to the results of the ANOVA analysis, the formed clusters were statistically significant (in 2010, for PC1, F (4, 18) = 44.909 with
p < 0.001, and for PC2, F (4, 18) = 16.905 with
p < 0.001; in 2020, for PC1, F (4, 18) = 49.124 with p < 0.001, for PC2, F (4, 18) = 17.651 with
p < 0.001, and for PC3, F (4, 18) = 20.778 with
p < 0.001;
Table 7).
The results presented in
Table 8 indicate that the obtained clusters are generally of good quality. The overall mean silhouette scores of 0.51 in 2010 and 0.55 in 2020 suggest that, on average, the data points are well matched to their own clusters and reasonably well separated from others [
88,
89]. Several clusters, such as Cluster 4 in 2010 (mean = 0.57) and Clusters 2 and 3 in 2020 (means = 0.68 and 0.67, respectively), exhibit particularly strong internal consistency and separation, indicating well-formed groupings. Even larger clusters, like Cluster 1 in both years, maintain moderate silhouette values around 0.49–0.50, supporting the conclusion that the clustering solution provides meaningful and coherent segments. The presence of perfect silhouette scores in some clusters (Cluster 3 and 5 in 2010 and Cluster 5 in 2020), although based on single observations, further highlights the distinctiveness of certain data points. However, the presence of singleton and very small clusters suggests potential over-clustering. To assess this, we re-ran the analysis with fewer clusters (k = 3 and k = 4), but the resulting average silhouette scores dropped below 0.5. Therefore, we retained the five-cluster solution as it achieved an average silhouette score above 0.5, reflecting moderate to good clustering quality [
88,
89]. Singleton clusters will be discussed explicitly as exceptional cases. Additionally, clusters with more members (e.g., Cluster 2 in 2010 or Cluster 1 in 2020) may contain more heterogeneous cases, which could warrant further intra-cluster analysis. Overall, the silhouette statistics confirm that the formed clusters are robust and represent a well-structured segmentation of the data.
The results of the cluster analysis reveal how agricultural models in EU countries evolved between 2010 and 2020 (
Table 9).
In 2010, Cluster 1 comprised seven Southern and Eastern EU countries (see
Table 9 and
Figure 5). This was characterized by moderately developed farms with a medium economic size, average farm structures, and reliance on labor (
Figure 6). Austria reported the strongest performance across six of twelve agricultural indicators, which reflects high economic and physical size (Ec_size: EUR 39.15 thousand/farm; Ph_size: 19.2 ha/farm), substantial capital investment in machinery (GFCF/farm: EUR 12.21 thousand), and high labor productivity (Labor_prod.: EUR 33.03 thousand). In contrast, Poland recorded the lowest agricultural economic performance, with labor productivity at EUR 5.63 thousand, land productivity at EUR 0.73 thousand, and income per annual work unit at EUR 4.4 thousand. It also had the lowest capital investment in machinery (GFCF/farm: EUR 0.70 thousand). The highest levels of subsistence farming were observed in Portugal (Sub_farm: 39.06%) and Greece (Sub_farm: 33.33%), while Greece, Portugal, and Italy reported a high proportion of small farms (over 70% of farms are under 5 hectares). Slovenia and Poland were the least supported by EU subsidies, receiving the lowest amounts from the European Agricultural Guarantee Fund (EAGF/farm: EUR 1.22 thousand and EUR 1.36 thousand, respectively).
By 2020, three additional Eastern European countries (Latvia, Lithuania, and Hungary) joined Cluster 1, indicating a modernization trend in their agricultural sectors (see
Table 9 and
Figure 5). The average cluster values slightly improved compared to 2010 (see
Figure 6), suggesting that farms became more productive and commercialized, though small-scale and mixed farming remained dominant. The increasing share of farm managers with formal agricultural training (from 36.5% to 39.94%) points to a shift toward more professionalized farming.
The analysis of 2020 data revealed four distinct sub-groups of agricultural development among the ten examined EU countries included in Cluster 1. The “Advanced and Consolidated” sub-group, which comprises Austria, Italy, and Spain, demonstrates strong agricultural structures, characterized by large economic size (EUR 49.3–59.8 thousand/farm) and physical farm sizes (10–26.1 ha/farm), high levels of investment (EUR 5.27–20.2 thousand/farm) and EU subsidies (EUR 3.79–EUR 6.45 thousand/farm), strong productivity (EUR 38.02–EUR 41.11 thousand/AWU), and well-trained farm managers (particularly in Austria (54.5%) and Italy (41.2%)). These countries show maturity in both output and structural capacity. The “Rapid Transition/Catching Up” sub-group (Hungary, Latvia, and Lithuania) has made significant strides, particularly in improving farm size, capital investment, and labor productivity, reflecting a clear shift toward modernization. In contrast, Portugal, Slovenia, and Poland, forming the “Mid-Level Modernizers”, show mixed outcomes; while certain indicators such as farm size or training have improved, key limitations like lower investment levels and inconsistent productivity suggest incomplete structural transformation. Lastly, Greece, categorized as “Lagging Structurally”, continues to face fundamental challenges, including fragmented farms (Ph_size: 5.3 ha/farm; Ec_size: EUR 14.6 thousand), minimal agricultural training (5.9%), and low labor productivity (EUR 12 thousand), despite a relatively high income per worker (EUR 20.23 thousand), likely influenced by EU subsidies.
Moreover, if we look at Poland and Hungary, although they are both classified within the same cluster in 2020, a closer examination reveals significant differences in structural characteristics of holdings and agricultural performance. Hungary demonstrates characteristics of intensive specialization and capital investment, with a markedly larger economic farm size (EUR 30.46 vs. Poland’s EUR 20.62 thousand) and higher mean physical farm size (21.2 ha vs. 11.3 ha). Its gross fixed capital formation (GFCF) per farm is substantially higher (EUR 4.95 vs. EUR 1.05 thousand), and it receives more support from the EAGF per farm (EUR 5.63 vs. EUR 2.63 thousand), which indicates a more capital-intensive and specialized agricultural model. In contrast, Poland exhibits a mixed and moderately modernizing system, with higher labor input per farm (AWU per farm of 1.072 vs. 1.059) and a structure that still includes a large share of small farms. Moreover, Poland’s lower labor productivity (EUR 9.68 vs. EUR 19.02 thousand) and lower real income (8.14 vs. 10.37) highlight a different efficiency and income profile.
In 2010, eight EU countries (all new member states, except for Ireland; see
Table 9 and
Figure 5) were included in Cluster 2. This cluster showed the weakest performance in both the structural characteristics of agricultural holdings and economic outcomes (
Figure 6). It was characterized by small-scale, subsistence-based agriculture with a limited farm size, low productivity, and a high dependence on subsidies. On average, 49.88% of farms in this cluster were classified as subsistence farms, and 58.62% were considered small-sized farms (
Figure 6). Labor productivity was only 34.5% of the EU average (EUR 9.89 thousand compared to EUR 28.70 thousand), while income per annual work unit reached only 43% of the EU average (EUR 7.96 thousand versus EUR 18.55 thousand). Romania reported the lowest values for ten out of the twelve analyzed indicators, which highlights its predominance of subsistence farming and small-scale agriculture, and it has the poorest overall economic performance. In 2020, subsistence farming and small-scale farms were concentrated in two countries (Bulgaria and Romania), which remained in Cluster 2. The other six countries moved out of this category, transitioning toward commercial farming. This cluster is primarily characterized by the variables that define PC3: “Input Intensity and Small-Scale Farming”, including the Sub_farm, Small_size, and Farm_int. variables. The key indicators that define this cluster increased significantly: the share of subsistence farms rose from 49.88% to 54.72%, that of small farm sizes increased from 58.62% to 77.18%, and that of high-input-intensity farms increased from 33.43% to 77.15% (
Figure 6). In Romania alone, 72.48% of farms are subsistence farms, and 90.32% are classified as small in size (under 5 ha/farm). In terms of EU subsidies (EAGF/farm) and capital investment in machinery (GFCF/farm), the average values for this cluster in 2020 were the lowest among all clusters, indicating an underfinanced agricultural sector. Furthermore, the share of farm managers with formal agricultural training has dropped significantly (from 22.53% to 11.01%), primarily due to Romania’s very low share of just 5.5%. Overall, this cluster continues to perform the worst across all three indicators reflecting agricultural performance.
In 2010, Cluster 3 included only one country (the Czech Republic), characterized by large commercial farms (
Figure 6). The Czech Republic ranked first among EU countries in terms of physical farm size (Ph_size = 152.40 ha UAA/holding, with small farms representing only 15.44% of total farms), labor input per farm (Lab_size = 4.75 AWU/holding), and EU subsidies (EAGF/farm = EUR 26.62 thousand). It held the second position in terms of economic farm size (Ec_size = EUR 168.51 thousand). By 2020, Cluster 3 remained primarily defined by the variables forming PC2: “Farm Structure and EU Subsidies,” similar to 2010. Large-scale farming has expanded in Eastern Europe, and the cluster grew to include three countries: the Czech Republic, Estonia, and Slovakia. Despite a decline in both economic farm size (from EUR 168.51 thousand to EUR 122.37 thousand) and physical farm size (from 152.40 ha to 100.50 ha UAA/holding), the countries in this cluster became more efficient and productive. Labor productivity significantly increased from EUR 22.43 thousand to EUR 38.94 thousand. Large-scale farms (Ph_size = 100.50 ha, the highest among clusters), strong investment in machinery (GFCF/farm = EUR 19.72 thousand, ranked third), and high levels of EU subsidies (EAGF/farm = EUR 22.07 thousand, ranked first) have all contributed to the improved economic performance of this cluster. Agricultural policies and farm size remain key determinants of performance, with CAP subsidies continuing to play a significant role. The inclusion of Estonia and Slovakia indicates that these countries have successfully transitioned to large-scale commercial farming.
Cluster 4, which includes six countries from Western and Northern Europe (see
Table 9 and
Figure 5), is characterized by highly modernized agriculture, with large economic and physical farm sizes, high levels of mechanization, and strong economic performance (
Figure 6). By 2020, compared to 2010, Western and Northern European countries had become more uniform in terms of agricultural development, and the cluster expanded to include seven countries. Agricultural holdings in this cluster are larger, more mechanized, and highly productive. EU subsidies decreased slightly (from EUR 16.04 thousand to EUR 15.49 thousand) and thus became less critical as farms in this cluster tend to be more self-sustaining. This cluster ranked second among all clusters in both 2010 and 2020 in terms of economic and physical size, investment levels, and EU subsidies. It ranked third in terms of labor input per farm. Ireland’s inclusion in 2020 indicates the significant modernization of its agriculture sector, even though it ranks lowest within the cluster across most analyzed variables (except for Small_size, Lab_size, and Agric_train.).
An analysis of data regarding EU subsidies and physical farm size, correlated with the clustering of EU countries (
Figure 7), confirms that countries in Clusters 3 and 4, such as the Czech Republic, Slovakia, Denmark, and Germany, characterized by the largest average physical farm sizes, consistently benefited from the highest levels of EU subsidies (EAGF per farm) in both 2010 and 2020. In contrast, countries in Clusters 1 and 2, which are marked by smaller-scale agriculture and lower performance, received significantly lower levels of EU support. These findings confirm that the current structure of EU agricultural policy disproportionately favors larger, more capital-intensive farms [
46,
51,
67]. While this may enhance efficiency and competitiveness in certain regions, it also raises important concerns about equity and inclusivity, particularly in relation to smallholders and less developed agricultural systems (countries in Clusters 1 and 2). The persistent subsidy gap suggests that existing policy mechanisms may reinforce structural inequalities within the EU, limiting the capacity of smaller farms to modernize, compete, and contribute to rural development.
Cluster 5 contains only one country (the Netherlands) in both 2010 and 2020. The Netherlands is a leader in the EU in terms of land productivity, agricultural income, economic farm size, capital investment, and the agricultural training of farmers, reporting exceptionally high values in all of these areas in both years. It remains in a separate category due to its advanced, high-productivity farming system. As for the share of UAA managed by farms with high input intensity per hectare (as a percentage of the total UAA), this cluster ranked second with a value of 53.20% (
Figure 6). This highlights potential sustainability challenges, as high input intensity is often associated with increased environmental pressures, such as soil degradation, water pollution, and greenhouse gas emissions [
78,
80].
To complement the cluster analysis based on the economic performance of agriculture and structural characteristics of agricultural holdings, we examined two key environmental indicators aligned with EU sustainability goals: the “area under organic farming” as a percentage of the total utilized agricultural area (SDG 2.40) and “ammonia emissions from agriculture” (SDG 2.60, measured in kilograms per hectare). The first indicator (SDG 2.40) serves as a central metric for assessing the EU’s progress toward Sustainable Development Goal 2 (“End hunger, achieve food security and improved nutrition, and promote sustainable agriculture”) and supports the Farm to Fork Strategy, which aims for 25% of EU farmland to be under organic cultivation by 2030 [
92]. High levels of the second indicator (SDG 2.60) reflect significant pollution, undermining long-term sustainability objectives. Reducing ammonia emissions is thus essential for transitioning to climate-friendly agriculture in line with the European Green Deal [
93]. These environmental metrics were analyzed independently and correlated with the previously identified country clusters to assess the environmental implications of different EU agricultural models.
A paired samples t-test revealed a statistically significant increase in the average share of organic farmland in EU-23 countries, from 6.76% in 2010 to 10.63% in 2020 [t(22) = 7.96,
p < 0.001], and indicates clear progress toward the 2030 target (
Table 10). In contrast, the change in ammonia emissions, from 20.84 to 20.32 kg/ha, was not statistically significant [t(22) = –1.11,
p = 0.279], which suggests limited advancement in reducing this key pollutant despite advances in sustainable farming practices.
Scatterplots for 2010 and 2020 (
Figure 8) illustrate substantial variation among EU countries in both indicators. The Netherlands (NL), for instance, exhibits very high ammonia emissions and low organic land use, which reflects a trade-off between productivity and environmental sustainability. Conversely, countries like Austria and Estonia combine high organic shares with relatively low emissions, which indicates that they align more closely with the EU’s sustainability goals.
Overlaying cluster results with environmental indicators reveals distinct patterns:
Cluster 1 (Mediterranean and Eastern Europe–Mixed Farming): There are moderate to high organic farming shares (approximatively 7–25%) and moderate ammonia emissions (15–35 kg/ha). Countries such as Italy and Spain show gradual improvements in organic practices.
Cluster 2 (Small-Scale, Subsistence Farming): There are very low organic land use (<3%) and low to moderate emissions (<15 kg/ha). The environmental impact remains low due to under-mechanization rather than ecological efficiency, and the adoption of sustainable practices is limited.
Cluster 3 (Large Commercial Farms): There are moderate to high organic use (10–20%) and moderate emissions (15–25 kg/ha). While this cluster is environmentally balanced, expansion may pose challenges. Estonia stands out as a potential model for sustainable intensification in Eastern Europe.
Cluster 4 (Highly Modernized Farming): There are moderate organic shares (5–15%) but high ammonia emissions (25–50 kg/ha). Countries such as Belgium and Denmark show strong productivity but struggle with emission reduction.
Cluster 5 (the Netherlands): This cluster is characterized by low organic land use (<5%) and the highest ammonia emissions (>60 kg/ha) among EU countries. This profile underscores the persistent trade-offs between high agricultural productivity and environmental sustainability. The exceptionally high ammonia emissions stem primarily from intensive livestock and horticulture systems, making the Netherlands a clear example of the sustainability gap—where intensive, technologically advanced farming comes at a significant environmental cost. The limited adoption of organic practices reflects a strategic emphasis on tech-driven productivity over ecological farming methods.
These findings underscore the need to integrate environmental dimensions into agricultural typologies to better align EU policy with the Green Deal and the Farm to Fork Strategy.
We can conclude that while common patterns, such as modernization and increased productivity, are emerging in certain regions, substantial differences in structural characteristics and agricultural performance continue to exist among EU countries. These findings support the view that agricultural convergence occurs selectively and unevenly across the Union. Therefore, Hypothesis 3 is only partially confirmed.
The analysis of rural development indicators across EU countries reveals a mixed picture. The results of the paired samples
t-test (
Table 2) show that among the four indicators examined, only GDP per capita in predominantly rural regions showed a statistically significant increase between 2010 and 2020, rising from EUR 17,543 to EUR 23,052 (
p = 0.001). This suggests overall economic growth in rural areas.
Figure 9 illustrates the disparities between EU countries in GDP/capita and poverty risk and highlights differences both in levels and in changes over time. However, other key indicators related to poverty and demographic shifts did not experience statistically significant changes. The population share of predominantly rural regions decreased slightly (from 28.01% to 26.65%), with marginal statistical significance (
p = 0.061). This indicates a slow but ongoing process of rural depopulation.
More notably, the at-risk-of-poverty rate in rural areas and the in-work at-risk-of-poverty rate among self-employed persons remained largely unchanged, which suggests that the benefits of economic growth are not being evenly distributed. Vulnerable groups, such as self-employed individuals in rural areas, continue to face persistent poverty risks. These findings imply that while some aspects of rural development have improved, particularly in terms of average economic output, social disparities and demographic pressures remain pressing challenges. As such, the results only partially support Hypothesis 4, which expected significant changes across all rural development indicators.
In order to test H5, hierarchical regression analysis was applied to examine the influence of changes in agricultural performance (specifically changes in labor productivity, land productivity, and agricultural income) over the past decade on rural development (
Table 11). Rural development was measured through three dependent variables: changes in GDP per capita in predominantly rural regions (Model 1), changes in the at-risk-of-poverty rate in rural areas (Model 2), and changes in the in-work at-risk-of-poverty rate (excluding employees) (Model 3).
The results in
Table 11 show that Model 1, which examines the impact on rural GDP per capita, was statistically significant and explained 61.7% of the variation in GDP growth (F(3, 19) = 12.805,
p < 0.001). The strongest and only significant predictor in this model was the change in labor productivity (β = 1.054,
p < 0.001), which highlights the critical role of productivity growth in driving rural economic development. This suggests that improvements in key drivers of productivity growth, such as investments in skills development, technological innovation, and mechanization, can effectively support GDP per capita growth in rural areas.
This suggests that improvements in key drivers of productivity growth—such as investment in skills development, technological innovation, and mechanization—can effectively support income growth in rural areas.
In contrast, Model 2, which examined the change in the at-risk-of-poverty rate in rural areas, was not statistically significant (Adjusted R2 = 0.027, p = 0.335), and this indicates that productivity gains alone do not significantly reduce rural poverty. Similarly, Model 3, which addressed in-work poverty among self-employed rural workers, was marginally significant at the 10% level (p = 0.075) and explained only 18.7% of the variance. Interestingly, within this model, land productivity change showed a significant negative effect (β = −0.577, p = 0.016), which suggests that increased land productivity may help reduce poverty among self-employed individuals. However, this effect was isolated and does not indicate a consistent pattern across all indicators.
The results of the hierarchical regression analysis provide only partial support for the assumption that improvements in agricultural performance significantly contribute to rural development outcomes in EU countries. Among the three rural development indicators analyzed, only rural GDP per capita was significantly influenced by changes in agricultural performance, specifically labor productivity. Therefore, H5—growth in agricultural performance significantly contributes to rural development outcomes in EU countries—is partially confirmed.
These results underscore the complexity of rural development, which likely depends on additional economic, social, and institutional variables not included in this analysis. Accordingly, this regression should be viewed as a preliminary exploration rather than a comprehensive explanatory model.
Moreover, when correlating data on the at-risk-of-poverty rate in rural areas with the clustering of EU countries based on agricultural economic performance and the structural characteristics of holdings, the results reveal that countries in Clusters 1 and 2 face significantly higher poverty risks compared to those in more agriculturally developed clusters (Clusters 3, 4, and 5) (
Figure 9). For instance, in 2020, Romania and Bulgaria reported the highest rural poverty rates—38.9% and 36.3%, respectively. Alarmingly, both countries also experienced an increase in poverty risk compared to 2010, with a rise of 7.6 percentage points in Romania and 6.2 percentage points in Bulgaria. This suggests that the relative progress in agricultural modernization and output has not translated into improved rural living conditions or reduced poverty risks. Furthermore, there is notable variation in rural poverty risk even among countries within the same cluster, which indicates that agricultural performance alone does not fully explain rural poverty outcomes.
Furthermore, over the past decade, in the EU-23, both the average farm labor size and the proportion of farm managers with formal agricultural training have seen only modest increases (see
Table 2), while the at-risk-of-poverty rate in rural areas has declined only slightly. These trends underscore the need for a more integrated approach that combines investment in education and rural employment with efforts to consolidate and modernize agriculture. Such a strategy is crucial to developing a more inclusive agricultural model that effectively contributes to poverty reduction.
These findings imply that while certain improvements in agricultural performance, particularly in labor and land productivity, may contribute to specific rural development outcomes, they are not sufficient on their own to drive broad-based improvements in poverty reduction or socio-economic inclusion. This aligns with broader concerns in the literature about the concentration of agricultural income among larger, more competitive farms, while smaller farms and vulnerable rural households may not experience the same benefits [
36,
41,
52,
56]. Therefore, without more integrated approaches that align agricultural modernization with social policy and rural development goals, economic gains in the sector may fail to reduce rural poverty or improve the well-being of vulnerable populations.
While this study focuses on the role of agricultural performance in the achievement of rural development, it is essential to acknowledge that factors such as access to quality education, healthcare, transportation, and digital infrastructure play a critical role in shaping the overall well-being and resilience of rural communities [
1,
36]. Eurofound [
95] highlights that rural areas lag in healthcare accessibility, educational facilities, and transportation infrastructure, and all of these contribute to social and economic disparities between rural and urban populations. These infrastructural deficits can hinder the effectiveness of agricultural advancements in promoting inclusive rural development.
5. Conclusions and Main Implications
This paper explores how shifts in the structural characteristics of agricultural holdings and changes in agricultural performance have influenced rural development in EU countries over the past decade, with the aim of identifying targeted measures to promote agriculture and rural development and enhance the quality of life for rural populations. Understanding these dynamics is essential as rural areas across the EU face growing socio-economic disparities, persistent poverty, and depopulation, which are challenges that threaten both regional cohesion and the sustainability of the agricultural sector. While EU agricultural policies have supported productivity and modernization, their uneven impacts raise important questions about inclusiveness and territorial equity. A nuanced analysis that links structural transformations in agriculture to rural development outcomes is therefore critical to designing more effective, context-sensitive interventions that address not only economic performance but also social and territorial dimensions of rural well-being.
The analysis of agricultural and rural development trends across 23 EU countries over the past decade, based on paired samples t-tests, reveals a clear structural transformation in the agricultural sector, characterized by farm consolidation, increased productivity, and capital intensification. While the share of employment in agriculture declined significantly, the sector maintained a relatively stable contribution to gross value added (GVA), indicating a steady process of modernization. At the same time, the income levels for family farms improved, narrowing the income gap with other sectors, although regional and farm-type disparities persist. This structural shift, evidenced by the decline in subsistence and small-scale farms, the expansion of larger holdings, and increased investment, points to a more competitive and efficient agricultural model. However, this transformation is not without consequences. The uneven pace of change between countries, particularly between Eastern and Western Europe, and the persistence of rural poverty and depopulation in certain countries highlight ongoing structural and social inequalities. These findings suggest that while EU agricultural policy has effectively promoted productivity and modernization, additional efforts are needed to ensure inclusive growth and territorial cohesion across all rural areas.
The results of the PCA and cluster analysis clearly demonstrate that agricultural models across EU countries evolved significantly between 2010 and 2020. The EU’s agricultural landscape is highly diverse, with five distinct clusters that differ in terms of farm size, productivity, input intensity, and level of modernization. These range from subsistence and small-scale farming (Cluster 2) to high-tech, large-scale commercial agriculture (Cluster 5). The analysis highlights that a one-size-fits-all policy approach cannot adequately support the needs of all EU countries. Instead, tailored agricultural strategies that account for the heterogeneity of farming systems are essential to enhance resilience, foster innovation, and ensure the long-term sustainability of both agriculture and rural development.
Between 2010 and 2020, several Eastern European countries, such as Latvia, Lithuania, and Hungary, transitioned into more commercialized or mixed-farming clusters, indicating progress in agricultural modernization. However, Romania and Bulgaria remained in the weakest-performing cluster, Cluster 2, characterized by low productivity, limited investment, and insufficient formal agricultural training. This reflects a dual-speed agricultural transformation in Eastern Europe. The Netherlands, situated in Cluster 5, leads the EU in land productivity, income, investment, and training, effectively forming a cluster of its own. However, this strong economic performance comes at a high environmental cost, with the country recording the highest ammonia emissions and the lowest share of organic farming. This underscores a key policy dilemma: balancing economic efficiency with environmental sustainability. Countries in Cluster 4, such as Germany, France, and Denmark, continue to demonstrate strong performance, with high productivity and capital investment. These countries are also becoming increasingly self-sufficient, as their reliance on EU subsidies has begun to decline. The inclusion of Ireland in Cluster 4 by 2020 suggests that countries can catch up through modernization, particularly by investing in training and mechanization.
These findings suggest significant differences in the structural characteristics of agricultural holdings and agricultural performance across clusters, particularly between Western/Northern EU and Eastern/Southern EU countries. Therefore, EU rural development policies must remain regionally targeted. While Western countries primarily require innovation and sustainability-focused solutions, many Eastern countries still require basic structural reforms, such as land consolidation, infrastructure, and access to capital.
Thus, the main real challenges identified for Romania and Bulgaria (Cluster 2) are the highest shares of subsistence and small scale farms, the lowest levels of productivity and agricultural training, and the highest risk of rural poverty. Therefore, enhancing agricultural productivity in these countries is crucial for raising farmers’ incomes, securing food supplies, and fostering socio-economic stability in rural areas. Policy recommendations for this cluster should focus on the structural transformation of the agricultural sector by promoting farm consolidation through EU-funded cooperatives and facilitating access to land for young farmers through targeted financial incentives. Increasing investments in mechanization and infrastructure is essential to boost productivity, including the provision of low-interest loans or grants to incentivize mechanization. Moreover, directing Pillar II investments toward infrastructure, digitalization, advisory services, and green skills training [
13], while simultaneously supporting market access for smallholders, is particularly important for countries in Cluster 2.
Given the heterogeneous agricultural structures and performance levels among the countries in Cluster 1 (Mediterranean and Eastern Europe–Mixed Farming), policy recommendations must be differentiated and tailored to the specific developmental stage and structural characteristics of each sub-group. For “Advanced and Consolidated” countries (Austria, Italy, and Spain), policy efforts should prioritize innovation-driven growth, climate-smart agriculture, and advanced digitalization, aiming to maintain competitiveness while enhancing environmental sustainability. Support for research, agri-tech adoption, and generational renewal can help sustain high productivity and respond to environmental and market challenges. The “Rapid Transition/Catching-Up” group (Hungary, Latvia, and Lithuania) should focus on consolidating recent gains by reinforcing investment in mechanization, infrastructure, and training systems to ensure long-term viability. These countries should benefit from targeted support to further improve capital formation, enhance farm advisory services, and streamline access to EU funds. For the “Mid-Level Modernizers” (Portugal, Slovenia, and Poland), where a significant proportion of farms remain small and labor-intensive, policy should address structural bottlenecks through increased support for medium-scale farm consolidation, improved training programs, and expanded rural development initiatives to bridge persistent gaps in productivity and investment. In the case of Greece, categorized as “Lagging Structurally”, a more fundamental transformation is needed, starting with land reform incentives, enhanced agricultural education, and improved access to credit and technical assistance for smallholders.
In the case of countries included in Cluster 3 (Czech Republic, Estonia, and Slovakia) which are characterized by large, commercial farming systems with high capital investment, mechanization, and EU subsidy support, policies should be focused on supporting sustainable intensification through precision farming subsidies. It is necessary to progressively redirect subsidies and CAP payments to prioritize not only farm size but also the adoption of environmentally and climate-friendly practices. This strategy can help large farms maintain high productivity while significantly reducing emissions, particularly ammonia.
Countries in Cluster 4 (Belgium, Denmark, Germany, France, Finland, Sweden, and Ireland) exhibit highly productive, modernized farming systems characterized by extensive use of technology and mechanization. While these agricultural sectors rely less on subsidies compared to other clusters, they face significant environmental challenges, particularly related to greenhouse gas emissions. To address these issues, policy measures should focus on promoting the adoption of precision agriculture technologies through tax incentives and targeted support [
13]. Additionally, EU subsidy mechanisms should be refined to prioritize environmental outcomes, innovation, and climate adaptation, shifting away from merely preserving existing practices toward rewarding sustainable and forward-looking farming approaches.
The Netherlands (Cluster 5) remains unique for its high-tech, highly productive farming systems. However, environmental sustainability is a significant challenge, as evidenced by extreme ammonia emissions and minimal organic land use, which highlight the risks of unsustainable intensification. In this cluster, policies should promote sustainable intensification through advanced technologies, such as low-emission livestock systems and precision farming techniques. Furthermore, full CAP subsidy eligibility should be conditional on compliance with environmental thresholds, with penalties imposed for any exceedances.
The results of the hierarchical regression analysis partially confirm that improvements in agricultural performance contribute to rural development, with labor productivity emerging as a key driver of rural GDP per capita growth. However, these gains do not significantly reduce rural poverty or in-work poverty among the self-employed, and this indicates that productivity growth alone is not sufficient to ensure inclusive rural development. Therefore, policymakers should complement agricultural productivity initiatives with broader rural development strategies that specifically target poverty alleviation and social inclusion. This includes promoting rural employment diversification, improving access to social services and infrastructure, and supporting small-scale farmers and self-employed individuals through tailored financial and training programs. Investment in the education and training of agricultural workers is critical. Equipping farmers with skills in technology adoption, sustainable practices, and farm management can significantly enhance the social, economic, and environmental performance of farms while also improving rural livelihoods [
24]. Such integrated approaches are essential to ensure that economic growth leads to improved well-being for all rural populations.
To address the substantial income disparities between large and small farms, the new Common Agricultural Policy (CAP) should implement targeted measures to reallocate income support payments in favor of smaller agricultural holdings [
67]. Adjustments to EU subsidies are necessary to ensure a fairer distribution, especially in countries still transitioning from subsistence to commercial farming. It is crucial to design subsidies that do not reinforce structural inequalities but instead promote growth across all types of farms. Moreover, CAP direct payments and rural development funding (Pillars I and II) must be better aligned with environmental outcomes rather than being based solely on farm size or productivity. Under the eco-schemes introduced in CAP 2023–2027 [
13], a greater share of direct payments should be redirected toward organic conversion and maintenance (in support of SDG 2.40) as well as low-emission practices, including ammonia reduction technologies. Tailored eco-schemes, performance-based subsidies, and targeted investments in green transitions are essential for aligning national strategies with the objectives of the Farm to Fork Strategy [
92] and EU Green Deal [
93].
Furthermore, a shared priority among EU countries should be the strengthening of institutional capacity and policy coherence to ensure that EU Common Agricultural Policy (CAP) instruments are effectively adapted to national contexts and support inclusive and sustainable growth.
Limitations and Directions for Future Research
This study has several limitations that should be acknowledged. First, it relies on aggregated national-level data, which may mask important regional disparities within countries and limit the granularity of the findings. Second, although the analysis covers the period from 2010 to 2020, due to the unavailability of more recent statistical data, it may not fully reflect long-term trends or the effects of recent policy developments, such as the implementation of the post-2020 Common Agricultural Policy (CAP). Third, the study focuses primarily on economic and structural indicators, overlooking other important dimensions of rural development, such as environmental sustainability, social cohesion, and access to essential services.
To address these limitations, future research should prioritize the use of more disaggregated regional (NUTS III-level) or local-level data to better capture intra-country disparities and reflect the diverse rural contexts across the EU. Expanding the analysis beyond 2020 will also be essential for evaluating the impacts of the post-2020 CAP and other recent policy initiatives. Furthermore, future studies should adopt a more multidimensional approach by incorporating a broader range of environmental, social, and infrastructural indicators. Such an approach would enable a more comprehensive understanding of rural well-being and support the formulation of integrated policies that align economic development with sustainability and social inclusion objectives.


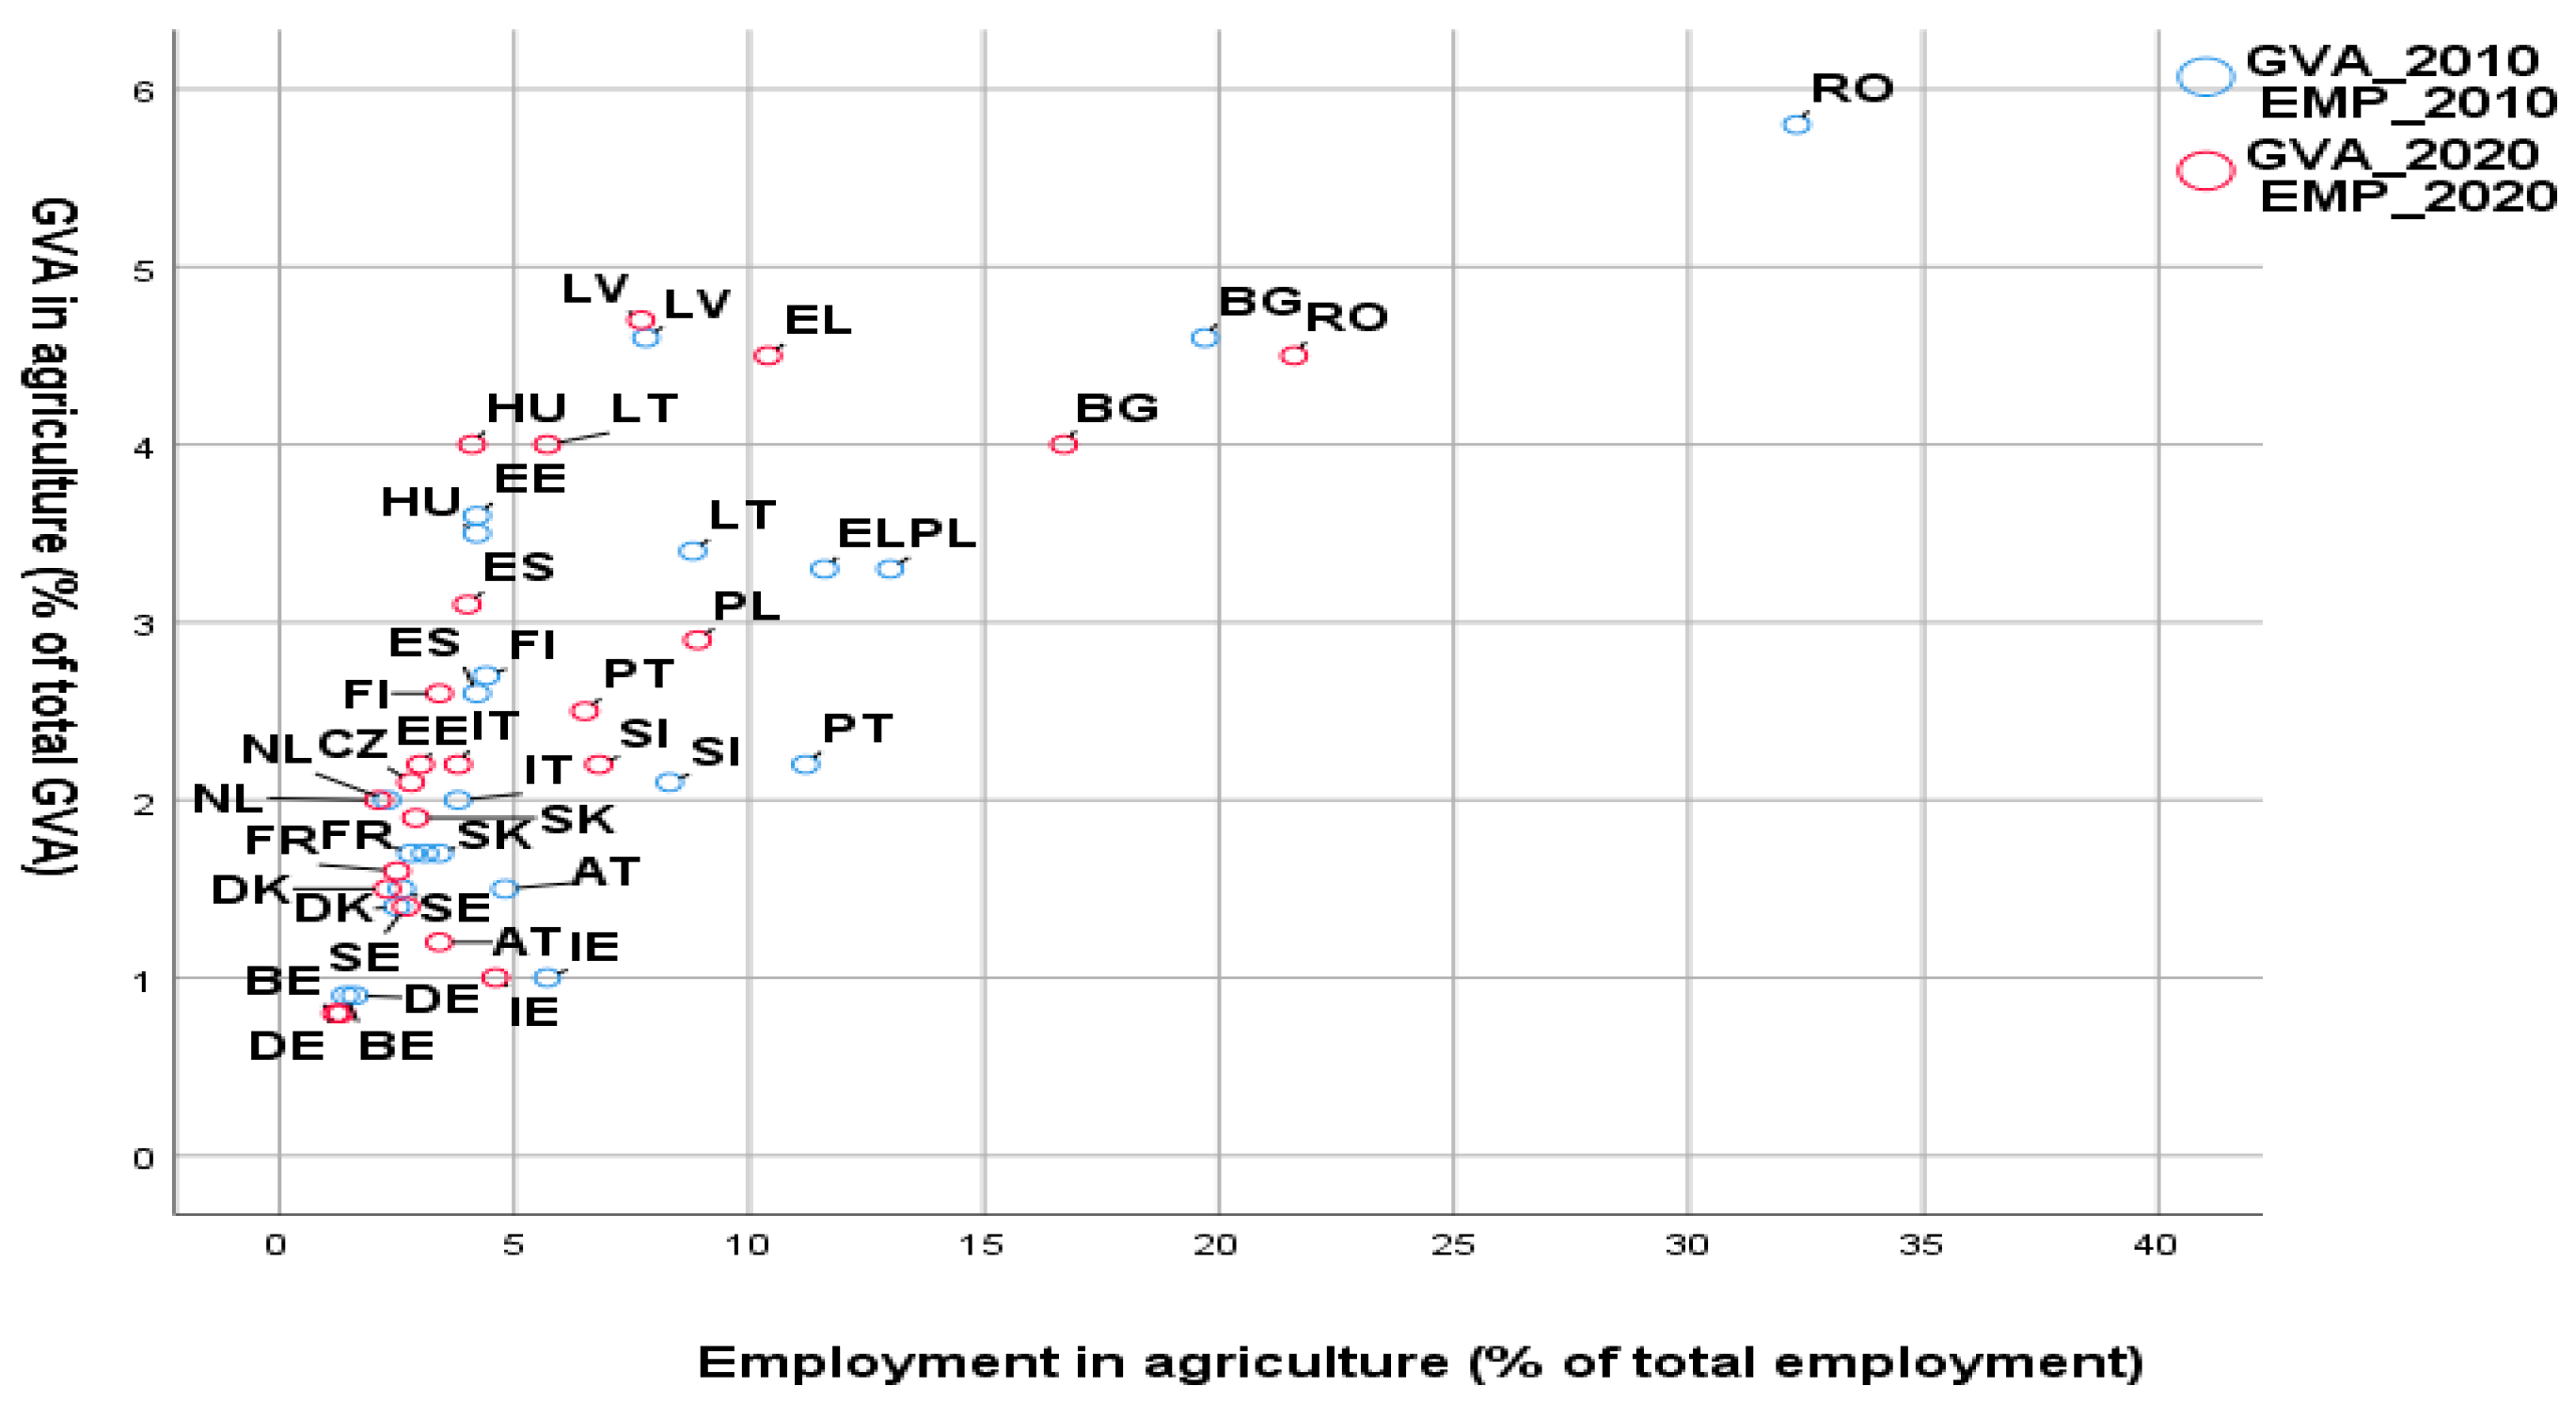
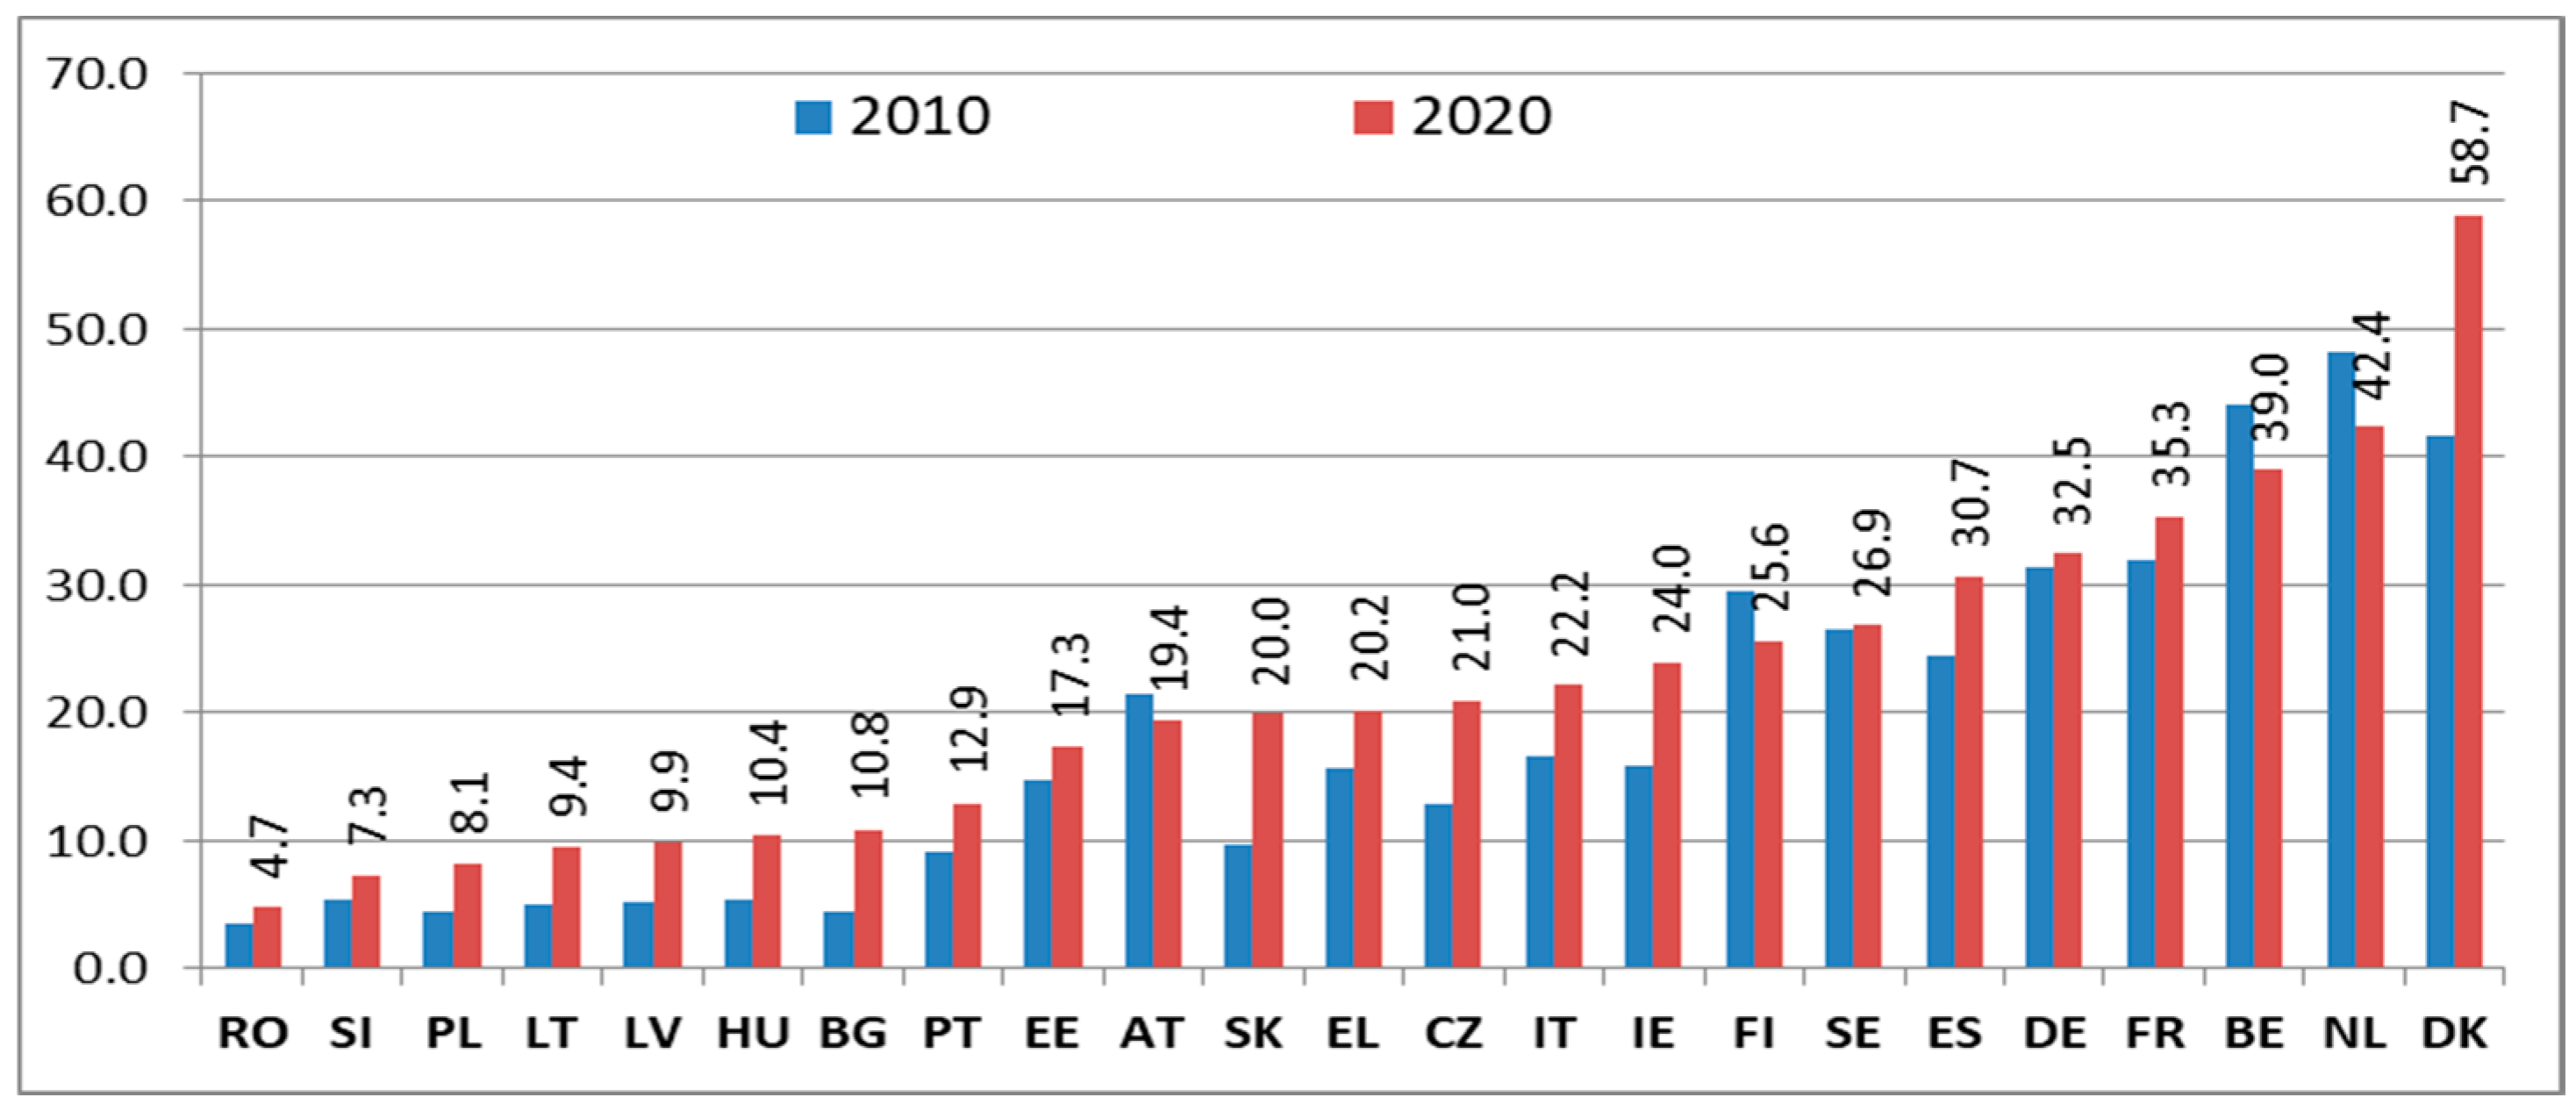
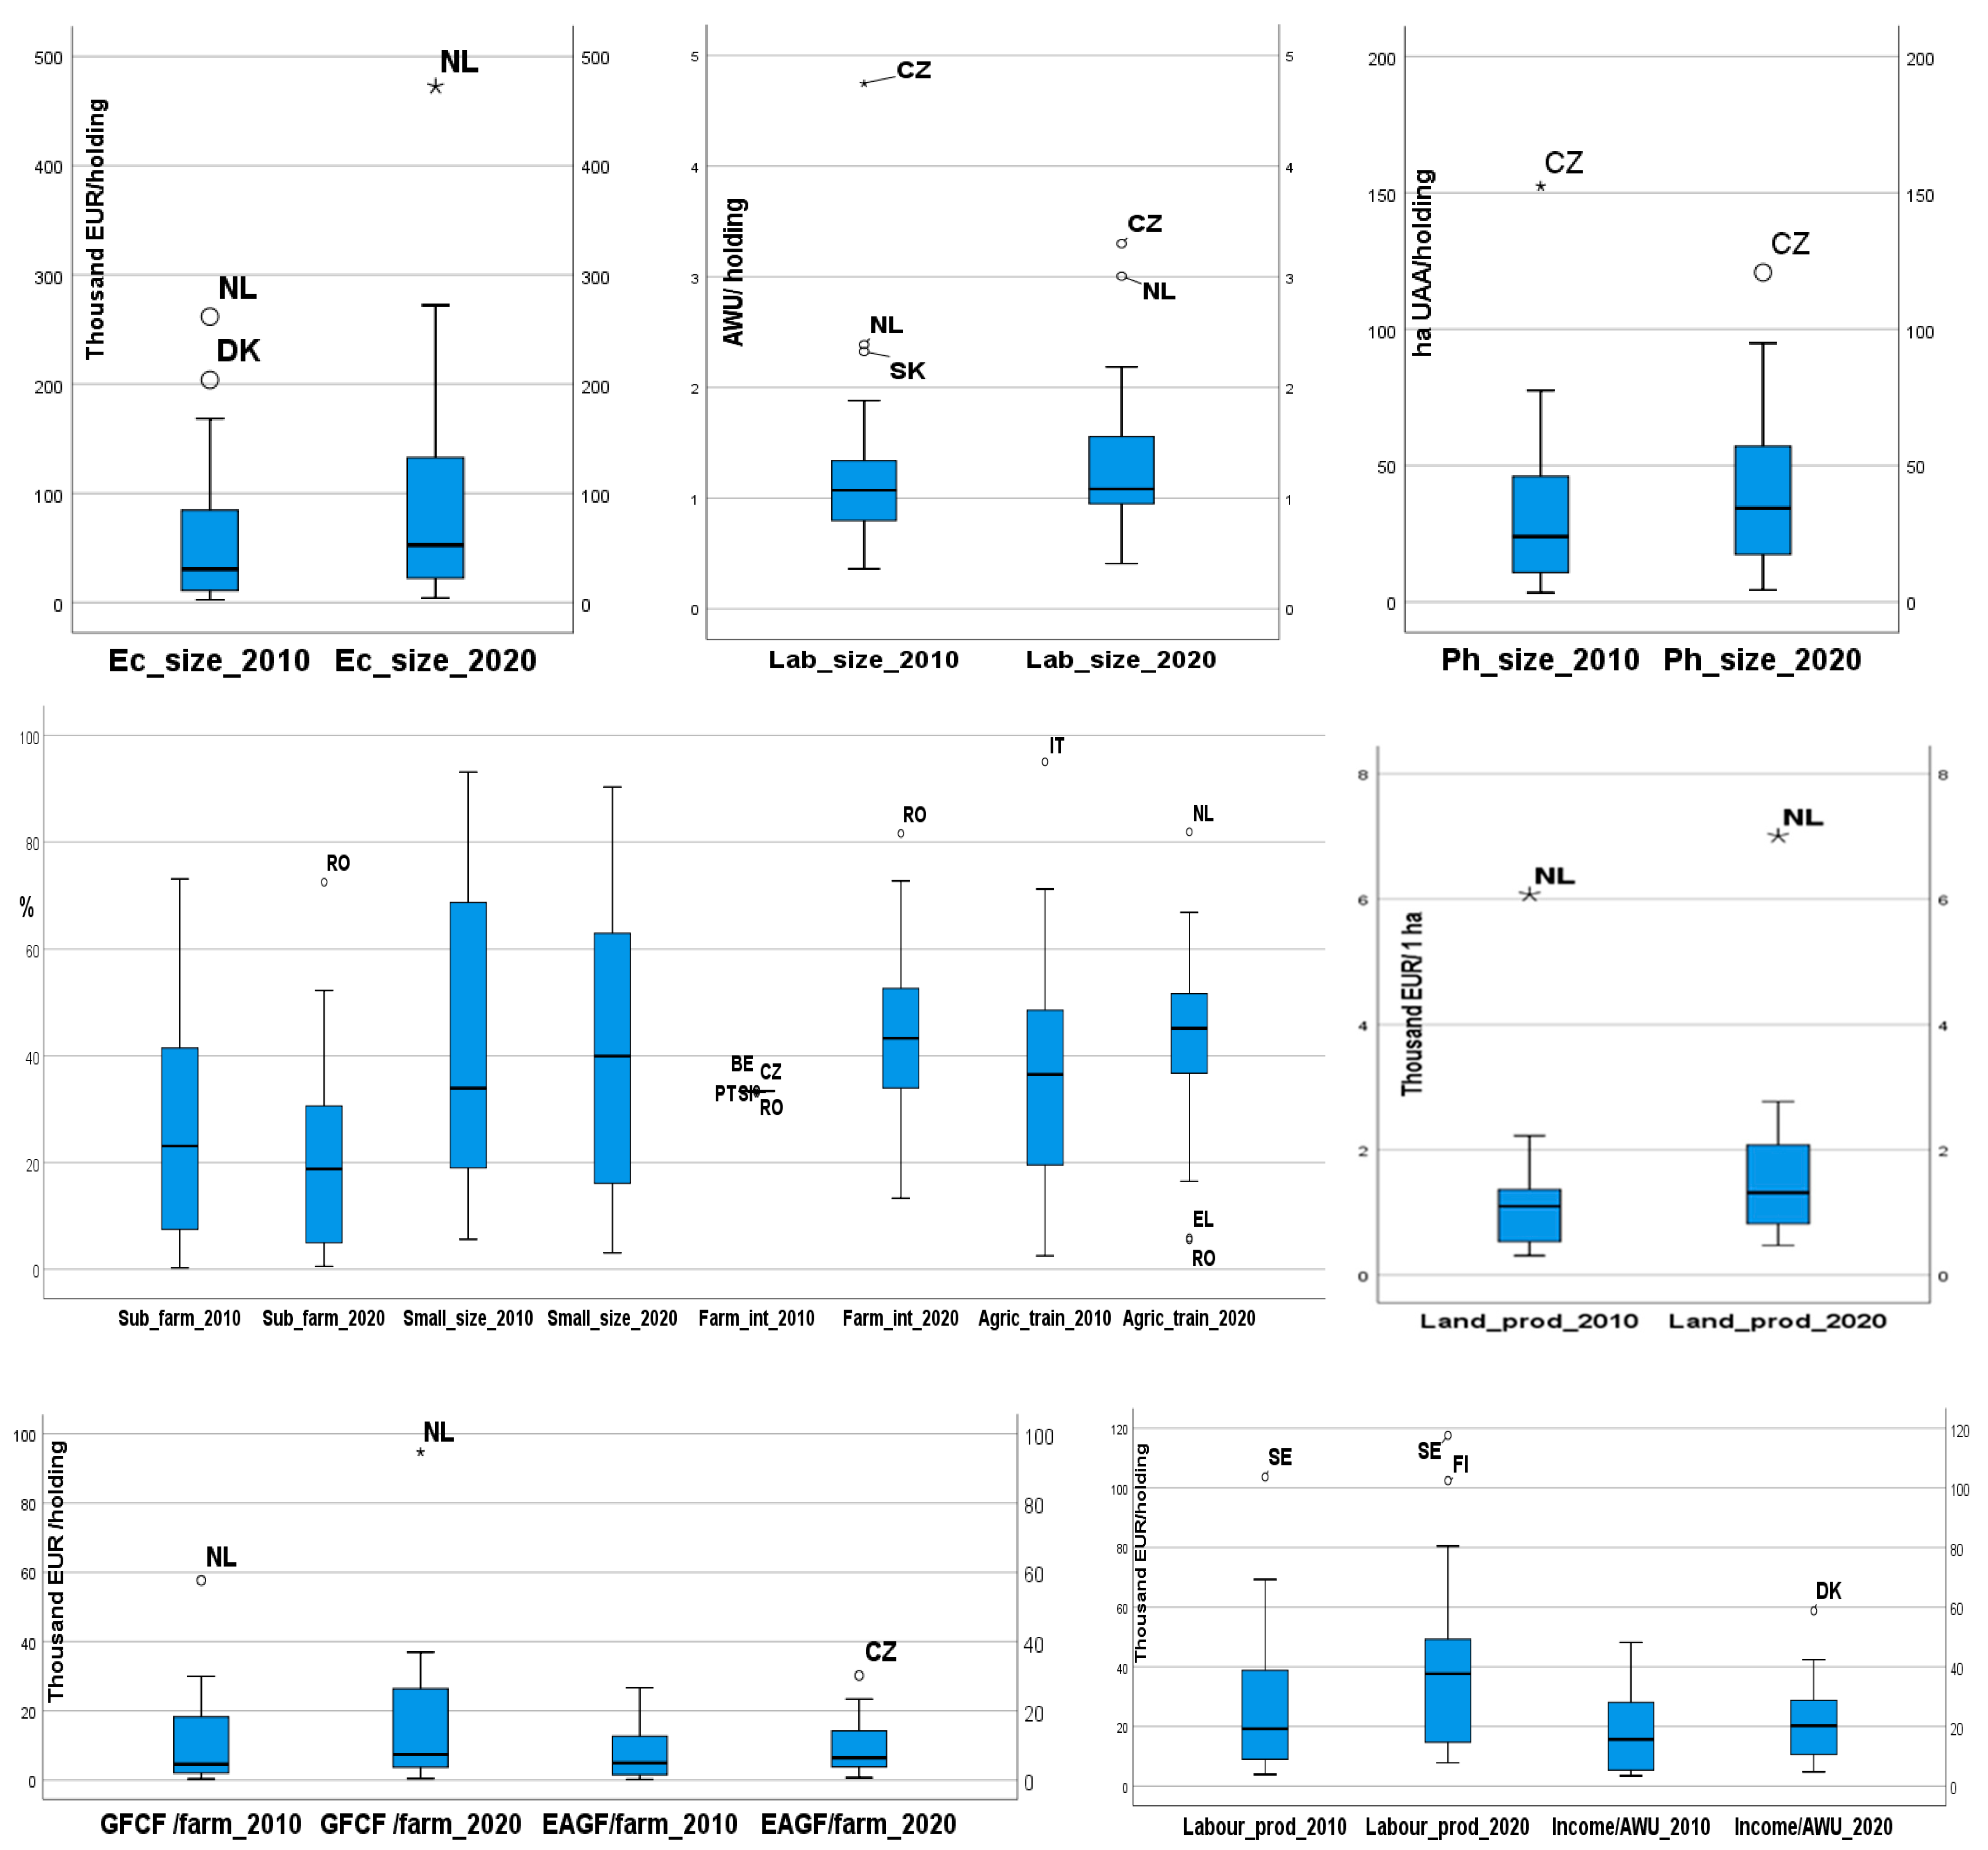
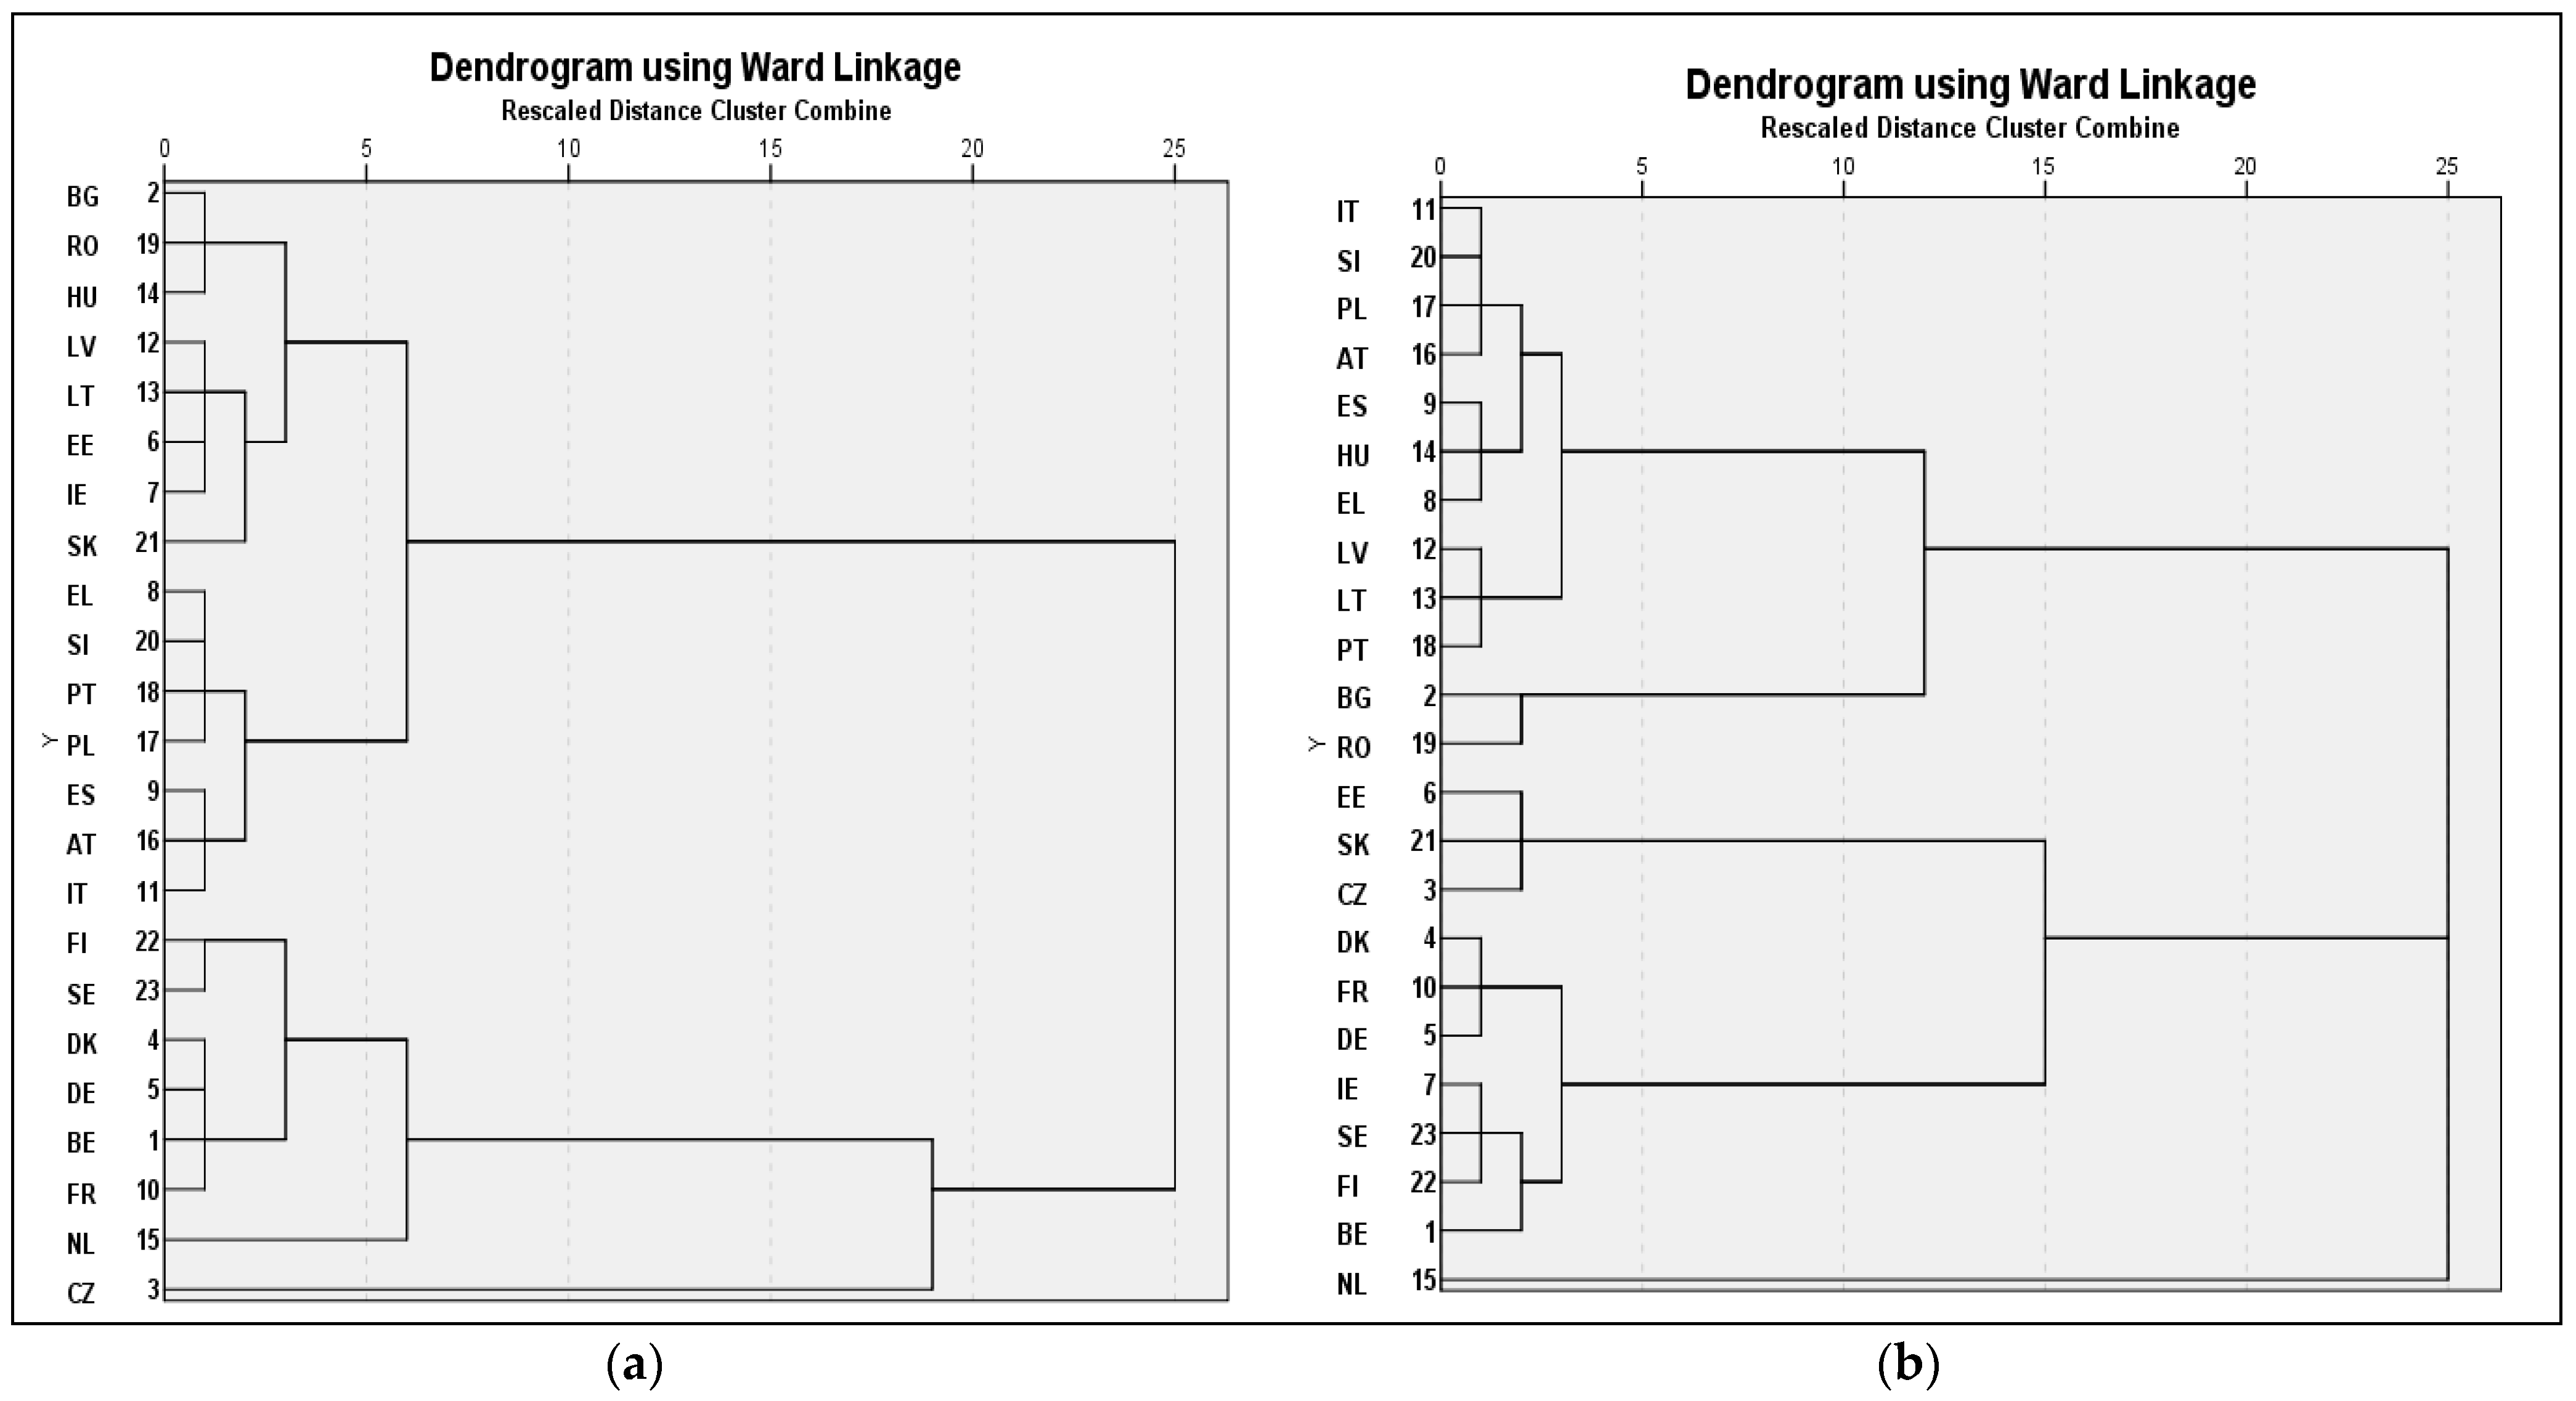
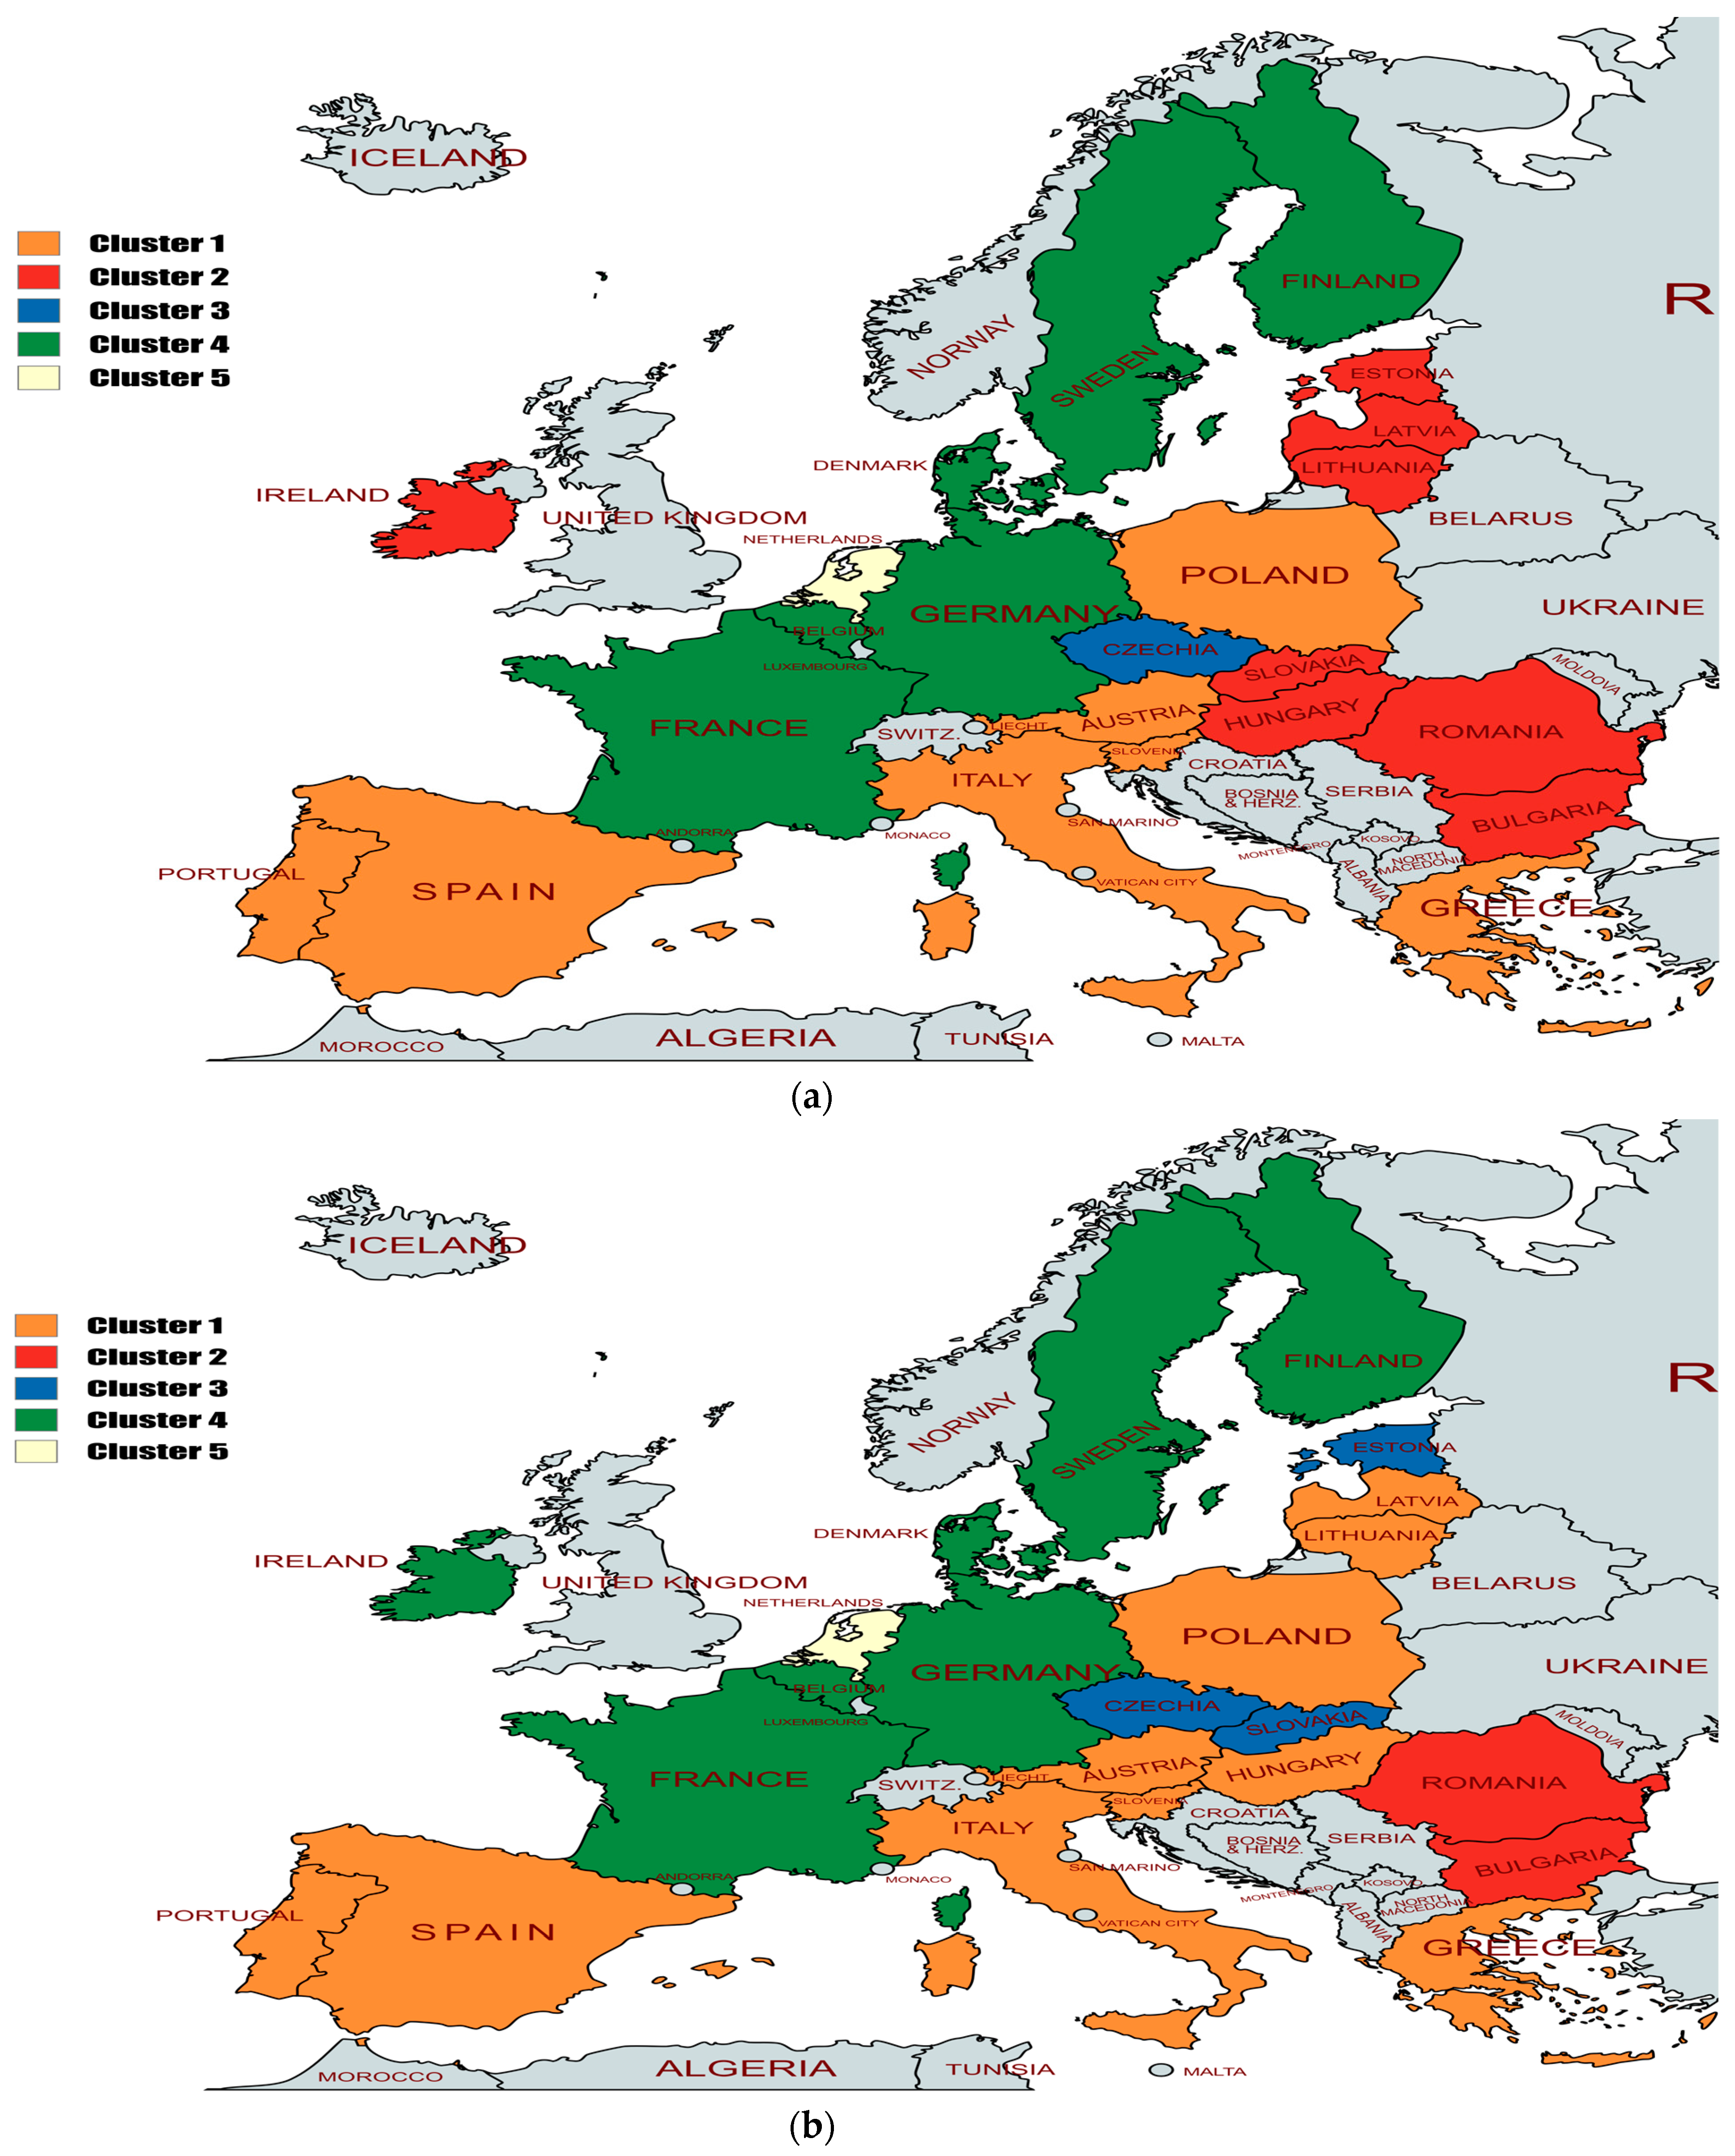
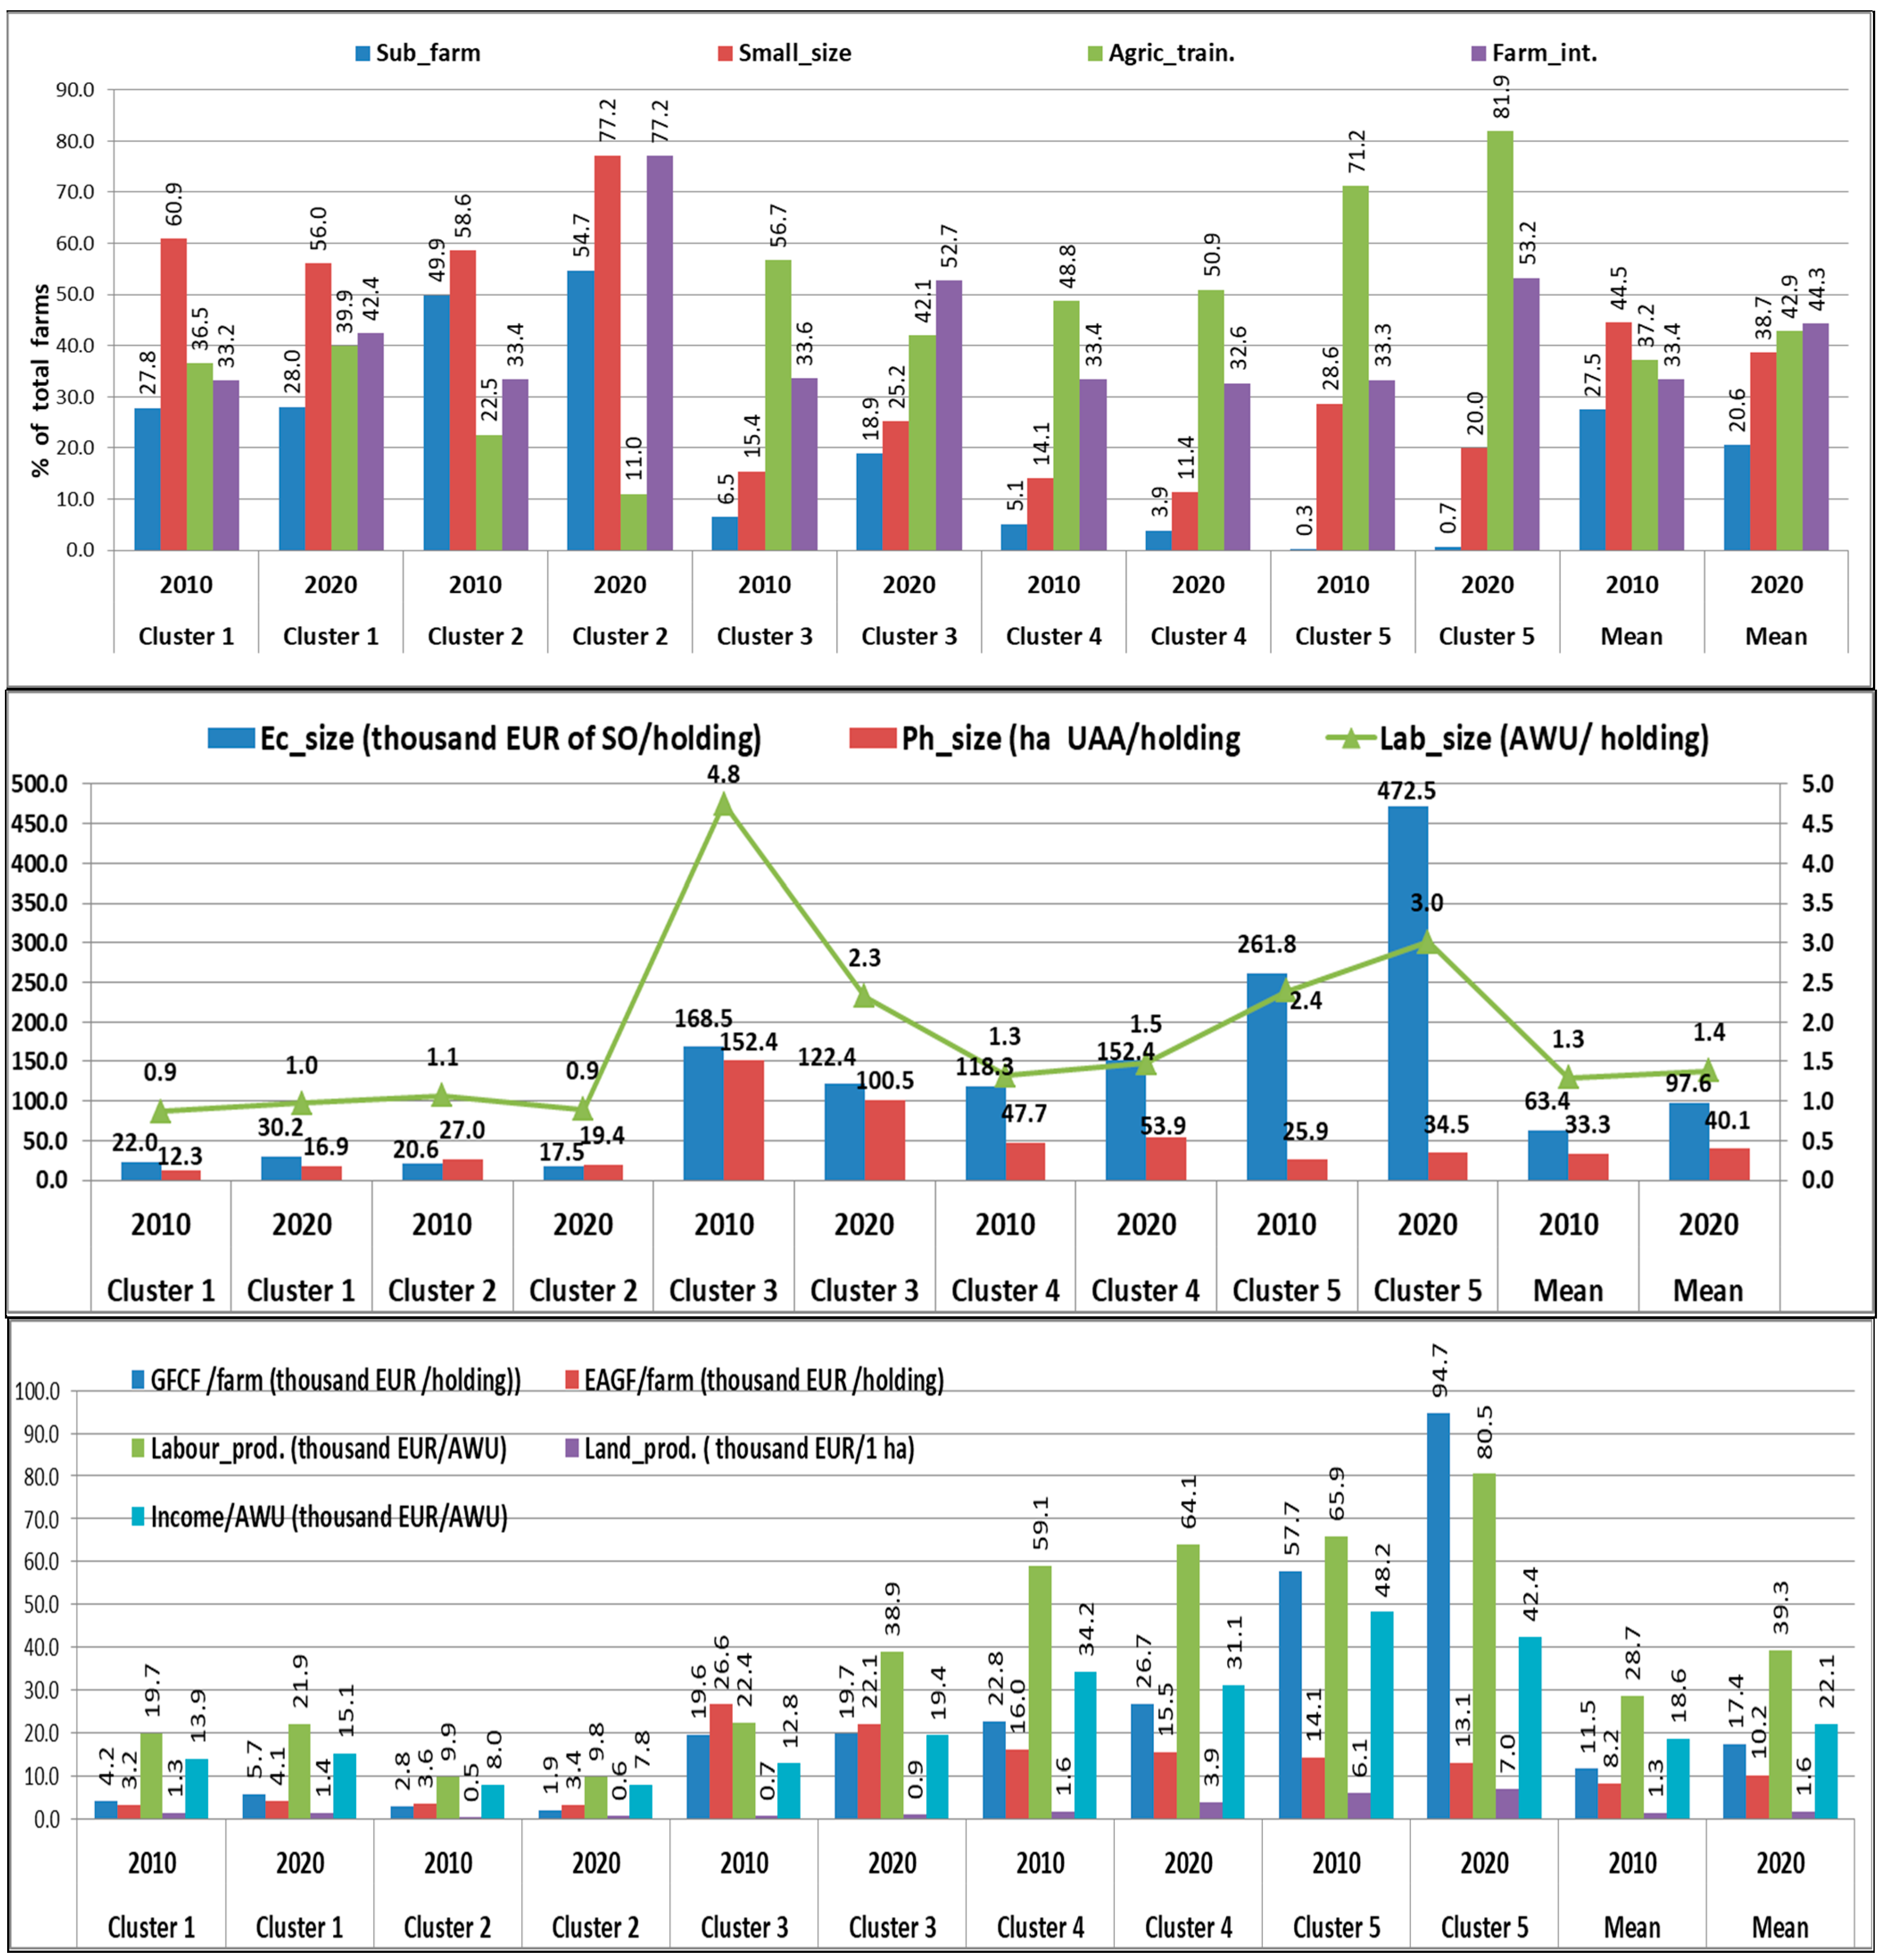
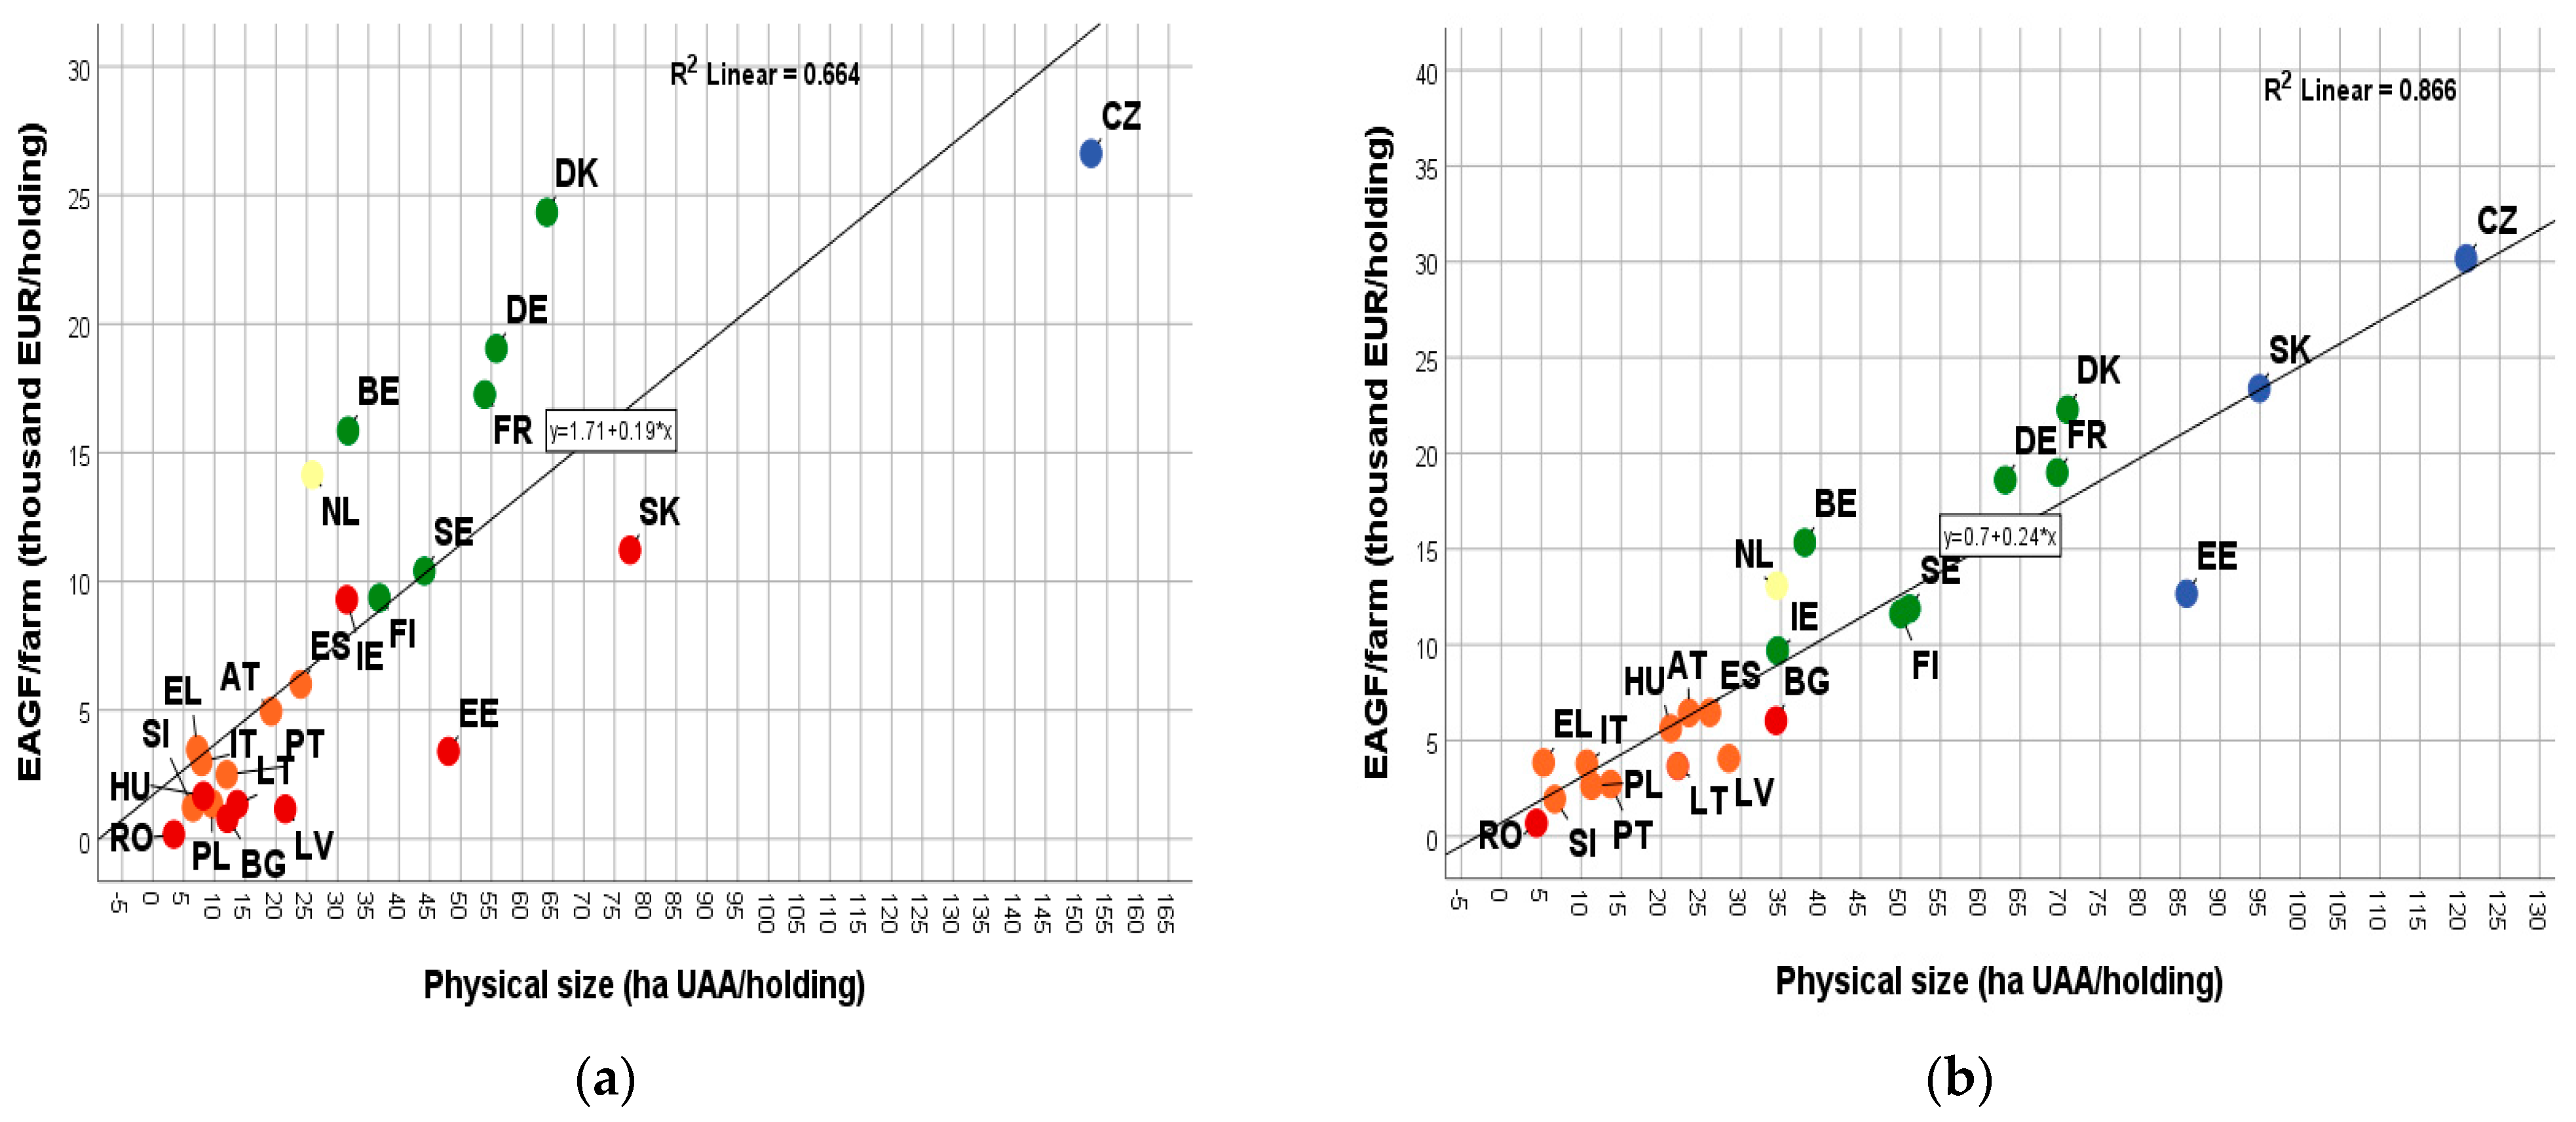
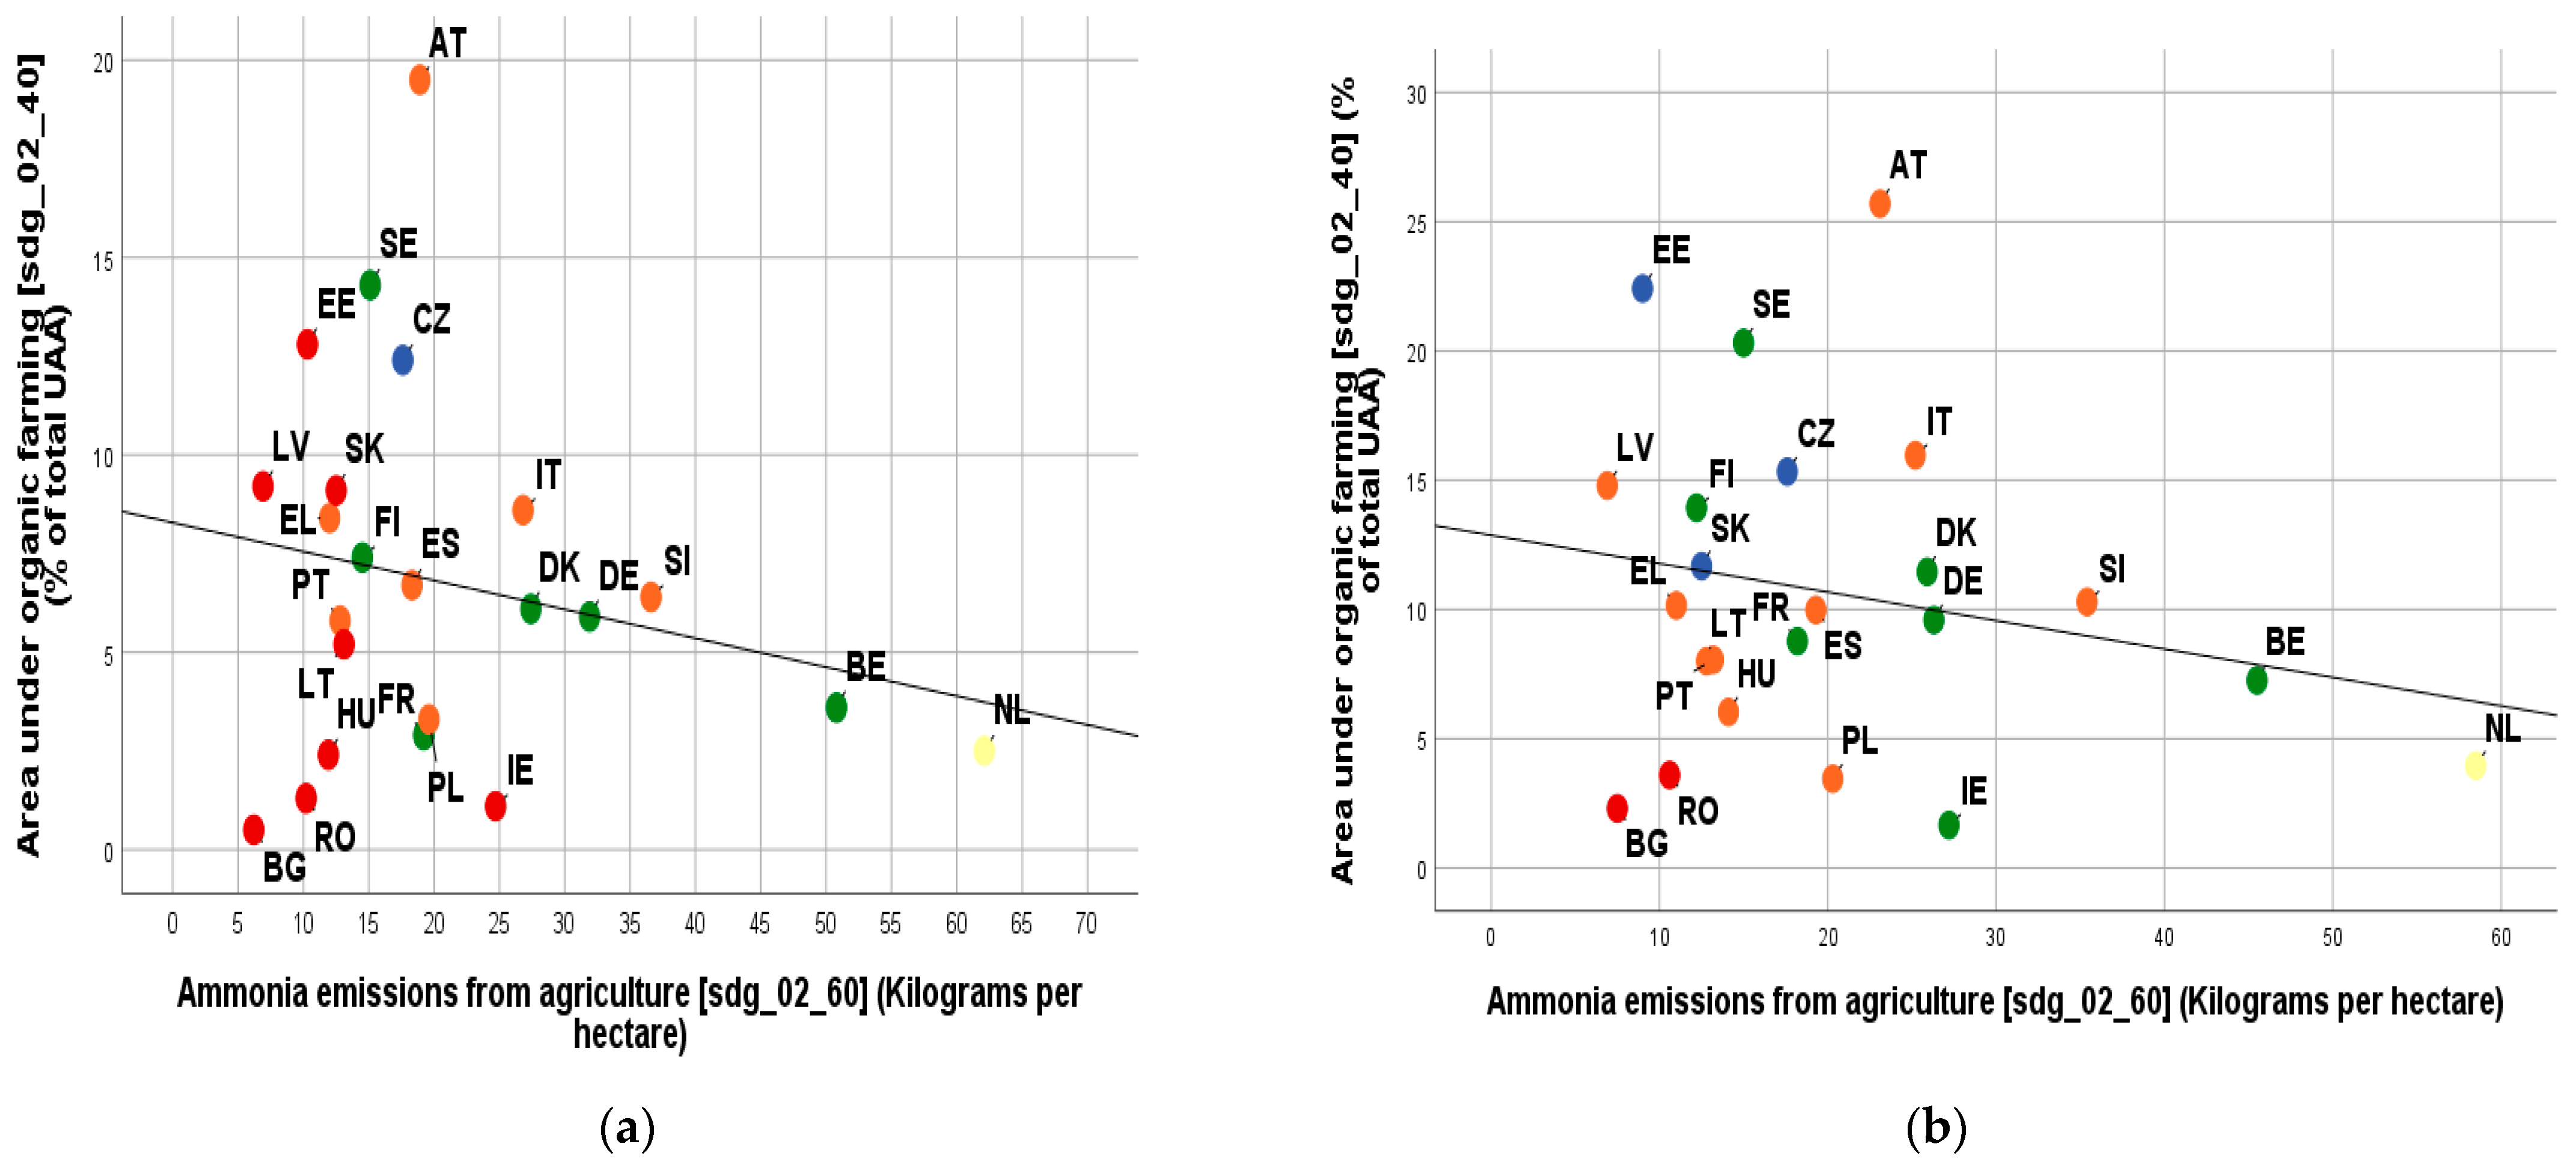
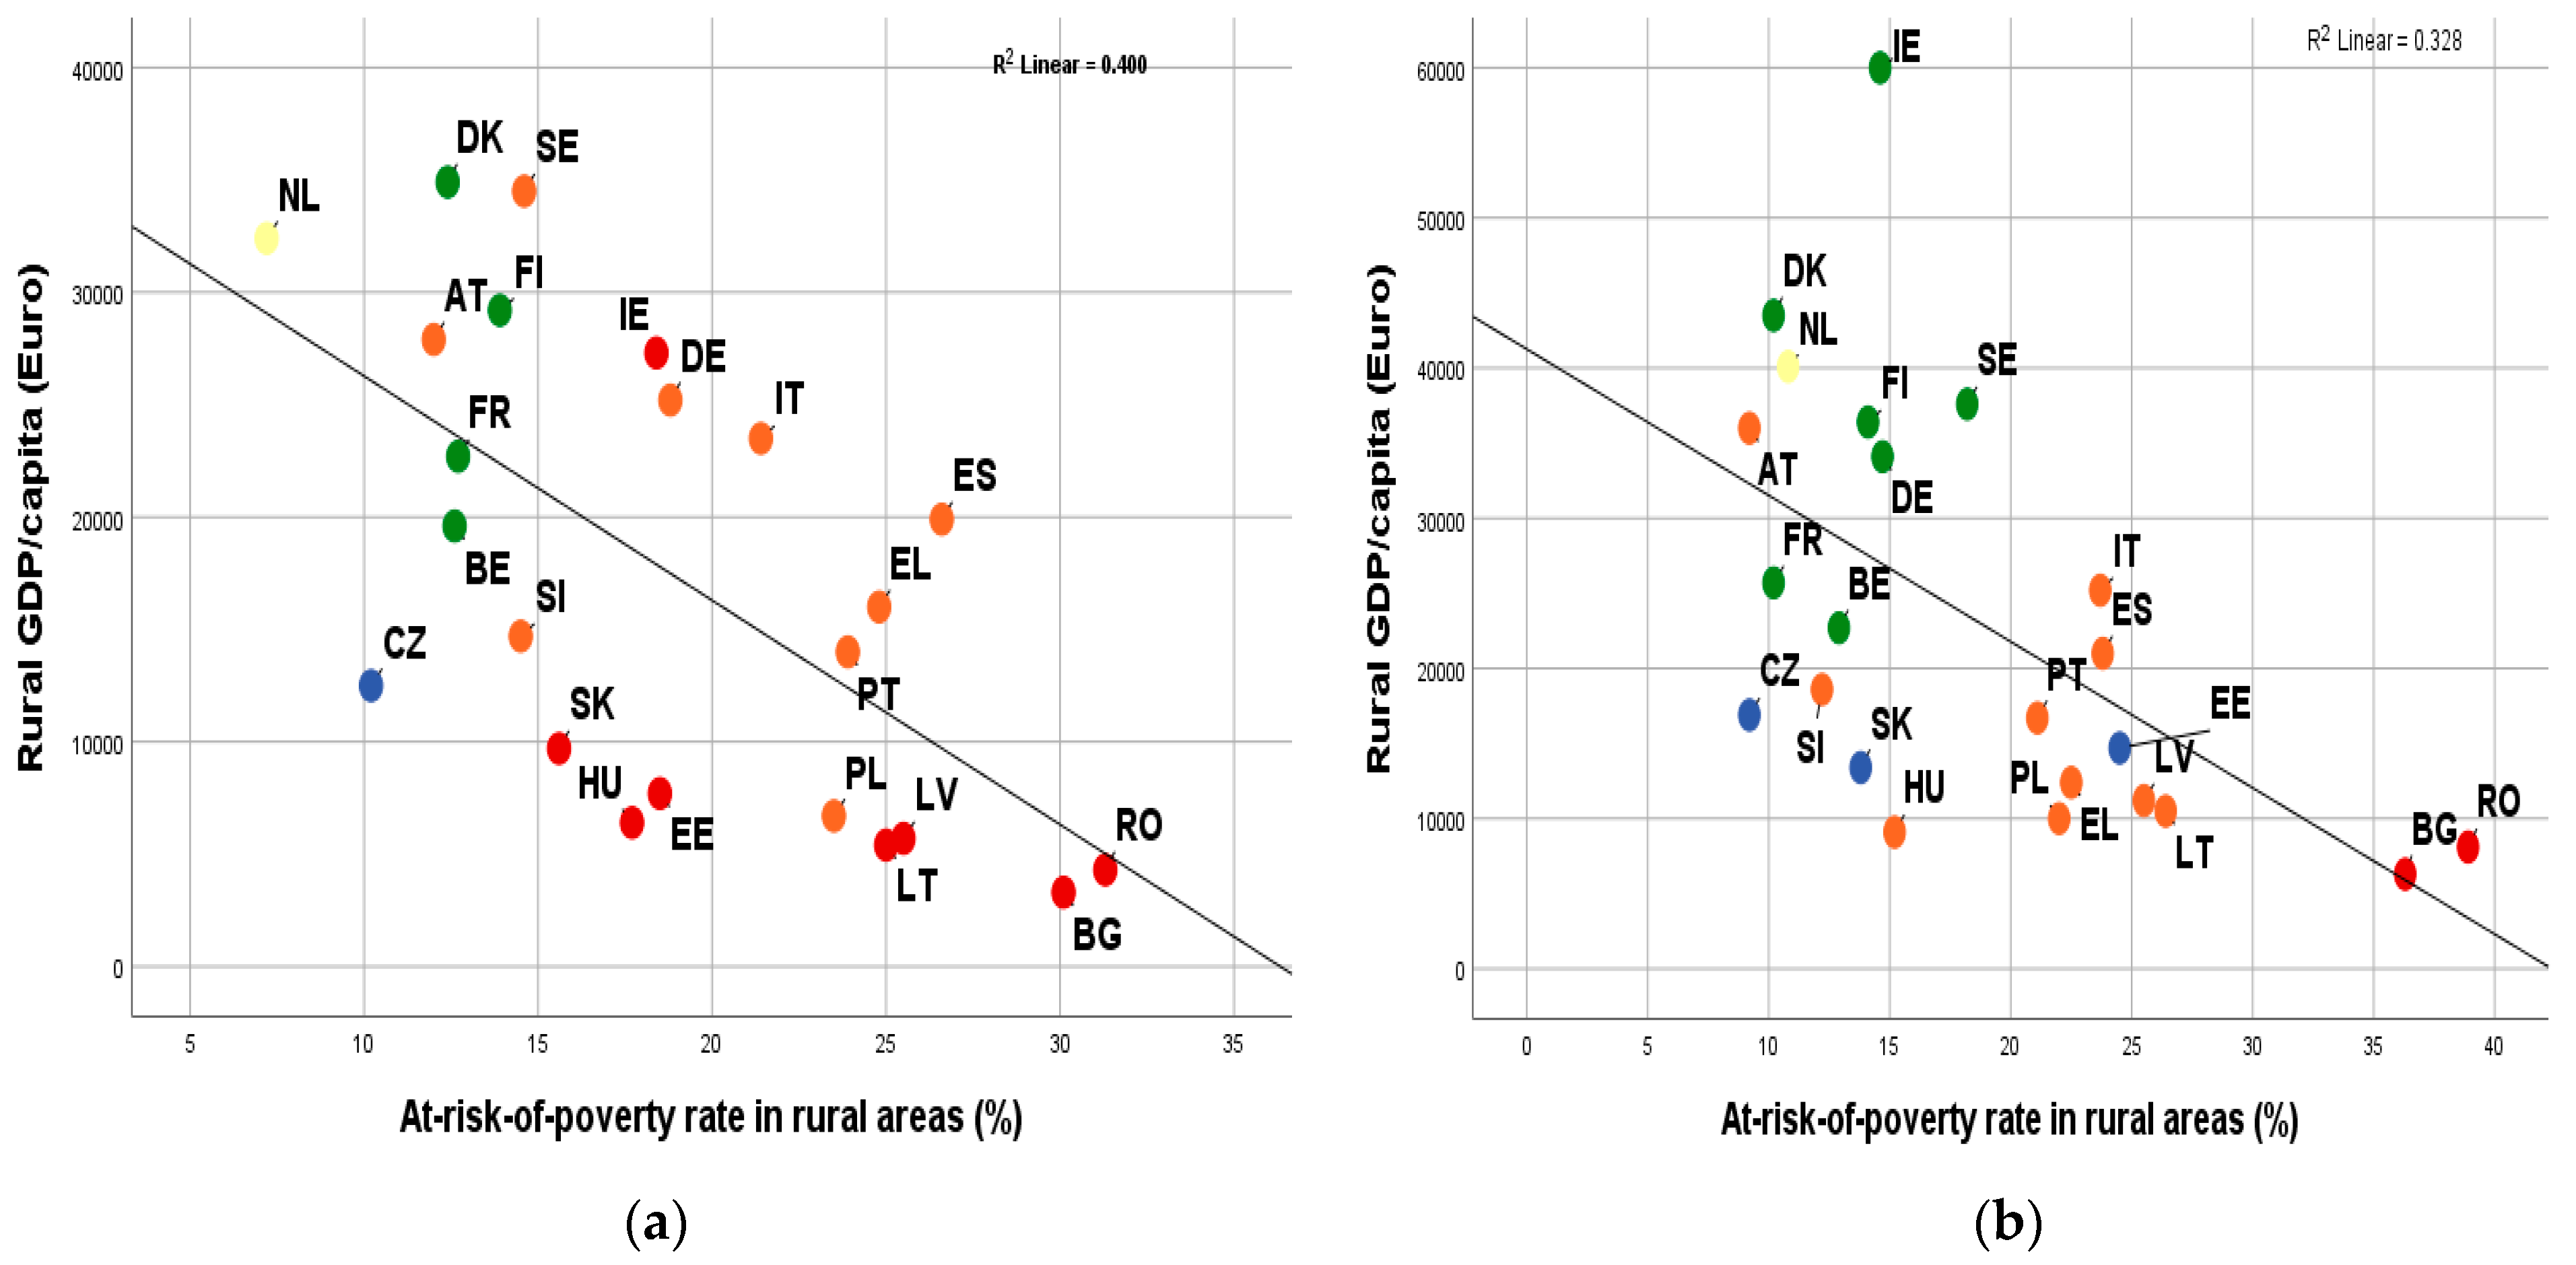
