Article

Effect of Forced Eviction and Land Grabs on Household Economic Capital Security of Displaced Pre-Urban Farmers in Addis Ababa, Ethiopia

Department of Agriculture and Animal Health, University of South Africa, Florida Science Campus, Florida 1710, South Africa
*
Author to whom correspondence should be addressed.
Land 2025, 14(5), 1051; https://doi.org/10.3390/land14051051
Submission received: 27 February 2025 / Revised: 28 March 2025 / Accepted: 18 April 2025 / Published: 13 May 2025

Abstract

:
This study investigates the effects of urbanisation-induced displacement on economic capital security by comparing evicted and non-evicted peri-urban farming households in Addis Ababa, Ethiopia. The research employed a mixed-methods approach. The mixed research method combined a quantitative household survey of 446 households (223 displaced and 223 nondisplaced households) and qualitative Focus Group Discussions with 12 groups involving 96 key informants from Lemmi Kura sub-city of Addis Ababa and Kura Jidda Woreda of Sheger city. Data were analysed using logistic regression, indexes of household economic capital security, and qualitative information thematic content analysis to determine to what extent forced eviction influenced preurban farmers. The key findings of the study revealed that the odds of an evicted household being economically secure are about 27.3% of the odds for non-evicted households. In other words, evicted households are approximately 72.7% less likely to achieve economic security compared to those who have not been evicted. The study concluded that there are significant differences between evicted and non-evicted households regarding household economic capital security. These results underscore the urgent need for policies to end forced eviction, protect agricultural land, and provide sustainable support to displaced preurban farming communities.

1. Introduction

Addis Ababa, Ethiopia’s rapidly expanding capital, captures the tension between urban development goals and the rights of agricultural communities. Over the past 30 years, the city’s population has more than doubled, exceeding five million residents. Rapid population growth in Addis Ababa over the past 30 years can be attributed to several interrelated factors, including significant internal migration, economic transformation, and policy changes. Addis Ababa, Ethiopia’s rapidly expanding capital, exemplifies the tension between urban development and the rights of agricultural communities, as its population has more than doubled over the past 30 years, exceeding five million residents. The built-up area in Addis Ababa has quadrupled between 1990 and 2023, with a notable increase of 224.7% in the built-up areas between 1993 and 2023 [1,2]. Agricultural land has decreased significantly, with a reduction of 15.92% in agricultural land cover over the past two decades [3]. The urban expansion intensity index indicates that urban areas are growing faster than general urban growth, reflecting a shift from agricultural land use to urban use [2].
The encroachment on peri-urban farmlands has led to a decline in food production, contributing to food insecurity in the region [4]. The loss of ecosystem services, valued at approximately USD 90.7 million annually, underscores the economic implications of urban sprawl on food production and climate regulation [2].
Urban expansion significantly impacts small-scale farmers, leading to land expropriations and tenure insecurity. This phenomenon is particularly evident in peri-urban areas where urban growth encroaches on agricultural land, displacing farmers and disrupting their livelihoods. Urban expansion has resulted in extensive land expropriations, particularly in cities such as Addis Ababa and Shinshicho, where agricultural land has been converted for housing and infrastructure development [3,5]. Displaced farmers face severe livelihood insecurity, with studies indicating that evicted households are 92.3% less likely to achieve secure livelihoods compared to their non-evicted counterparts [5]. The loss of agricultural land leads to economic displacement, forcing farmers to seek alternative income sources, which often exacerbates food insecurity [6].
The loss of agricultural land due to rapid urbanisation poses significant threats to food security and ecosystem services, with an estimated annual economic impact of USD 90.7 million due to the reduction in natural land cover [1]. Urban growth in sub-Saharan Africa, particularly in cities such as Addis Ababa and Kampala, has led to substantial reductions in agricultural land, with built-up areas quadrupling in some regions [1,7]. In Kampala, agricultural land decreased from 48.02% to 16.69% between 1989 and 2015, highlighting the urgency of addressing urban sprawl [7]. Deterioration of land quality directly impacts food security, as urbanisation often leads to the loss of fertile agricultural areas and essential ecosystem services [8].
The expansion of Addis Ababa has significantly affected Indigenous Oromo communities, leading to their displacement and the commoditisation of their land. This urban growth, driven by government policies, has resulted in the erosion of traditional systems and livelihoods, as the city expands into surrounding areas historically inhabited by the Oromo. Rapid urbanisation has led to the eviction of Indigenous Oromo farmers, studies indicating that more than 223 families in peri-urban areas have faced significant socio-economic challenges due to land expropriation [9]. The protests against the Addis Ababa master plan highlight the resistance of the community to displacement, which has been perceived as a threat to its cultural identity and rights [10,11]. Commoditisation of farmlands and grazing areas has been a central aspect of urban expansion, undermining existing customary land use practices and traditional values [12]. The government’s approach to land management has often prioritised economic development over the rights of Indigenous populations, leading to inadequate compensation and loss of cultural heritage [13].
Urbanisation in Addis Ababa has significantly affected farmland and green infrastructure, primarily due to population growth and the proliferation of informal settlements. Rapid urban expansion has led to a dramatic increase in built-up areas while simultaneously reducing agricultural land and green spaces. This transformation poses challenges to sustainable development and food security, which require urgent policy interventions. Rapid urbanisation in Ethiopia leads to informal land acquisition, with individuals using false contract documents to claim legal possession, highlighting the challenges of formal land access and the pressures on urban land due to population growth [14]. Rapid urbanisation in Addis Ababa has led to significant land expropriation and displacement of indigenous communities in the peri-urban area and resulted in loss of livelihood and food insecurity, exacerbated by inadequate compensation and rehabilitation measures [9]. The green urban space in Addis Ababa decreased from 120.4 km2 in 1990 to 76.26 km2 in 2021, while the built areas increased by 216.5 km2, highlighting the impact of urbanisation on green infrastructure [15].
Urban expansion from 1986 to 2011 has significantly altered land use, particularly affecting agricultural areas. This transformation is evident in various regions, where built-up areas have increased dramatically, often at the expense of farmland, leading to challenges in food production and sustainability. In central Ethiopia, built areas quadrupled from 1990 to 2023, while arable land declined significantly, highlighting the direct competition between urban growth and agricultural land [1]. In Iwo, Nigeria, the built areas increased from 9.30 km2 in 1982 to 30.69 km2 in 2023, and the farmland showed a decreasing trend, indicating a similar pattern of urban encroachment on agricultural land [16]. Urban sprawl has serious implications for food security, as it reduces the availability of land for agriculture, which is crucial for local food systems [17]. The loss of agricultural land not only threatens food production but also affects the livelihoods of farming households, as seen in Shinshicho, Ethiopia, where urban expansion has led to significant agricultural losses [18]. Urban agriculture is proposed as a viable solution to mitigate these impacts, promoting local food production in urban settings through practices such as rooftop gardens and community farms [19]. Effective urban planning and policy frameworks are essential to balance urban growth with agricultural sustainability, ensuring food security in the middle of rapid urbanisation [17,18]. Although urban expansion poses significant challenges for agriculture and food production, innovative strategies such as urban agriculture and improved land use policies can help address these issues, fostering a more sustainable urban environment.
The urbanisation of Addis Ababa has resulted in profound socioeconomic and environmental challenges that require effective urban development strategies. Rapid expansion of the city has led to significant changes in land use, particularly affecting agricultural land and displaced farming communities. Displacement has led to income losses and unemployment among expropriated farmers, exacerbated by inadequate compensation and resettlement support [3]. Land speculation has further marginalised lower-income groups, complicating access to land ownership [20]. Although urbanisation presents opportunities for development, it also poses significant risks to livelihoods and environmental sustainability, highlighting the urgent need for comprehensive urban planning that prioritises both urban growth and agricultural preservation.
In Ethiopia, land grabs significantly impact vulnerable populations through forced evictions and inadequate compensation, exacerbating urbanisation challenges. The existing land use system is marred by insecurity and corruption in tenure, which requires urgent reforms in ownership rights and compensation practices. Land grabs often lead to forced evictions, particularly affecting farmers in the peripheries of urban areas such as Addis Ababa, resulting in income losses and unemployment. Inappropriate compensation and lack of resettlement support further deteriorate the living conditions of displaced people [21].
Rapid urban expansion in Ethiopia has created significant tenure insecurity among peri-urban farmers, as their land rights are often undermined by state-controlled land acquisition practices [22]. Corruption within the land administration system exacerbates these issues, leading to a disregard for the interests of the local community [23].
There is a pressing need for reforms that prioritise responsible governance of land tenure, ensuring that the rights of local communities are respected and that compensation practices are fair and transparent. Implementing a rights-based approach could help protect the interests of affected populations and promote sustainable development [24].
On the contrary, while the negative impacts of land grabs are evident, some argue that large-scale land investments could potentially improve agricultural productivity and economic growth if managed responsibly. However, this perspective often overlooks immediate human rights concerns and the long-term sustainability of the local community.
Addressing the challenges of urbanisation-induced displacement requires a comprehensive approach. This includes developing fair compensation mechanisms, implementing programmes for skill development and alternative employment for evicted farmers, designing targeted food security interventions, and reforming urban expansion policies to better integrate the needs of peri-urban farming communities. This study bridges gaps in the existing literature by examining how land grabs, forced evictions, and inadequate compensation drive economic capital insecurity in Addis Ababa. Through mixed-method analysis, it highlights the discrepancies between Ethiopia’s urbanisation rhetoric and the realities of displaced farmers, advocating for reforms that align urban growth with economic capital security and agrarian justice.
To assess these comprehensive issues in preurban communities displaced in Addis Ababa, the researcher tried to assess the following key research questions.
  • Is there a significant difference between the economic capital security of evicted and non-evicted preurban households?
  • Is urban expansion-induced eviction significantly and negatively affecting the economic capital security of peri-urban farming households?
By addressing these issues holistically, policymakers and urban planners can work toward more inclusive and sustainable urban development that preserves economic capital, food security, and livelihoods for vulnerable peri-urban communities.

2. Materials and Methods
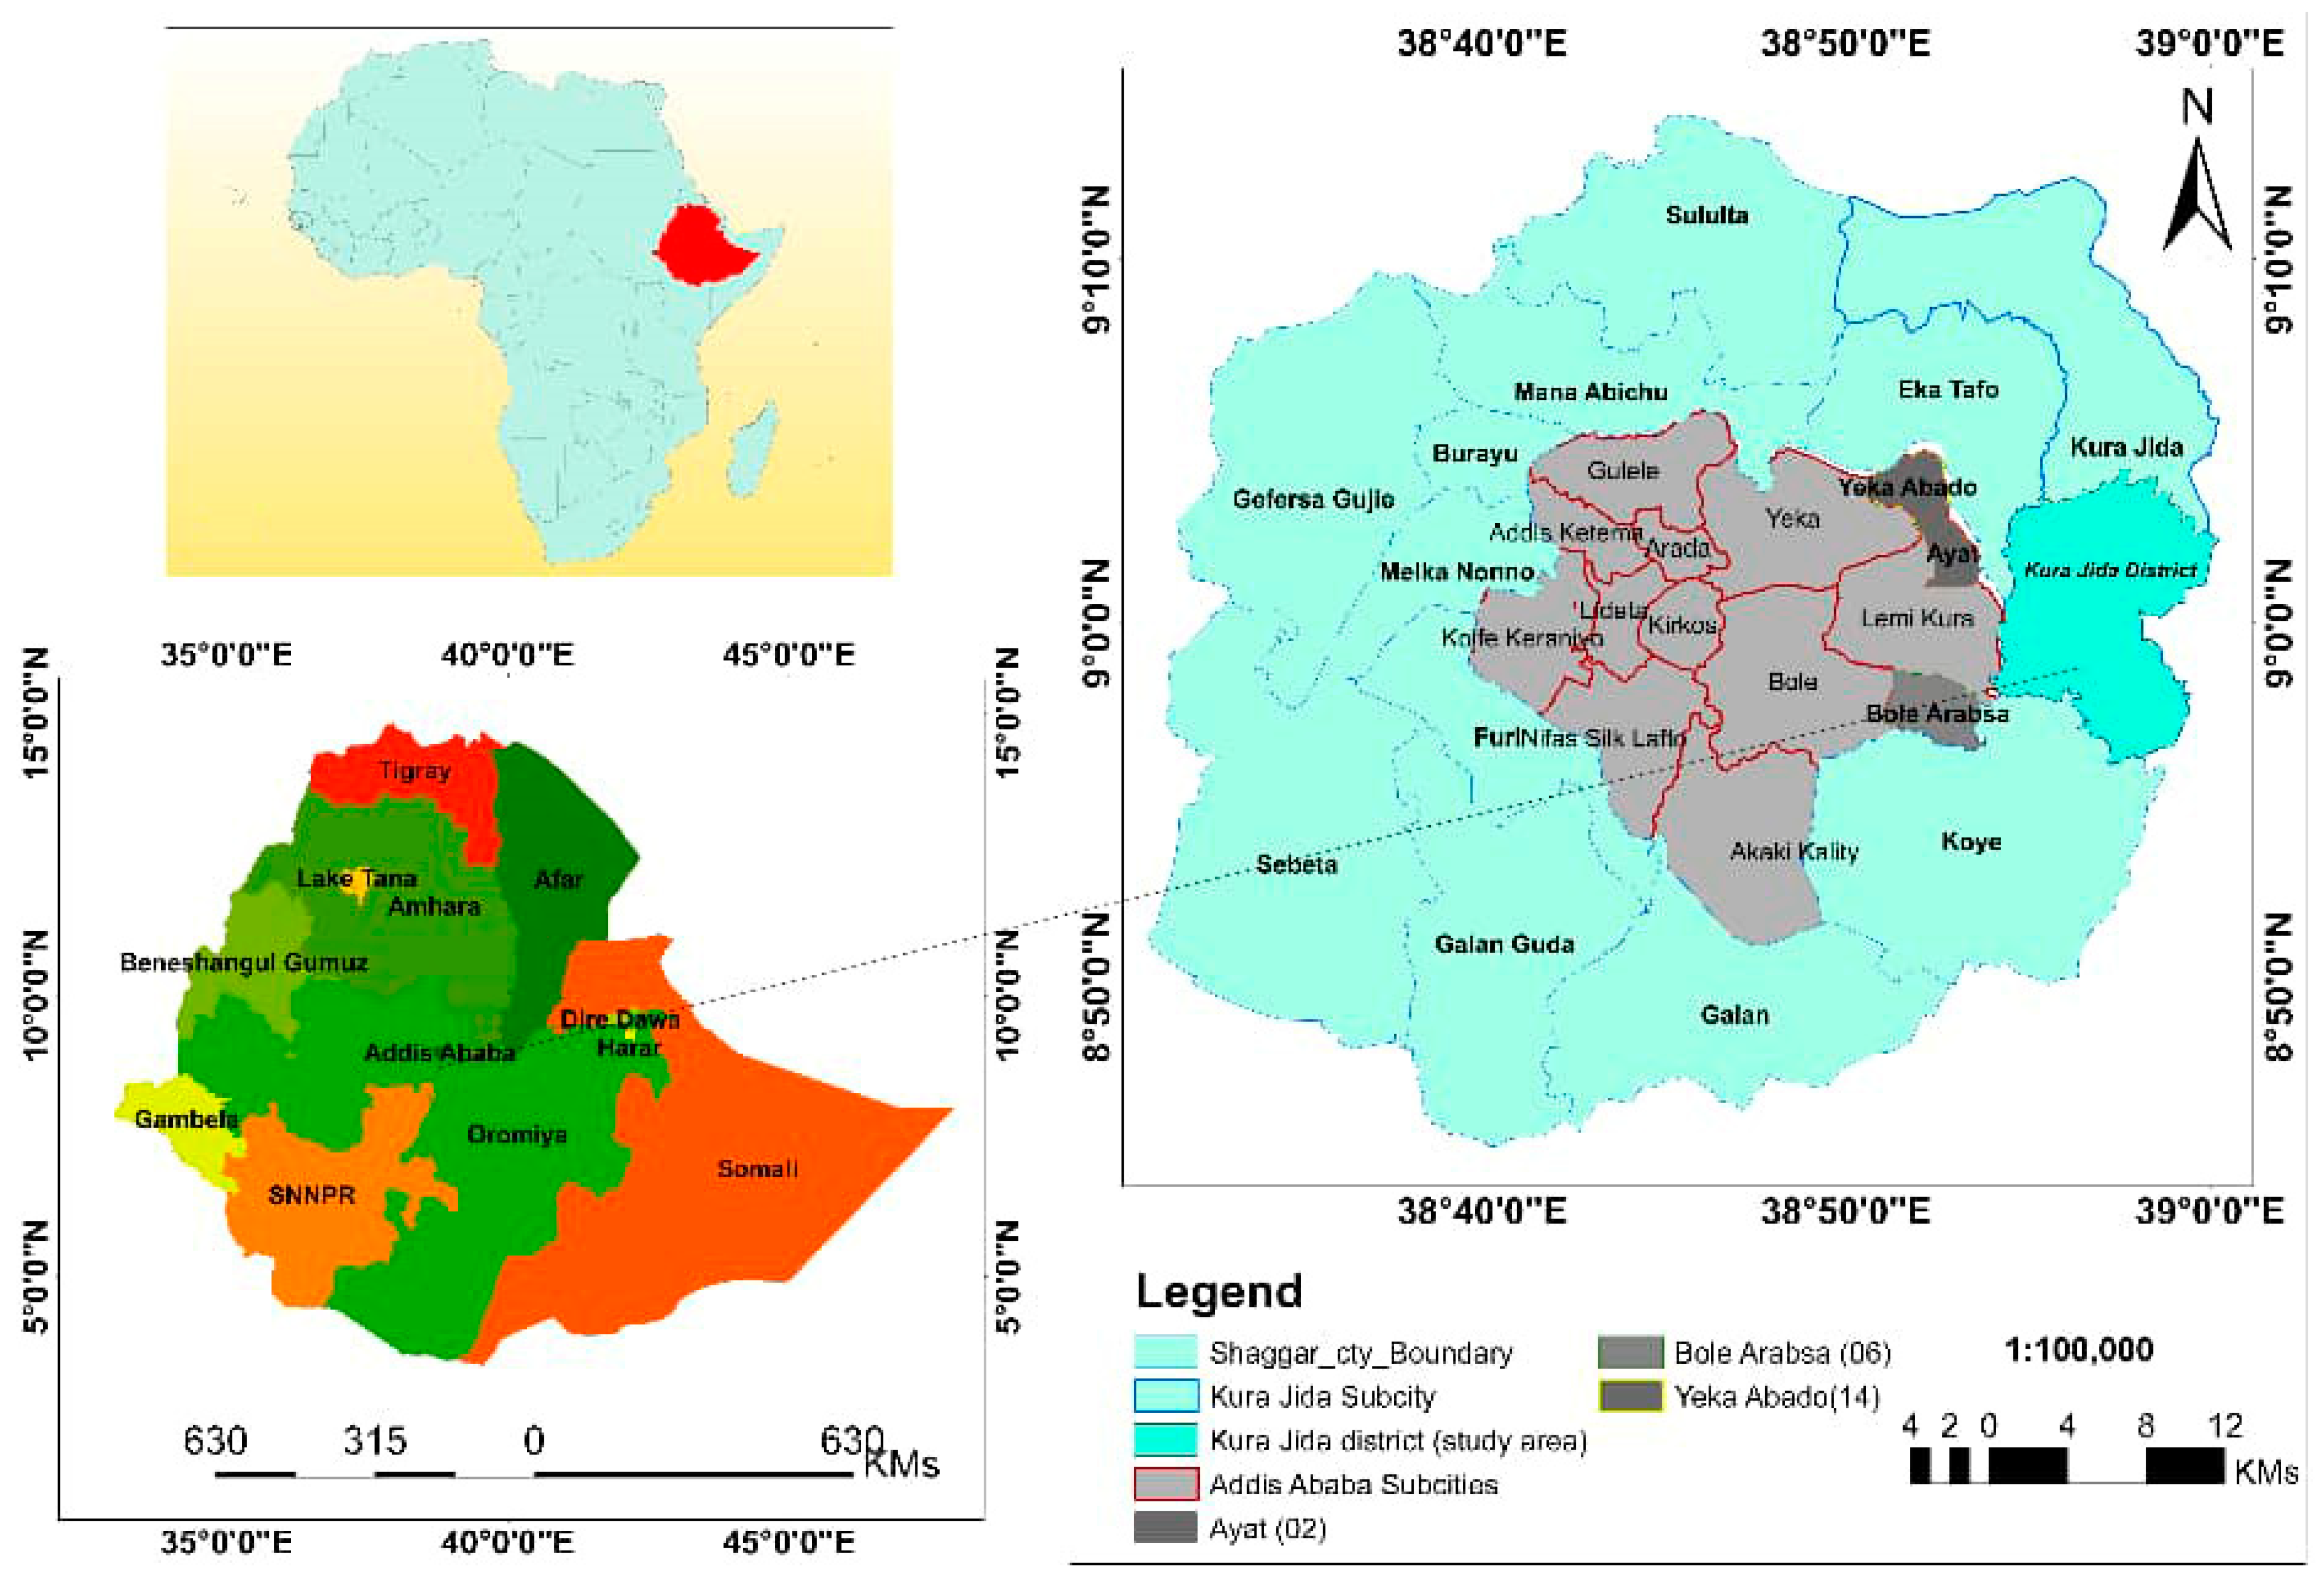
2.1. The Study Area

The study area focuses on the Lemmi Kura subcity of Addis Ababa and the Kura Jidda subcity of Sheger City of Oromia, Ethiopia, with particular emphasis on the impacts of urban expansion on local communities. Lemmi Kura, established in 2019/2020, is one of the city’s designated expansion zones and comprises 10 Woredas, the lowest government structure in Addis Ababa. The study covers specific localities within Lemmi Kura (Figure 1), including Woreda 14 (Yeka Abbado), Woreda 2 (Ayat), and Woreda 6 (Bole Arabsa), which have been significantly affected by urbanisation. Kura Jidda Woreda from the Kura Jidda sub-city of Sheger City, Oromia region, was included for comparative purposes, providing a point of reference from a different administrative region.

2.2. Research Design

The research used a mixed-methods approach, combining a household survey with both quantitative and qualitative approaches to address the main objectives of the study. Due to this and based on the reviewed literature, the researcher collected quantitative data from two sample groups of households (those that have been evicted and those that have not).
The research has two independent sample groups, “treatment” and “comparison”, or the “displaced” and “nondisplaced” groups of farming households. Therefore, the sample frame is the total list of households displaced from treatment villages and non-displaced households from comparison villages. The list of households was obtained from the Lemi Kura Sub-city Urban Agriculture and Rehabilitation Office and the Kura Jida Woreda Agriculture Office.
A multistage random sampling technique was used to select sample households from both “treatment” and “comparison” villages. Three woredas (Woreda 2, 6, and 14) were purposefully chosen from the eight woredas in the Lemmi Kura sub-city, Addis Ababa. This selection was based on the concentration of displaced households that received direct support from the city administration.
A random sample of 223 households from a total of 415 displaced preurban households was selected from the list of those who receive monthly financial support from the city administration. The sample size was proportionally allocated among the selected woredas based on their respective populations. An equal number of control households (223) from Kura Jidda Woreda in Sheger City were selected due to its proximity to Lemmi Kura and its status as the only nearby woreda with nondisplaced households suitable for comparison.
From the total of woredas in the subcity, systematic random sampling was used to choose the final study samples. This method involved selecting every nth item from the population list, where n represents a predefined interval. This approach ensured a balanced representation throughout the population and minimised potential bias.
The Taro Yamane formula is a widely recognised method for calculating the sample size in research, particularly when the population size (N) is known. This formula, expressed as
n = N/(1 + N(e)2)
helps researchers determine the minimum sample size (n) required to achieve reliable results while considering the margin of error (e). The importance of an accurate sample size calculation cannot be overstated, as it directly influences the validity and generalisability of research findings. The formula is versatile, applicable in various research designs, including surveys and clinical studies [25].
Our sample size is calculated from the population size of 415 households receiving direct support, with a margin of error (0.05). Applying the formula, the sample size became n = 415/(1 + 415(0.05)2) = 203. To account for potential non-responses, a 10% contingency was added, bringing the sample size to 223 for the displaced group. An equal sample size was selected for the non-displaced comparison group, resulting in a total sample of 446 households.

2.3. Data Collection

This study used a mixed-methods approach, combining quantitative and qualitative data collection techniques, to comprehensively examine the impacts of urban expansion on peri-urban livelihoods in Ethiopia. The data collection process was meticulously designed to ensure reliability, validity, and triangulation of information from multiple sources.
Quantitative data was collected through structured questionnaires administered to sample households in treatment (displaced) and control (nondisplaced) groups. The questionnaires covered household characteristics related to livelihood capital and outcomes.
To ensure the quality and consistency of data collection, several steps were taken. Ten experienced data enumerators and two supervisors underwent a two-day intensive training programme in a classroom setting. Following training, a pilot questionnaire test was conducted, leading to refinements and the removal of unnecessary or inappropriate questions. A pilot study was conducted in 5% of the households in the sample to ensure the reliability of the data. The Cronbach Alpha test was used to assess reliability and validity, with a coefficient of 0.81 considered satisfactory, within the allowed range for internal consistency.
The household survey was conducted using computer-aided personal interviewing (CAPI), with custom software programmed for each question to minimise data entry errors and streamline the collection process. The survey was conducted from 22 February to 15 April 2024. Throughout the process, the supervisors conducted regular field visits to ensure data quality and compliance with ethical standards.
Qualitative data was collected through Focus Group Discussions (FGDs) and Key Informant Interviews (KIIs) to complement and triangulate the quantitative data. The FGDs were carried out in Woreda 2, 6, and 14 of the Lammi Kura sub-city, with different semi-structured questionnaires developed for the displaced and non-displaced groups. Twelve FGDs were performed, four FGDs in each Woreda sample. Separate FGDs were conducted with groups of adult males and females from both displaced and nondisplaced populations. Each FGD comprises 6–12 participants.
With the consent of the participants, the FGDs were recorded using a tape recorder to ensure accurate and comprehensive documentation of the discussions. This method allowed the interviewer to focus entirely on facilitating the conversation. By conducting FGDs with various demographic groups in multiple Woredas, the researcher ensured data triangulation, improving the validity, reliability, and trustworthiness of the information collected.
The sample size for the qualitative portion was determined based on established guidelines, with a minimum of 12–26 individuals included. At least 25 key informants, purposefully selected from the displaced and nondisplaced groups, participated in in-depth interviews lasting approximately one hour each. The recorded data was transcribed and entered into a computer for subsequent narrative, descriptive, and content analysis.

2.4. Model Specification for Data Analysis

2.4.1. Economic Capital Security Index (ECSI)

The Sustainable Livelihood Security Index (SLSI) model is a comprehensive framework designed to assess and improve the livelihood security of communities, particularly in rural and tribal areas. This model integrates various dimensions of livelihood security, including economic, social, ecological, and infrastructure factors, to provide a holistic view of community well-being. The key components and findings related to the SLSI model are highlighted below.
Economic security: High levels of economic security are crucial, as evidenced by studies showing values of around 0.85 among millet farmers in northeast India [26].
Food and Nutritional Security: This aspect is fundamental, with indices indicating significant improvements in food security through sustainable practices [26].
Ecological Security: Sustainable management of natural resources is essential to maintain ecological balance, which directly impacts food security.
Social Security: Although the economic and food security indices are high, social security remains low, highlighting the need for community involvement and capacity-building initiatives [26].
The Sustainable Livelihood Security Index (SLSI) is an integrated tool that measures agricultural sustainability and livelihood security, including ecological, economic, and social aspects. The SLSI tracks regional development, as demonstrated in the Maharashtra assessment from 2010 to 2019 [27].
The Sustainable Livelihood Security Index (SLS) was constructed by surveying 900 households in Lucknow, focusing on social, economic, infrastructural, health, and microenvironmental aspects. It revealed low index values, particularly for non-notified slum dwellers, indicating precarious livelihood conditions [28].
The Sustainable Livelihood Security Index (SLSI) model is computed using three indices: Ecological Security, Economic Efficiency, and Social Equity, derived from 20 variables to assess agricultural sustainability in Karnataka districts based on their performance in these components [29].
This study quantifies the Economic Capital Security Index (ECSI) based on the economic activities of preurban displaced and nondisplaced households. Data were collected on fifteen identified economic activities. Sample households were asked to indicate their participation in each activity (“yes” or “no”) and to report their annual cash income in Ethiopian Birr (ETB). The ECSI was then calculated for each household using models (2), (3), and (4) described below.
To assess whether a household’s economic capital was secured, the ECSI was converted into a dummy variable. Households were classified as “Economic Capital Secured” (If, ECSI > median) or “Not Secured” (If, ECSI < median) using the median ECSI as the cut-off point.
The Sustainable Livelihood Security Index (SLSI) model was adopted for the economic capital security assessment. This instrument was also used to examine the disparities between the economic capital security of displaced and nondisplaced households.
This study adapts the Sustainable Livelihood Security Index (SLSI) model to establish the Economic Capital Security Index as follows.
Zindj = (Indicator j − Min j)/(Max j − Min j)
where Z indj = standard indicator j,
Max j and Min j = Maximum and minimum values of the indicator j
Then, the Household Economic Capital Security (HECS) for each indicator for each household was calculated using the formula given below:
HECSj = ∑Zindj/N
where HECSj = Household Economic Capital Security for an indicator j, Zindj = summated standardised score of all respondents for an indicator, and N = number of households covered in the study. Once the Economic Capital Security Index for one indicator is constructed, the composite overall “Economic Capital Security Index (ECSI)” is calculated by using the formula given below.
ECSI = ∑WiHECSj/∑Wi
where ECSI = Economic Capital Security is the composite index of all economic activities for the displaced or non-displaced preurban households.
HECSj = Household Economic Capital Security
Wi = sum of the weights of all indicators.
Finally, we used the 14 main economic activity indicators presented in Table 1 to construct the Economic Capital Security Index for displaced and nondisplaced preurban households.

2.4.2. Binary Logistic Regression

The binary logistic model is a statistical method widely used for binary classification tasks in various fields. This model estimates the probability of a binary outcome based on one or more predictor variables, employing a sigmoid function to transform linear combinations of these variables into probabilities. The effectiveness of this model is demonstrated in several studies, highlighting its versatility and robustness in different applications. A study on tangerine production used binary logistic regression to identify significant factors that affect yield, such as education, labour, and use of fertilisers [30]. The model revealed that education and group membership positively influenced production, while farm distance negatively impacted yields. In analysing household poverty in Bengkulu, binary logistic regression identified key predictors such as toilet ownership and family size, achieving a classification accuracy of 89.98% [31]. This application underscores the utility of the model in social research, helping in the formulation of targeted policy. Research on acute respiratory infections in children used binary logistic regression to assess risk factors, finding significant associations with immunisation status and exposure to smoke [32]. The predictive capacity of the model was crucial in identifying high-risk groups for targeted interventions.
The logistic regression model, described in the following equation, was used to examine how various variables influenced the likelihood that farmers were victims of urbanisation.
Ln (PX/(1 − PX)) = β0 + β1 X1i + β2 X2i+ …+ βkXki
The subscript (i) refers to the (i)-th observation in the sample. (PX) signifies the probability of an event occurring for a given set of observed variables (X1i); (PX) also represents the probability of the household achieving economic capital security (having secure economic capital) or not. It also represents the probability of the household achieving economic capital security (having secured economic capital) or not, β0 denotes the intercept term, while β1, β2, …, βk) are the coefficients of the explanatory variables (X1, X2, …, Xu).
Multicollinearity was assessed using the two collinearity statistics, variance inflation factor (VIF) and tolerance values. Finally, the researcher analysed the data using SPSS version 29.
Table 2 shows the explanatory variables that influence the economic capital security of peri-urban farmers. The dependent variable is the probability that the farmer has secured economic capital/not secured.

3. Results

3.1. Expropriated Land Size

The surveyed households lost both farm and residential land from 2000 to 2018. The land was expropriated for various purposes, such as real estate development, government housing projects, and infrastructure development.
Table 3 presents the average expropriated land in two categories: total farmland in hectares (Ha) and residential area in square meters (m2). The data are from a survey conducted in March 2024 and comprise 446 observations.
As shown in Table 3 above, the mean value of the total expropriated farmland is 1.34 hectares. This indicates that, on average, approximately 1.34 hectares of farmland were expropriated per household.
Similarly, the mean value for the expropriated residential area is 183.56 square meters. This average figure indicates that around 184 m2 of residential land was expropriated per evicted household.

3.2. Impact of Eviction on Economic Capital Security (ECS)

3.2.1. Comparison of ECS of Evicted and Non-Evicted Preurban Farming Households

This analysis explores the multifaceted concept of Economic Capital Security (ECS) within the specific context of forced displacement that affects pre-urban farming households in the Lemi Kura subcity of Addis Ababa and Kura Jida Woreda of the Sheger city in Oromia, Ethiopia.
Economic Capital Security (ECS) is a multifaceted concept that integrates various tangible and intangible assets, income streams, and coping mechanisms essential for households to sustain or improve their economic well-being. This composite measure reflects the ability of households to navigate economic uncertainties and maintain stability over time. The tangible assets include physical properties and financial investments that provide a safety net during economic downturns. For example, non-liquid assets can serve as emergency reserves, helping households manage unexpected expenses [33]. However, income streams include regular income from employment or investments, which is crucial for economic security. Households with various income sources tend to experience lower levels of economic insecurity [33]. Comprehension mechanisms, such as savings, insurance, and community support systems, enhance resilience against economic shocks. The ability to neutralise threats is vital to maintaining economic stability [34].
The descriptive analysis revealed a marked difference in the security of economic capital between the two groups. The median ECSI score for evicted households was significantly lower than the median score for non-evicted households (U = 20,516.000, p < 0.001). Furthermore, evicted households exhibited substantially lower total financial capital, with a mean value of 109,234.80 ETB, compared to 218,748.70 ETB for non-evicted households.
The disaggregation of the ECSI into its constituent variables provided further insight into the drivers of this disparity. Evicted households reported significantly lower income from sales of crops and livestock (Table 4), indicating a disruption of traditional agricultural livelihoods. On the contrary, evicted households exhibited a greater dependence on income from other jobs/jobs and received significantly more aid/support from government and nongovernmental organisations (Table 4). This shift suggests a transition toward more precarious income streams and increased dependence on external assistance. Finally, evicted households reported higher income from renting and selling assets, signalling a potential depletion of their economic reserves to cope with displacement.
The Mann-Whitney U test is a nonparametric test that is used to compare differences between two independent groups. It assesses whether the ranks of one group are significantly different from the other group.
The sample group of the non-evicted households has a higher rank of 243.00 than that of the sample group of the evicted households with 204.00 regarding economic capital security. This indicates that the non-evicted households have higher levels of economic security than evicted households.
The U value of 20,516.000 is the test statistic for the Mann–Whitney U test. It is used to determine whether there is a significant difference between the two groups. The Z value of −3.695 is the standard score, which indicates how many standard deviations the U value is from the median of the distribution.
The p-value (0.000), which is less than 0.01, indicates that the result is statistically significant at the 1% level. This means that there is strong evidence to reject the null hypothesis that there is no difference between the two groups.
The researcher applied the effect size formula of (effect size (r) = z/SQRT n) to determine the level of effect. The use of effect size (ES) in statistical analysis has significant implications for understanding the relationship between variables. The effect size provides a quantitative measure of the strength of a phenomenon, which improves the interpretation of research findings beyond the mere statistical significance. This approach allows researchers to assess the practical importance of their results, which is crucial for informed decision-making in various fields. The effect size quantifies the strength of the relationship between variables, offering a clearer picture than p-values alone [35]. Unlike p-values, effect sizes are not influenced by sample size, making them a more reliable measure of the true effect [35]. Reporting effect sizes along with confidence intervals and p-values helps to make evidence-based clinical decisions [36].
The effect size (r) is calculated to be 0.1750, z = 3.695, n = 446, reflecting a low level of effect.
The effect size r is 0.1750, which is considered a small effect size. This suggests that, while the difference between the ranks is statistically significant, the magnitude of the difference is, however, small. The major household economic capital security components are shown in Table 4.
As shown in Table 4, the ECS comprises various economic capital variables, each contributing differently to the overall index. The weights assigned to these variables reflect their relative importance in determining economic security.
  • Income from agricultural sales: Evicted households scored 0.7399 compared to 5 for non-evicted households. The stark difference indicates that non-evicted households have a significantly higher income from agricultural sales, suggesting better access to land and markets.
  • Income from livestock sales: The evicted households scored 0.6637 against 3.3722 for the non-evicted households. This gap reflects the challenges facing evicted households in maintaining livestock and accessing markets for animal products.
  • Income from Employment and Daily Wages: Interestingly, evicted households have a higher weighted score of 0.7534 compared to 0.5247 for non-evicted households. This suggests that evicted households may rely more on casual labour as an income source, possibly due to limited access to stable employment opportunities and lack of access to agricultural land.
  • Income from business activities: Non-evicted households scored 0.4843, significantly higher than 0.2152 for evicted households. This disparity implies that non-evicted households have better opportunities to engage in business activities, which contributes to their economic stability. Non-evicted households participate in small businesses, such as small ruminant trades, grain, pottery, livestock manure, and commission work in their communities. However, such opportunities are rarely available in displaced preurban communities.
  • Income from semi-skilled work: The non-evicted households scored 1.0628 compared to 0.2287 for the evicted households. This indicates that non-evicted households have more access to semiskilled work opportunities, enhancing their economic capital. Non-evicted households engage in making pottery, which generates additional income for the family. Access to raw materials for pottery making in pre-urban communities contributes to participation in pottery making.
  • Remittances and pension income: Remittances provide a slightly higher contribution to the economic capital of evicted households (0.1794) than those of non-evicted households (0.1166). Both groups receive negligible pension income, indicating a limited role in economic security.
  • Income from Renting and Distress Selling Assets: Evicted households make significant income from renting assets (1.7892) compared to non-evicted households (0.0538). Evicted households generate additional income from renting their extra rooms from their service quarters due to their proximity to the urbanised centres. On the contrary, both groups have minimal income from distress selling assets, with evicted households scoring slightly higher at 0.1614 than non-evicted households at 0.0538.
  • Aid and loans: Evicted households receive more aid (0.9776) compared to non-evicted households (0.0179), reflecting their higher dependency on external support. This is because evicted households receive monthly ETB 2200 safety net support from the Addis Ababa city administration. Loan access remains limited for both groups, though slightly higher for non-evicted households.
  • Current Financial Resources: Both groups have similar scores for cash on hand and savings, indicating comparable short-term financial resources.
  • Participation in Income-Generating Schemes: Non-evicted households have a slightly higher score (1.3991) compared to evicted households (1.2780), suggesting better participation in various income-generating activities.
The overall HECSI score is 0.2297 for evicted households and 0.3726 for non-evicted households. The total economic capital in ETB also shows a significant difference, with evicted households having ETB 109,234.80 compared to ETB 218,748.70 for non-evicted households.
The analysis reveals that non-evicted households generally have higher economic security, benefiting from diverse income sources, stable employment, and business opportunities. On the contrary, evicted households rely on casual labour, renting assets, and external aid, highlighting their economic vulnerability.

3.2.2. Impact of Eviction on HECS of Displaced Pre-Urban Households

Logistic regression analysis was applied to evaluate the economic security of households based on various predictors. The results of the binary logistic regression analysis show that the initial model predicts 47.3% of cases correctly, with an overall percentage of 100% for “Secured” but 0% for “Not Secured”.
The results of the analysis indicate that when all predictors were included, the model’s classification accuracy improved significantly to 60.1%, indicating strong predictive power. Omnibus coefficient tests with a chi-square value of 59.688 (p < 0.001) indicate that the model improves significantly over the null model. The Hosmer and Lemeshow test has a Chi-square value of 5.333 with a significance of 0.721. This indicates a good fit for the model. The Model Summary with the −2 Log Likelihood value is 557.307, and the Nagelkerke R Square is 0.167, indicating a modest explanatory power. Table 5 summarises the key results of the effects of eviction on economic capital security.
The results in Table 5 above show the key predictors, and their impact on the economic security of the households is summarised as follows.
The logistic regression model provides an odds ratio of 0.273 for the variable of the eviction category. This value is derived from the logistic regression equation, where the log odds of the dependent variable (household economic security) are modelled as a linear combination of the predictor variables. This means that the odds of an evicted household being economically secure are about 27.3% of the odds for non-evicted households. In other words, evicted households are approximately 72.7% less likely to achieve economic security compared to those who have not been evicted.
The 95% confidence interval for the odds ratio ranges from 0.132 to 0.568. This interval does not include 1, reinforcing the statistical significance of the results. A confidence interval that excludes 1 indicates that the effect is statistically significant and is not due to random chance. The lower bound (0.132) and the upper bound (0.568) suggest that, even in the best-case scenario, eviction drastically reduces the probability of economic security.
The p-value associated with the eviction category is 0.001, indicating strong evidence against the null hypothesis (which posits no effect). This low p-value shows that the relationship between eviction and economic security is highly significant, meaning that we can be very confident in the result.
The p-value (0.001) associated with the odds ratio indicates that the relationship between eviction and economic security is highly unlikely to be due to chance. This strengthens the argument that eviction has a substantial and statistically significant negative impact on economic security.
This finding underscores the adverse impact of eviction on household economic security. Eviction not only disrupts the immediate living situation but also has far-reaching effects on the financial stability of households. The result highlights the importance of policies and interventions to prevent evictions to improve economic security among vulnerable populations.
The binary regression analysis (Table 5) reveals that forced eviction is the most statistically significant determinant of reduced economic capital security for peri-urban farming households in Lemi Kura Subcity, Addis Ababa. Evicted households are 73% less likely to achieve economic security compared to non-evicted households (Exp(B) = 0.273, p = 0.001) 16. This is consistent with the findings of mixed-methods studies showing that eviction disrupts access to agricultural land, livestock, and stable income streams, forcing households to rely on precarious casual labour and inadequate safety nets.
Key Determinants of Economic Security:
Physical capital security: A one-unit increase in physical capital security (for example, land tenure, tools, or housing) increases the odds of economic security by 136% (Exp(B) = 2.364, p = 0.001). Non-evicted households retain access to farmland, livestock, and pottery-making infrastructure, which explains their higher income from agriculture (score 5 vs 0.7399 for evicted households) and semi-skilled work (score 1.0628 vs. 0.2287). However, evicted households lose these assets during displacement, exacerbating reliance on rental income (score 1.7892) and aid (score 0.9776).
ICT Security: Access to digital tools (for example, mobile banking and market information) increases the probability of economic security by 79% (Exp(B) = 1.791, p = 0.013). Non-evicted households benefit from proximity to urban markets and communication networks, facilitating business activities such as livestock trading (score 0.4843 vs. 0.2152 for evicted households). Evicted households, often relocated to peripheral areas, face infrastructure deficits that limit the adoption of ICT.
Variables such as education level, marital status, and social security did not show a statistically significant impact (p > 0.05). This suggests that systemic displacement-related asset loss, not individual demographics, drives economic vulnerability. For example, both groups reported similar short-term financial resources (cash/savings scores), but evicted households faced long-term instability due to disrupted livelihood systems.
The findings underscore the need for in-kind compensation (e.g., land, housing) to preserve physical capital; inclusive urban planning to integrate displaced households into decision-making; and investments in ICT infrastructure in resettlement areas to enable market access. These measures could mitigate the 46% income gap between evicted households (ETB 109,234.80) and non-evicted households (ETB 218,748.70).

3.2.3. Results of the Qualitative Analysis

Urban expansion, driven by population growth and economic development, often invades Peri-urban areas, leading to significant economic challenges for existing households. These communities, which are highly dependent on agriculture, face severe disruptions as urbanisation transforms agricultural land and alters local economies. This section delves into the economic deprivation experienced by peri-urban households due to urban expansion, drawing from first-hand accounts of displaced individuals and academic research.
i.
Loss of livelihoods and economic challenges:
Participants in the Focus Group Discussion (FGD) of this investigation reported losing their agricultural and grazing land to urban expansion and development projects. This loss has severely affected their main source of income, leading to food insecurity and economic hardship. As a participant from the Lemmi Kura subcity of Addis Ababa described, “Our agricultural land was taken from us repeatedly from 1997 to 2018”. Another echoed, “Converting peri-urban agricultural land into residential plots and real estate has disrupted our economic activities, leading to income loss and affecting our ability to sustain our livelihoods”.
Forced evictions have resulted in a significant decrease in household income and economic stability, pushing many into dependence on external aid. A participant shared that “since we were displaced, our family’s income level has declined dramatically, exposing us to hunger”. Another said: “Rising food and energy prices have resulted in acute poverty in our communities”.
ii.
Challenges in Transitioning to Non-Agricultural Livelihoods:
Participants in FGD faced difficulties transitioning to non-agricultural livelihoods due to a lack of education, skills, and experience in urban economic activities. They highlighted the need for targeted training and support to develop alternative employment skills. One participant said: “It is very difficult to transition to new livelihood activities without the necessary education or skills”. Another said, “We need to change to accommodate new economic sectors, but not everyone has access to training programmes”.
The struggle to adapt has led to further economic hardship and social challenges. Some families have resorted to begging or migrating in search of alternative livelihoods, while others have experienced family breakdowns. One participant noted: “Without jobs, some of our families have fallen on the streets, and others have migrated to unknown regions”.
iii.
Inadequate Compensation and Resettlement:
Participants expressed dissatisfaction with the compensation received for their lost farmland, describing it as “very modest” and “insufficient”. Compensation, often minimal in terms of finances, was inadequate to buy replacement land or housing. A participant noted: “The compensation was 3.70 birr per square meter of farmland and was insufficient”. Others suggested that in-kind compensation, such as housing or business opportunities, would be more beneficial.
The compensation process was marred by corruption and inequality. A participant lamented: “During the compensation processing, there were many corruptions”. Another said: “Promises of long-term support were not fulfilled, leaving us in worse conditions”.
In general, displacement and inadequate compensation have led to a deterioration in the living standards of rural Peri-urban farming households, which leaves them struggling to maintain their livelihoods and family well-being.

4. Discussions

Economic/financial capital security, which is one of the major components of the composite Sustainable Livelihood Security (SLS), is analysed and synthesised in this subsection. To assess the difference in economic capital security of evicted and non-evicted Peri-urban farming households in Addis Ababa, the Mann–Whitney U test, a nonparametric test, was used to compare the differences between the two independent groups. This test assesses whether the mean ranks of one group are significantly different from the ranks of another group. The null hypothesis tested under this subsection was H0: The economic security of the evicted and non-evicted households is the same.
The mean rank for non-evicted households (243.00) is higher than that for evicted households (204.00), indicating that non-evicted households have higher levels of economic security on average. The U value of 20,516.0, a Z value of −3.695, and a p-value of 0.000 (less than 0.01) indicate a statistically significant difference between the two groups at the 1% level. Therefore, the null hypothesis that there is no difference between the groups is rejected. The rejection of the null hypothesis on the relationship between eviction and economic security suggests a significant association between these two factors, indicating that eviction may indeed contribute to economic instability. Eviction is associated with increased financial distress, as evidenced by studies showing that evicted households experience a decrease in access to credit and durable consumption for several years after eviction [37]. Financial stress often precedes eviction, indicating that eviction is both a consequence and a cause of economic hardship, perpetuating a cycle of poverty [38].
The detrimental effects of forced displacement on economic well-being are well documented, particularly in the context of agricultural livelihoods in preurban communities. Displacement disrupts these livelihoods, leading to increased dependence on precarious income sources and increased vulnerability. This overview will explore the impacts of displacement on economic security, the shift to precarious labour, the dependence on aid, and the implications of asset depletion.
Displaced households are 92.3% less likely to have secure livelihoods compared to non-evicted households, highlighting the severe economic consequences of forced eviction [5]. The disruption of agricultural activities, a cornerstone of economic security, leads to significant income loss and food insecurity.
Evicted households often turn to daily wage labour, which is characterised by instability and low income, exacerbating their economic vulnerability [39]. The shift to precarious labour sources increases the risk of poverty and economic instability for displaced populations.
Many displaced people depend on aid, indicating a critical need for targeted interventions that address their specific economic needs [40]. Effective resettlement policies are essential to mitigate the socioeconomic impacts of displacement and support livelihood recovery [39].
Increased income from renting or selling assets can lead to a “downward spiral” of asset depletion, affecting long-term economic stability [41]. This is consistent with theories on asset depletion, which suggest that reliance on short-term financial strategies can jeopardise future economic security.
On the contrary, some argue that forced displacement can lead to new economic opportunities in urban settings, as displaced people can adapt and find new livelihoods. However, this perspective often overlooks the immediate and severe impacts on their existing economic structures and social networks.
Erosion of agricultural foundations: The dramatic reduction in income derived from crop and livestock sales among evicted households (0.740 vs. 5.000 and 0.664 vs. 3.372, respectively) signifies a profound disruption of their primary livelihood activity. This loss extends beyond immediate income. The displacement of preurban farming households affected their asset accumulation by diminishing agricultural income. Limits the capacity to accumulate assets, hindering future productivity and investment. Evicted households experience a 92.3% decrease in secure livelihoods compared to non-evicted households, indicating severe economic vulnerability [5]. The agricultural income of the tenant farmers in Pakistan decreased from 65% to 25% of the total income after eviction, leading to increased dependence on alternative income sources [42]. The loss of agricultural income significantly hampers the ability of displaced households to accumulate assets, which is crucial for sustainable livelihoods. Displacement often results from urban growth, land expropriation, or climate-induced factors, leading to decreased agricultural productivity and increased food insecurity. Displacement due to urban expansion leads to reduced farmland availability, disrupts agricultural practices, and causes substantial income losses for farmers [6]. Displacement disrupts established social networks, further complicating recovery and asset-building efforts [43].
Precarious Diversification: Although evicted households show a higher proportion of income derived from daily wage/casual labour (0.753 vs. 0.525), this does not necessarily represent a positive adaptive strategy. Instead, it reflects a forced transition to more precarious and less stable employment opportunities.
Labour market vulnerabilities significantly impact displaced households, particularly those engaged in casual labour markets characterised by low wages and limited job security. These conditions exacerbate their susceptibility to economic shocks, as evidenced by various studies on precarious employment. Precarious employment (PE) is associated with poor health outcomes and social inequities, and many initiatives on the labour market do not adequately address these issues [44]. In Delhi, a significant proportion of informal workers lack social security, leaving them exposed to economic instability [45].
Skill mismatch is another factor that affects displaced preurban households. The skills and experience acquired through farming may not be directly transferable to available employment opportunities, leading to underemployment and reduced earning potential.
Asset Depletion as a Coping Mechanism: The elevated levels of income generated from renting or selling assets among evicted households (1.789 vs. 0.054 and 0.161 vs. 0.054, respectively) should be interpreted with caution. The phenomenon of distress selling, in which households liquidate assets to meet immediate survival needs, has significant long-term consequences on their economic stability and wealth accumulation. This process not only provides temporary relief but also diminishes the households’ capacity to generate future income, leading to increased vulnerability to economic shocks. Distress sales often result in the loss of productive assets, which are crucial for generating income over time [46]. Households that participate in distress sales become more susceptible to future economic shocks, as they lack the necessary resources to cope with unexpected financial burdens [47]. Asset depletion can increase poverty, as families may find themselves in a cycle in which they are forced to sell more assets to survive, further reducing their economic standing [46].
Aid Dependence and its Limitations Significantly higher dependence on government and non-governmental assistance among evicted households (0.978 vs. 0.018) underscores their vulnerability and dependence on external support. Aid plays a critical role in providing immediate relief during crises; however, it often fails to foster sustainable livelihood strategies, leading to dependency. This dependency can create disincentives to self-reliance and can hinder long-term resilience. Case studies indicate that, while aid can alleviate immediate poverty, it must be integrated with strategies that promote self-sufficiency and community resilience [48]. Dependency syndrome can lead to political violence, poverty, and lack of innovation, which ultimately affects sustainable development in regions such as Africa [49].
Relative stability in limited areas: The similarities in indicators like cash on hand and savings in banks (0.561 vs. 0.570 and 0.650 vs. 0.641, respectively) may reflect coping mechanisms in the very short-term and are not indicators of true security.
In summary, the computed ECSI scores (0.259 for evicted vs. 0.313 for non-evicted, unweighted; 0.230 vs. 0.373, weighted) should not be treated as absolute measures but rather as relative indicators of economic capital security. Scores provide a valuable summary of the overall economic status of the two groups, but their true value lies in the disaggregated analysis of the underlying variables. The difference in ECSI weighting is also noteworthy. Given the disproportionate role agriculture plays, it makes sense that the gap would be significantly larger when weights were applied.
The logistic regression model provides an odds ratio of 0.273 for the eviction category variable, indicating that evicted households are approximately 72.7% less likely to achieve economic security than non-evicted households. The 95% confidence interval for the odds ratio (0.132 to 0.568) reinforces the statistical significance of the results. The p-value of 0.001 further strengthens the argument that eviction has a substantial and statistically significant negative impact on economic security [50].
Similarly, participants in the Focus Group Discussion (FGD) reported losing their agricultural and grazing land due to urban expansion and development projects. This loss of their main source of income and livelihood has severely impacted their ability to grow crops and raise livestock, leading to food insecurity and economic hardship.
Participants in the FGD reported a significant decrease in their household income and economic stability after evictions, leading to increased food insecurity, loss of assets, and dependence on external aid. The loss of their agricultural livelihoods and the lack of alternative employment opportunities have contributed to their economic challenges and deprivation.
Forced eviction and land loss had severe consequences for rural households. They lost their main sources of income, including agricultural land, grazing land, and other assets, leading to a disruption of their way of life, loss of income, and an inability to provide for their families, particularly with respect to education, food, and employment opportunities.
The evicted in the study area struggled to transition to non-agricultural livelihoods due to a lack of education, skills, and experience in urban economic activities. They expressed the need for targeted training and support to develop the skills necessary for alternative employment and entrepreneurialism. The inability to find suitable jobs has caused further economic hardship and social challenges for displaced households.
The FGD participants also expressed dissatisfaction with their compensation for lost farmland, describing it as “very modest” and “insufficient”. They felt that compensation was inadequate to purchase replacement land or housing. Some participants suggested that in-kind compensation, such as housing or business opportunities, would be more beneficial.
The compensation received by the participants was inadequate and did not match the value of the lost land and assets. The compensation was not distributed equally among all family members, and the children were not compensated. The participants were unhappy with the compensation process, which needed more transparency and fairness. Similar findings and studies concluded that compensation often does not reflect the true value of lost land and assets, as seen in Dumai City, where landowners felt compensation was unsatisfactory [51]. In Malawi, customary land compensation is based on market value, which does not adequately account for the unique characteristics of such properties, leading to inadequate compensation [52].
This finding underscores the adverse impact of eviction on household economic security, highlighting the need for policies and interventions to prevent evictions and improve the economic stability of vulnerable populations. A similar study highlighted the urgent need for reforms in compensation assessment mechanisms to ensure fairness and transparency, which could involve better consultation with affected communities [53]. Addressing these issues is crucial to improving the economic stability of those affected by land acquisition and preventing future evictions.
The broader implications of these findings suggest that urbanisation and development-induced displacement have far-reaching effects on affected households’ economic and social stability. Studies have shown that such displacements impact immediate economic conditions and exacerbate long-term vulnerabilities, particularly among disadvantaged groups [54].

5. Conclusions and Policy Implications

In conclusion, the analysis of economic capital variables highlights significant disparities between evicted and non-evicted households, underscoring the economic vulnerability of evicted households. Non-evicted households generally exhibit higher economic security, benefiting from diverse income sources, stable employment, and business opportunities (e.g., agricultural sales, livestock, and semi-skilled work). On the contrary, evicted households rely more on casual labour, renting assets, and external aid, which are less stable and sustainable. The overall Economic Capital Security Index (ECSI) scores and total economic capital in ETB further emphasise these differences, with evicted households scoring lower in both metrics. Addressing these disparities requires targeted interventions to improve access to stable employment, business opportunities, and financial resources for evicted households, thus reducing their economic vulnerability and promoting broader economic security.
The analysis of the provided data highlights the complex ways in which forced displacement erodes economic capital security among pre-urban farming households. The loss of agricultural livelihoods, the forced transition to precarious employment, and the distress sale of assets represent significant challenges to their long-term well-being. Interventions must go beyond simply providing immediate relief to address the underlying structural factors that contribute to the vulnerability of displaced communities. This requires policies that promote sustainable livelihoods, protect property rights, and ensure meaningful participation in development processes.
The quantitative analysis reflects a significant difference in economic security between the evicted and non-evicted households. Furthermore, the odds ratio analysis for the status of eviction is 0.273, indicating that evicted households are approximately 72.7% less likely to achieve economic security than non-evicted households, which emphasises the adverse impact of eviction on economic security, highlighting the need for policies that prevent evictions and improve the economic stability of affected households.
The findings of this study underscore the need for comprehensive policy interventions to mitigate the negative impacts of displacement and promote the economic security of affected populations. These interventions should include the following.
  • Compensation in the form of shareholding: To address the lost intergenerational resources of displaced farmers, policymakers should compensate them with in-kind shareholding from private investments, real estate, and government housing projects through public-private partnerships.
  • Land Restitution and Compensation: Prioritise fair and equitable land restitution and compensation schemes for evicted households, allowing them to rebuild their agricultural livelihoods.
  • Skills Development and Employment Programmes: Provide targeted skills development and employment programmes to equip evicted households with the skills necessary to transition to alternative income-generating activities.
  • Microfinance and Access to Credit: Facilitate access to microfinance and credit services to support the development of small businesses and entrepreneurs.
  • Social safety nets and cash transfer programmes: Strengthen social safety nets and implement targeted cash transfer programmes to provide immediate relief and prevent further asset depletion.
  • Participatory Planning and Community Engagement: Engage affected communities in participatory planning processes to ensure that development initiatives are aligned with their needs and priorities.
The researcher also recommends a longitudinal study on the empirical analysis of the impacts of urban expansion on economic security and livelihood sustenance of periurban communities surrounding Addis Ababa City, Ethiopia, which is highly justified for several compelling reasons:
i.
Capturing Dynamic Changes: Urban expansion is an ongoing process that unfolds over time. A longitudinal study would allow the researcher to capture the dynamic nature of these changes and their evolving impacts on Peri-urban communities. It enables the observation of gradual shifts in livelihood strategies, land use patterns, and socioeconomic conditions as urban areas invade peri-urban spaces.
ii.
Long-term Impact Assessment: The effects of urban expansion on livelihoods are gradual but develop over extended periods. A longitudinal approach would allow one to assess both short- and long-term impacts. It would help to understand how communities adapt to changes over time and the sustainability of these adaptations.
iii.
Policy Evaluation: Longitudinal data can provide valuable information on the effectiveness of policies and interventions to manage urban expansion and support periurban livelihoods. It allows for evaluating policy outcomes over time, helping to identify successful strategies and areas needing improvement.
iv.
Tracking Socio-economic Trajectories: By following the same communities over time, the researcher can track individual and household socioeconomic trajectories, providing a nuanced understanding of who benefits or loses from urban expansion.
v.
Identifying Tipping Points: A longitudinal study can help identify critical tipping points or thresholds at which urban expansion begins to impact peri-urban livelihoods, significantly informing proactive policy measures.
vi.
Understanding Adaptation Strategies Over time, communities develop various strategies to adapt to changing circumstances. A longitudinal study would allow observation and analysis of these evolving adaptation strategies.
vii.
Informing Sustainable Urban Planning: Long-term data on the impacts of urban expansion can inform more sustainable and inclusive urban planning strategies that consider the needs of Peri-urban communities.
viii.
Capturing Intergenerational Effects: A longitudinal study can reveal how urban expansion impacts different generations within urban Peri communities, providing information on issues of intergenerational equity.
ix.
Understanding Resilience Observing communities over time allows the researcher to gain insight into factors that contribute to community resilience and urban expansion pressures.
x.
Contextualising Rapid Changes Addis Ababa is one of the fastest-growing cities in Africa. A longitudinal study can contextualise this rapid growth and its implications for surrounding areas.
xi.
Comparative analysis: Long-term data would allow for a comparative analysis with other rapidly expanding urban areas, contributing to broader theories of periurban development.
xii.
Methodological Rigour: Longitudinal studies provide more substantial evidence for causal relationships between urban expansion and change in livelihood, improving the reliability of the findings.
xiii.
Informing Future Scenarios: Long-term data can inform predictive models and future scenarios, helping policymakers and planners anticipate and prepare for future challenges.
A longitudinal study on this topic is well justified, as it provides a comprehensive, dynamic, and nuanced understanding of the complex interactions between urban expansion and peri-urban livelihoods. This approach can provide valuable information for policymaking, urban planning, and sustainable development strategies in rapidly growing urban areas such as Addis Ababa.

Author Contributions

Conceptualization, K.G. and M.A.; methodology, K.G. and M.A; software, K.G.; validation, K.G., M.A. and B.A.; formal analysis, K.G.; investigation, K.G., M.A. and B.A.; resources, K.G.; data curation, K.G.; writing—original draft preparation, K.G.; writing—review and editing, K.G., M.A. and B.A.; visualization, K.G.; supervision, M.A. and B.A.; project administration, K.G.; funding acquisition, K.G. All authors have read and agreed to the published version of the manuscript.

Funding

UNISA has partially supported the authors for covering the APC. Other than this, the corresponding author covered all research expenses from his private source.

Institutional Review Board Statement

The researcher obtained ethical approval for this research study from the Ethics Committee of the School of Agriculture and Environmental Sciences of the University of South Africa (UNISA) in January 2024. Our research study adheres to the principles outlined in the Declaration of Helsinki. We confirm that all procedures performed in this study involving human participants were in accordance with the ethical standards of the institutional research committee and with the Declaration of Helsinki of 1964 and its subsequent amendments or comparable ethical standards. Written informed consent was obtained from all individual participants included in the study. However, the researchers used anonymity for ethical purposes. No minors were involved in this study, as only participants over 18 years of age were selected and interviewed.

Data Availability Statement

The raw data were generated from the household survey by the authors. Data derived to support the findings of this study are available from the corresponding author, Kejela Gnamura, on request.

Conflicts of Interest

The authors declare that they have no conflicts of interest, including those that could be perceived as influencing the publication of this research.

References

  1. Yasin, K.H.; Iguala, A.D.; Gelete, T.B. Spatiotemporal analysis of urban expansion and its impact on farmlands in the central Ethiopia metropolitan area. Discov. Sustain. 2025, 6, 36. [Google Scholar] [CrossRef]
  2. Hailu, T.; Assefa, E.; Zeleke, T. Urban expansion-induced changes in land use and its effect on ecosystem services in Addis Ababa, Ethiopia. Front. Environ. Sci. 2024, 12, 1454556. [Google Scholar] [CrossRef]
  3. Ayenachew, Y.A.; Abebe, B.G. The dynamics of urbanization, land use land cover changes, and land expropriation in Addis Ababa, Ethiopia. Front. Environ. Sci. 2024, 12, 1439954. [Google Scholar] [CrossRef]
  4. Taye, C.; Teklemariam, D.; Addis, E. Effect of Drivers of Urban Expansion on Food Security in Moderating Role of Governance Response. Int. J. Manag. Fuzzy Syst. 2024, 10, 17–34. [Google Scholar] [CrossRef]
  5. Gnamura, K.; Antwi, M.A.; Abenet, B. The impact of urban expansion on peri-urban farmers in Addis Ababa. J. Agribus. Rural Dev. 2024, 74, 451–465. [Google Scholar] [CrossRef]
  6. Tadesse, B.; Baye, F. The impact of land expropriation on changing livelihoods: The case of displaced peri-urban farmers in Kon and Gashena towns, Ethiopia. Heliyon 2024, 10, e31942. [Google Scholar] [CrossRef]
  7. Muchelo, R.; Bishop, T.F.A.; Ugbaje, S.U.; Akpa, S. Patterns of Urban Sprawl and Agricultural Land Loss in Sub-Saharan Africa: The Cases of the Ugandan Cities of Kampala and Mbarara. Land 2024, 13, 1056. [Google Scholar] [CrossRef]
  8. Ahmed, F.; Shakeel, A.; Ahmad, S.; Kaur, N. Exploring the Linkages Between Land Degradation and Food Insecurity. Asia-Pac. J. Rural. Dev. 2025. [Google Scholar] [CrossRef]
  9. Nyamura, K. Exploring the Consequences of Land Expropriation on the Food Security of Peri-urban Indigenous Communities in Addis Ababa. Int. J. Multidiscip. Res. 2024. [Google Scholar] [CrossRef]
  10. Abate, G. Conservation and Indigenous peoples’ struggle for livelihoods: Suba Park (Ethiopia). Environ. Conserv. 2023, 50, 251–258. [Google Scholar] [CrossRef]
  11. Aberra, D. Addis Ababa master development plan: A program for development or for ethnic cleansing? Вестник Рoссийскoгo университета дружбы нарoдoв. Серия: Сoциoлoгия 2019, 19, 31–39. [Google Scholar] [CrossRef]
  12. Debelo, A.R.; Soboka, T.E. Urban Development and the Making of Frontiers in/from Addis Ababa/Finfinne, Ethiopia. J. Asian Afr. Stud. 2022, 58, 708–724. [Google Scholar] [CrossRef]
  13. Wayessa, B.S. They deceived us: Narratives of Addis Ababa development-induced displaced peasants. Int. J. Sociol. Anthropol. 2020, 12, 67–75. [Google Scholar] [CrossRef]
  14. Asnakew, M.B.; Amogne, M.K.; Abebe, K.T.; Gebru, M.A. Land rights, bases of informal settlements and bogus contract documents as a means of urban fringe legal land transactions in Ethiopia. Cities 2024, 149, 104954. [Google Scholar] [CrossRef]
  15. Demisse, M. Urban land use, land cover change and urban microclimate dynamics in Addis Ababa, Ethiopia. Discov. Environ. 2024, 2, 71. [Google Scholar] [CrossRef]
  16. Ogunbode, T.O.; Oyebamiji, V.O.; Sanni, D.O.; Akinwale, E.O.; Akinluyi, F.O. Environmental impacts of urban growth and land use changes in tropical cities. Front. Sustain. Cities 2025, 6, 1481932. [Google Scholar] [CrossRef]
  17. Kumar, V. Urban Sprawling and Agriculture: A Review of Issues. Indian J. Econ. Dev. 2024, 20, 795–801. [Google Scholar] [CrossRef]
  18. Wolamo, Z.M.; Kitila, A.W.; Beza, S.A. Urban expansion and its impacts on the livelihood of peripheral farming households: The case of Shinshicho town, Ethiopia. Int. Plan. Stud. 2024, 29, 379–398. [Google Scholar] [CrossRef]
  19. Kurnianto, B.T. Urban Agriculture: A Solution to Land Constraints Amidst Urbanization. West Sci. Nat. Technol. 2024, 2, 185–191. [Google Scholar] [CrossRef]
  20. Gemeda, B.S.; Cirella, G.T.; Abebe, B.G.; Gemeda, F.T. Unveiling and speculators in Addis Ababa: Insights, recommendations, and economic implications for sustainable development. Eco Cities 2024, 4, 2723. [Google Scholar] [CrossRef]
  21. Ayenachew, Y.A.; Abebe, B.G. Navigating urbanization implications: Effects of land expropriation on Farmers’ Livestock in Addis Ababa, Ethiopia. Front. Sustain. Cities 2024, 6, 1385309. [Google Scholar] [CrossRef]
  22. Teklemariam, A.T.; Cochrane, L. The Rush to the Peripheries: Land Rights and Tenure Security in Peri-Urban Ethiopia. Land 2021, 10, 193. [Google Scholar] [CrossRef]
  23. Adam, A.G.; Agegnehu, A.W.; Dessie, B.T.; Minale, A.S. Responsible Governance of Land Tenure in the context of Investment from Theory to Practice: Lessons from Ethiopia. Res. Glob. 2023, 6, 100131. [Google Scholar] [CrossRef]
  24. Dabala, A.M. Large-scale land acquisition and human rights at the crossroads: Quest for a rights-based approach to land administration in Ethiopia. J. Sustain. Dev. Law Policy 2020, 10, 184–206. [Google Scholar] [CrossRef]
  25. Sadiq, I.Z.; Abubakar, U.; Muhammad, A.; Ahmad, K.H. Sample size calculation in biomedical, clinical, and biological sciences research. J. Umm Al-Qura Univ. Appl. Sci. 2025, 11, 133–141. [Google Scholar] [CrossRef]
  26. Sangappa, D.; Rafi, K.; Candhini, E.; Charishma, G. Livelihood Security Index Assessment among Millet Farmers in Northeastern Hill (NEH) States of India. Int. J. Bio-Resour. Stress Manag. 2024, 15, 1–7. [Google Scholar] [CrossRef]
  27. Deshmukh, M.S.; Nanaware, D.R.; Ghagare, T.N. Measuring Regional Dimensions of Sustainable Livelihood Security Index in Maharashtra. Preprint 2023. [CrossRef]
  28. Nayak, S.; Jatav, S.S. Are livelihoods of slum dwellers sustainable and secure in developing economies? Evidence from Lucknow, Uttar Pradesh in India. Heliyon 2023, 9, e19177. [Google Scholar] [CrossRef]
  29. Beeraladinni, D.; Patil, B.L. Agricultural sustainability in Karnataka: Application of Sustainable Livelihood Security Index. Indian J. Agric. Sci. 2023, 93, 308–313. [Google Scholar] [CrossRef]
  30. Abdushamad, A.; Salam, M.; Tenriawaru, A.N.; Jamil, M.H.; Rukmana, D.; Hamid, N.; Kamarulzaman, N.H.; Rahmadanih, R.; Heliawaty, H.; Busthanul, N.; et al. The Application of the Binary Logistic Regression Model in Examining the Effects of Input Factor Allocation on Tangerine Production: Empirical Evidence from Selayar Islands Regency, Indonesia. Preprints 2024, 2024091689. [Google Scholar]
  31. Sihombing, E.D.; Novianti, P.; Wahyuliani, I. Binary Logistic Regression Modeling on Household Poverty Status in Bengkulu Province. Pattimura Proceeding Conf. Sci. Technol. 2024, 5, 89–100. [Google Scholar] [CrossRef]
  32. Dethan, N.K.F.; Luan, F.; Obe, L. Binary Logistic Regression Analysis in Determining Risk Factors of Acute Respiratory Infection (IRA) on Under-Five Children. Sainmatika 2024, 21, 8–15. [Google Scholar] [CrossRef]
  33. Petrov, D.; Romaguera-de-la-Cruz, M. Measuring economic insecurity by combining income and wealth: An extended well-being approach. Rev. Econ. Househ. 2025, 23, 113–139. [Google Scholar] [CrossRef]
  34. Wiraszka, P.; Karpińska, U. Economic security as an element of the region’s development process on the example of communes of the świętokrzyskie voivodship. Balt. J. Econ. Stud. 2020, 6, 67–75. [Google Scholar] [CrossRef]
  35. Nikpeyma, N.; Maroufizadeh, S.; Esmaeili, M. The importance of reporting the effect size in quantitative studies. Nurs. Pract. Today 2021, 8, 4–6. [Google Scholar] [CrossRef]
  36. Valladares-Neto, J. Effect size: A statistical basis for clinical practice. Rev. Odonto Ciência 2018, 33, 84–90. [Google Scholar] [CrossRef]
  37. Humphries, J.E.; Mader, N.S.; Tannenbaum, D.I.; van Dijk, W. Does Eviction Cause Poverty? Quasi-Experimental Evidence from Cook County, IL; National Bureau of Economic Research: Cambridge, MA, USA, 2019. [Google Scholar]
  38. Jackson, T.F. Evicted: Poverty and Profit in the American City. J. Am. Hist. 2017, 104, 820–822. [Google Scholar] [CrossRef]
  39. Nadeem, M.A.; Ikram, K.; Hussain, M.; Lak, T. Forced Displacement, Socio-Economic Impacts and Misplaced Identity of Villagers: A Qualitative Exploration of Three Villages in Lahore. Deleted J. 2024, 13, 259–267. [Google Scholar] [CrossRef]
  40. Aygün, S.; Akdemir, M.; Duran, C. Bibliometric Analysis of Refugee Effects to Economic Development. Anadolu Üniversitesi Sos. Bilim. Derg. 2024, 24, 1547–1562. [Google Scholar] [CrossRef]
  41. Calderón, E.; Patiño, J.E.; Duque, J.C.; Keith, M. The urban footprint of rural forced displacement. Comput. Urban Sci. 2024, 4, 34. [Google Scholar] [CrossRef]
  42. Saqib, S.E.; Yaseen, M.; Ali, S.; Visetnoi, S. Agricultural Land Conversion and Challenges for Tenant Farmers: Empirical Evidence from Pakistan. Land Degrad. Dev. 2024, 36, 802–815. [Google Scholar] [CrossRef]
  43. Steeven, K.; Milimu, W.S. Examining How Land Eviction Affects Social Cohesion in an Integrated Community: A Case of Maela Integrated Community, Naivasha, Nakuru County. Int. J. Res. Sci. Innov. 2025, XI, 1008–1018. [Google Scholar] [CrossRef]
  44. Gunn, V.; Matilla-Santander, N.; Kreshpaj, B.; Vignola, E.; Wegman, D.H.; Hogstedt, C.; Bodin, T.; Ahonen, E.Q.; Baron, S.; Muntaner, C.; et al. A Systematic Review of Evaluated Labor Market Initiatives Addressing Precarious Employment: Findings and Public Health Implications. Int. J. Soc. Determ. Health Health Serv. 2025. [Google Scholar] [CrossRef]
  45. Mathur, N. Socioeconomic Vulnerabilities of Migrant Labour Households in Delhi. Indian Public Policy Rev. 2024, 5, 1–18. [Google Scholar] [CrossRef]
  46. Shim, I.; von Peter, G. Distress selling and asset market feedback. Financ. Mark. Inst. Instrum. 2007, 16, 243–291. [Google Scholar] [CrossRef]
  47. Ruben, R.; Masset, E. Land markets, risk, and distress sales in Nicaragua: The impact of income shocks on rural differentiation. J. Agrar. Change 2003, 3, 481–499. [Google Scholar] [CrossRef]
  48. Elmakki, O. From Relief to Resilience: The Dual Role of Humanitarian Assistance in Alleviating Poverty and Fostering Sustainable Development. Int. J. Res. Innov. Soc. Sci. 2025, VIII, 1952–1978. [Google Scholar] [CrossRef]
  49. Niyitunga, E.B.; Musya, J.K. Dependency syndrome within Africa’s international relations: A hindrance to sustainable development in Africa. J. Infrastruct. Policy Dev. 2024, 8, 7052. [Google Scholar] [CrossRef]
  50. Alamneh, A.S.; Workie, G.F.; Moges, N.B. The political-economy of land acquisition and privatization of Birr and Ayehu Farms in Amhara Region, North-West Ethiopia. Humanit. Soc. Sci. Commun. 2021, 8, 291. [Google Scholar] [CrossRef]
  51. Hutapea, M. Implementation of Compensation of Rights of Ownership on Land in the Development of Toll Road in Dumai City, Riau Province. West Sci. Law Hum. Rights 2024, 2, 1–10. [Google Scholar] [CrossRef]
  52. Kabanga, L.; Mooya, M.M. Compensation assessment practices in expropriation of customary land: Evidence from Malawi. Land Use Policy 2023, 134, 106931. [Google Scholar] [CrossRef]
  53. Gusti, I.; Kade, A.; Adhisukmawati, H.; Ketut, G.A.; Handayani, R.; Karjoko, L. Fairness Aspects of Compensation Arrangements in the acquisition of land for development for the public interest. Int. J. Educ. Res. Soc. Sci. 2023, 4, 186–194. [Google Scholar] [CrossRef]
  54. Shaw, A.; Saharan, T. Urban development-induced displacement and quality of life in Kolkata. Environ. Urban. 2019, 31, 597–614. [Google Scholar] [CrossRef]
Figure 1. Map of the Study Area, Addis Ababa, with Sub-Cities.
Land 14 01051 g001
Table 1. Variables of the Household Economic Capital Security Index (HECSI).
Sl. No.Participation of the Household in Economic ActivitiesResponse
1Income obtained from crops (Teff, wheat, barley, chickpeas, vegetables, etc.) in the past 12 months(Yes = 1, No = 0)
2Income obtained from livestock and livestock products (milk, meat, live animal, eggs, sheep, goat, heifer, bull, ox, cow, horse, donkey, etc.) in the last 12 months.(Yes = 1, No = 0)
3Income obtained from other jobs/employment (Daily Wage/Causal labour work) in the past 12 months(Yes = 1, No = 0)
4Income obtained from business in the past 12 months (Yes = 1, No = 0)
5Income obtained from semi-skilled work (pottery, carpentry, masonry, electric work, gypsum work, metal work, mechanics, etc.) in the past 12 months.(Yes = 1, No = 0)
6Remittances received in the last 12 months(Yes = 1, No = 0)
7Received pension income in the last 12 months(Yes = 1, No = 0)
8Income from renting assets (land, house, shops, etc.) in the past 12 months(Yes = 1, No = 0)
9Income from the sale of assets (land, house, shops, etc.) in the past 12 months(Yes = 1, No = 0)
10Received aid/support from the government and/or NGOs in the past 12 months(Yes = 1, No = 0)
11Received a loan from MFIs, banks, or informal money lenders in the past 12 months.(Yes = 1, No = 0)
12Cash on hand currentlyETB
13Savings in a bank currentlyETB
14Family members engaged in income-generating schemes other than agriculture.(Yes = 1, No = 0)
Total cash income from all sources of economic activity in the last 12 monthsETB
Total Economic Capital Security Score
Economic Capital Security Index
Category of Economic Capital Security Index of the Median
(1, if >=median and 0, if <median).
Table 2. Explanatory variables and their expected effects.
Independent
Variables
Description of
Variables
Expected Effect
X1Gender of the head of household (TypeHH) 1 = male, otherwise = 0.+ve
X2categorical age of the respondent (AgeRes) (age between 18 and 65 = 1, otherwise = 0+ve
X3Family members engaged in continuous productive activities (income-generating activities) (FamSize) continuous +ve
X4Literacy rate of wives (LevEdu) (Literate = 1, illiterate = 0)+ve
X5Food security (secured = 1, not-secured = 0)+ve
X6Social capital security (secured = 1, nonsecured = 0)+ve
X7Land tenure security (secured/grabbed = 1, not secured/not grabbed = 0)+ve
X8Human capital/resources security (secured = 1, not secured = 0)+ve
X9Physical capital security(secured/above moderate = 1, nonsecured/below moderate = 0)+ve
X10Infrastructural services security (have better access = 1, have no or little access = 0)+ve
X11ICT security (having better access = 1, having no or little access = 0)+ve
X12Forced eviction (evicted = 1, non-eviction = 0)−ve
Dependent variable: ln(Px/(1 − Px))Px is the probability that the household has secured economic capital = 1, otherwise = 0
Table 3. Land expropriated at the household level.
Land TypeNo. of HHMeanStd. Deviation
Total farmland expropriated in (Ha)2231.342.19
Residential area expropriated in (m2)223183.56470.71
Source: Own survey, March 2024.
Table 4. Comparison of the economic capital security variables by eviction status.
Economic Capital Security VariablesHH EvictedHH Non-EvictedWeightsHH Evicted (Weighted Mean Score)HH Non-Victed (Weighted Mean Score)
Income from sales of (Teff, wheat, barley, chickpeas, vegetables, etc.) in the past 12 months0.147982150.739915
Income from sales of livestock (milk, meat, live animal, eggs, sheep, goat, heifer, bull, ox, cow, horse, donkey, etc.) in the past 12 months0.1659190.84304940.6636763.372196
Income from other jobs/employment (Daily Wage/Casual Labour Work, in the past 12 months).0.2511210.17488830.7533630.524664
Income from business in the past 12 months livestock trade, grain trade, etc.0.0717490.16143530.2152470.484305
Income from semi-skilled work (pottery, carpentry, masonry, electric work, gypsum work, metalwork, mechanics, etc.) in the past 12 months0.0762330.3542630.2286991.06278
Income from remittances in the past 12 months0.0896860.05829620.1793720.116592
Income from pension income in the past 12 months0.0179370.01793710.0179370.017937
Income from renting assets (land, house, shops, etc.) in the past 12 months0.5964130.01793731.7892390.053811
Income from distressed sale of assets (land, house, shops, etc.) in the past 12 months0.0538120.01793730.1614360.053811
Aid/support from government and/or NGOs in the last 12 months0.4887890.00896920.9775780.017938
Loans from MFIs, banks, or informal money lenders in the last 12 months0.0269060.04932720.0538120.098654
Currently have cash on hand.0.5605380.56950710.5605380.569507
Have savings in a bank at present?0.6502240.64125610.6502240.641256
Family members participate in income-generating schemes other than agriculture.0.4260090.46636831.2780271.399104
Household Economic Capital Security Index (HECSI)0.2588084290.312940429 0.229696060.37257097
Total Economic Capital in ETB109,234.80218,748.70 109,234.80218,748.70
NB: Weights are given between 1 and 5, indicating 1 = lowest and 5 = highest. Source: Own data from the February–April 2024 household survey.
Table 5. Determinants of household economic capital security of peri-urban farmers.
BS.E.WalddfSig.Exp(B)95% CI for EXP(B)
LowerUpper
Eviction category (1)−1.2970.37312.09010.0010.2730.1320.568
Gender of Household Head−0.2560.3340.58710.4440.7740.4021.490
Age Category0.3150.2491.60310.2061.3700.8422.230
Family size category−0.0130.2240.00310.9550.9870.6361.532
Family member engaged −0.2790.2451.29510.2550.7570.4681.223
Marital Status Category0.6430.3423.53410.0601.9020.9733.718
Wife Education Level0.3650.3371.17110.2791.4410.7442.791
Household Head Education Level0.1530.2860.28710.5921.1660.6652.043
Social Security−0.1270.2560.24510.6200.8810.5331.456
Land Security0.1170.2450.22910.6331.1240.6961.816
Physical Capital Security0.8600.26910.19410.0012.3641.3944.009
Human Security−0.1540.2140.52110.4710.8570.5641.303
Infrastructural Service Access Security0.2710.2621.06410.3021.3110.7842.191
ICT Security0.5830.2366.10610.0131.7911.1282.844
Food Security0.4290.3002.03710.1541.5350.8522.766
Constant−0.7640.4742.59910.1070.466
Source: Own data analysis, May 2024.
Disclaimer/Publisher’s Note: The statements, opinions and data contained in all publications are solely those of the individual author(s) and contributor(s) and not of MDPI and/or the editor(s). MDPI and/or the editor(s) disclaim responsibility for any injury to people or property resulting from any ideas, methods, instructions or products referred to in the content.

