Article

Analysis of the Distribution Pattern and Driving Factors of Bald Patches in Black Soil Beach Degraded Grasslands in the Three-River-Source Region

by
Weitao Jing
1,
Zhou Wang
2,
Guowei Pang
1,2,3,*,
Yongqing Long
1,2,3,
Lei Wang
1,2,3,
Qinke Yang
1,2,3 and
Jinxi Song
1,2,3
1
College of Urban and Environmental Sciences, Northwest University, Xi’an 710127, China
2
Key Laboratory of Ecological Hydrology and Disaster Prevention in Arid Regions, State Forestry and Grassland Administration, Xi’an 710127, China
3
Shaanxi Key Laboratory of Earth Surface System and Environmental Carrying, Xi’an 710127, China
*
Author to whom correspondence should be addressed.
Land 2025, 14(5), 1050; https://doi.org/10.3390/land14051050
Submission received: 25 February 2025 / Revised: 5 May 2025 / Accepted: 7 May 2025 / Published: 12 May 2025

Abstract

:
The degradation of ‘black soil beach’ (BSB) ecosystems in the Three-River-Source region, characterized by widespread bald patches and severe soil erosion, poses a critical threat to regional ecological security and sustainable pastoralism. This study aims to elucidate the spatial distribution patterns and driving factors of bald patches in BSB degraded grasslands within the Guoluo Tibetan Autonomous Prefecture, providing a scientific basis for targeted restoration strategies. Utilizing multi-source remote sensing data (Landsat 8–9 OLI, UAV imagery, and Google Earth), we employed the Multiple Endmember Spectral Mixture Analysis (MESMA) method to identify bald patches, combined with the landscape pattern index and spatial autocorrelation to quantify their spatial heterogeneity. Geographical detector analysis was applied to assess the influence of natural and anthropogenic factors. The results indicate the following: (1) The patches are bounded by the Yellow River, showing a distribution pattern of ‘high in the west and low in the east’. The total area of patches reached 32,222.11 km2, accounting for 43.43% of the total area of Guoluo Prefecture, among which Maduo County and Dari County had the highest degradation rate. (2) With the aggravation of degradation, the patch density of each county increased first and then decreased, while the aggregation index and landscape shape index continued to decrease. (3) Spatial autocorrelation of bare patches strengthens with degradation severity (Moran’s I index 0.6543→0.7999). LISA identified two clusters: the high–high agglomeration area in the north of Maduo–Dari and the low–low agglomeration area in the southeast of Jiuzhi–Banma, revealing the spatial heterogeneity of the degradation process. (4) The spatial distribution pattern of bare patches was mainly affected by the annual average precipitation and actual stocking capacity, and the synergistic effect was significantly higher than that of a single factor. The combination of a 4491–4708 m high altitude area, 0–5° gentle slope zone, and soil texture (clay 27–31%, silt 43–100%) has the highest degradation risk. This multi-factor coupling effect explains the limitations of traditional single factor analysis and provides a new perspective for accurate repair.

1. Introduction

Alpine meadow ecosystems are the key to maintaining global ecological stability, especially playing an irreplaceable role in regulating the water cycle, carbon sequestration, and biodiversity conservation [1,2]. As the birthplace of the Yangtze River, the Yellow River, and the Lancang River, the Three-River Headwaters Region of the Qinghai–Tibet Plateau is a typical alpine ecologically sensitive area. Its unique vegetation–soil feedback mechanism forms a native meadow ecosystem with Kobresia plants as the constructive species [3,4,5]. However, the double stress of global warming, overgrazing, land use transformation, and other human activities leads to the loss of humus in the surface layer of the meadow and the exposure of a dark cinnamon soil in the deep layer, forming a special degradation type of ‘black soil beach’ [6,7]. Such degradation not only destroys the soil aggregate structure and weakens the water conservation function but also threatens the overall stability of the ecosystem through patch expansion [8], which has become a significant symbol of the degradation of the regional ecological security barrier function.
The existing research has methodological limitations and drives cognitive differences regarding the degradation mechanism of black soil beach. Traditional degradation assessment mainly relies on a sample survey and UAV remote sensing. Although high-precision patch data can be obtained, it is difficult to quantify large-scale landscape patterns [9,10]. Although satellite remote sensing has the advantage of wide-area monitoring, it leads to small-scale bare patch identification error due to mixed pixels [11]. Although sub-pixel decomposition techniques (such as MESMA) have improved the accuracy of patch abundance inversion by endmember spectral unmixing [12,13], they mostly stay in a single mapping application and are not deeply coupled with landscape heterogeneity indicators (patch density, aggregation index) and spatial autocorrelation analysis [14,15]. At the same time, the geographical detection model has significant potential in quantifying the interaction between natural and human factors [16]. However, the existing studies mostly analyze the influence of single factors such as altitude and grazing in isolation, and lack the systematic deconstruction of a multi-scale driving mechanism.
At present, there are three aspects of knowledge faults in the study of black soil beach in the Three-River-Source region. First, the spatial differentiation law of degraded patches has not been established. The existing mapping is mostly limited to local sample areas, and lacks a global high-precision distribution data set covering core degraded areas such as Guoluo Prefecture [8,9,17]. Second, the lack of a landscape pattern–spatial autocorrelation joint analysis method makes it difficult to quantitatively characterize patch expansion patterns and agglomeration characteristics [18]. Third, the synergistic driving mechanism of natural factors (precipitation, slope) and human factors (actual stocking capacity) is unknown [17,19,20,21], which restricts the construction of a degradation risk early warning model and the formulation of targeted remediation strategies.
Based on the above gaps, this study focuses on the following questions: (1) How can we break through the limitation of mixed pixels and construct an inversion model of the sub-pixel distribution of bare patches in an alpine meadow? (2) What are the spatial differentiation patterns and self-organization characteristics of degraded patches at the landscape scale? (3) How do natural–anthropogenic factors drive patch spatial differentiation through independence or interaction? In particular, it is concerned about the core area of the Three-River-Source region in Guoluo Tibetan Autonomous Prefecture, and its accelerated expansion of black soil beach in recent years needs to be analyzed by mechanism [9,10].
Therefore, based on the fusion of Landsat 8–9 images, this study uses the MESMA model to realize the sub-pixel abundance mapping of bare patches; then, the distribution pattern of patches was revealed by landscape index and spatial autocorrelation analysis. Finally, the geographical detector is used to quantify the explanatory power of natural factors and human activity factors, and to clarify the spatial differentiation law of driving factors on patches. The research results will provide a new theoretical understanding of the mechanism of meadow degradation in the Three-River-Source region and provide spatial decision support for the precise restoration of alpine ecosystems.

2. Materials and Methods
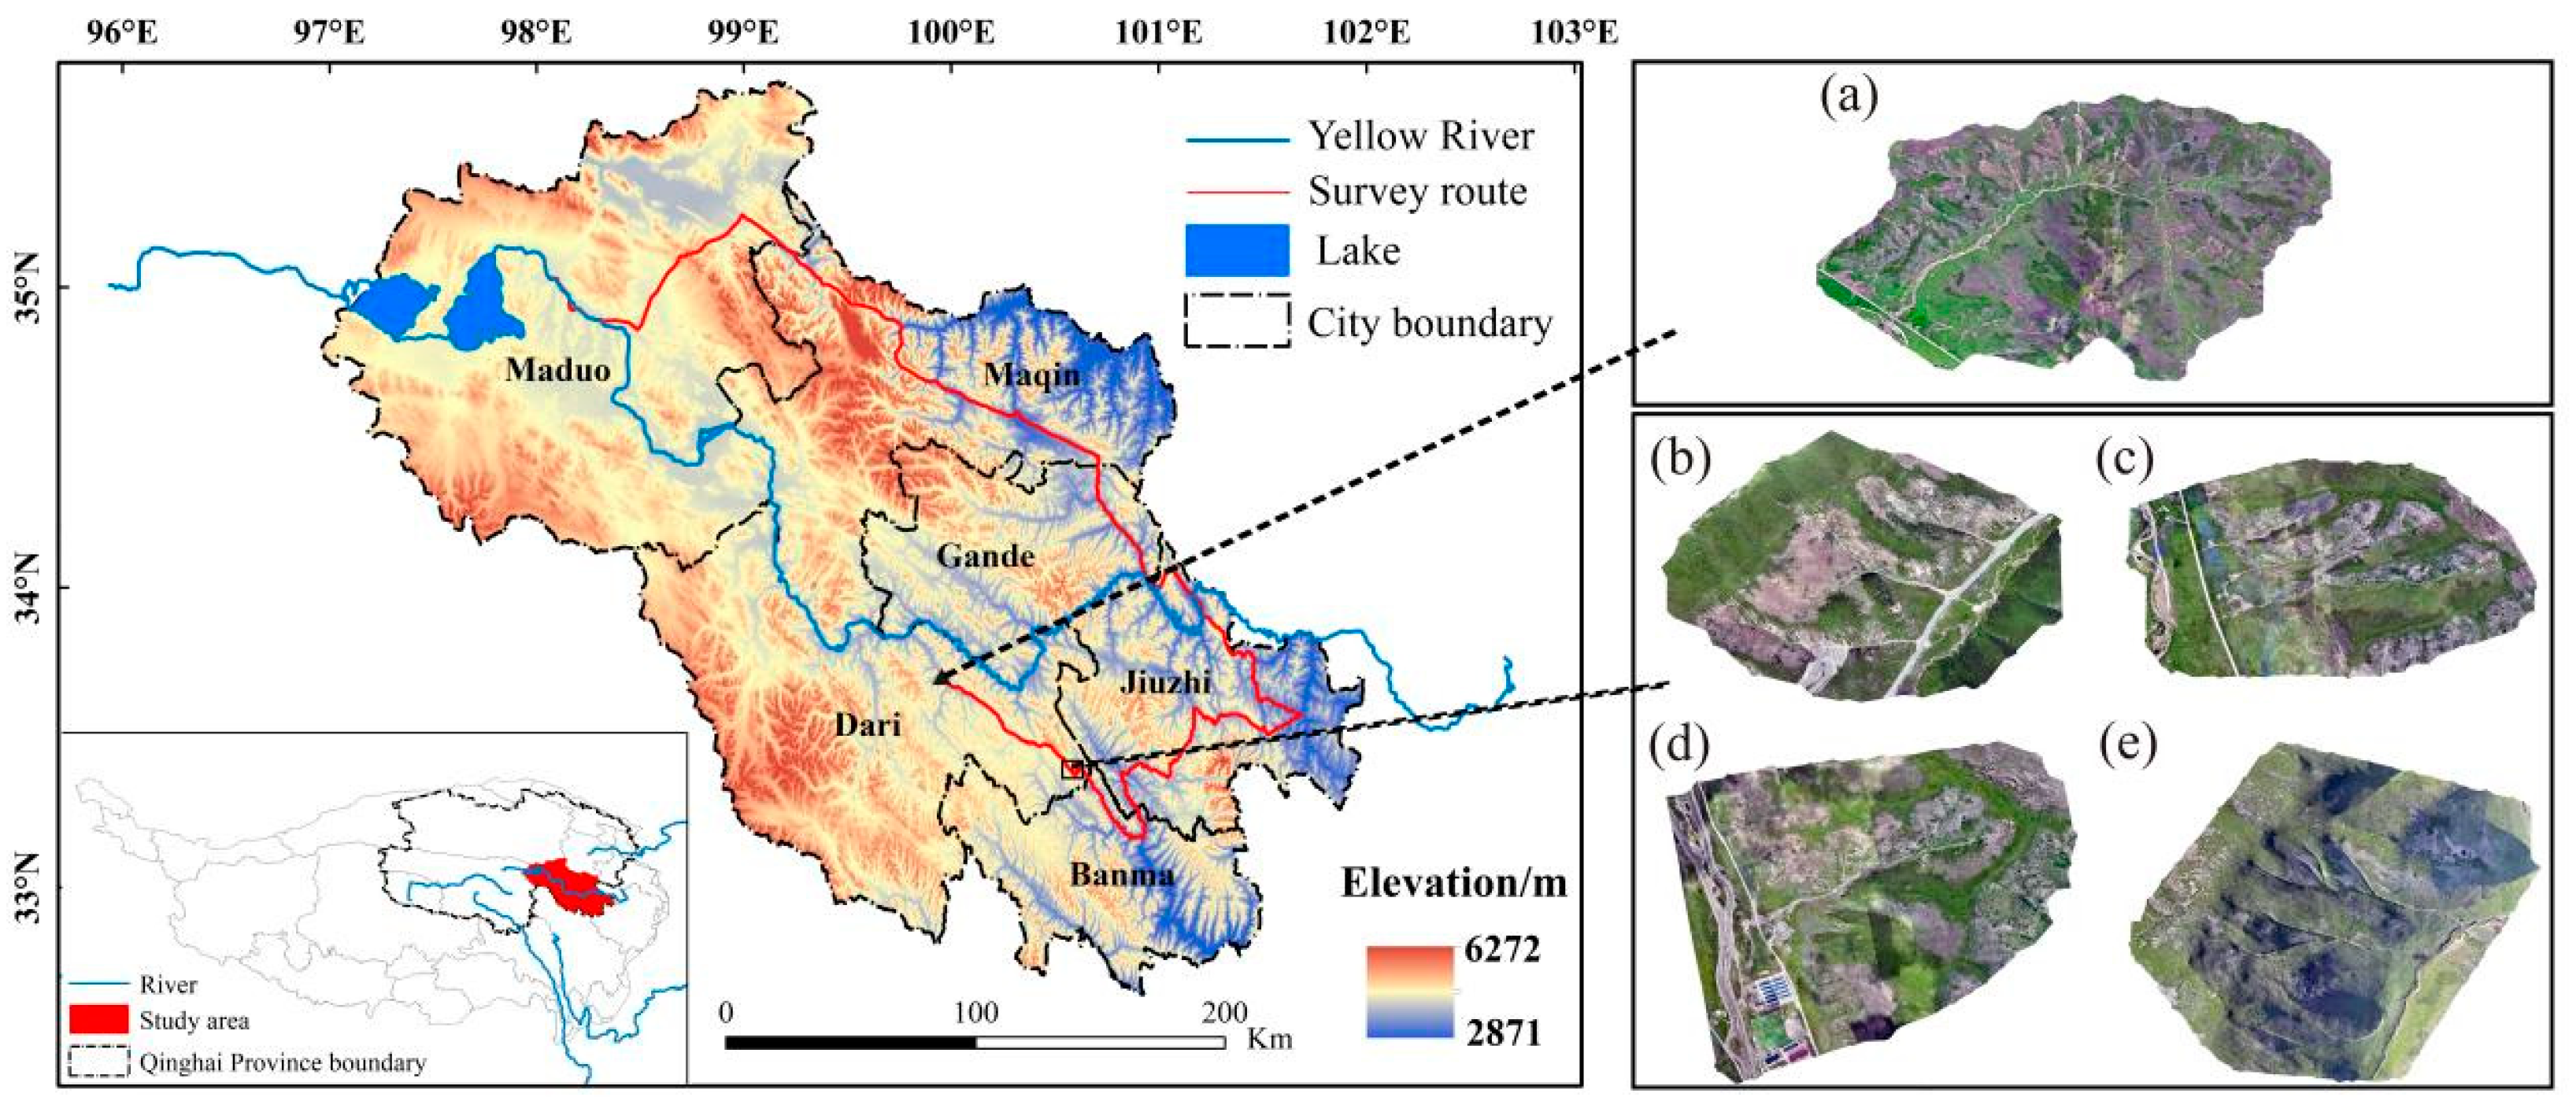
2.1. Study Area

The Guoluo Tibetan Autonomous Prefecture (97°54′–101°50′ E, 32°31′–35°40′ N) is located in the southeastern part of Qinghai Province, with an area of 76,442 km2 [18,22] (Figure 1). The mean elevation exceeds 4200 m, and the climate is characterized by cold and severe conditions, with atmospheric oxygen levels at only 60% of those found at sea level [23]. The annual average precipitation is 540.9 mm, the annual average wind speed is 2.5 m/s, and the annual average temperature is −4 °C [23,24].
The Guoluo Tibetan Autonomous Prefecture, commonly known as Guoluo Prefecture, encompasses six counties: Banma, Dari, Gande, Jiuzhi, Maduo, and Maqin. This administrative region comprises a total of 44 townships (or towns) and has an overall population exceeding 200,000 individuals [25,26]. Guoluo Prefecture is located in the core of the Three-River-Source Nature Reserve. The topography exhibits a gradient descending from the northwest to the southeast, characterized by gentle, hilly landscapes in the northwestern region, while the southeastern slope is marked by steep and mountainous features [27]. This region has a continental plateau climate [24]. The state’s natural grassland encompasses an area exceeding 16.7 million acres, with over 15.6 million acres classified as available grassland. This region is characterized by a wealth of grassland resources [24]. The plant community is mainly composed of perennial herbs, annual herbs, and shrubs, and the dominant species are Kobresia humilis, Kobresia pygmaea, Stipa purpurea, and Dasiphora fruticosa [28]. The predominant soil types consist of Histosols, Fluvisols, Cryosols, Solonetz, and Solonchaks [7,29,30].

2.2. Data Source and Processing

2.2.1. Remote Imageries

(1)
Landsat 8–9 OLI Image
Landsat 8–9 satellites use two sensors: OLI (9 spectral bands) and TIRS. OLI provides 30 m resolution for multispectral bands and 15 m for panchromatic.
This study used seven spectral bands from Landsat 8–9 images (July–September 2022) over a vegetated area. The preprocessing of the original images was conducted using ENVI 5.3 software, which involved geometric correction, radiometric calibration, atmospheric correction, cropping, and mosaicking to produce the image data pertinent to the study area.
(2)
Aerial image data
Aerial imagery was primarily employed to assess the low-altitude photogrammetry of a representative black soil beach within the study area, utilizing Unmanned Aerial Vehicles (UAVs). The internal processing of the data was facilitated by Dajiang Wisdom Map Software 3.7.0. The UAV survey was executed in August 2023, achieving a spatial resolution of 0.1 m.

2.2.2. Basic Data

The formation of black soil beach is affected by several factors [31]. Through comprehensive field investigation and analysis, we identified terrain factors, meteorological factors, soil texture factors, and actual stocking capacity as independent variables. These variables are presented in Table 1. Furthermore, the auxiliary data utilized in the MESMA model to delineate the region of interest encompasses vegetation type data and land use type data.
The elevation, slope, and aspect were extracted by the digital elevation model (DEM). Meteorological data, vegetation type data, and land use-type data were from the Data Center for Resources and Environmental Sciences; soil texture and actual stocking capacity data were from the National Tibetan Plateau Data Center; all data were projected to the Asia _ North _ Albers _ Equal _ Area _ Conic projection coordinate system; and the data of the study area were generated by resampling and spatial cropping to ensure the spatial consistency of the data and the accuracy of the analysis results. The main purpose of this study is to explore the driving force of potential driving factors on the distribution of black soil beach, as shown in Figure 2.

2.3. Methods

2.3.1. Multiple Endmember Spectral Mixture Analysis

The multiple endmember spectral mixture analysis (MESMA) is an improved mixed pixel decomposition method based on the linear spectral mixture analysis (LSMA) [32]. The objective is to identify the classification of endmembers within the study area based on specific predetermined criteria. This involves selecting various spectral data corresponding to different endmember classifications and integrating these diverse spectra to create multiple spectral decomposition models [33]. Its advantages are mainly to improve the classification accuracy of fragmented landscapes by dynamically selecting multi-endmembers and analyzing the continuous proportion of multi-elements such as vegetation and soil in the pixel [34]. The simple vegetation index or soil index method is suitable for large-scale rapid monitoring, but it only reflects the abundance of a single feature and is susceptible to mixed pixel interference [35]. The MESMA model includes two steps: construction of the spectral library and selection of the optimal endmember, and determination of the spectral unmixing model [34,35].
(1)
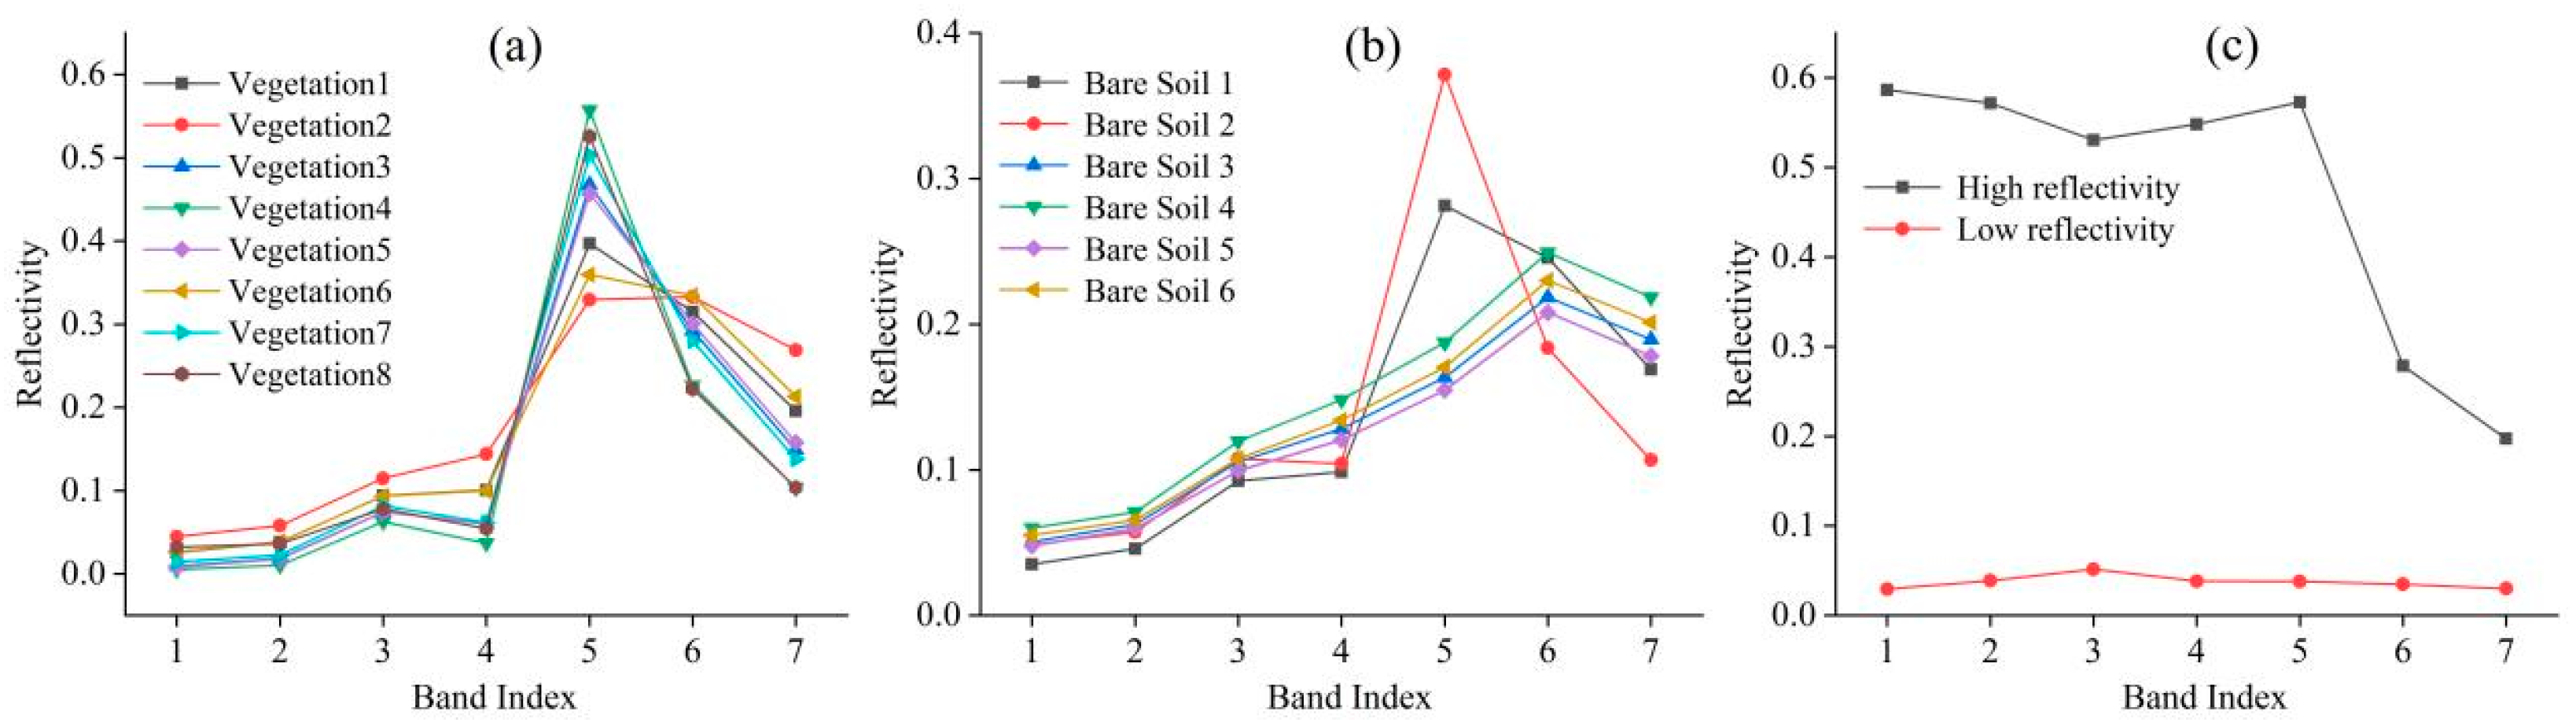
Construction of the spectral library and selection of the optimal endmembers
This study combined UAV imagery, Google Earth data, and field investigations to classify endmembers into three categories: vegetation, bare soil, and other types (high/low reflectivity) [36]. Using Landsat 8–9 images, based on vegetation-type and land use-type data, 8866 vegetation, 3045 bare soil, and 1065 other endmembers were identified. The ENVI Classic ‘Viper Tools’ plug-in was employed to build a spectral library, evaluating endmembers based on the counting endmember selection method (COB, the primary variable), average root mean square error (EAR), and minimum average spectral angle (MASA) [35]. The first critical variable identified was the COB, followed by the EAR as the second significant variable. Optimal endmembers were selected based on high COB values and low EAR/MASA values [37], resulting in eight vegetation, six bare soil, and two other endmembers (one high and one low reflectivity), with their spectral curves shown in Figure 3.
(2)
Determination of the spectral unmixing model
In the present study, the primary models evaluated included two-endmember, three-endmember, and four-endmember models. Following extensive experimentation, a four-endmember model was identified as the most suitable, exhibiting a comparatively high unmixing ratio and a relatively low residual [35]. Based on theoretical research, the range for abundance values is established between −0.05 and 1.05. Additionally, the maximum permissible shadow component is defined as 0.8, while the maximum allowable root mean square error (RMSE) is set at 0.025 [38].
(3)
Extraction of black soil beach
In the process of extracting black soil beach, it is essential to take into account three distinct types of abundance in a comprehensive manner. Additionally, it is necessary to eliminate the impervious surface areas associated with both vegetation and bare soil. The classification of vegetation abundance is as follows: the vegetation abundance less than 20% or the bare soil abundance greater than 50% is divided into the identification area of severe black soil beach; the vegetation ranging from 20% to less than 40% is classified as a moderate black soil beach identification area; and the vegetation between 40% and less than 60% is designated as a mild black soil beach identification area [39]. Combined with the definition of black soil beach formation [8], the spatial distribution of black soil beach in Guoluo Prefecture was obtained by overlay analysis.

2.3.2. Spatial Autocorrelation Analysis

Spatial autocorrelation includes both global and local forms, which are frequently employed to assess the significance of the correlation between the distribution characteristics of black soil beach and their neighboring units [40].
Global spatial autocorrelation is employed to indicate the presence of a discrete trend, along with the intensity and significance of that trend [41]. The Moran index exhibits a value range of [−1, 1]. A Moran’s I value approaching +1 indicates a positive spatial correlation in the distribution of black soil beach. Conversely, a value closer to −1 indicates a negative spatial correlation. If the Moran’s I value is near 0, it signifies that the distribution of black soil beach is random in space [14].
If the distribution pattern of black soil beach exhibited a notable global spatial autocorrelation, a subsequent analysis employing local spatial autocorrelation was conducted. Local spatial autocorrelation serves as an analytical tool to examine the varying extents of black soil beach presence across different townships within Guoluo Prefecture. This index elucidates the magnitude and significance of spatial disparities among townships and their adjacent counterparts [41]. Local Indicators of Spatial Association (LISA) is a widely employed technique for the analysis of local spatial autocorrelation [42].

2.3.3. Landscape Pattern Index

In this study, patch density, aggregation index, and landscape shape index were selected to analyze the heterogeneity of black soil beach landscape patterns at both the global and county scale levels [12]. The selected landscape pattern indices are listed in Table 2.
In Table 2, N is the number of patches, A is the total area of the landscape or patch, g i i is the number of similar adjacent patches of the corresponding landscape type, and E is the length of the patch boundary.

2.3.4. Geographical Detector Model

A geographical detector comprises statistical techniques designed to identify spatial heterogeneity and uncover its driving forces [43]. It includes four main components: factor, interaction, risk, and ecological detection [15]. Factor detection serves as a quantitative method for assessing the explanatory capacity of variable X in relation to variable Y. This evaluation is conducted through the application of q statistics, which are confined to a range of [0, 1]. An elevated q value indicates a more substantial explanatory influence of the driving factor. Conversely, interaction detection is employed to discern the interactions among various driving factors. This analysis determines whether the interplay between two driving factors enhances or diminishes the explanatory power of Y, or if their impact on Y operates independently. The calculation results are obtained by comparing the single factor q value with the interaction q value [q(X1∩X2)], such as the two-factor enhancement {q(X1∩X2) > Max[q(X1), q(X2)]} or the nonlinear enhancement {q(X1∩X2) > Max[q(X1) + q(X2)]} relationship. Risk detection primarily focuses on identifying subregions characterized by a concentration of black soil beach in relation to various influencing factors. Ecological detection is employed to assess whether there exists a statistically significant difference in the effects of two distinct factors on the spatial distribution of black soil beach [44,45].

3. Results

3.1. Extraction Results of Black Soil Beach

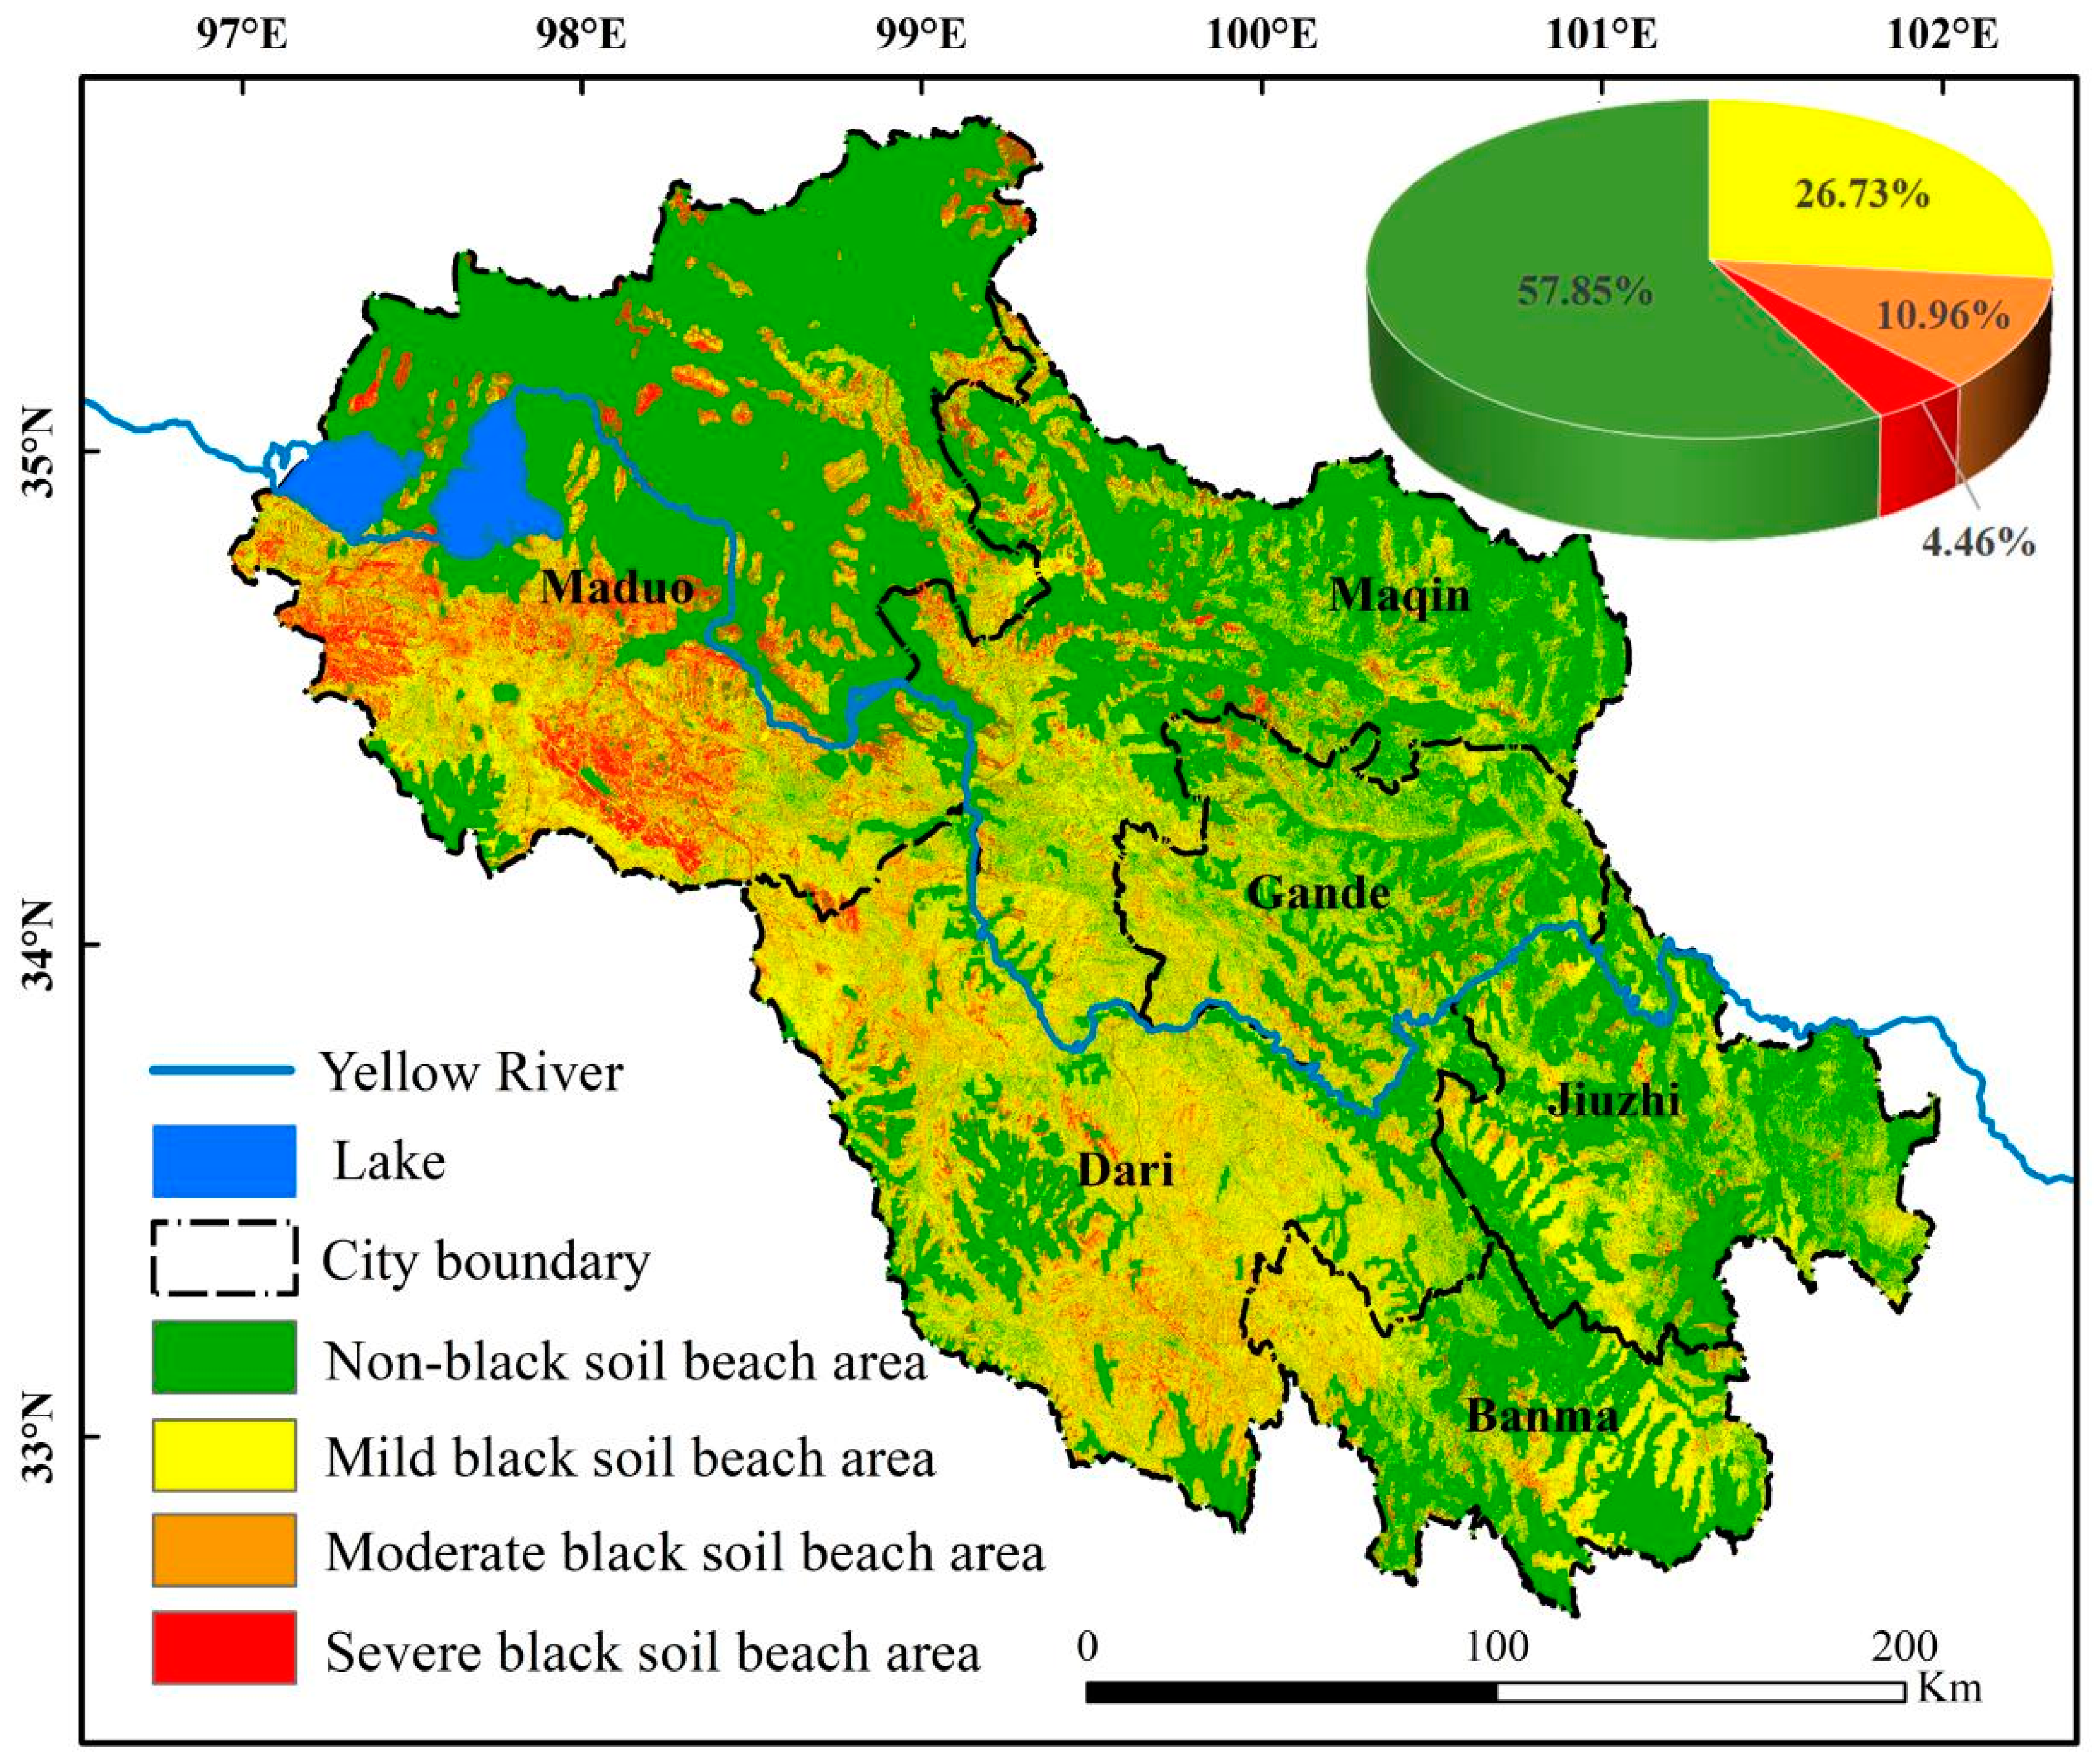
3.1.1. Spatial Distribution Characteristics of Black Soil Beach

Figure 4 illustrates that the distribution of black soil beach is extensive, with the Yellow River serving as a demarcation that results in a higher concentration in the western region compared to the eastern region. The proportion of mild black soil beach is notably the highest, comprising 26.73% of the total, while moderate and severe black soil beach account for 10.96% and 4.46%, respectively. An analysis of the varying degrees of black soil beach area within Guoluo Prefecture at the county level, as presented in Table 3, reveals significant disparities in distribution across the counties, with Dari County exhibiting the greatest extent and Banma County the least.

3.1.2. Accuracy Verification

The accuracy of the black soil beach extraction results was verified by the confusion matrix (Table 4). The results show that the overall classification accuracy is 83%, and the kappa coefficient is 0.75.

3.2. Analysis of the Landscape Pattern Characteristics of Black Soil Beach

The results of Table 5 show that as the degree of degradation of the black soil beach increases from mild to severe, the PD overall shows a trend of increasing first and then decreasing, and the PD peak of Dari County reaches 20.44 when it is moderately degraded. AI and LSI continued to decrease, with the mean value of county AI decreasing from 69.79 to 51.60, and LSI decreasing from 578.47 to 537.16. It is worth noting that Maduo County still maintains a high AI value during severe degradation, while Banma County has the lowest AI value; the LSI in Dari County decreased the most, from 763.14 to 407.80.

3.3. Spatial Autocorrelation Analysis of Black Soil Beach

Spatial autocorrelation was employed to analyze and assess the distribution of black soil degradation in Guoluo Prefecture, categorized into mild, moderate, and severe levels. The corresponding Moran’s indices for these categories were 0.6543, 0.7582, and 0.7999, respectively. These values indicate a significant spatial clustering of varying degrees of black soil degradation within the region, suggesting a positive spatial correlation among the different levels of degradation across the townships. Furthermore, it was observed that as the degree of degradation of the black soil increased, the Moran’s I index also exhibited an upward trend, signifying a gradual intensification of the spatial agglomeration effect.
Clustering and outlier analysis were employed to investigate the spatial clustering characteristics of black soil beach areas. The results of the Local Indicators of Spatial Association (LISA) clustering analysis (Figure 5) reveal distinct spatial clustering patterns, specifically high–high (H-H) and low–low (L-L) clusters within the black soil beach regions. The H-H cluster is predominantly located in the northern section of Guoluo Prefecture, encompassing Maduo County, northern Dari County, and western Maqin County. Conversely, the L-L cluster is primarily situated in the southeastern part of Guoluo Prefecture, including the eastern regions of Maqin County and Gande County, as well as most of Jiuzhi County and Banma County.

3.4. Analysis of Spatial Heterogeneity Driving Factors of Black Soil Beach

3.4.1. Factor Detection

The results of the factor detection analysis conducted using the geographical detector (Figure 6) indicated that the driving factors exert a significant influence on the distribution of black soil beach. The q values, ranked from highest to lowest, were as follows: annual average precipitation > actual stocking capacity > silt content > sand content > annual average temperature > slope > elevation > clay content > aspect. Among these factors, annual average precipitation demonstrated the highest explanatory power, with a q value of 0.620, while actual stocking capacity ranked second with a q value of 0.459. Conversely, aspect exhibited the lowest explanatory power, with a q value of merely 0.003.

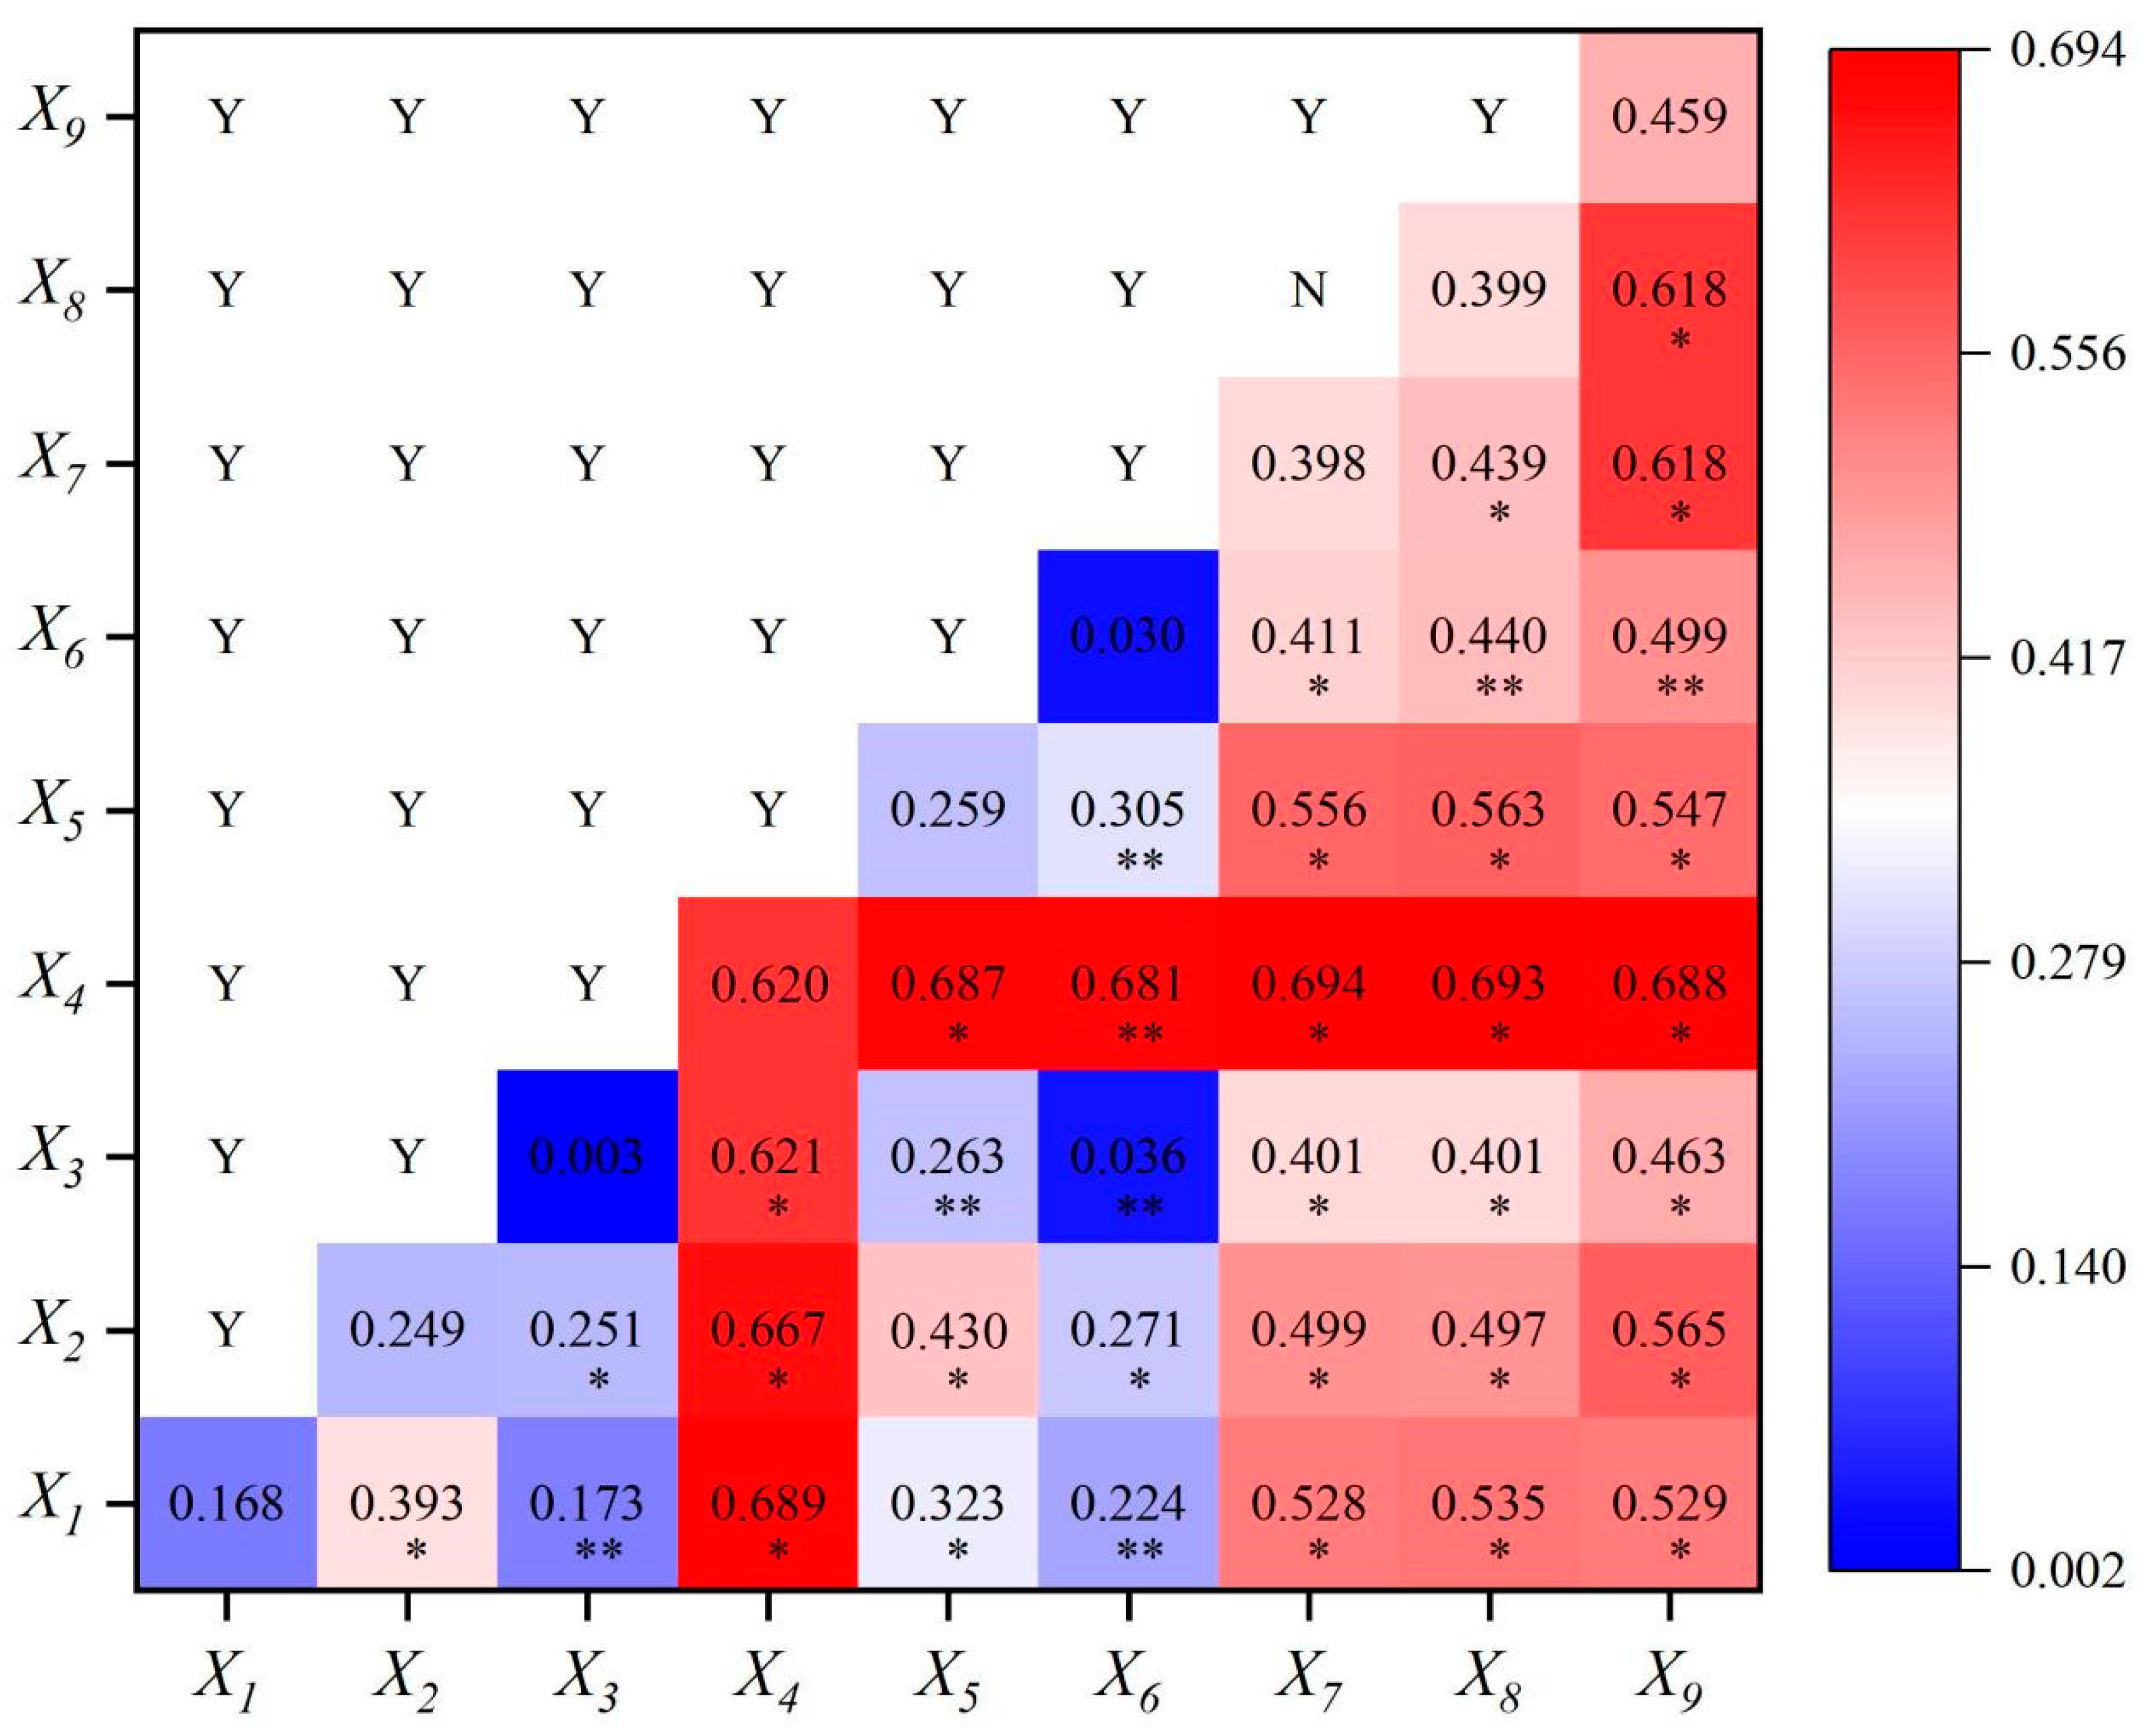
3.4.2. Interaction Detection

The results of the interaction detection conducted using the geographical detector (Figure 7) indicated a significant interaction among various driving factors. The two-factor interactions exhibited a greater effect than the single-factor influences, suggesting that the interplay between these two factors substantially enhances the explanatory power regarding the distribution pattern of black soil beach. This enhancement is primarily characterized by nonlinear and two-factor interactions, with the latter demonstrating a superior explanatory capacity. Notably, the interaction between annual average precipitation and sand content yielded the highest explanatory power, as evidenced by a q value of 0.694. This was followed by the interactions involving annual average precipitation with silt content, elevation, and actual stocking capacity, which presented strong explanatory powers with q values of 0.693, 0.689, and 0.688, respectively. Conversely, the interaction between clay content and slope exhibited the weakest explanatory power, reflected by a q value of merely 0.036.

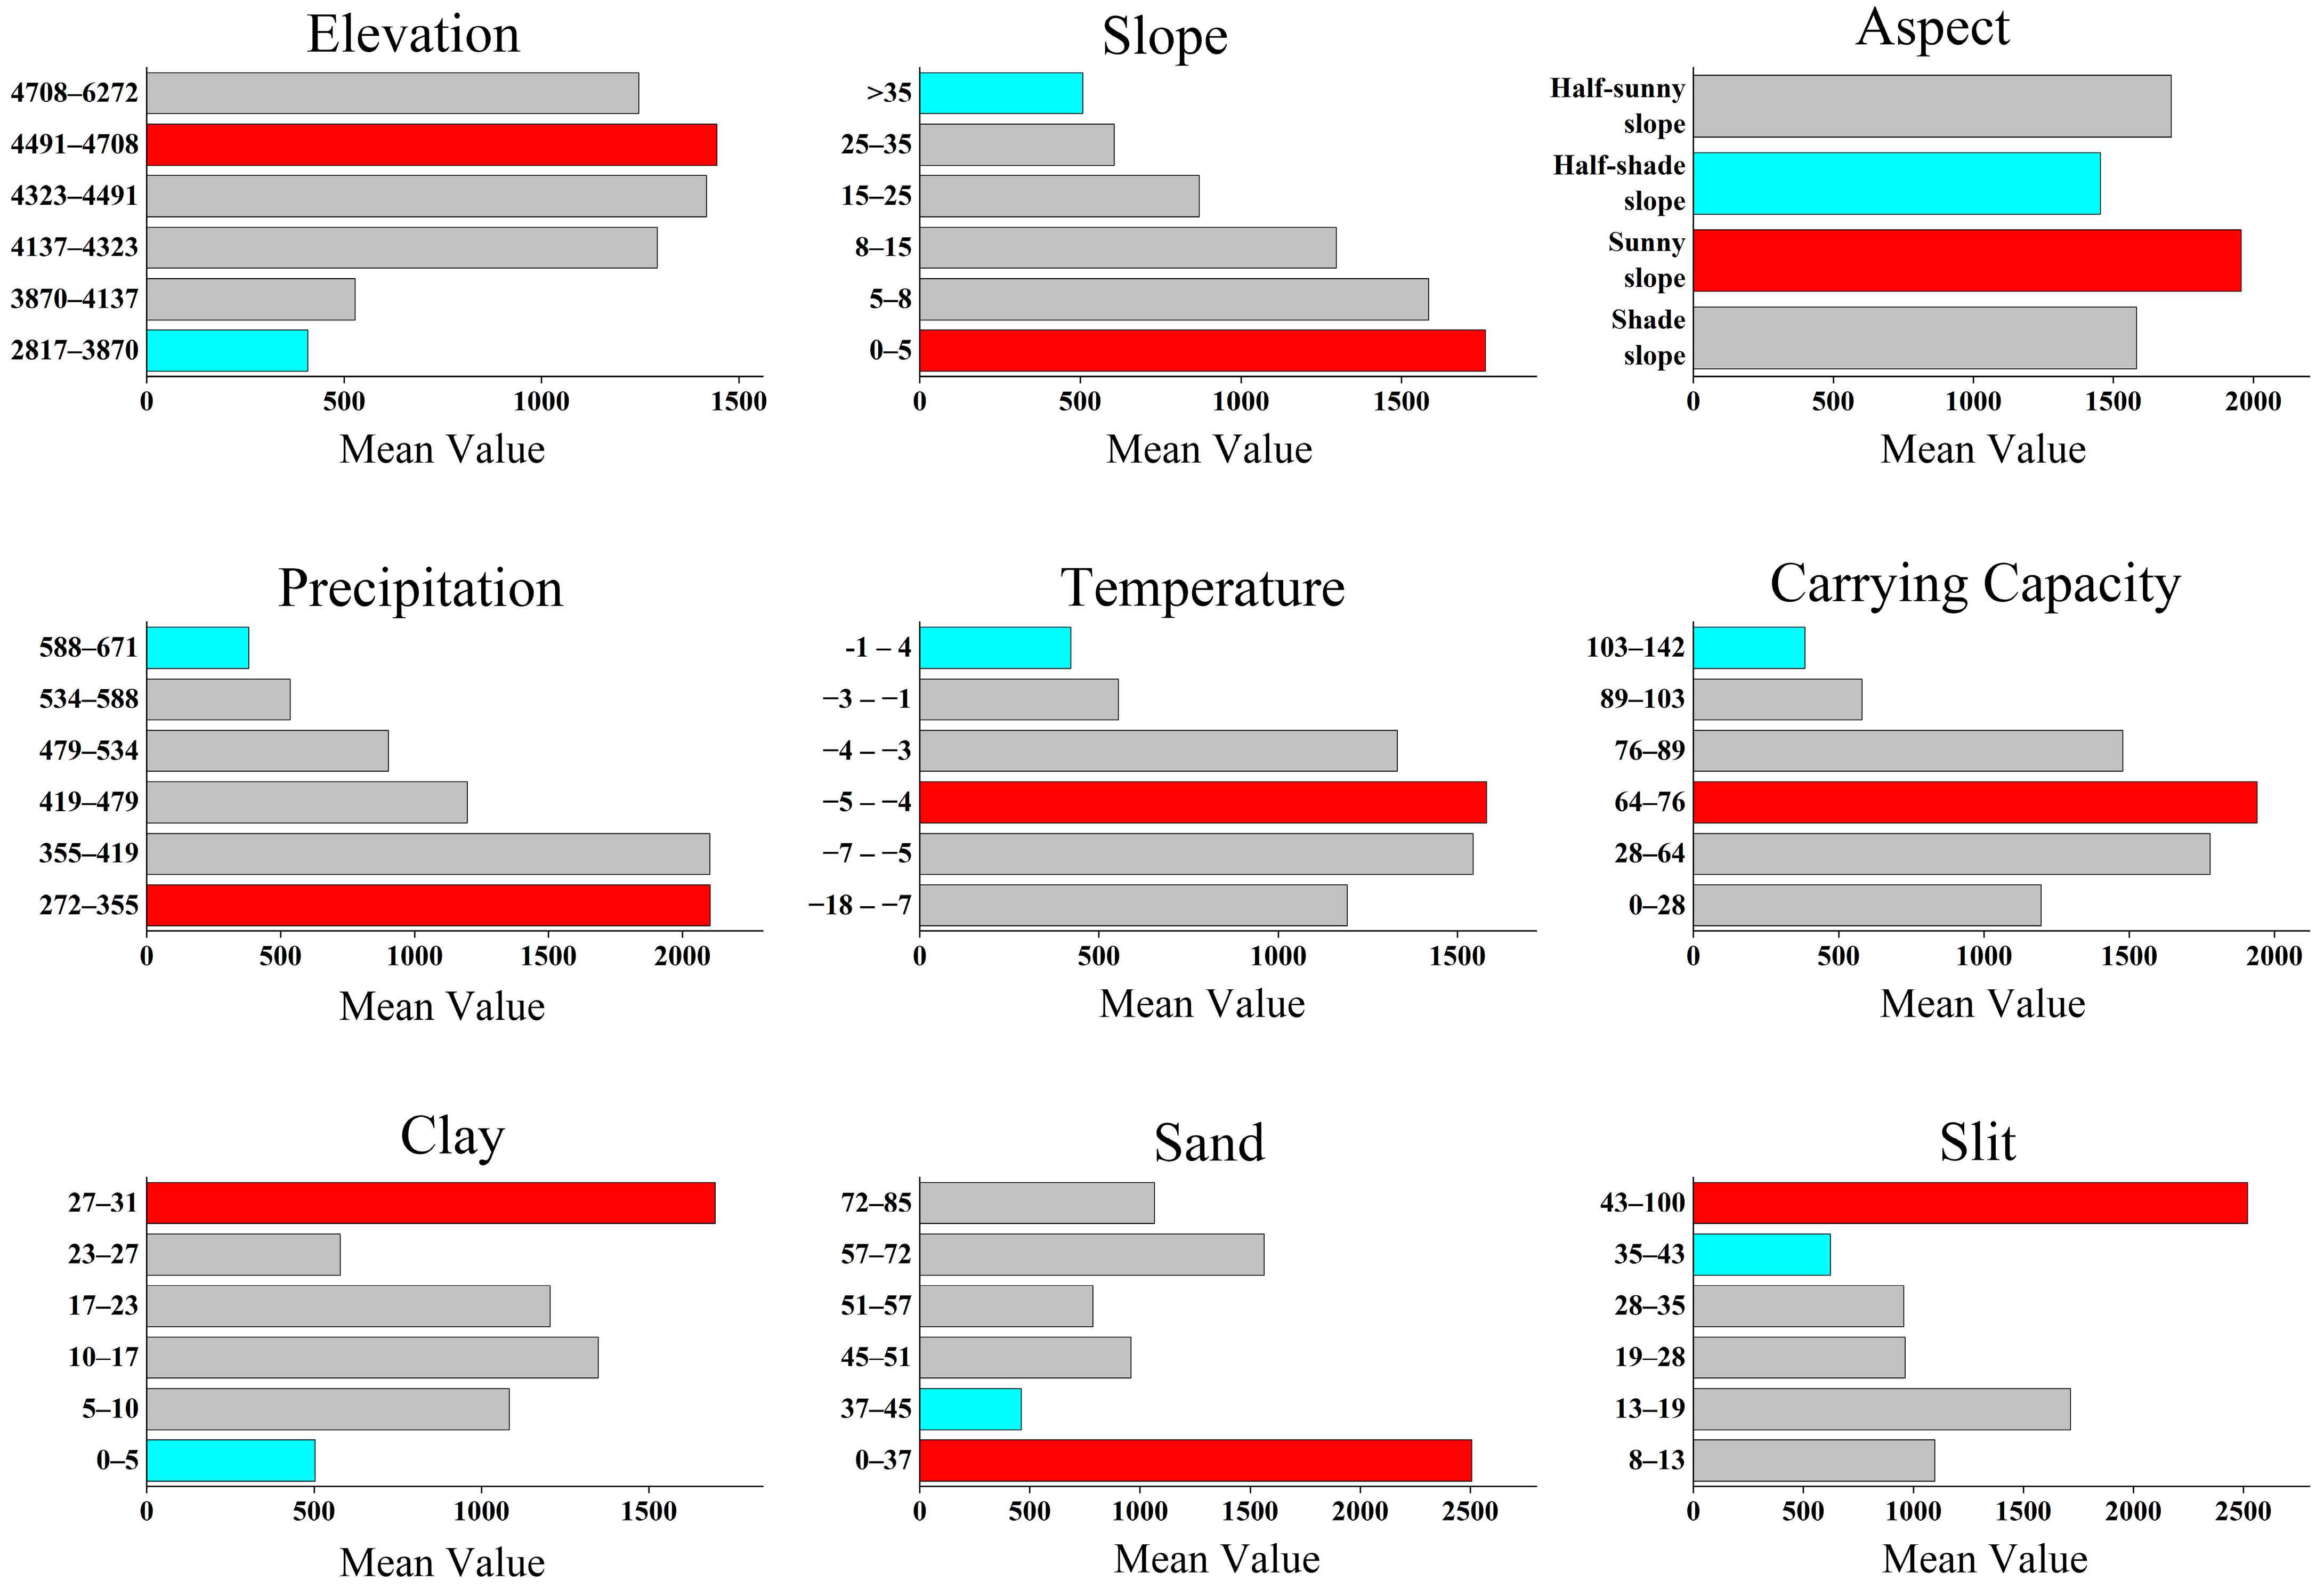
3.4.3. Risk Detection

The findings from the geographical detector analysis (Figure 8) indicated a significant variation in the distribution of black soil beach across different classification intervals of the driving factors. Elevation and slope emerged as the primary topographic determinants influencing the distribution of black soil beach. Specifically, the most concentrated distribution occurred at elevations ranging from 4491 to 4708 m and slopes between 0 and 5 degrees, suggesting that vegetation degradation is particularly severe in high-elevation, low-slope areas, which is closely linked to the local natural environment and industrial activities. Regarding meteorological factors, the annual average precipitation of 272 to 355 mm and an annual average temperature between −5 and −4 °C were found to have the most significant impact on the rate of black soil beach formation. Furthermore, soil texture factors exhibited a pronounced effect on the distribution of black soil beach; the most concentrated distribution was observed when clay content ranged from 27 to 31%, sand content from 0 to 37%, and silt content from 43 to 100%, with an average area exceeding 2500 km2. Additionally, anthropogenic factors exacerbated the formation of black soil beach, with the fastest formation occurring at an actual stocking capacity of 64 to 76 MU/km2.

3.4.4. Ecological Detection

The result of the ecological detection conducted using the geographical detector (Figure 7) indicated that there was no statistically significant variation in the distribution of black soil beach in relation to sand and silt content. Conversely, significant differences were observed concerning other influencing factors.

4. Discussion

4.1. Analysis of Distribution Pattern of Black Soil Beach

The findings of this study indicate that the black soil beach is predominantly located in the southwestern region of the Yellow River, particularly concentrated within the alpine meadows of Maduo County and Dari County. The concentrated distribution of the black soil beach is consistent with the previous research results. Previous studies have determined that the alpine meadow in the southwest of the Yellow River source area has become a hot spot for degradation due to high altitude climate stress [2,46]. However, our study deepens this understanding by quantifying the role of terrain: the terrain with a slope of 0–5° and an altitude of 4491–4708 m forms a specific condition, and the synergistic effect of freeze–thaw cycles and poor drainage aggravates soil erosion. This supports the research viewpoint of Li et al. (2002), who linked altitude-driven temperature changes to vegetation fragmentation, but our study further clarified the precise threshold for degradation to peak [17]. Additionally, the cold climate and considerable diurnal temperature fluctuations have a profound impact on the growth cycles of vegetation, particularly cold-tolerant species such as Carex myosuroides Vill. The decomposed organic matter from these plants serves as a crucial source of organic material for black soil formation. Furthermore, the root architecture and decomposition byproducts of Carex are instrumental in enhancing soil stability and nutrient retention [1,16,17].
The mild black soil beach in Maduo County includes an area of 4049.51 km2, while the heavy black soil beach spans 1997.43 km2. In contrast, Dari County features a mild black soil beach covering 6330.39 km2 and a heavy black soil beach measuring 549.85 km2. It is worth noting that the management measures taken in Dari County in 2020 have reduced the severely degraded areas compared with Maduo County, which echoes the successful cases in the grassland restoration work on the Qinghai–Tibet Plateau. In those cases, the setting of fences and grazing prohibition and reseeding of grass seeds have played a role in stabilizing the soil [47,48]. This observation aligns with the findings of the spatial autocorrelation analysis.
The decrease in patch density and landscape shape index indicates that management measures promote the aggregation of patches, which is in contrast to some research results. In those studies, the recovery process led to an increase in the degree of fragmentation due to local interventions [49,50]. This difference highlights the importance of large-scale and sustained restoration work in Qinghai meadows.

4.2. Analysis of Black Soil Beach Driving Factors

The results showed that in Guoluo Prefecture, the annual average precipitation was the dominant factor affecting the distribution of black soil beach, followed by the actual stocking capacity. This is different from the research results of Shang et al. (2018), who believed that overgrazing is the main driving factor for the degradation of the Qinghai–Tibet Plateau [2]. This difference may be due to the unique water–heat coupling in the Three-River-Source region: higher precipitation increases soil moisture and temporarily buffers the grazing pressure on vegetation. Dong et al. (2013) confirmed this mechanism, and they proved the regulation of precipitation on grazing through soil water availability [16]. The key is that our results do not negate the role of overgrazing but reveal that its impact is context-dependent: in years with low precipitation (<250 mm), its impact will be amplified; in the period of more precipitation, this effect will be alleviated. The dual role of precipitation in both promoting and mitigating the degradation process highlights the need for interaction between grazing and climate, which is a key knowledge gap that currently exists and requires long-term monitoring [51,52,53].
Our results are consistent with Harris’s (2010) review of grassland degradation on the Tibetan Plateau, that is, the interaction between natural factors and human activities dominates the degradation process [54]. However, different from the study of Chen et al. (2014), this study found that the specific thresholds of altitude (4491–4708 m) and slope (0–5°) had a more significant effect on the distribution of black soil beach [1]. This may be due to the fact that the stronger freeze–thaw cycle in the Three-River-Source region aggravates soil erosion in low-slope areas. The findings indicate that the combined influence of any two factors is more significant than the explanatory capacity of an individual factor alone [2,16]. Furthermore, the interplay among the nine factors exhibited both nonlinear and two-factor enhancements in the distribution of black soil beach. Notably, the interaction between annual average precipitation, sand content, and actual stocking capacity demonstrated the highest explanatory power regarding the distribution of black soil beach. While elevation and slope individually possess limited explanatory power concerning the spatial distribution of black soil beach, their interaction significantly increases the explanatory capacity for this distribution [55].
The analysis of the various driving factors revealed notable disparities in the distribution of black soil beach across different subintervals. The findings indicated that the concentration of black soil beach was highest at elevations ranging from 4491 to 4708 m, with slopes between 0 and 5 degrees, and predominantly on sunny and half-sunny slopes. This phenomenon aligns with findings by Li et al. (2002), who demonstrated that elevations above 4500 m in the Qinghai–Tibet Plateau exacerbate freeze–thaw cycles and soil erosion, leading to vegetation fragmentation [17]. However, our study further quantifies the critical elevation threshold (4491–4708 m) where degradation intensity peaks, a refinement to previous qualitative descriptions [17,56]. When these conditions are coupled with gentler slope gradients, overgrazing, and frequent socio-economic activities, they negatively affect the circulation of organic matter in the soil. As a result, there is a decline in vegetation cover on sunny and partially sunny slopes [8,57]. In addition, when the annual average precipitation is 272–355 mm and the annual average temperature is −5–−4 °C, the distribution of black soil beach is higher. In terms of soil texture factors, black soil beach mainly had clay, sand, and silt content distributions in the ranges of 27–31%, 0–37%, and 43–100%, respectively. This may be because the temperature is low, the daily temperature difference is large, and the freeze–thaw effect is significant, resulting in the degradation of soil structure [31].

4.3. Limitations

The issue of grassland degradation in the Three-River-Source region has been the subject of extensive research by numerous scholars, given the prolonged deterioration in the ecosystem and the gradual expansion of black soil beach areas. This study quantitatively analyzed the distribution pattern of black soil beach and investigated the driving factors influencing their distribution through the application of the geographical detector model. However, certain limitations were identified in the research. (1) The Landsat 8–9 images chosen for analysis were influenced by various factors, notably significant cloud cover, which impacts the precision of image extraction. (2) The current analysis of factor detection focused solely on the explanatory power of each driving factor concerning the spatial heterogeneity of black soil beach, without examining the positive or negative explanatory contributions of these factors. Future research could benefit from integrating regression analysis, correlation analysis, and other methodologies to facilitate a more comprehensive comparison.

5. Conclusions

This study analyzed the spatial distribution pattern of black soil beach in Guoluo Tibetan Autonomous Prefecture in 2022, and discussed the main driving factors affecting its distribution pattern. The main conclusions are as follows:
(1)
From the perspective of spatial distribution, the total area of black soil beach in the study area was 32,222.11 km2, accounting for 43.43% of the total area of Guoluo Tibetan Autonomous Prefecture. The ecological degradation problem was serious, and the spatial distribution showed a zonal pattern of ‘west dense east sparse‘ along the Yellow River Basin. The degraded area of Maduo County and Dari County in the west accounted for the highest proportion, which was the priority area for ecological restoration.
(2)
The landscape pattern analysis showed that the fragmentation degree of black soil beach increased first and then decreased with the aggravation of degradation, while the aggregation index and landscape shape index continued to decrease, reflecting the structural damage of the ecosystem and the process of boundary homogenization, which may be related to the continuous expansion of patches caused by freeze–thaw erosion and grazing disturbance. Spatial autocorrelation analysis further revealed the agglomeration effect of degradation hotspots: Moran ‘s I index increased significantly with the increase in degradation degree, and the high–high clustering area (H-H) was concentrated in Maduo County and the north of Dari County, which confirmed that the west was the core area of degradation.
(3)
The analysis of driving factors showed that the distribution pattern of black soil beach was affected by the synergistic effect of multiple factors such as annual average precipitation, actual stocking capacity, and silt content, among which the influence of precipitation was the most significant (q value is 0.620), but the interaction between various factors exceeded the independent contribution of a single factor. When the sand content (0%–37%), silt content (43%–100%), annual average precipitation (272–355 mm), and actual stocking capacity (64–76 MU/km2) are in a specific threshold range, the distribution of black soil beach is highly concentrated, while other environmental factors show dynamic heterogeneity. This phenomenon reveals the nonlinear characteristics of the formation mechanism of black soil beach, and emphasizes that ecological restoration must abandon the idea of single factor regulation and build a systematic governance framework based on multi-factor coupling. The study provides a quantitative basis for the vulnerability assessment of alpine ecosystems, and achieves sustainable recovery by dynamically balancing the threshold relationship of each driving force.
For future research, several directions are recommended. Firstly, due to the influence of cloud cover on Landsat 8–9 images, new remote sensing data sources or image-processing techniques should be explored to improve the accuracy of black soil beach mapping. Secondly, more in-depth research is needed on the interaction between precipitation and grazing intensity. Long-term monitoring and experimental studies could help clarify how these factors interact under different environmental conditions and their long-term impact on black soil beach degradation. Additionally, the integration of other modeling methods can more accurately predict the expansion of black soil beach and help to develop more active prevention and control measures.

Author Contributions

Conceptualization, W.J., Z.W. and G.P.; methodology, W.J., Z.W. and G.P.; software, W.J., Z.W., Y.L. and L.W.; validation, W.J., Q.Y. and J.S.; formal analysis, G.P. and Y.L.; investigation, W.J., G.P., Y.L. and L.W.; resources, G.P.; data curation, W.J. and Z.W.; writing—original draft preparation, W.J. and Z.W.; writing—review and editing, G.P., Y.L. and Q.Y.; visualization, W.J.; supervision, G.P. and Y.L.; project administration, G.P.; funding acquisition, G.P. All authors have read and agreed to the published version of the manuscript.

Funding

This work was supported by the grants from the Second Tibetan Plateau Scientific Expedition and Research Program (2019QZKK0903).

Data Availability Statement

The data presented in this study are available on request from the corresponding author. The data are not publicly available because of privacy restrictions.

Acknowledgments

The authors would like to thank all the members of the Second Tibetan Plateau Scientific Expedition and research project for their hard work and the data support provided by the data source websites.

Conflicts of Interest

The authors declare no conflicts of interest.

References

  1. Chen, B.; Zhang, X.; Tao, J.; Wu, J.; Wang, J.; Shi, P.; Zhang, Y.; Yu, C. The impact of climate change and anthropogenic activities on alpine grassland over the Qinghai-Tibet Plateau. Agric. For. Meteorol. 2014, 189–190, 11–18. [Google Scholar] [CrossRef]
  2. Shang, Z.; Dong, Q.; Shi, J.; Zhou, H.; Dong, S.; Shao, X.; Li, S.; Wang, Y.; Ma, Y.; Ding, L.; et al. Research Progress in Recent Ten Years of Ecological Restoration for ‘Black Soil Land’ Degraded Grassland on Tibetan Plateau—Concurrently Discuss of Ecological Restoration in Sangjiangyuan Region. Acta Agrestia Sin. 2018, 26, 1–21. [Google Scholar] [CrossRef]
  3. Liu, W.; Li, B.; Yuan, Y.; Li, Y.; Jiang, Y.; Li, R.; Zhai, D.; Xu, J. Artificial grassland mapping using artificial grassland detection index of vegetation growth in the Three-River Headwaters region. Ecol. Indic. 2023, 154, 110869. [Google Scholar] [CrossRef]
  4. Xiao, Z.; Ding, M.; Li, L.; Nie, Y.; Pan, J.; Li, R.; Liu, L.; Zhang, Y. Divergent changes of surface water and its climatic drivers in the headwater region of the Three Rivers on the Qinghai-Tibet Plateau. Ecol. Indic. 2024, 158, 111615. [Google Scholar] [CrossRef]
  5. Zhao, C.; Su, S.; Gong, Z.; Lv, C.; Li, N.; Luo, Q.; Zhou, X.; Li, S. Effectiveness of protected areas in the Three-river Source Region of the Tibetan Plateau for biodiversity and ecosystem services. Ecol. Indic. 2023, 154, 110861. [Google Scholar] [CrossRef]
  6. Zhang, Y.; Zhang, C.; Wang, Z.; An, R.; Li, J. Comprehensive Research on Remote Sensing Monitoring of Grassland Degradation: A Case Study in the Three-River Source Region, China. Sustainability 2019, 11, 1845. [Google Scholar] [CrossRef]
  7. Zhao, Y.; Pu, Y.; Lin, H.; Tang, R. Examining Soil Erosion Responses to Grassland Conversation Policy in Three-River Headwaters, China. Sustainability 2021, 13, 2702. [Google Scholar] [CrossRef]
  8. An, R.; Xu, X.; Li, X.; Liang, X. “Black Soil Land” recognition at Maduo County in source region of Yellow River based on quantitative remote sensing. Opt. Precis. Eng. 2013, 21, 3183–3190. [Google Scholar] [CrossRef]
  9. Li, J.; Wang, Y.; Li, X.; Liu, H.; Wang, X. Spatial Distribution Characteristics of Alpine Degraded Grassland in Source Region of Yellow River. Acta Agric. Boreali-Occident. Sin. 2024, 33, 108–120. [Google Scholar] [CrossRef]
  10. Reinermann, S.; Asam, S.; Kuenzer, C. Remote Sensing of Grassland Production and Management—A Review. Remote Sens. 2020, 12, 1949. [Google Scholar] [CrossRef]
  11. Qin, Y.; Zhang, C.; Lu, P. A fully automatic framework for sub-pixel mapping of thermokarst lakes using Sentinel-2 images. Sci. Remote Sens. 2023, 8, 100111. [Google Scholar] [CrossRef]
  12. Feng, F.; Wang, L.; Hou, W.; Yang, R.; Zhang, S.; Zhao, W. Analyzing the dynamic changes and causes of greenspace landscape patterns in Beijing plains. Ecol. Indic. 2024, 158, 111556. [Google Scholar] [CrossRef]
  13. Yang, T.; Song, M.; Li, S.; Bao, H. Multiscale NMF based on intra-pixel and inter-pixel structure adjustment for spectral unmixing. Int. J. Appl. Earth Obs. Geoinf. 2024, 130, 103901. [Google Scholar] [CrossRef]
  14. Gedamu, W.T.; Plank-Wiedenbeck, U.; Wodajo, B.T. A spatial autocorrelation analysis of road traffic crash by severity using Moran’s I spatial statistics: A comparative study of Addis Ababa and Berlin cities. Accid. Anal. Prev. 2024, 200, 107535. [Google Scholar] [CrossRef]
  15. Ren, D.; Cao, A. Analysis of the heterogeneity of landscape risk evolution and driving factors based on a combined GeoDa and Geodetector model. Ecol. Indic. 2022, 144, 109568. [Google Scholar] [CrossRef]
  16. Dong, Q.; Zhao, X.; Wu, G.; Shi, J.; Ren, G. A review of formation mechanism and restoration measures of “black-soil-type” degraded grassland in the Qinghai-Tibetan Plateau. Environ. Earth Sci. 2013, 70, 2359–2370. [Google Scholar] [CrossRef]
  17. Li, X. Natural factors and formative mechanism of “Black Beach” formed on grassland in Qinghai—Tibetan plateau. Pratacultural Sci. 2002, 19, 20–22. [Google Scholar] [CrossRef]
  18. Guo, L.; Xue, D.; Du, S.; Cao, L. Analysis of landscape change and ecological assessment of Guoluo Tibetan Autonomous Prefecture in Qinghai Province. Ecol. Sci. 2008, 27, 248–253. [Google Scholar] [CrossRef]
  19. Cai, Z.; Lyu, L.; Liu, Q.; Xing, Y.; He, M.; Zhang, H.; Shi, J. Restoration measures and prospects for degenerated grasslandof black soil beach in the Qinghai-Tibet Plateau. J. Beijing Univ. Agric. 2024, 39, 115–120. [Google Scholar] [CrossRef]
  20. Hu, Y.; Li, R.; Xin, Y.; Zhu, X.; Wang, Z.; Zhao, Y. Management and restoration of degradation vegetation on the Tibetan Plateau. Pratacultural Sci. 2015, 9, 1413. [Google Scholar] [CrossRef]
  21. Wang, J.; Zhang, X.; Chen, B.; Shi, P.; Zhang, J.; Shen, Z.; Tao, J.; Wu, J. Causes and Restoration of Degraded Alpine Grassland in Northern Tibet. J. Resour. Ecol. 2013, 4, 43–49. [Google Scholar] [CrossRef]
  22. Yang, L.; Song, M.; Wang, Y.; Wang, H.; Zhou, R. The Distribution of Plateau Pika (Ochotona curzoniae) in Guoluo Prefecture, Qinghai Province and Its Response to Climate Change. Acta Agrestia Sin. 2024, 32, 1902. [Google Scholar] [CrossRef]
  23. Xia, X.; Liang, W.; Lv, S.; Pan, Y.; Chen, Q. Remote Sensing Identification and Stability Change of Alpine Grasslands in Guoluo Tibetan Autonomous Prefecture, China. Sustainability 2024, 16, 5041. [Google Scholar] [CrossRef]
  24. Zhao, Z.; Wu, X.; Li, G.; Li, J. The cause of grassland degradation in Golog Tibetan Autonomous Prefecture in the Three Rivers Headwaters Region of Qinghai Province. Acta Ecol. Sin. 2013, 33, 6577–6586. [Google Scholar] [CrossRef]
  25. Feng, S.; Guo, L.; Cai, J.; Li, F. On ecological sensitivity assessment of Guoluo Tibetan Autonomous Prefecture in Qinghai. Ecol. Sci. 2016, 35, 142–147. [Google Scholar] [CrossRef]
  26. Zhang, Z.; Gong, J.; Li, J.; Zhang, Z.; Zhang, M. Grassland degradation susceptibility assessment of the eastern area of the Three Rivers Source region based on the information quantity model: A case study of Golog Tibetan Autonomous Prefecture, Qinghai Province. Resour. Sci. 2022, 44, 464–479. [Google Scholar] [CrossRef]
  27. Zhou, H.; Zhou, L.; Liu, W.; Zhao, X.; Lai, D.; Cai, R.; Zhao, B.; Li, Y. Study on grassland degradation and strategies for the sustainable development of the livestock raising industry in Guoluo Prefecture of Qinghai. Pratacultural Sci. 2003, 2003, 19–25. [Google Scholar] [CrossRef]
  28. Zhang, Z.; Liu, H.; Dong, F.; Zhou, X.; Li, J.; Zhu, B.; Chen, F.; Ma, P.; Zhao, X.; Zheng, Z.; et al. Spatial Distribution Characteristics of Plant Community and the Identification of Driving Factors in Riparian Zone of the Three-River Headwaters Region, China. Environ. Sci. 2024, 45, 5351–5360. [Google Scholar] [CrossRef]
  29. Li, F.; Wu, Z.; Xu, C.; Xu, Y.; Zhang, L. The spatial distribution of Ophiocordyceps sinensis suitability in Sanjiangyuan Region. Acta Ecol. Sin. 2014, 34, 1318–1325. [Google Scholar] [CrossRef]
  30. Shao, Q.; Liu, G.; Li, X.; Huang, H.; Fan, J.; Wang, L.; Liu, J.; Guo, X. Assessing the Snow Disaster and Disaster Resistance Capability for Spring 2019 in China’s Three-River Headwaters Region. Sustainability 2019, 11, 6423. [Google Scholar] [CrossRef]
  31. Shang, Z.; Long, R. Formation causes and recovery of the “Black Soil Type” degraded alpine grassland in Qinghai-Tibetan Plateau. Front. Agric. China 2007, 1, 197–202. [Google Scholar] [CrossRef]
  32. Mudereri, B.T.; Abdel-Rahman, E.M.; Dube, T.; Niassy, S.; Khan, Z.; Tonnang, H.E.Z.; Landmann, T. A two-step approach for detecting Striga in a complex agroecological system using Sentinel-2 data. Sci. Total Environ. 2021, 762, 143151. [Google Scholar] [CrossRef]
  33. Roberts, D.A.; Gardner, M.; Church, R.; Ustin, S.; Scheer, G.; Green, R.O. Mapping Chaparral in the Santa Monica Mountains Using Multiple Endmember Spectral Mixture Models. Remote Sens. Environ. 1998, 65, 267–279. [Google Scholar] [CrossRef]
  34. Fan, F.; Deng, Y. Enhancing endmember selection in multiple endmember spectral mixture analysis (MESMA) for urban impervious surface area mapping using spectral angle and spectral distance parameters. Int. J. Appl. Earth Obs. Geoinf. 2014, 33, 290–301. [Google Scholar] [CrossRef]
  35. Franke, J.; Roberts, D.A.; Halligan, K.; Menz, G. Hierarchical Multiple Endmember Spectral Mixture Analysis (MESMA) of hyperspectral imagery for urban environments. Remote Sens. Environ. 2009, 113, 1712–1723. [Google Scholar] [CrossRef]
  36. Smith, M.O.; Ustin, S.L.; Adams, J.B.; Gillespie, A.R. Vegetation in deserts: I. A regional measure of abundance from multispectral images. Remote Sens. Environ. 1990, 31, 1–26. [Google Scholar] [CrossRef]
  37. Quintano, C.; Fernández-Manso, A.; Roberts, D.A. Multiple Endmember Spectral Mixture Analysis (MESMA) to map burn severity levels from Landsat images in Mediterranean countries. Remote Sens. Environ. 2013, 136, 76–88. [Google Scholar] [CrossRef]
  38. Thorp, K.R.; French, A.N.; Rango, A. Effect of image spatial and spectral characteristics on mapping semi-arid rangeland vegetation using multiple endmember spectral mixture analysis (MESMA). Remote Sens. Environ. 2013, 132, 120–130. [Google Scholar] [CrossRef]
  39. Xiong, S. Application of Geographic Information System in Monitoring the Change of Black Soil Beach Type Degraded Grassland in Sanjiangyuan Comprehensive Test Area. China Manganese Ind. 2018, 36, 176–178. [Google Scholar] [CrossRef]
  40. Hu, X.; Ma, C.; Huang, P.; Guo, X. Ecological vulnerability assessment based on AHP-PSR method and analysis of its single parameter sensitivity and spatial autocorrelation for ecological protection—A case of Weifang City, China. Ecol. Indic. 2021, 125, 107464. [Google Scholar] [CrossRef]
  41. Zhang, J.; Zhang, K.; Zhao, F. Research on the regional spatial effects of green development and environmental governance in China based on a spatial autocorrelation model. Struct. Change Econ. Dyn. 2020, 55, 1–11. [Google Scholar] [CrossRef]
  42. Islam, S.M.S.; Islam, K.M.A.; Mullick, M.R.A. Drought hot spot analysis using local indicators of spatial autocorrelation: An experience from Bangladesh. Environ. Chall. 2022, 6, 100410. [Google Scholar] [CrossRef]
  43. Zhang, Y.; Jiang, X.; Lei, Y.; Gao, S. The contributions of natural and anthropogenic factors to NDVI variations on the Loess Plateau in China during 2000–2020. Ecol. Indic. 2022, 143, 109342. [Google Scholar] [CrossRef]
  44. Zhang, Y.; Zhang, L.; Wang, J.; Dong, G.; Wei, Y. Quantitative analysis of NDVI driving factors based on the geographical detector model in the Chengdu–Chongqing region, China. Ecol. Indic. 2023, 155, 110978. [Google Scholar] [CrossRef]
  45. Zhao, X.; Tan, S.; Li, Y.; Wu, H.; Wu, R. Quantitative analysis of fractional vegetation cover in southern Sichuan urban agglomeration using optimal parameter geographic detector model, China. Ecol. Indic. 2024, 158, 111529. [Google Scholar] [CrossRef]
  46. Wang, M.; Chen, S.; Wei, P.; Jia, Y.; Hou, G.; Xu, H.; Yang, M. Effects of artificial grasslands on the freeze-thaw process of black soil beach in permafrost regions. Pratacultural Sci. 2022, 39, 2016–2028. [Google Scholar] [CrossRef]
  47. Geng, G. Beautiful Answer Sheet for Qinghai Alpine Grassland Protection and Restoration. Green China 2021, 18, 8–13. [Google Scholar] [CrossRef]
  48. Geng, G. Luorigai is a “Living Map” on the Dari Grassland. Green China 2022, 19, 56–59+51. [Google Scholar] [CrossRef]
  49. Zhang, Y.; Wu, X.; Li, X.; Zhang, F.; Dong, X.; Wang, Y.; Zhang, H. Identification of Degraded Grassland in Qinghai Area of Yellow River Source Based On High-Resolution Images. Acta Agric. Boreali-Occident. Sin. 2023, 32, 198–211. [Google Scholar] [CrossRef]
  50. Zhuoma, C. Management Model of “Black Soil Beach” Degraded Grassland in Qinghai Province. Graziery Vet. Sci. (Electron. Version) 2021, 2021, 129–130. [Google Scholar] [CrossRef]
  51. Jia, Y.; Wei, P.; Wu, M.; Zhao, J.; Gao, Y.; Chen, S. Response of Soil Aggregate to Artificial Planting in “Black Soil Land” of Permafrost Regions. Acta Agrestia Sin. 2022, 30, 1934–1943. [Google Scholar] [CrossRef]
  52. Liu, Y.; Li, X.; Wei, W.; Lu, G.; Tian, F.; Qiao, Y. The Influence of “Black Beach” to Soils Nutrient on Alpine Meadow. Acta Agric. Boreali-Occident. Sin. 2009, 18, 304–308. [Google Scholar] [CrossRef]
  53. Wang, X.; Ma, Y.; Wang, Y.; Li, S.; Jing, M.; Shi, J.; Wen, J. Effects of Eestablishment Ages of Elymus tangutorum on Soil Characteristics of Black-Soil-Beach in Alpine Region of Qilian Mountains. Chin. Qinghai J. Anim. Vet. Sci. 2020, 50, 7–13+70. [Google Scholar] [CrossRef]
  54. Harris, R.B. Rangeland degradation on the Qinghai-Tibetan plateau: A review of the evidence of its magnitude and causes. J. Arid Environ. 2010, 74, 1–12. [Google Scholar] [CrossRef]
  55. Wang, B.; Ga, M.; Zhang, Y. Study on the forming mechanism of “black beach” degraded alpine meadow on Qinghai-Tibetan Plateau and the research progress on its restoration. Grassl. Turf 2007, 2007, 72–77. [Google Scholar] [CrossRef]
  56. Tuo, W.; Liu, Z.; Zhang, R.; Zhang, Q.; Zhou, H. Research progress on the causes and restoration of degraded grassland of black soil land in Qinghai Province. Qinghai Prataculture 2024, 33, 43–49. [Google Scholar] [CrossRef]
  57. Liu, Y.; Qin, K.; Lu, H.; Chen, S. Spatio-temporal monitoring of black soil land degraded grassland by remote sensing. Bull. Surv. Mapp. 2022, 2022, 57–61. [Google Scholar] [CrossRef]
Figure 1. Location of the study area. (ae) UAV images obtained from July to August 2023.
Land 14 01050 g001
Figure 2. Spatial distribution of driving factors in Guoluo Prefecture.
Land 14 01050 g002
Figure 3. Spectral curves of endmembers. (a) Spectral curve of vegetation abundance; (b) Abundance spectral curve of bare soil; (c) High and low reflectance spectral curves.
Land 14 01050 g003
Figure 4. Spatial distribution of black soil beach.
Land 14 01050 g004
Figure 5. LISA clustering results of different degrees of black soil beach.
Land 14 01050 g005
Figure 6. Detection q value of the driving factors of black soil beach distribution pattern. Note: The explanatory power of each factor in the figure is represented by a gray band, where the red band represents the highest explanatory power of the factor. X1: elevation; X2: slope; X3: aspect; X4: annual average precipitation; X5: annual average temperature; X6: clay content; X7: sand content; X8: silt content; X9: actual stocking capacity.
Land 14 01050 g006
Figure 7. Driving factor interaction detection and ecological detection of black soil beach distribution pattern. * indicates two-factor enhancement, ** indicates nonlinear enhancement, Y indicates significant difference, and N indicates no significant difference. X1: elevation; X2: slope; X3: aspect; X4: annual average precipitation; X5: annual average temperature; X6: clay content; X7: sand content; X8: silt content; X9: actual stocking capacity.
Land 14 01050 g007
Figure 8. Concentrated distribution interval of black soil beach in each driving factor.
Land 14 01050 g008
Table 1. Driving factors of distribution pattern of black soil beach.
FactorsDriving FactorsVariablesData Source
Terrain factorsElevation (m)X1Data Center for Resources and Environmental Sciences, Chinese Academy of Sciences
https://www.resdc.cn/ (accessed on 10 November 2023)
Slope (°)X2
Aspect (/)X3
Meteorological factorsAnnual average precipitation (mm)X4National Tibetan Plateau Data Center
https://data.tpdc.ac.cn/ (accessed on 10 November 2023)
Annual average temperature (°C)X5
Soil texture factorsClay content (%)X6
Sand content (%)X7
Silt content (%)X8
Human factorActual stocking capacity (MU/km2)X9
Table 2. Landscape pattern index.
Landscape Pattern IndexCalculation FormulaRangeEcological Meaning
patch density (PD) P D = N / A PD ≥ 0Reflecting the degree of spatial heterogeneity in the landscape
aggregation index (AI) A I = [ g i i m a x g i i ] 0 < AI ≤ 100Reflecting the degree of patch aggregation in the landscape
landscape shape index (LSI) L S I = 0.25 E / A LSI ≥ 1Reflecting the degree of complexity in the patch boundary shapes
Table 3. Statistics of different degrees of black soil beach area in counties of Guoluo Prefecture.
County NameMild Black Soil BeachModerate Black Soil BeachSevere Black Soil BeachTotal (km2)Proportion (%)
Maqin3318.83925.37485.044729.2435.29%
Gande2428.48594.09178.423200.9945.43%
Maduo4049.513192.221997.439239.1636.52%
Jiuzhi2320.22372.3595.042787.6131.83%
Dari6330.392778.30549.859658.5462.78%
Banma1988.59515.00102.982606.5741.09%
Total (km2)20,436.028377.333408.7632,222.1143.43%
Note: The proportion in the table is the percentage of the total area of mild, moderate, and severe black soil beach in each county to the corresponding county area.
Table 4. Evaluation of identification accuracy of black soil beach.
Field Sampling PointsExtract Sampling Points
Mild Black Soil BeachModerate Black Soil BeachSevere Black Soil Beach
Mild black soil beach86 14
Moderate black soil beach12817
Severe black soil beach21583
Table 5. Landscape pattern index of different degrees of black soil beach.
County NameMild Black Soil BeachModerate Black Soil BeachSevere Black Soil Beach
PDAILSIPDAILSIPDAILSI
Maqin County7.1067.49625.5411.1745.64551.574.6856.38320.40
Gande County8.1166.52550.1714.1546.86432.774.9948.26232.35
Maduo County5.8566.94702.379.3758.66779.596.0765.11520.51
Jiuzhi County9.9270.88467.898.2249.60324.252.5647.93168.93
Dari County4.9671.25763.1420.4455.46782.578.4047.70407.80
Banma County4.6975.65361.7310.7653.36352.193.6747.85176.05
County level6.7769.79578.4712.3551.60537.165.0652.21304.34
Global level6.4469.931448.8112.2854.591385.954.5659.18794.79
PD, patch density; AI, aggregation index; LSI, landscape shape index.
Disclaimer/Publisher’s Note: The statements, opinions and data contained in all publications are solely those of the individual author(s) and contributor(s) and not of MDPI and/or the editor(s). MDPI and/or the editor(s) disclaim responsibility for any injury to people or property resulting from any ideas, methods, instructions or products referred to in the content.

