Abstract
Habitat suitability assessment for forest and grassland ecosystems is a critical component of ecological restoration and land use planning in the Loess Plateau, aiming to advance soil and water conservation and foster sustainable ecological environment development. Despite progress in vegetation restoration, systematic evaluations of habitat suitability in complex geomorphic regions like the Loess Plateau remain scarce, particularly in balancing hydrological and ecological trade-offs. The Yanhe River Basin (7725 km2), a sediment-prone tributary of the Yellow River, exemplifies the challenges of soil erosion and semi-arid climatic constraints, making it a critical case for evaluating restoration strategies. This study employed a comprehensive approach utilizing Analytic Hierarchy Process (AHP), Geographic Detector, mathematical statistics, and other methods. An evaluation indicator system and methodology were established to assess the suitability of forest and grassland habitats in the Yanhe River Basin, evaluating the suitability and quality improvement potential under the current land use conditions. The results indicate: (1) The dominant factors influencing the suitable distribution of forests include photosynthetically active radiation (PAR), soil total phosphorus content, annual precipitation, and elevation. For grasslands, the dominant factors include photosynthetically active radiation, annual average temperature, elevation, and annual precipitation. (2) In the watershed, forestland and grassland areas classified as moderately suitable or higher cover 1064.9 km2 and 4196.9 km2, accounting for 91.9% and 94.7% of their total respective areas, indicating a generally rational spatial allocation of forest and grassland ecosystems. (3) The improvable area for forests measures 366 km2 (34.4% of moderately or higher suitability zones), with most already meeting coverage thresholds. In contrast, grasslands have an improvable area of 2491.6 km2 (59.4% of moderately or higher suitability zones), where over half of the area remains below coverage thresholds corresponding to their habitat conditions. (4) Forests can adopt natural restoration-focused low-intensity interventions through strengthened closure management, while grasslands require spatially tailored measures—such as precipitation interception and enhanced stewardship—targeting suitability-based potential grades, collectively achieving overall improvement in grassland vegetation coverage. This study represents the first systematic evaluation of forest–grassland habitat suitability in the Yanhe River Basin, elucidating its spatial distribution patterns and providing critical insights for watershed-scale ecological restoration.
1. Introduction
In recent years, there has been a significant reduction in the sediment load of the Yellow River, and the restoration of forest and grass vegetation in the middle reaches of the Yellow River is considered one of the contributing factors [1]. Afforestation and grass planting stand out as pivotal measures for soil and water conservation on the Loess Plateau, offering multiple benefits such as water conservation, ecological protection, and improvement of local microclimates. Since 1999, large-scale conversion of farmland to forest (grassland) has been implemented in the Yellow River Basin, greatly improving the vegetation coverage of the underlying surface in the watershed [2].
However, the growth of forest and grass vegetation is subject to diverse influences; the suitability of vegetation restoration cannot be ignored. In the northwest Loess Plateau, large-scale vegetation restoration has significantly increased vegetation coverage, but it has also caused a dramatic increase in vegetation water consumption. In some areas with high afforestation density, dry layers have appeared in the deep soil [3,4,5], resulting in restricted vegetation growth and even the degradation of “stunted tree”. In addition, the lack of scientific planning and management during the vegetation restoration process may lead to increased vulnerability of the ecosystem.
Simultaneously, there remains an imbalance in soil and water conservation measures in the Yellow River Basin, especially in regions with high sediment yield and concentrated coarse sediment sources [6]. Vegetation restoration, primarily through afforestation and grass planting, remains a crucial approach to reduce erosion intensity and restore the ecological conditions in these areas. These problems show that although planting trees and grass has been widely recognized as an important means to reduce erosion intensity and restore regional ecology, its spatial layout and implementation methods need to be scientifically optimized. Therefore, it is urgent to investigate the spatial compatibility of soil and water conservation vegetation measures in the middle reaches of the Yellow River. Conducting an evaluation of the suitability of forest and grassland habitats in typical tributaries is essential. This research aims to address the spatial precision matching issues between natural environmental elements and the growth of forest and grass vegetation. It also aims to meet the requirements of improving the quality and efficiency of soil and water conservation, optimizing layout, and implementing precise governance in the new era, providing both significant scientific and practical value.
Several scholars have constructed evaluation indicator systems based on natural habitat elements affecting vegetation community sustainable succession and ecosystem stability maintenance. They have used subjective weighting methods, objective weighting methods, or a combination of both to determine indicator weights and conduct vegetation suitability assessments within watersheds [7,8,9]. In terms of evaluation indicators, considerations generally encompass climate, topography, soil, human activities, and other factors covering the main elements influencing vegetation growth. However, the sub-regional range definition and evaluation score determination for indicators have not established a quantification method that matches the spatial differentiation characteristics of vegetation growth in the evaluated watershed or region.
Concerning evaluation methods, commonly used subjective weighting methods include the Analytic Hierarchy Process (AHP), the Delphi method [10,11,12,13,14], etc. These methods are capable of effectively incorporating expert experience and consolidating expert consensus. However, they fall short in precisely revealing the inherent patterns in objective data. Objective weighting methods, on the other hand, are mostly based on techniques such as fuzzy evidence weights [15,16], principal component analysis (PCA) [17,18,19], and other data processing methods. These methods determine indicator weights based on the intrinsic relationships within the data but do not consider the intentions of decision-makers.
In recent years, combined weighting methods integrating subjective and objective evaluation approaches have experienced rapid development, showing certain advantages in evaluations where subjective influences are significant and data patterns are unclear [16]. However, the weighting proportions and integrated methods of combining subjective-objective approaches still need further improvement. Existing studies in homogeneous landscapes (e.g., purple soil hills [11] and the mountain basins in the northwest of Hebei Province [20]) fail to address the Yanhe Basin’s complex terrain, where fragmented loess hills and gully systems exacerbate soil erosion (88.9% of the basin).
Therefore, this study integrates geographic detectors, spatial analysis, and mathematical statistics methods to construct a suitability evaluation index system and methodology for forest–grassland habitat suitability. It systematically evaluates the spatial differentiation characteristics of suitability and the potential for improving the quality of forest–grassland habitats within the Yanhe River Basin, thereby effectively addressing the existing research gaps in evaluating the suitability for forest–grassland ecosystems in complex geomorphic regions. The results provide scientific support for the structural optimization, functional enhancement, and targeted allocation of ecological engineering measures aimed at soil-water conservation and vegetation restoration on the Loess Plateau.
2. Methods
2.1. Study Area
The Yanhe River (36°27′–37°58′ N, 108°41′–110°29′ E) is a primary tributary of the Yellow River, located on the right bank of the middle reaches of the Yellow River (Figure 1a). It has a total length of 286.9 km and a watershed area of approximately 7725 km2. The Yanhe River Basin exhibits distinct spatial heterogeneity in topography, with elevations ranging from 511 m to 1790 m. The overall terrain features a characteristic “higher northwest to lower southeast” elevation pattern, as illustrated in Figure 1b. The climate shows typical features of a warm temperate continental semi-arid climate, with an average annual temperature ranging from 8 °C to 11 °C and annual precipitation ranging from 450 to 550 mm. The loess hilly-gully area constitutes the predominant landform type in the basin, covering over 90% of the total area. The terrain is fragmented, characterized by hills in the inter-gully areas. The soil type is loess soil, characterized by loose texture and poor erosion resistance, leading to severe soil erosion that affects 88.9% of the total basin area [21]. Natural forests are scarce in the Yanhe River Basin, with grasslands being the predominant vegetation type. Sparse shrub forests distributed in patches form a landscape dominated by grasslands [22]. As of 2020, the area of forest and grassland is 1158.2 km2 and 4432.6 km2, respectively, accounting for approximately 15.0% and 57.4% of the total basin area (Figure 1c). Therefore, considering the various factors such as basin landform types, conservation status, erosion environment, and distribution of forest and grasslands, conducting research on the Yanhe River as a typical tributary of the middle reaches of the Yellow River holds significant representativeness and reference value.
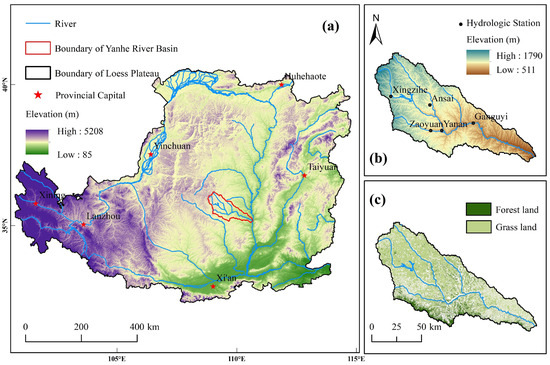
Figure 1.
Sketch map of the study area. (a) Location; (b) elevation; (c) forest and grassland distribution.
2.2. Data Source and Preprocessing
In accordance with the requirements of the watershed’s forest and grass suitability assessment, data from five categories, including topography, climate, soil, remote sensing, and land use, were collected and organized (Table A1). The topographic data encompassed Digital Elevation Model (DEM), aspect, slope gradient, aspect, and slope length; climate data included precipitation, temperature, and fraction of photosynthetically active radiation (FPAR); soil data covered soil nutrients (nitrogen, phosphorus, and potassium content), soil organic matter content, soil pH, soil moisture, soil type, soil texture, and soil erosion intensity; remote sensing data included normalized difference vegetation index (NDVI).
Based on the above data, the following procedures were employed to calculate certain indicators for the forest and grass suitability assessment: using ArcMap Spatial Analyst tools to extract elevation and aspect, utilizing the LS tool [22] for slope gradient and slope length calculations; based on the pixel binary model principles [23,24], using the 5% and 95% confidence level thresholds obtained by intercepting the cumulative frequency histogram of NDVI, calculating the forest and grass cover (FVC); land usedata utilized the GLC_FCS30 product [25], reclassified into forest land, grassland, and others, where forest land and grassland are collectively referred to as forest and grass vegetation [26]. Subsequently, all evaluation indicator data were transformed to the WGS1984 coordinate system. Given the requirements for precise spatial allocation optimization of forest and grassland measures in the watershed and the limited data availability, the study retained coarse-resolution soil data and harmonized them through resampling. All assessment indicator datasets were resampled to a unified 30 m resolution raster format, ensuring consistency across datasets while balancing data accuracy and computational feasibility.
2.3. Suitability Evaluation Method
With the suitability of forest and grass as the ultimate goal, a thorough analysis was conducted, taking into account key habitat factors and their defining elements, as illustrated in Table A2. These factors encompass topography, climate, soil composition, and their collective impact on the growth of forests and grasslands, as well as the overall stability of the ecosystem. Subsequently, a comprehensive evaluation indicator system was devised to assess the suitability of forest and grassland habitats within a representative watershed situated in the middle reaches of the Yellow River. Among these, topographic factors include altitude, slope gradient, slope aspect, slope length, and slope position; climatic factors comprise precipitation, air temperature, and fraction of photosynthetically active radiation (FPAR); soil factors encompass soil nutrients, soil moisture, soil type, soil erosion intensity, and soil texture.
The determination of vegetation coverage threshold constitutes a critical step in assessing ecosystem stability. The vegetation coverage of forests and grass is subject to fluctuations over time due to factors such as precipitation and plant growth stages. The range of variation within a given period is relatively small, and there is no apparent increasing or decreasing trend. This stable period is considered the determining condition for forest and grass to reach the coverage threshold. Based on the least squares linear fitting results of the cumulative incremental change process of coverage for all evaluation units in the basin from 2000 to 2020, with a critical slope set at ±0.001, the preliminary evaluation units that have reached the vegetation coverage threshold were selected (Figure A1). Subsequently, the subregions and weights of evaluation indicators were inferred through these preliminary evaluation units.
The spatial subdivision of evaluation indicators constitutes a fundamental component in assessing forest and grassland suitability. Geographic detectors were applied to evaluate significant differences in vegetation characteristics across the subregions of each evaluation indicator, enabling the delineation of spatial subregions and assignment of scores. Initially, the preliminary evaluation units were classified into several levels based on the size of vegetation coverage. The average values of evaluation indicators corresponding to each level of coverage were then calculated. By considering the distribution relationship between vegetation coverage and evaluation indicators, the initial spatial subregions of the evaluation indicators were determined. Using the risk detector of Geodetector, the vegetation coverage levels between spatial subregions were tested for significant differences (through a 95% confidence test). Through continuous adjustment of the spatial subregion range, significant differences in vegetation coverage among various spatial subareas of evaluation indicators were ultimately obtained. It was determined that the evaluation indicators for the forest and grassland in the Yanhe River Basin can be divided into three to four spatial subareas. Based on their corresponding vegetation coverage levels, different scores were assigned to each subarea (Table A3 and Table A4). Taking the PAR index as an example, the spatial subdivision and statistical test results are shown in Table A5.
The determination of evaluation indicators weight coefficients forms a critical component in establishing robust suitability assessment frameworks. We used the differentiation and factor detector to calculate the interpretation degree of each evaluation index for the spatial differentiation of forest and grass vegetation attributes, according to the q-statistics of each evaluation index, i.e., the value of spatial differentiation interpretation degree (95% confidence), the suitability evaluation index and weight coefficient of forest and grass in the Yanhe River Basin were finally determined by normalization (Table A6). Under the current distribution and growth conditions of forests and grasslands, there are 9 and 11 suitability evaluation indicators for forests and grasslands, respectively, with the PAR being the most heavily weighted indicator for forest and grassland areas. In addition, soil total phosphorus content and annual precipitation have a significant impact on forests, while annual average temperature and altitude have a greater impact on grasslands. Therefore, there are some differences in the suitability evaluation indicators for forests and grasslands. In the forest, the three evaluation indicators of soil total nitrogen content, soil texture, and soil erosion intensity did not pass the significance test, while in the grassland, the evaluation indicator for soil total phosphorus content did not pass the significance test. Furthermore, factors such as slope gradient, aspect, slope length, slope position, and soil type have poor spatial interpretability for forest and grassland vegetation attributes at a 30 m resolution in the Yanhe River basin. They also did not pass the significance test with a confidence level of 95%; thus, they are not included in the suitability evaluation index system for forests and grasslands.
The classification of forest and grassland suitability serves as a crucial methodological foundation for ecosystem assessment. We focused on the mapping relationship between forest and grassland suitability and vegetation attributes. Referring to relevant standards for forest and grassland vegetation coverage classification [27], four vegetation coverage levels (0.00–0.25 for low coverage, 0.25–0.50 for moderate coverage, 0.50–0.75 for moderately-high coverage, and 0.75–1.00 for high coverage) were, respectively, associated with four suitability levels: not suitable, moderately suitable, moderately–highly suitable, and highly suitable. Due to the principle that a larger sample size results in a more accurate fit of the distribution function, forest areas selected samples with moderate, moderately high, and high coverage as the sample set to determine the boundary values, while grassland areas selected samples with low, moderate, and moderately high coverage. By statistically analyzing the suitability of threshold evaluation units corresponding to different vegetation coverage levels, fitting normal distribution functions, and using the 3σ rule [28] to eliminate outliers, the upper and lower limits of the 95% confidence interval were determined as the boundary values for suitability levels (Table A7).
The overall workflow of forest and grassland suitability evaluation is shown in Figure 2. On the above basis, the forest and grassland suitability evaluation was carried out based on the current status of forest land and underlying grassland in the Yanhe River Basin (2020).
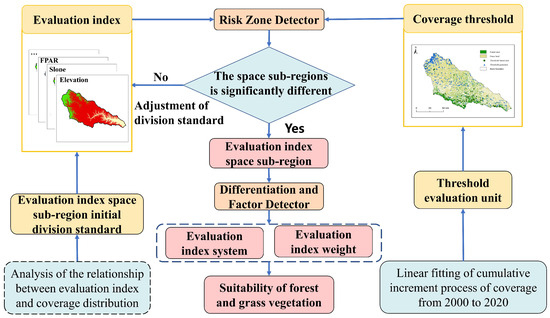
Figure 2.
Suitability evaluation method of forest and grass.
3. Results
3.1. Forest Land Suitability and Spatial Distribution
According to the statistical results of forest and grass suitability (Table 1), the areas with different suitability for forest land, listed from largest to smallest, are as follows: highly suitable, moderately suitable, moderately and highly suitable, and unsuitable (Table 1). The area ratios are 6.3:2:3.1:1.0. The total area of the basin with moderate suitability and above is 1064.9 km2, accounting for 91.9% of the total forest land area. This result shows that the spatial layout of forest land in the basin is generally reasonable, providing better habitat conditions for tree growth.

Table 1.
Statistics of forest and grass suitability.
The distribution of forestland suitability in the watershed showed certain spatial differences. Highly suitable forests (Figure 3a) cluster in the southern and central parts of the basin. The environmental conditions in this area are significantly better than those in other areas. This is mainly manifested in that the PAR component is mostly above 20%, which is conducive to plant photosynthesis; the altitude is mostly 1200–1400 m; the temperature and growing season are relatively suitable; the total phosphorus content in the soil is mostly above 0.12%, which provides the necessary nutrient support for forest growth; the annual precipitation is mostly above 530 mm, which can meet the water demand for forest growth. In addition, these areas have high vegetation coverage, less interference from human activities, and natural habitat conditions suitable for the stable growth of trees.
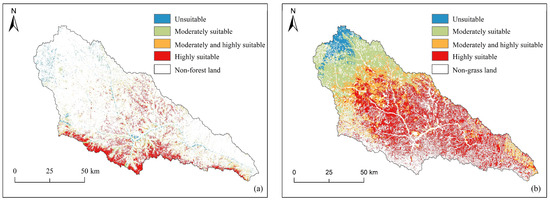
Figure 3.
Suitability of forest and grass in Yanhe River Basin. (a) Forest; (b) grass.
On the contrary, unsuitable forest lands are mainly clustered in the western part of the basin. The environmental conditions in this area are relatively poor, mainly manifested in the low PAR, generally below 15%; the altitude is mostly above 1400 m; the annual precipitation is insufficient, generally below 470 mm; the lack of water resources restricts the growth of trees. In addition, the soil texture in these areas is poor, the water retention capacity is weak, the soil erosion problem is prominent, and the vegetation coverage is low, which has caused great pressure on the ecological environment. In the future, measures such as artificial grass planting can be used to gradually optimize the land-use type of areas local to grassland or gradually improve their ecological suitability according to the law of natural succession. The moderately and highly suitable areas are mainly distributed in the transitional zone from the southeast to the northwest, with human activities having an impact between the highly suitable areas and the unsuitable areas.
3.2. Grassland Suitability and Spatial Distribution
According to the statistical results of forest and grassland suitability (Table 1), for grassland, the areas with different suitability, listed from largest to smallest, are as follows: highly suitable, moderately suitable, moderately and highly suitable, and unsuitable (Table 1). The area ratios are 9.3:4.4:4.1:1.0. The total area of the basin with moderate suitability and above is 4196.9 km2, accounting for 94.7% of the total grassland area. This result shows that the spatial layout of grassland in the basin is generally reasonable, providing good habitat conditions for the growth of herbaceous plants.
The area distribution of grasslands with different suitability showed obvious spatial differences. Highly suitable forests (Figure 3a) cluster in the central and eastern parts of the basin (Figure 3b). The environmental conditions in this area are significantly better than those in other areas, mainly in terms of higher PAR, generally reaching more than 19%, and the light conditions are suitable for the photosynthesis of herbaceous plants; the annual average temperature is mostly above 9.1 °C, and the climate is mild, which is conducive to the growth of herbaceous plants; the altitude is mostly below 1200 m, and the lower altitude and longer growing season provide favorable conditions for herbaceous plants; and the sufficient precipitation, with annual precipitation generally exceeding 530 mm, can meet the water needs of herbaceous plants. In addition, the terrain in these areas is gentle, the problem of soil erosion is relatively light, the vegetation coverage is high, human activities are less disruptive, and the natural habitat conditions are suitable for the stable growth of herbaceous plants.
On the contrary, unsuitable forest lands are mainly clustered in the western part of the basin. The environmental conditions in this area have a significant restrictive effect on the growth of herbaceous plants, mainly manifested in the low PAR component, generally below 13%, and insufficient light conditions, which inhibit the photosynthetic efficiency of plants; the altitude is above 1400 m, and the high altitude leads to low temperatures and a short growing season, which limits the distribution of herbaceous plants; and the precipitation is insufficient, with an annual precipitation level generally less than 490 mm. It belongs to a semi-arid climate, and insufficient water resources restrict the growth of herbaceous plants. The soil texture in some areas is poor, the water retention capacity is weak, the soil erosion problem is prominent, and the vegetation coverage rate is low. In addition, frequent human activities have also put great pressure on the ecological environment. In the future, measures such as artificial grass planting, setting up closed protection areas, and strengthening management and protection can be used to reduce the negative impact of human disturbance and gradually improve the suitability of grasslands. The moderately and highly suitable areas are mainly distributed in the transitional zone from the middle and lower reaches to the upper reaches, with human activities having an impact between the highly suitable areas and the unsuitable areas.
3.3. Potential Assessment of Forest and Grass Quality Improvement
The assessment of forest and grassland quality improvement potential should be based on the mapping relationship between forest/grass suitability and vegetation coverage. When the current vegetation coverage of an evaluation unit is below its threshold level, the unit is considered to have potential for quality improvement through human intervention or natural growth until reaching its vegetation coverage threshold. In evaluating forest and grassland quality improvement potential, Grades I, II, and III, respectively, indicate that the vegetation coverage of an evaluation unit can be upgraded by one, two, or three levels, with Grade I representing the smallest improvement potential, Grade II moderate, and Grade III the greatest. Different suitability levels correspond to distinct improvement potentials (Table 2). Regarding implementation difficulty within the same suitability zone: Grade I improvements are the easiest to achieve, Grade II moderately challenging, and Grade III the most difficult.
Table 2.
Grading criteria for forest and grassland quality improvement potential.
In existing forestlands, the quality improvable areas across suitability zones rank in descending order as high, moderately high, and moderate suitability (Table 3). The total improvable area spans 366 km2, accounting for 34.4% of the combined area of these three suitability zones. This demonstrates that after years of conservation management in the Yanhe River Basin, the overall growth status of forests in regions suitable for afforestation (moderate suitability zones and above) remains favorable, with most woodlands having reached coverage thresholds corresponding to their habitat conditions. Notably, the high suitability zone exhibits the largest improvable area and proportion relative to its total zone area, reaching 56.9%, indicating that approximately half of the forested areas in this most suitable region still possess enhancement potential. Regarding the spatial distribution of forest quality improvement potential (Figure 4a), areas requiring enhancement in the high suitability zone predominantly cluster in the southwestern and southeastern basins. Specifically, Grade I improvement areas are relatively evenly distributed across the entire zone, with two denser clusters in the southwest and southeast. Grades II and III improvements concentrate in the southern basin, where Grade III areas frequently adjoin Grade II zones. In contrast, improvement areas within moderately high and moderate suitability zones display a discrete distribution pattern without significant clustering characteristics.
Table 3.
Statistics on forest and grassland for improvable potential areas and their proportions.
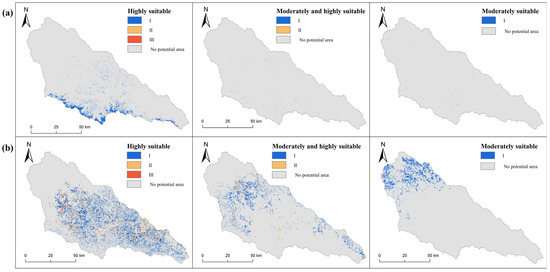
Figure 4.
Spatial distribution of forestland and grassland improvement potential. (a) Forest; (b) grass.
In existing grasslands, the quality improvable areas across suitability zones rank in descending order as high, moderately high, and moderate suitability (Table 3). The total improvable area spans 2491.6 km2, accounting for 59.4% of the combined area of these three suitability zones. This indicates that in regions suitable for grassland restoration (moderate suitability zones and above) within the Yanhe River Basin, the overall growth status of vegetation remains suboptimal, with over half of the areas yet to achieve coverage thresholds corresponding to their habitat conditions. Notably, the high suitability zone contains the largest absolute improvable area, representing approximately three-fifths of the total grassland requiring enhancement. Furthermore, the proportions of improvable areas relative to their respective suitability zones are highest in the high and moderately high suitability zones, reaching 74.7% and 50.9%, respectively. These findings suggest that achieving high and moderately high coverage levels in the basin’s grasslands remains challenging, primarily due to the vegetation’s vulnerability to precipitation variability and anthropogenic disturbances, which hinder natural progression to higher coverage thresholds. Consequently, substantial interventions and supportive measures may be required for grassland quality enhancement. Regarding the spatial distribution of grassland improvement potential (Figure 4b), Grade I potential areas in the high suitability zone are predominantly located farther from river channels, while Grades II and III cluster closer to these channels. Two dense clusters of Grades II and III occur in the northeastern and central-western basin, with Grade III areas frequently adjacent to Grade II zones. In moderately high suitability zones, Grade I potential areas mainly occupy mid-upper reaches of tributaries or sub-watersheds, whereas Grade II areas concentrate in mid-lower reaches. Improvement potential zones in moderate suitability areas are primarily distributed in the basin’s upper reaches.
Under current land use and vegetation growth conditions in the Yanhe River Basin, significant disparities exist in the quality improvement potential between forests and grasslands. The proportions of quality improvable areas relative to their total respective areas are 31.6% for forests and 56.2% for grasslands, with the grassland ratio being approximately 1.8 times that of forests. This indicates superior growth performance of existing forest compared to grassland, while grassland coverage retains substantial restoration potential. Forest quality improvable areas primarily focus on Grade I potential areas in high suitability zones (Table 3), where enhancement challenges are relatively minimal. These areas could predominantly employ low-intensity interventions centered on strengthened enclosure management and natural restoration to gradually expand high-coverage forest areas. For grasslands, the main improvable types include Grade I potential areas in highly suitable zones, along with Grade I and Grade II potential areas in moderately high and moderately suitable zones (Table 3). Given the weaker ecosystem stability and stress resistance of herbaceous vegetation compared to woody plants, improvement complexity escalates with increasing suitability levels. Moderate suitability zones may implement natural restoration through enhanced enclosure management (low-intensity measures). Conversely, high and moderately high suitability zones require integrated high-intensity interventions combining artificial grass planting, enclosure management, and seasonal maintenance. By implementing differentiated intervention intensities across suitability-based potential zones, comprehensive elevation of grassland coverage levels can be systematically achieved.
4. Discussion
A large number of research results [29,30,31] indicate that with the advancement of the Grain for Green project, the vegetation coverage in the region increases, and erosion intensity decreases. However, the negative environmental effects caused by unreasonable human-induced vegetation restoration actions are gradually becoming apparent [32]. Feng, Shao, et al. have found that irrational vegetation restoration may affect regional hydrological cycles, leading to soil water resource depletion, hindering vegetation growth and development [33,34]. For example, large-scale, high-density artificial vegetation restoration can increase soil water consumption, resulting in soil desiccation and even vegetation death [35,36]. Therefore, to ensure the sustainability of regional restoration and ecological governance, it is urgent to conduct suitability assessments of the current stage of forestry and grassland in the research area for precise allocation.
Our research findings indicate that elevation, annual precipitation, and soil phosphorus content are key factors influencing the suitability of forest distribution, consistent with previous studies on forest ecosystem dynamics [37]. These factors together determine the spatial heterogeneity of forest suitability, which has significant implications for sustainable ecosystem management in the region. The significant correlation between elevation and forest suitability aligns with Liu et al. [7] findings in analogous regions, who identified elevation as a major driver of natural forest distribution. However, our study also highlights that annual precipitation plays a crucial role at lower elevations, suggesting that water availability might be a limiting factor for forest growth in these areas. This difference likely reflects the specific hydrological and climatic conditions of our study area, as well as the potential influence of recent ecological restoration efforts.
The suitability of grassland is primarily influenced by soil water content, annual precipitation, and elevation, echoing Lai Wenhao et al. findings that soil moisture is a critical determinant of herbaceous biomass in semi-arid regions [9]. This alignment underscores the importance of water resource management in grassland restoration efforts, particularly in areas prone to soil desiccation and vegetation decline. Moreover, our results suggest that moderate precipitation zones (e.g., mid-elevation regions) may be optimal for grassland establishment, given their balanced water availability and temperature conditions. These findings provide some insights for grassland ecological restoration and management. For example, in arid or semi-arid regions, implementing measures to improve soil moisture content may help enhance grassland suitability, thereby increasing the stability and productivity of regional ecosystems. In summary, the results of this study may offer scientific support for landscape management, ecological restoration, land useoptimization, and regional sustainable development.
From the perspective of suitability distribution areas, highly suitable regions are mainly distributed in the southern and central parts of the watershed, with a few areas in the midstream meandering hilly and gully region of the main rivers. Moderately suitable regions are mainly distributed in the central and eastern parts of the watershed, located in the midstream meandering hilly and gully region of the main and tributary rivers, as well as the downstream fragmented original area. These areas are predominantly adjacent to regions with high or moderately high forest suitability. This aligns with on-site field surveys and evaluation data from Yan River sample plots, providing preliminary verification of the assessment methodology’s effectiveness. Compared to conventional qualitative analysis methods such as the Analytic Hierarchy Process (AHP), this study objectively evaluates the suitability of forests and grasslands based on the spatial heterogeneity of evaluation indicators and their spatial explanatory power for characterizing vegetation suitability attributes. The methodology systematically incorporates the spatial heterogeneity relationships between evaluation indicators and outcomes across all stages and components, minimizing bias while delivering a more precise spatial representation of suitability. Additionally, the use of geographical detectors allows for an in-depth exploration of the relationships between vegetation cover and environmental variables, thereby enhancing the robustness of the results [38]. This method is particularly valuable in complex and heterogeneous regions, such as our study area, where traditional qualitative methods may fail to capture the nuanced dynamics of ecosystem suitability.
Meanwhile, the accuracy of evaluating the suitability of forestry and grassland measures in this method is directly determined by data precision. Due to the limited availability of collectible shared data, as well as issues of data multi-sourcing and inconsistent accuracy, there may be some uncertainty in the precision of the results of this study. Nevertheless, this research employs geodetectors to explore the response relationships between FVC (fraction of vegetation cover) and various environmental indicators, which can, to some extent, reduce this uncertainty. In the future, collecting more on-site measurement data and homogeneous high-precision data will be essential for validating and improving this method.
Although our study emphasizes the role of environmental factors such as topography, climate, and soil in determining the suitability of forests and grasslands, it neglects the substantial influence of anthropogenic activities on ecosystem dynamics, including land-use conversion, agricultural practices, and urbanization. This omission of key human drivers—particularly grazing pressure and urban expansion—may inflate ecological suitability estimates in regions where observed vegetation degradation contradicts environmental potential. The observed grassland degradation in high-suitability zones (Figure 4b) cannot be fully explained by environmental constraints alone. Emerging research further reveals that rapid urban expansion and agricultural intensification can alter soil quality and hydrological conditions, thereby influencing vegetation suitability outcomes [39]. Future research should incorporate socioeconomic indicators, such as population density and economic development intensity, to better understand the interplay between human activities and ecosystem sustainability.
5. Conclusions
This study focuses on the Yanhe River Basin, a tributary in the middle reaches of the Yellow River, to establish a suitability evaluation index system and framework for forest and grassland ecosystems. It systematically evaluates the spatial patterns of habitat suitability and quality improvement potential for vegetation in the basin. The key conclusions are as follows:
- (1)
- The suitability of forest and grassland habitats exhibited significant differentiation characteristics in dominant factors and interaction mechanisms. The dominant factors influencing the suitable distribution of forests include PAR, soil total phosphorus content, annual precipitation, and elevation. Grassland suitability distribution was primarily governed by PAR, mean annual temperature, elevation, and annual precipitation.
- (2)
- The current spatial allocation of forests and grasslands in the basin is relatively rational, with similar optimization spaces. Improvable areas for both vegetation types showed positive correlations with suitability grades. Forest improvement is predominantly concentrated in highly suitable areas. However, the improvement potential in these regions was limited as vegetation coverage approached critical thresholds. Grasslands demonstrated greater overall optimization potential, with nearly half not yet reaching ideal coverage levels, necessitating targeted vegetation restoration measures.
- (3)
- Differentiated quality improvement pathways were proposed. The quality improvement pathways are differentiated as follows. For forest land improvement, the focus is on Grade I quality improvement potential in highly suitable areas, which has relatively low difficulty and can adopt enhancement models dominated by natural restoration, such as strengthened enclosure management and protection. For grassland improvement, zoning governance measures should be implemented: Grade I quality improvement potential in moderately suitable areas employs low-intervention measures centered on natural restoration, while Grade I and II quality improvement potential in high and moderately suitable areas should adopt high-intervention measures combining artificial grass planting, enclosure control, and critical period maintenance.
This research innovatively constructs a trinity analytical framework of “suitability diagnosis-potential assessment–improvement measures” for forest–grassland ecosystems on the Loess Plateau. The proposed spatially explicit assessment and quality improvement scheme provides a scientific basis and model references for ecological barrier construction and high-quality development in the region.
Author Contributions
Z.Y. and Z.L. developed the main ideas of the study. Z.Y. provided the dataset. Z.L. analyzed the data and wrote the first draft of the manuscript. Both authors contributed significantly to the final version of the study. Z.Y.: writing—original draft, visualization, methodology, investigation, funding acquisition, formal analysis, conceptualization. X.S.: writing—review and editing, supervision, resources, data curation, conceptualization. P.X.: conceptualization, methodology, writing—review and editing, resources. Z.L.: writing—review and editing. M.Y.: writing—review and editing. P.J.: writing—review and editing, resources. All authors have read and agreed to the published version of the manuscript.
Funding
This research was financially supported by the National Natural Science Foundation of China (U2243210), Henan Provincial Science and Technology Tackling Project (242102320252) and National Natural Science Foundation of China (42401384).
Data Availability Statement
The original contributions presented in this study are included in the article. Further inquiries can be directed to the corresponding author.
Acknowledgments
This research was made possible through the generous financial support of several key organizations, including the Henan Provincial Science and Technology Tackling Project and the National Natural Science Foundation of China. The authors would like to extend their heartfelt thanks to all individuals and organizations that contributed to the success of this study.
Conflicts of Interest
The authors declare no conflicts of interest.
Appendix A
Table A1.
Data product information.
Table A1.
Data product information.
| Dataset | Data Sources | Spatial Resolution (m) | Time |
|---|---|---|---|
| DEM | ALOS-12 m | 12.5 | 2014 |
| Slope gradient | ALOS-12 m | 12.5 | 2014 |
| Aspect | ALOS-12 m | 12.5 | 2014 |
| Slope length | ALOS-12 m | 12.5 | 2014 |
| Slope position | https://www.gscloud.cn/ | 90 | 2000 |
| Precipitation | http://loess.geodata.cn/ | 30 | 1960–2020 |
| Temperature | ERA5 | 1000 | 2000–2020 |
| FPAR | MOD15A2H | 500 | 2000–2020 |
| Soil nutrients | https://www.tpdc.ac.cn/ | 1000 | 2014 |
| Soil moisture | https://www.tpdc.ac.cn/ | 1000 | 2000–2020 |
| Soil type | https://www.resdc.cn/ | 1000 | 1995 |
| Soil texture | Harmonized World Soil Database (version 1.2) | 1000 | 2013 |
| Soil erosion intensity | Dynamic monitoring data of soil erosion | 10 | 2020 |
| Land use | GLC_FCS30 | 30 | 2020 |
| NDVI | MOD13Q1 | 250 | 2000–2020 |
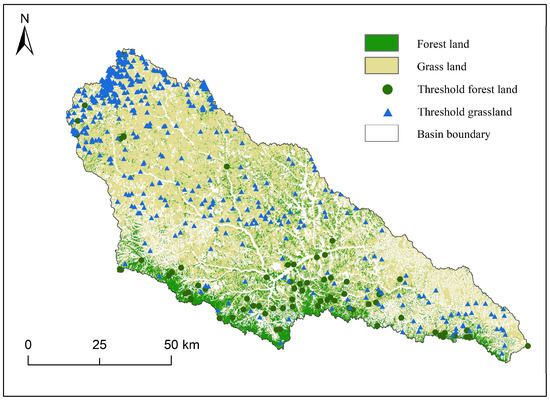
Figure A1.
Forest grassland and threshold unit distribution map.
Table A2.
Suitability evaluation index system of forest and grass.
Table A2.
Suitability evaluation index system of forest and grass.
| Objective Layer | Subject | Index Layer |
|---|---|---|
| Forest grass suitability | Terrain | Elevation T1 |
| Slope T2 | ||
| Aspect T3 | ||
| Slope length T4 | ||
| Slope positionT5 | ||
| Climate | Precipitation C1 | |
| Temperature C2 | ||
| FPAR C3 | ||
| Soil | Soil nutrient S1 | |
| Soil moisture S2 | ||
| Soil type S3 | ||
| Soil erosion intensity S4 | ||
| Soil texture S5 |
Table A3.
Grading standard and assignment of forest land suitability evaluation index.
Table A3.
Grading standard and assignment of forest land suitability evaluation index.
| Evaluation Index | 100 | 75 | 50 | 25 |
|---|---|---|---|---|
| Elevation (m) | 1200–1400 | 1000–1200 | >1400 | <1000 |
| Annual precipitation (mm) | >530 | 500–530 | 470–500 | <470 |
| Mean annual temperature (°C) | >10 | 8.5–10 | <8.5 | |
| FPAR (%) | >0.2 | 0.15–0.2 | <0.15 | |
| Total phosphorus (%) | >0.12 | 0.1–0.12 | <0.1 | |
| Total kalium (%) | >2 | 1.7–2 | <1.7 | |
| Organic content (%) | 0.8–1.1 | <0.8 | >1.1 | |
| Soil pH | >8.1 | 8–8.1 | <8 | |
| Soil humidity (m3/m3) | >0.26 | 0.25–0.26 | <0.25 |
Table A4.
Grading standard and assignment of grassland suitability evaluation index.
Table A4.
Grading standard and assignment of grassland suitability evaluation index.
| Evaluation Index | 100 | 75 | 50 | 25 |
|---|---|---|---|---|
| Elevation (m) | <1200 | 1200–1300 | 1300–1400 | >1400 |
| Annual precipitation (mm) | >530 | 510–530 | 490–510 | <490 |
| Mean annual temperature (°C) | >9.1 | 8.5–9.1 | <8.5 | |
| FPAR (%) | >0.19 | 0.16–0.19 | 0.13–0.16 | <0.13 |
| Total nitrogen (%) | >0.06 | <0.05 | 0.05–0.06 | |
| Total kalium (%) | 1.8–2.1 | <1.8 | >2.1 | |
| Organic content (%) | >0.9 | <0.8 | 0.8–0.9 | |
| Soil pH | 8–8.2 | <8 | >8.2 | |
| Soil humidity (m3/m3) | >0.26 | 0.25–0.26 | <0.25 | |
| Soil erosion intensity | Very weak, Weak | Medium | Intensive, Excessive, Serious | |
| Soil texture | Clay(light) | Loam | Loamy sand | Sandy loam |
Table A5.
Sub-region division of forest and grass FPAR index and test of significance.
Table A5.
Sub-region division of forest and grass FPAR index and test of significance.
| Forest Land | >0.19 | 0.16–0.19 | 0.13–0.16 | <0.13 |
|---|---|---|---|---|
| FPAR Space Sub-Region | ||||
| >0.19 | ||||
| 0.16–0.19 | Y | |||
| 0.13–0.16 | Y | Y | ||
| <0.13 | Y | Y | Y |
Y indicates that there is a significant difference in the distribution of forest and grass coverage between sub-regions (t-test with confidence of 95%).
Table A6.
Suitability evaluation index and weight of forest and grass.
Table A6.
Suitability evaluation index and weight of forest and grass.
| Evaluation Objective | Evaluation Index | Forest Land Index Weight | Grassland Index Weight |
|---|---|---|---|
| Forest grass suitability | Elevation | 0.1 | 0.17 |
| Annual precipitation | 0.14 | 0.16 | |
| Mean annual temperature | 0.09 | 0.22 | |
| FPAR | 0.24 | 0.24 | |
| Total nitrogen | - | 0.07 | |
| Total phosphorus | 0.15 | - | |
| Total kalium | 0.06 | 0.02 | |
| Organic content | 0.06 | 0.03 | |
| Soil pH | 0.1 | 0.04 | |
| Soil humidity | 0.06 | 0.02 | |
| Soil texture | - | 0.02 | |
| Soil erosion intensity | - | 0.01 |
Table A7.
The cutoff value of forest and grass suitability grade.
Table A7.
The cutoff value of forest and grass suitability grade.
| Suitability Grades | Boundary Value of Forest Land | Boundary Value of Grassland |
|---|---|---|
| unsuitable | <66 | <33 |
| moderately suitable | 66–77 | 33–57 |
| moderately and highly suitable | 77–80 | 57–69 |
| highly suitable | >80 | >63 |
References
- Liu, J.; Wen, Z.M.; Gang, C.C. Normalized difference vegetation index of different vegetation cover types and its responses to climate change in the Loess Plateau. Acta Ecol. Sin. 2020, 40, 678–691. [Google Scholar] [CrossRef]
- Wang, C.; Wang, S.; Fu, B.J.; Lü, Y.H.; Liu, Y.X.; Wu, X. Integrating Vegetation Suitability in Sustainable Revegetation for the Loess Plateau, China. Sci. Total Environ. 2021, 759, 143572. [Google Scholar] [CrossRef] [PubMed]
- Shao, M.A.; Jia, X.X.; Wang, Y.Q.; Zhu, Y.J. A review of studies on dried soil layers in the Loess Plateau. Adv. Earth Sci. 2016, 31, 14–22. [Google Scholar]
- Tang, K.L. Discussion on key problems of ecological environment construction in Loess Plateau. Bull. Soil Water Conserv. 1998, 18, 2–8. [Google Scholar]
- Zhang, W.H.; Liu, G.B. Countermeasures and strategy to vegetation rehabilitation in Loess Plateau, China. Sci. Soil Water Conserv. 2009, 7, 114–118. [Google Scholar]
- Gao, J.L.; Gao, Y.; Ma, H.B.; Dang, S.M. Study on characteristics of soil and water loss control in Loess Plateau in recent 70 years. Yellow River 2019, 41, 65–69. [Google Scholar]
- Liu, D.; Li, Y.T.; Hong, L.X.; Guo, H.; Xie, Y.S.; Zhang, Z.L.; Lei, X.D.; Tang, S.Z. The suitability of potential geographic distribution of natural forest types in Jilin Province based on maximum entropy models. Sci. Silvae Sin. 2018, 54, 1–15. [Google Scholar] [CrossRef]
- Yu, D.; Xie, P.; Dong, X.H.; Su, B.; Hu, X.N.; Wang, K.; Xu, S.J. The Development of Land Use Planning Scenarios Based on Land Suitability and Its Influences on Eco-Hydrological Responses in the Upstream of the Huaihe River Basin. Ecol. Modell. 2018, 373, 53–67. [Google Scholar] [CrossRef]
- Lai, W.H.; Xi, Q.; Wu, H.L.; Cui, Y.Y.; Zhao, T.N. Site classification type and vegetation suitability evaluation for hilly land in Xinghe, Inner Mongolia. J. Zhejiang AF Univ. 2018, 35, 331–339. [Google Scholar] [CrossRef]
- Yang, Y.; Liu, Y.X.; Jin, P.W.; Xiang, J.P.; Xie, Y. Benefit evaluation on soil and water conservation practices: A case study on Rongleihe Watershed in Guizhou Province. Sci. Soil Water Conserv. 2015, 13, 64–71. [Google Scholar]
- Dai, F.Q.; Liu, G.C. Suitability evaluation of typical soil and water conservation measures in hilly areas of purple Soil. Sci. Soil Water Conserv. 2011, 9, 23–30. [Google Scholar]
- Li, Q.; Nie, X.F.; Xie, S.H.; Hu, Q.W.; Mo, M.H. Suitability evaluation of comprehensive control model of soil and water loss in southern Jiangxi Province based on the balance of ecological and production functions. Res. Soil Water Conserv. 2022, 29, 54–61. [Google Scholar]
- Zhang, Q.L.; Li, Z.B.; Wang, X. Suitability evaluation of key soil and water conservation projects in Dan-Han River watershed of Shaanxi Province. J. Northwest A F Univ. 2014, 42, 225–234. [Google Scholar]
- Gu, J.H. Assessment on Comprehensive Benefits of Soil and Water Conservation at Small Watersheds in the Rocky Desertification Region, Guangxi; Beijing Forestry University: Beijing, China, 2016. [Google Scholar]
- Jin, G.; Wang, Z.Q.; Hu, X.D.; Hu, S.G.; Zhang, D.J. Land suitability evaluation in Qinghai-Tibet Plateau based on fuzzy weight of evidence model. Trans. Chin. Soc. Agric. Eng. 2013, 29, 241–250. [Google Scholar] [CrossRef]
- Chen, X.L.; Xu, W.M.; Xiao, G.R. Suitability evaluation of soil and water conservation measures in Changting County based on fuzzy weight-of-evidence model. J. Yangtze River Sci. Res. Inst. 2017, 34, 33–38. [Google Scholar]
- Liu, G.C.; Dai, F.Q.; Nan, L.; Du, S.H. Assessing the suitability of soil and water conservation practices in Southwestern China. Land Use Policy 2013, 30, 319–327. [Google Scholar] [CrossRef]
- Zhai, H.M.; Zhang, Z.Y.; Yan, W.; Zhou, Z.Y.; Cheng, Q.X.; Zhang, Q. Land suitability evaluation of Xinyang tea planting area based on GIS and principal component analysis. J. Xinyang Norm. Univ. (Nat. Sci. Ed.) 2022, 35, 56–62. [Google Scholar] [CrossRef]
- Yang, T.; Wang, X.R. Evaluation of the Plant Landscape Suitability in Mountain Parks Based on Principal Component Analysis: A Case Study of Guiyang City. Agron. J. 2021, 113, 760–773. [Google Scholar] [CrossRef]
- Zhang, M. Evalution on Forestry Suitability of Resource in the Basin of Northwest Hebei Mountains on GIS; Hebei Normal University: Shijiazhuang, China, 2006. [Google Scholar]
- Wang, Z.Z.; Zhang, L.W.; Li, X.P.; Wang, P.T.; Li, Y.J.; Lü, Y.H.; Yan, J.P. The spatial-temporal pattern of hotspots and coldspots of ecosystem services at the watershed scale. Acta Ecol. Sin. 2019, 39, 823–834. [Google Scholar] [CrossRef]
- Li, J.; Zhou, Z.X. Landscape pattern and hydrological processes in Yanhe River basin of China. Acte Geogr. Sin. 2014, 69, 933–944. [Google Scholar] [CrossRef]
- Liu, Y.T.; Wang, L.; Li, X.H.; Guo, L. Analysis on spatio-temporal variability of fractional vegetation cover and influencing factors from 2000 to 2020 in southwestern China. Plateau Meteorol. 2024, 43, 264–276. [Google Scholar] [CrossRef]
- Zhao, H.F.; Cao, X.Y. Vegetation cover changes and its climate driving in three-river-source National Park. Plateau Meteorol. 2022, 41, 328–337. [Google Scholar] [CrossRef]
- Zhang, X.; Liu, L.Y.; Chen, X.D.; Gao, Y.; Xie, S.; Mi, J. GLC_FCS30: Global land-cover product with fine classification system at 30 m using time-series Landsat imagery. Earth Syst. Sci. Data 2021, 13, 2753–2776. [Google Scholar] [CrossRef]
- Liu, X.Y.; Yang, S.T.; Wang, F.G.; He, X.Z.; Ma, H.B.; Luo, Y. Analysis on sediment yield reduced by current terrace and shrubs-herbs-arbor vegetation in the Loess Plateau. J. Hydraul. Eng. 2014, 45, 1293–1300. [Google Scholar] [CrossRef]
- Guo, J.X.; Sang, H.Y.; Zhai, L. Spatiotemporal variations and driving factors of vegetation coverage on the Qinghai-Tibet Plateau. Chin. J. Ecol. 2023, 42, 2665–2674. [Google Scholar] [CrossRef]
- Chen, S.R.; Hu, P.; Hu, J.W.; Yang, H.B. Research and development of one grain yield map generating system. Trans. Chin. Soc. Agric. Eng. 2008, 24, 182–184. [Google Scholar]
- Liao, J.H.; Xu, J.X.; Yang, Y.H. Study of the spatial differentiation of hyperconcentrated flows frequency in the Loess Plateau. Adv. Water Sci. 2008, 19, 160–170. [Google Scholar]
- Zhang, J.J.; Zhang, X.P.; Li, R.; Chen, L.L.; Lin, P.F. Did streamflow or suspended sediment concentration changes reduce sediment load in the middle reaches of the Yellow River. J. Hydrol. 2017, 546, 357–369. [Google Scholar] [CrossRef]
- Huang, T.T.; Shi, Y.Z.; Cao, Q.; Wang, L.J.; Yang, Y.; Liu, B.Y. Soil erosion evaluation of Liudaogou catchment in the Loess Plateau during the past 30 years. Sci. Soil Water Conserv. 2020, 18, 8–17. [Google Scholar] [CrossRef]
- Han, L.; Cao, X.X.; Zhu, H.L.; Chen, R.; Zhao, Y.H.; Liu, Z.; Zhao, Z.L.; Chang, Y.Q.; Yang, M.L.; Gao, Y.F. Change of vegetation coverage and driving factor in the North Shaanxi Loess Plateau based on characteristic zoning. Acta Ecol. Sin. 2023, 43, 8564–8577. [Google Scholar]
- Feng, X.M.; Fu, B.J.; Piao, S.L.; Wang, S.; Ciais, P.; Zeng, Z.Z.; Lü, Y.; Zeng, Y.; Li, Y.; Jiang, X.H.; et al. Revegetation in China’s Loess Plateau is approaching sustainable water resource limits. Nat. Clim. Change 2016, 6, 1019–1022. [Google Scholar] [CrossRef]
- Shao, R.; Zhang, B.Q.; Su, T.X.; Long, B.; Cheng, L.Y.; Xue, Y.Y.; Yang, W.J. Estimating the increase in regional evaporative water consumption as a result of vegetation restoration over the Loess Plateau, China. J. Geophys. Res. Atmos. 2019, 124, 11783–11802. [Google Scholar] [CrossRef]
- Zhang, B.Q.; Shao, R.; Zhao, X.N.; Wu, P.T. Effects of large-scale vegetation restoration on eco-hydrological processes over the Loess Plateau, China. J. Basic. Sci. Eng. 2020, 28, 594–606. [Google Scholar]
- Wang, Y.Q.; Shao, M.A.; Shao, H.B. A preliminary investigation of the dynamic characteristics of dried soil layers on the Loess Plateau of China. J. Hydrol. 2010, 381, 9–17. [Google Scholar] [CrossRef]
- Li, Y. Evaluation on Forestry Suitability in the Horqin Sandy Land-A Case Study in Horqinzuoyihouqi Banner. Res. Soil Water Conserv. 2011, 18, 236–239. [Google Scholar]
- Wang, J.F.; Xu, C.D. Geodetector: Principle and prospective. Acta Geogr. Sin. 2017, 72, 116–134. [Google Scholar] [CrossRef]
- Zhao, Y.; Liu, Z.; Wu, J. Grassland ecosystem services: A systematic review of research advances and future directions. Landsc. Ecol. 2020, 35, 793–814. [Google Scholar] [CrossRef]
Disclaimer/Publisher’s Note: The statements, opinions and data contained in all publications are solely those of the individual author(s) and contributor(s) and not of MDPI and/or the editor(s). MDPI and/or the editor(s) disclaim responsibility for any injury to people or property resulting from any ideas, methods, instructions or products referred to in the content. |
© 2025 by the authors. Licensee MDPI, Basel, Switzerland. This article is an open access article distributed under the terms and conditions of the Creative Commons Attribution (CC BY) license (https://creativecommons.org/licenses/by/4.0/).