Abstract
Urban ecological resilience (UER) is vital for sustainable development, enabling cities to maintain stability in the face of environmental challenges. This study combined landscape pattern indices and spatial measurement methods, establishing a multi-scale linked “Resistance-Adaptation-Recovery (Res-Ad-Rec)” model chain to assess the UER of Xuzhou City, analyzed spatiotemporal changes using Moran’s I indices, and explored the influencing factors through the Multi-scale Geographically Weighted Regression (MGWR) model. Finally, the research framework of “three-dimensional assessment, spatial diagnosis, and mechanism analysis” was constructed to achieve a multi-dimensional dynamic analysis. The results showed the following: (1) UER declined from 2008 to 2022, with low-value areas expanding from the city center and high-value areas near water bodies. (2) The spatial autocorrelation of UER was significant, with a rise in Global Moran’s I index and the strongest spatial agglomeration effect observed in 2022. High–high and low–low clustering were the main characteristics of local spatial autocorrelation. (3) Population density and nighttime lighting intensity were major factors influencing the spatial distribution of UER in Xuzhou City. The findings can provide a useful reference for similar resource transition cities to explore the path of sustainable development.
1. Introduction
The city functions as a complex ecosystem, comprising three interconnected subsystems: social, economic, and natural. Its composite ecology is increasingly challenged by unknown risks and uncertainties, stemming from ongoing industrialization and urbanization processes [1]. In this context, urban ecosystems are facing unprecedented pressures and challenges, including biodiversity loss, increasing environmental pollution, and more frequent natural disasters. The simple natural recovery capacity and immunity of ecosystems can no longer withstand the growing ecological pressures [2]. Therefore, the primary goal of urban governance must shift from minimizing vulnerability to enhancing resilience [3]. Enhancing urban ecological resilience (UER) is critical for improving the ability of complex urban ecosystems to withstand and recover from external pressures [4,5,6,7].
The study of UER not only deepens our understanding of the internal operation mechanism of urban ecosystems, but also provides a theoretical foundation for formulating effective ecological conservation and management strategies, demonstrating both urgent scientific importance and practical significance. However, previous theoretical studies on UER have largely remained under the macro framework of urban resilience, frequently regarding it as simply a component of the broader urban resilience concept instead of an independent research field worthy of in-depth exploration. This approach has, to some extent, failed to adequately address the uniqueness and complexity of UER itself and its critical role in sustainable urban development.
Resilio, which means “to return to the original state” in Latin, is where the word “resilience” comes from. The concept was initially proposed within the field of ecology by Holling in 1973, who defined it as “the capacity of a system or an individual to return to its pre-disturbance state after suffering unknown shocks and disturbances” [8]. In 2002, the Institute for Local Sustainability coined the term “urban resilience” to characterize the state of development in cities, aiming to promote sustainable urban growth. The idea of urban resilience has since been further refined and developed, and a large number of studies on UER, urban economic resilience, urban social resilience, urban ecological resilience, and urban institutional resilience have emerged. Ecological security is essential for maintaining the stability and functionality of ecosystems [9]. As a key aspect of urban resilience, UER is gradually gaining attention in the academic community [10]. UER might be considered the manifestation of urban resilience in the ecology, so its concept and connotations can be understood and interpreted through the more comprehensive urban resilience framework. In 2016, the New Urban Agenda defined UER as urban ecosystems’ ability to bounce back from and adaptively learn from the disruptions they encounter.
Research on UER is still in its early stages, but existing research focuses on three main areas. (1) Conceptual research: The definition of UER lacks uniformity [11], with scholars primarily interpreting it through two distinct theoretical frameworks: the equilibrium perspective and the evolutionary perspective. UER from an equilibrium perspective referred to the ability of urban ecosystems to avoid, react to, and recover from risky disturbances [12,13]. Under the evolutionary perspective, scholars placed less emphasis on the capacity to rebound and more on the capacity of urban ecosystems to achieve transformational development by restructuring and changing pathways [14,15,16]. (2) Measurement and evaluation research: Most scholars have established evaluation index systems based on comprehensive statistical data [17,18], remote sensing data [19,20] or ecological characteristic data [21,22]. Typical approaches for evaluating UER included “Pressure-State-Response” model [23,24,25], “Driving forces-Pressure-State-Impact-Response” model [26,27], “Resistance-Adaptation-Recovery” model [28,29,30,31], “Resistance-Response-Transformation” model [32], “Potential-Connectivity-Resilience” model [33], “Scale-Density-Morphology” model [34], and so on. (3) Influencing factors and dynamic correlations research: The issue of UER’s impacting variables is intricate and multifaceted. Numerous factors continue to exert pressure on urban ecosystems, while most scholarly investigations have predominantly analyzed the influencing factors of UER from both a natural and socioeconomic standpoint [35,36,37,38,39,40]. This is because natural conditions, such as climate, topography and land cover, lay the foundation of urban ecology, while socio-economic factors, including the level of industrial structure, infrastructure development, economic growth, and governmental policies, determine the city’s capacity to adjust to and bounce back from external pressures and changes, which work together to influence UER. Additionally, a number of scholars have concentrated on the dynamic interplay between UER and other factors [34,41]. Economic development [16,42], land use intensity [20], urbanization [43,44], greening policies [45], climate change [46,47], flooding [48,49], and bird biodiversity [50] in relation to UER have often been explored from a coupling perspective, with the correlates primarily being the corresponding indicators of ecological driving or blocking effects.
In summary, previous studies on UER primarily relied on statistical data, remote sensing data, or ecological characteristics for evaluation. Although the use of statistical data for evaluation can provide a clear quantitative analysis that can reflect national or regional trend differences on a macro scale, its limitation is that the coverage of the study region is relatively narrow, with the smallest scale of the study often reaching only the district or county level. Evaluation methods based on ecological characteristics, on the other hand, although they can directly respond to the ecological attributes of urban systems, often suffer from the problems of single-indicator characterization and relativity [21]. In contrast, UER assessment from remote sensing data in conjunction with land use offers a broader research perspective [51]. Its wide coverage, real-time data acquisition, and ability to observe over multiple time periods [52] not only comprehensively reflect the complex results of land disturbance by human activities and natural changes, but it can also visually depict the broad repercussions of human action on the ecosystem through alterations in land-use types.
Building upon previous studies, this study started from the mechanism of UER, which was defined as the ability of urban ecosystems to resist before responding to external disturbances, to adapt when disturbances occur, and to recover after disturbances. Land use data were obtained from remote sensing images, and a three-dimensional UER assessment framework was developed based on the Resistance–Adaptation–Recovery (Res-Ad-Rec) model chain. The framework evaluated resistance by calculating the value of ecosystem services, assessed adaptation using landscape stability indices, and quantified recovery through ecological elasticity indices, thus achieving a multidimensional UER assessment. The framework decomposed UER into three interrelated and complementary temporal phases (including pre-disturbance resistance, mid-disturbance adaptation, and post-disturbance recovery), demonstrating that this approach more accurately captured the dynamic process compared to a single indicator or static model. In addition, the assessment framework based on remote sensing data effectively addressed the problem of the lack of statistical data for certain indicators [53], and provided a valuable perspective for overcoming the limitations of administrative boundaries and revealing the spatial differentiation of UER at the small and micro scales.
This study also conducted spatial autocorrelation analysis using Global and Local Moran’s I to analyze the spatial and temporal patterns of UER. Although various methods exist to analyze the factors influencing UER, the application of the multiscale geographically weighted regression (MGWR) model in exploring these dynamics remains underexplored. The MGWR model captures the heterogeneity of spatial relationships more accurately and reveals the roles of different variables at different scales through adaptive bandwidth optimization. Therefore, the use of MGWR model in this study to identify key factors affecting UER provided new insights into the geographical phenomena of UER at different scales.
Based on the above methodological framework, this study selected Xuzhou City as a typical empirical case. As a representative example of ecological challenges in the transformation of resource-based cities, Xuzhou City held triple research value. Geographically, the urban area of Xuzhou City was relatively low-lying, and its drainage infrastructure was underdeveloped, which made it highly prone to waterlogging during the rainy season. In terms of regional characteristics, the city faced ecological vulnerability and unstable landscape patterns due to large areas of abandoned quarry pits and coal subsidence zones left over from its industrial history. From the perspective of development stage, Xuzhou City was undergoing a new phase of deep transformation driven by national strategies such as the Belt and Road Initiative and the Yangtze River Delta integration. Its dual identity as both a traditional industrial base and a modern policy hub made it a key case for studying the dynamics of UER in transforming cities. Selecting Xuzhou City as the study area not only helped uncover the patterns of change in UER during the urbanization process of resource-transition cities, but also provided valuable insights for ecological protection and management in other similar cities. The main research framework of this study is shown in Figure 1.
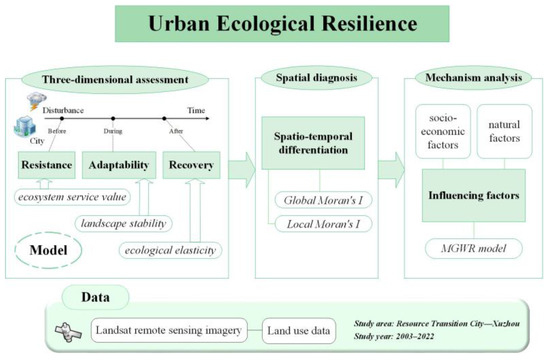
Figure 1.
The research framework.
2. Materials and Methods
2.1. Study Area
As shown in Figure 2, strategically situated in northwestern Jiangsu Province (33°43′–34°58′ N, 116°22′–118°40′ E), Xuzhou City ranks as Jiangsu’s second-largest city and serves as a pivotal economic hub in the Yangtze River Delta’s northern periphery. This regional powerhouse demonstrates exceptional agglomeration capacity and radiating influence, functioning as a vital growth engine that drives development across the Huaihai Economic Zone and surrounding areas [51]. Administratively structured as of 2024, Xuzhou City’s jurisdictional framework comprises 5 municipal districts, 3 counties, and 2 county-administered cities. The territorial composition includes: (1) Municipal districts: Gulou District (GL), Yunlong District (YL), Jiawang District (JW), Quanshan District (QSH), Tongshan District (TSH); (2) County-level administrative units: Fengxian County (FX), Peixian County (PX), Suining County (SN); (3) County-administered cities: Xinyi City (XY), Pizhou City (PZH). This administrative configuration spans 11,765 km2, positioning Xuzhou City as the second-largest prefecture-level city in Jiangsu Province by land area.
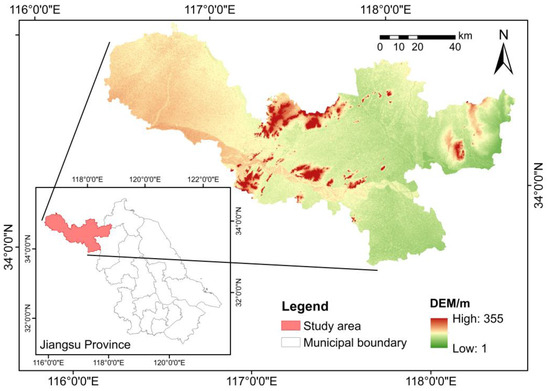
Figure 2.
Location of the study area.
The geography of Xuzhou City is predominantly plain, with over 90% of the city’s area consisting of flat land. While small mountain ranges and scattered hills are mostly found in the center and eastern areas, the general topography gradually slopes from northwest to southeast. Four distinct seasons, plenty of light, moderate rainfall, and simultaneous rain and heat are all features of the region’s temperate monsoon climate. The territory is crisscrossed with rivers, lakes and reservoirs, with the Abandoned Yellow River, which runs diagonally through the east and west. The Beijing-Hangzhou Grand Canal flows through the north and south, while the Yihe River, the Shuhe River, and Luoma Lake are located in the east. To the west are Dasha River and Weishan Lake.
Xuzhou City is currently experiencing a strategic convergence of development opportunities from the Belt and Road Initiative, Yangtze River Delta regional integration, and its pivotal role in the Huaihai Economic Zone’s central city development. While undergoing a critical phase characterized by comprehensive industrial transformation and accelerated economic restructuring, the municipality faces persistent ecological challenges that represent significant constraints on urban sustainability. Because of the consequences of industrial restructuring and fast urbanization, Xuzhou City, a resource-oriented city and national old industrial base, is facing ecological challenges such as pollutant emissions, coal mining subsidence, a fragile natural ecosystem, and vulnerability to changes in land use. These ecological and environmental issues during the urban development process have become the primary obstacle preventing Xuzhou City from developing sustainably. As a result, it is critical to investigate Xuzhou City’s UER, and enhancing its UER level can not only enhance the city’s sustainable growth [54,55], but also act as a benchmark for the sustainable growth of other transition cities.
2.2. Methods
2.2.1. Assessment Modeling of UER
Three components were used in this study to develop the UER “Res-Ad-Rec” evaluation model: resistance, adaptation and recovery [28].
(1) The ability of urban ecosystems to withstand external shocks prior to responding to them is referred to as resistance. The relationship between ecosystem services and ecosystem resistance is intimate [56,57,58]. These services function as natural barriers, shielding cities from the threats posed by extreme climate events. Therefore, this study quantified ecosystem service value to characterize resistance.
Drawing from Xie et al.’s study [59], the standard equivalent factor is defined as 1/7 of the national economic value of grain per unit area. It is assumed that the intensity of ecological service function is linearly related to biomass, and the biomass factor for proposing the value of ecological services is corrected regionally with reference to Xie Gao Di et al. [60]. Subsequently, the ecosystem service value per unit area for each land use type in Xuzhou City was calculated by multiplying the corresponding values of these land use types by the value of a single equivalent factor [61]. The following is the final resistance capacity formula for Xuzhou City:
where ESV is the ecosystem service value; is the type i land area in the research region; and is the fth ecosystem value coefficient of type i in the research region.
(2) The ability of urban ecosystems to adjust to external disruptions is known as adaptation. Complex ecosystems can maintain a relatively stable state in the face of natural disasters and exhibit a stronger adaptive capacity, so the landscape stability model was constructed to characterize the adaptive capacity by utilizing landscape stability indices.
Landscape indices effectively condense landscape pattern information and can accurately depict the structural makeup and spatial arrangement of the landscape [62,63]. Nine commonly used landscape pattern indices—PD, LSI, PAFRAC, DIVISION, TECI, SHDI, AI, CONTAG, and COHESION—were selected.
For the selected landscape pattern indices, it is necessary to consider whether they are favorable or unfavorable to landscape pattern stability [64].
After the selected indicators were dimensionless with positive and negative indicators, the landscape pattern stability evaluation analysis was carried out. The formula is [65]:
where is the value of the dimensionless standardized indicator; is the value of the original indicator; is the maximum value of the original indicator; is the minimum value of the original indicator.
The main component analysis was used to determine each index’s weight values () [66]:
where m represents the number of primary components and is the principal component j contribution rate. The weights were calculated from the variance contribution of each principal component, and the ecological landscape pattern stability evaluation model was established [67]:
where is the landscape stability index and is the dimensionless value of the stability evaluation landscape index.
(3) The ability of urban ecosystems to bounce back from outside shocks is known as recovery. When urban systems are exposed to anthropogenic disturbances or natural disaster shocks [68], land-use types near natural ecosystems exhibit higher recovery capacity, whereas human-dominated built-up land-use types demonstrate lower recovery capacity. Ecological recovery capacity serves as a metric to gauge the extent to which urban ecosystems can rebound from hazards [28]. Ecological elasticity models have been widely applied to describe recovery, as land-use types that are close to natural ecosystems have a higher chance of recovering from disturbances brought on by natural disasters or human activity, whereas built-up terrain types that are dominated by humans are less capable of recovering from external pressures.
In accordance with Peng’s ecological elasticity model and coefficients [69], by adapting it to the real circumstances in the research region, the ecosystem’s recovery was assessed using the following formula:
where is the type k land area in the research region; is the ecological elasticity coefficient of the kth land use type.
Ultimately, due to the huge difference in the unit and value range of different indicators, in order to avoid that the indicators with larger values will dominate the results in the comprehensive calculation, it is necessary to standardize the resistance, adaptation, and recovery, and map the original values to the [0, 1] interval, to ensure that all the indicators are in the same scale, so as to make them comparable and balanced contribution in the comprehensive evaluation. The min-max standardization formula is as follows:
where is the standardized value of the indicator, is the actual value of the indicator, and and are the minimum and maximum values of the indicator, respectively.
Finally, the UER of Xuzhou City was calculated by the Res-Ad-Rec model with the following formula:
where Res, Ad, and Rec are standardized resistance, adaptation, and recovery indicators, respectively.
2.2.2. Spatial Autocorrelation
The spatial autocorrelation of UER should be taken into consideration because it is intimately linked to coordinated regional development. Global spatial autocorrelation measures the overall degree of spatial autocorrelation within a study area, while local spatial autocorrelation analyzes the extent of spatial dependence among neighboring regions and identifies clusters of high and low values at localized spatial positions [70].
The calculation of the Global Moran’s I index is performed as follows [71]:
The calculation of the local Moran’s I index is performed as follows [72]:
where and are the UER of the ith and jth spatial regions, n represents the number of regions, and is the mean value of UER of all spatial regions. denotes the spatial weight matrix between regions, . Positive values imply positive regional correlation, whereas negative values show negative regional correlation. The range of the global Moran index is −1 to 1. A clustering diagram of local indicators of spatial association (LISA diagram) can be produced by spatially clustering the local Moran’s index.
2.2.3. Multi-Scale Geographically Weighted Regression Models
An improvement on the linear regression model, the Geographically Weighted Regression (GWR) model prevents mistakes brought on by spatial differences in the variables and offers a clear explanation of the local spatial relationship and spatial heterogeneity of the variables by generating a local regression equation at each point in the spatial range [73]. The MGWR model enhances the GWR model by selecting different bandwidth values for various variables, which raises the regression model’s accuracy even more. The MGWR model’s precise calculating process is as follows [74]:
where represents the regression coefficient of the jth independent variable at spatial location i of the bandwidth bwj fit; and denote the dependent and independent variables’ observed values at point i, respectively; represents a constant term at this spatial location point; and represents a random error.
2.3. Data Sources
In this study, Landsat series remote sensing images in four periods, 2008, 2013, 2018 and 2022, were used as the research base data. The selected Landsat remote sensing images were pre-processed by radiometric calibration, atmospheric correction, mosaic cropping, etc. Then, they were combined with visual interpretation for supervised classification, resulting in five categories: cropland, forest, grassland, water, and impervious surfaces. The accuracy assessment revealed that the Kappa Coefficient and Overall Accuracy of the classification exceeded 80%, which is in line with the requirements of the classification. In Table 1, specific data sources are displayed:

Table 1.
Data sources.
3. Results
3.1. Temporal-Spatial Variation Characteristics of UER
As shown in Figure 3, in terms of time, the UER in Xuzhou City generally showed a decreasing trend between 2008 and 2022. Specifically, the mean value reached 0.23753 in 2008, while in 2022, this value had declined to 0.21868, representing a decrease of 7.93%. The median, on the other hand, exhibited a comparable declining tendency, dropping 9.51% from 0.23372 in 2008 to 0.21149 in 2022. This figure unequivocally demonstrated that Xuzhou City’s UER was progressively declining over this time frame.
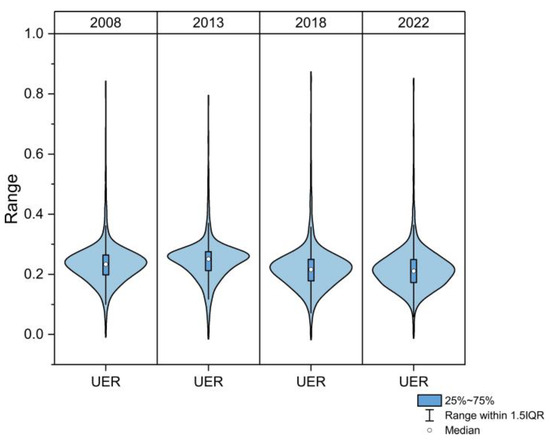
Figure 3.
Grid-scale UER violin map of Xuzhou City from 2008 to 2022.
This decline in UER can be attributed to several factors. During this period, as a resource-dependent city in transition, Xuzhou City experienced rapid industrial restructuring and accelerated urbanization. The expansion of urban areas led to more changes in land use patterns, such as the transformation of natural landscapes into built-up areas, which likely disrupted the local ecological balance and reduced the city’s ability to withstand, adapt to, and recover from ecological disturbances. At the same time, environmental impacts from long-term resource extraction (especially coal mining) continue to erode the adaptive potential of ecosystems through mechanisms such as ground subsidence and soil degradation. In addition, the frequency of extreme weather events and the possible lag in the implementation of ecological restoration policies combine to affect the resilience of the system. These findings reveal the complex challenges faced by resource-based cities in rapid transition, and emphasize the need for integrated strategies to address both historical environmental burdens and contemporary development pressures in order to effectively enhance UER.
As shown in Figure 4, low-resilience areas expanded outward from the city center, while high-resilience areas were primarily concentrated around large water bodies such as rivers and lakes. A defining characteristic of urban development was the city’s outward expansion in concentric circles. As the city grows, it inevitably encroaches upon surrounding environments and resources, converting natural land cover—such as cultivated land, forests, and wetlands—into urban construction land. This transformation increases pressure on ecosystems, weakening their self-regulation and recovery capacity, and ultimately negatively impacting UER.
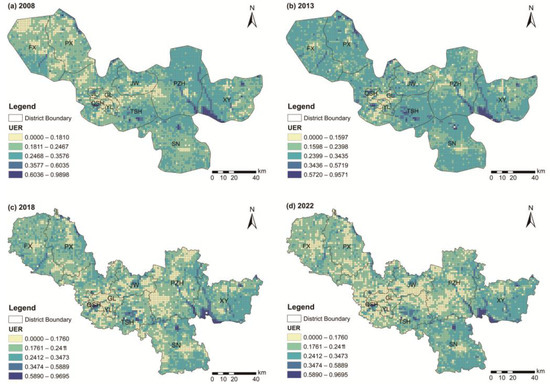
Figure 4.
Distribution of UER from 2008 to 2022 of Xuzhou City.
Xuzhou City features a distinctive hydrological pattern known as “nine rivers encircling the city with seven lakes in Pengcheng (the ancient name of Xuzhou City)”. As illustrated in Figure 4, the UER remained consistently high in recent years across three major water systems—the Abandoned Yellow River system, Yi-Shu-Si Basin, and Sui-An River system—along with their adjacent areas. The high resilience of the areas surrounding water bodies reflects the importance of protecting and enhancing urban blue spaces for UER. These water bodies act as natural buffers against environmental disturbances, provide a wide range of ecological services and support urban sustainability. Protecting riparian zones and restoring degraded waterbodies can further enhance the resilience of these areas and contribute to the creation of more resilient urban ecosystems. Additionally, these waters have demonstrated a unique resistance to anthropogenic disturbances by maintaining UER stabilization in the face of high-intensity urban sprawl.
Overall, this spatial differentiation provides a double lesson for urban planning: while concentric circles of urban growth continue to erode the surrounding ecosystems, stable and highly resilient zones around water bodies provide natural anchors for building ecological networks. Strategically protecting and connecting these aquatic nodes could be the backbone of Xuzhou City’s future green development.
3.2. Spatial Autocorrelation Characteristics of UER
3.2.1. Global Autocorrelation Feature
To determine the global autocorrelation of UER in Xuzhou City, the Global Moran’s I index was computed. All of the Global Moran’s I indexes were greater than zero, suggesting that Xuzhou City’s UER had strong spatial autocorrelation and that there was a spatial characteristic of low values surrounding the low value area and high values surrounding the high value area. Table 2 shows that the Global Moran’s I index increased overall between 2008 and 2022, with the spatial convergence and agglomeration tendency of UER being most noticeable in 2022.
Table 2.
Global Moran’s Index from 2008 to 2022.
This enhanced spatial dependence may stem from the interconnected urban development process, whereby the initial agglomeration pattern generates a self-reinforcing cycle. It suggests that highly resilient zones around water bodies benefit from ecological spillovers that enhance the surrounding area, while heat islands and pollution generated by degraded urban cores further reduce the surrounding UER. These dynamics suggest that Xuzhou City is developing an increasingly divergent ecological spatial pattern, with resilient natural areas increasingly isolated from degraded UER spaces. This trend highlights the urgency of reconnecting fragmented habitats and breaking negative spatial feedback loops through strategic ecological corridors.
3.2.2. Local Autocorrelation Feature
A local spatial autocorrelation analysis of UER in Xuzhou City for the years 2008, 2013, 2018, and 2022 was carried out, as seen in Figure 5. Overall, UER in Xuzhou City was primarily characterized by High-High (H-H) and Low-Low (L-L) clustering. In contrast, high–low (H-L) and low–high (L-H) clustering zones were more sporadically distributed and cover a smaller region.
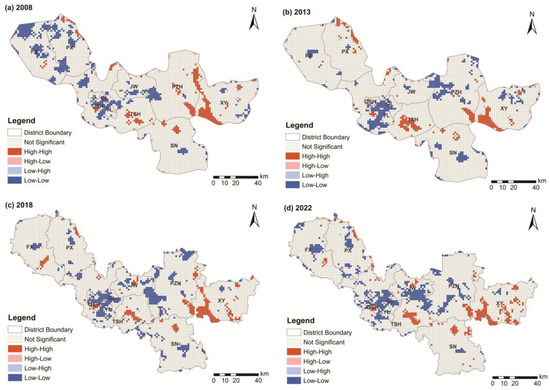
Figure 5.
LISA Map of UER from 2008 to 2022 of Xuzhou City.
From 2008 to 2022, the H-H agglomeration areas were largely steady, primarily concentrated in southeastern Xuzhou City, including Luoma Lake and its surrounding areas, Pan’an Lake National Wetland Park, Luliang Mountain Scenic Area, and Yunlong Lake Scenic Area. These regions, rich in forests and water bodies, benefited from natural ecological processes that regulate the urban climate, conserve soil and water, and purify the environment. As a result, they contributed to a more stable, healthy, and sustainable urban ecosystem, leading to higher UER. In contrast, the L-L agglomeration areas were mainly located in Xuzhou city center, Pizhou city center, Suining county seat, and Fengxian county seat. These areas experienced intense human activities, with extensive urban development and construction frequently encroaching upon or significantly damaging natural and semi-natural spaces. This widespread anthropogenic disturbance weakened ecological functions, leading to relatively lower UER.
From 2008 to 2013, the distribution of L-L clusters in the northwestern part of Xuzhou City decreased. Following the abolition of Jiuli District, this area experienced rapid economic development, resulting in a slight increase in the distribution of L-L clusters. Meanwhile, the H-H cluster in the Xuzhou section of the Beijing-Hangzhou Canal declined significantly due to pollution risks, such as industrial effluents and domestic wastewater. Conversely, the H-H cluster in the Luliang Mountain Scenic Area, rich in mountains and forests, increased, reflecting the positive effects of the abandoned mountain renovation and greening project in the area.
From 2013 to 2018, the progress of the Dasha River comprehensive improvement project enhanced the ecological environment along the Dasha River, resulting in a notable rise in UER and an expansion of H-H agglomeration regions.
From 2018 to 2022, the UER of Xuzhou City was characterized by long-term L-L agglomeration because of the area within the city’s third ring road concentrated a great deal of industrial expansion and intensive economic activity.
3.3. Analysis of Influencing Factors on UER in Xuzhou City
3.3.1. Impact Factor Identification and Model Comparison
Referring to previous studies, this study selected four socio-economic factors [33,76,77,78] (nighttime lighting intensity, population density, distance from places, and distance from roads) and five natural factors [33,36,76,77,78,79] (annual precipitation, FVC, DEM, slope, and distance from waterways) to examine the elements that influence UER in Xuzhou City.
Taking the UER of Xuzhou City in 2022 as an example, ordinary least squares (OLS), GWR and MGWR models were constructed to compare the data fitting ability. Before the GWR and MGWR models are calculated, the problem of multicollinearity needs to be checked by OLS regression modeling. The OLS results show that the residuals follow a normal distribution, which initially supports the OLS normality assumption and the model statistical inference is credible. Further covariance diagnosis was carried out and larger variance inflation factor (VIF) values (VIF > 7.5) indicated redundancy in the explanatory variables, thus variables with VIF values greater than 7.5 were identified and excluded to ensure model accuracy and stability. The regression results showed that the VIFs of the selected variables were less than 7.5 (range 1.05–2.14), which indicated that there was no covariance problem between the explanatory variables and the next step of the analysis could be carried out.
The independent and dependent variable data were imported into MGWR 2.2 to construct the model, the model type defaulted to Gaussian function model, and the Fixed Gaussian spatial kernel function was selected for the output, and the bandwidth size was adjusted step by step by Golden Section searching method until the optimal bandwidth size was found.
The final results of the operations for each model were derived. Table 3 shows that the MGWR model outperforms the OLS and GWR models from the perspective of R2 and Adj. R2, suggesting greater explanatory power and adaptability. Furthermore, the MGWR model’s lower AICc value suggests that its regression estimates are more concise and accurate [80]. Collectively, the MGWR model is better suited to studying the elements that influence UER in Xuzhou City.
Table 3.
Model comparison.
3.3.2. Scale Differences of Influencing Factors
The MGWR model can directly reflect the varying spatial scales of different influencing factors, with the model estimation results showing significant differences in the scales of influence among these factors. As shown in Figure 6, population density, distance from places, FVC, and distance from waterways have relatively small bandwidths (all below 60) in their impact on UER, indicating that UER is highly sensitive to localized variations in these factors where small-scale changes can lead to significant differences in resilience between adjacent areas. In contrast, nighttime lighting intensity, distance from roads, and slope influence UER at relatively larger spatial scales (bandwidths ranging from 149 to 462), suggesting that their effects exhibit moderate spatial variability. DEM and annual precipitation have the largest bandwidths, indicating that their impacts on UER are relatively homogeneous across space with minimal regional variation. Specifically, the bandwidth for annual precipitation is 715 as precipitation is governed by climate zones and atmospheric circulation, tending to be consistent at a regional scale with little local variation, hence its large influence scale, while DEM has the largest bandwidth (1274) since topographic features generally remain consistent over broad areas, meaning their influence on UER is widespread.
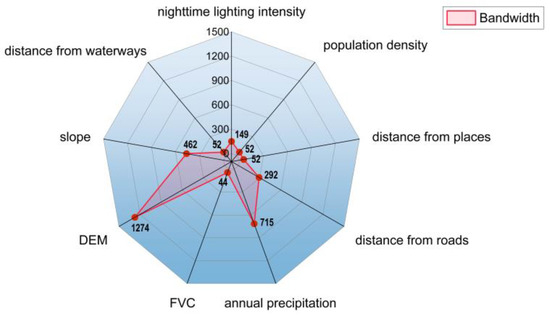
Figure 6.
Bandwidth of the MGWR model.
3.3.3. Spatial Pattern of Regression Coefficients for Influencing Factors
The spatial distribution of the regression coefficients of the factors influencing UER is illustrated in Figure 7, and the absolute values of the average regression coefficients of the indicators are ranked as follows: population density (−0.546) > nighttime lighting intensity (−0.342) > annual precipitation (0.102) > distance from waterways (−0.097) > distance from roads (0.084) > FVC (−0.073) > DEM (0.047) > slope (0.042) > distance from places (−0.028).
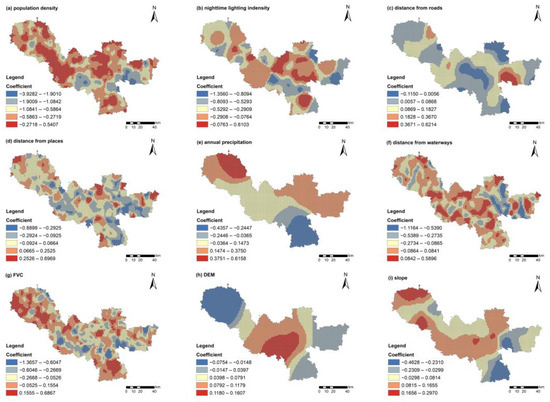
Figure 7.
Spatial distribution of regression coefficients for factors affecting UER.
From the viewpoint of socio-economic factors, (1) UER exhibits a strong negative correlation with population density. Specifically, the eastern region of Tongshan District and the western area of Xinyi City displayed the highest absolute value of the correlation coefficient, demonstrating a strong inverse correlation between UER and population density in these areas. The concentration of people in these regions amplified the pressure on the city’s ecological carrying capacity, resulting in heightened resource consumption. Consequently, higher population densities contributed to increased environmental pollution and ecological degradation, ultimately culminating in reduced UER. (2) Nighttime lighting intensity exhibits a strong negative correlation with UER. This intensity serves as a direct indicator of a city’s economic activities. The most pronounced negative impact was observed in the eastern part of Tongshan District and the eastern part of Xinyi City, where large-scale urban construction and land development had taken place. These activities had caused biodiversity to deteriorate and natural ecosystems to be destroyed, which ultimately resulted in a decrease in UER levels in these areas. (3) The distance from roads is positively correlated with UER. Notably, areas surrounding Lake Luoma and Weishan Lake exhibit a significant positive correlation with UER. These regions, situated farther away from roads, were less impacted by the corridor effect and proximity effect. Consequently, they possessed higher landscape connectivity and a more stable ecological environment, leading to enhanced UER. (4) Distances to places (settlements or urban centers) are generally weakly negatively correlated with UER. The spatial distribution of the regression coefficients for distances to these places is relatively decentralized. For example, the Quanshan District, being closer to the city with better transportation, water supply, and power infrastructure, exhibited a better ability to cope with natural disasters or human damage and displayed higher UER.
From the viewpoint of natural factors: (1) Precipitation and UER are generally positively correlated, and show a stepwise change with a gradual decrease from northwest to southeast. The higher terrain in the northwestern part of Xuzhou City was favorable for airflow convergence and uplift, which promoted the formation of precipitation. In addition, the frequent crossing of weather systems such as the Changjiang–Huaihe cyclone from west to east also strengthened the precipitation trend in the western region. As an important water resource in urban ecosystems, precipitation not only promoted the water cycle, but also promoted biodiversity and effectively enhanced UER of Xuzhou City. (2) The distance from waterways is basically negatively correlated with UER. The areas around the Dasha River, Beijing-Hangzhou Canal, YiHe River, and Shuhe River are closer to waterways and have higher UER. This is because areas closer to waterways can enjoy the ecological benefits of waterways such as climate regulation and water purification. (3) The relationship between FVC and UER in Xuzhou City shows some geographical differences, with southern Xuzhou City being more positively correlated with western Xuzhou and more negatively correlated with central Xuzhou City. The improvement of UER was positively impacted by vegetation richness in both the eastern and western regions, while the central region may have been affected by the enhancement of resilience due to the conflict between high vegetation cover and urban functions, as well as high maintenance costs. (4) DEM is basically positively correlated with UER. The positive effect of DEM on UER in central Xuzhou is higher than that in the eastern and western regions. This might have been due to the presence of mountain ranges and scattered hills in central Xuzhou as compared to the eastern and western parts of the city, which, because of the mountainous terrain, exhibited stronger ecosystem services, better soil and water conservation capacity, and higher biodiversity—all of which collectively enhanced the UER of central Xuzhou. (5) Slope positively correlates with UER, particularly in Xuzhou City’s central and northern areas as opposed to its southern ones. The underlying topographic conditions significantly influenced the variations in UER. A moderate slope facilitates rapid drainage of rainwater runoff, minimizing surface water accumulation. This, in turn, reduced the risk of flooding and enhanced UER.
4. Discussion
4.1. Temporal Characteristics of UER
The temporal variation of UER in Xuzhou City exhibited a significant downward trend, reflecting the ecological challenges characteristic of resource-based cities undergoing industrial transformation, which underscores the urgency of implementing targeted enhancement measures. Based on the UER definition proposed in this study, enhancement strategies should focus on three dimensions: resistance, adaptation and recovery. Before disturbances occur, land use planning should be optimized to control expansion of low-resilience areas and improve disaster resistance. During disturbances, real-time monitoring mechanisms and coupled early warning models should be established. After disturbances, priority should be given to restoring abandoned quarries, coal mining subsidence areas and urban flood-prone areas to accelerate functional recovery.
By synergistically improving these three capacities, Xuzhou City’s UER can be effectively strengthened. The ecological challenges faced by Xuzhou are similar to those encountered in other resource-based cities like Datong in Shanxi and Yulin in Shaanxi, demonstrating the broad applicability of this framework and its potential as a reference for similar cities.
4.2. Spatial Characteristics of UER
This study found that the low UER area in Xuzhou City exhibited a spatial pattern of radiation from the central city to the periphery, a phenomenon that profoundly highlights the limitations of the traditional urban expansion model in terms of ecological sustainability. As a typical resource transition city, Xuzhou’s transition practice in recent years has provided a valuable reference. This study found that ecological restoration in areas such as the Luliang Mountain Scenic Area and the Pan’an Lake National Wetland Park has achieved remarkable results. The core of these success stories lies in the innovative combination of industrial waste land transformation and ecological function enhancement, such as transforming coal mining subsidence areas into wetland ecosystems, which not only restores ecological functions, but also creates new social values. This “industrial-ecological” synergistic transformation model is worth referencing for similar cities. In addition, the finding that high UER areas are mainly distributed along waterways highlights the key role of water ecosystems in urban resilience building. The rich water network provides a natural foundation for the construction of blue infrastructure, and the UER can be significantly enhanced through systematic water environment management and improved water system connectivity.
Based on the research findings, it is suggested that the ecological transformation of resource-transitioned cities should focus on the following aspects: first, abandon the traditional single-center expansion mode and establish a multi-center, networked urban spatial structure; second, capitalize on the transformation opportunities of industrial wastelands by integrating ecological restoration with urban renewal; finally, emphasize the ecological skeleton role of water systems by developing a blue infrastructure network centered on water, enhancing the ecological radiation effect, and ultimately forming an ecological security pattern characterized by “interconnected water systems and blue-green integration.” The comprehensive implementation of these measures will effectively promote the transformation of resource-based cities from “gray development” to “green development.” Future research can further explore the differences in ecological restoration paths among resource cities of varying sizes, as well as the potential application of new technologies in ecological monitoring and assessment, in order to provide more scientific decision-making support for sustainable urban development.
4.3. Influencing Factors of UER
The analysis of the influencing factors revealed that population density and nighttime light intensity exert significant negative effects on UER, a finding that offers an important basis for understanding the relationship between urban human activities and ecosystems. This study provides a more nuanced understanding by examining the spatial non-stationarity of these factors, and its practical contribution lies precisely in its actionable policy recommendations for addressing these challenges. For example, proposing the establishment of a polycentric urban spatial structure or promoting sponge city construction and smart lighting systems in areas with strong negative impacts offers concrete solutions to improve UER. These strategies not only address the immediate challenges posed by high population density and light pollution, but also contribute to long-term sustainable development.
In addition, by learning from the successful experiences of high UER areas and conducting in-depth investigations into the causes of low-resilience areas, local governments can formulate more effective and targeted policies. This spatially informed, category-based guidance strategy is particularly valuable for ecological management in rapidly urbanizing areas. Future studies could further explore the evolving characteristics of UER impact mechanisms across different stages of urban development, thereby providing more comprehensive decision support for sustainable urban development.
4.4. Policy Implications and Recommendations
Combined with the research results, this paper proposes corresponding policy insights and recommendations for Xuzhou City and other resource-transition cities to enhance UER and promote sustainable development. Firstly, urban planning should aim to establish a “multi-centered resilient city” spatial structure to alleviate population pressure in the main urban area and promote clustered development connecting satellite cities and ecological corridors. During urban expansion, priority should be given to the protection of key ecological areas such as rivers and forests to ensure that the ecological environment is not excessively damaged. Secondly, the government should intensify efforts in ecological restoration and protection. For areas affected by historical ecological legacies, such as coal mine subsidence zones, ecological restoration projects can be carried out based on local conditions, drawing on successful examples such as the “mine pit to wetland” transformation in Pan’an Lake Wetland Park. Finally, it is recommended to implement a “Blue-Green Infrastructure Network” project focused on strengthening the protection of areas surrounding major water bodies. By controlling water pollution, regulating hydrological processes, protecting aquatic biodiversity, and restoring riparian vegetation buffer zones, the ecological functions of rivers and lakes can be enhanced, thereby providing robust support for sustainable urban development.
Overall, the practical recommendations provided in this study hold significant potential to guide planning and policy development in Xuzhou City and other similar cities. The continued pursuit of pathways to enhance UER is not only a response to historical challenges but also a strategic investment in the sustainable future of cities. Through targeted policy actions and sustained commitment, UER can be progressively enhanced over time, ultimately leading to more resilient and sustainable urban environments.
5. Conclusions
This study used global and local Moran’s I index to investigate the spatiotemporal divergence characteristics of UER based on the UER data of Xuzhou City from 2008 to 2022. Finally, the factors impacting UER were examined using the MGWR model. The following are the primary conclusions:
- (1)
- From a temporal point of view, the UER of Xuzhou City generally showed a decreasing trend between 2008 and 2022; from a spatial point of view, low-resilience areas have expanded outward from the city center, while high-resilience areas are primarily concentrated around large water bodies such as rivers and lakes.
- (2)
- Xuzhou City’ UER has strong spatial autocorrelation. The global Moran’s I index showed an overall increasing trend from 2008 to 2022, and the spatial convergence and agglomeration trend of UER is most obvious in 2022. The local spatial autocorrelation analysis reveals that UER in Xuzhou City is primarily characterized by H-H and L-L clustering. In contrast, H-L and L-H clustering zones are more sporadically distributed and cover a smaller area. From 2008 to 2022, the H-H clusters basically remain stable mainly distributed in Luoma Lake and surrounding areas in the southeast of Xuzhou City, Lüliang Mountain Scenic Area and Yunlong Lake Scenic Area and other areas with good ecological environments; the L-L clusters are mainly located in Xuzhou city center, Pizhou city center, Suining county seat, and Fengxian county seat and other areas with frequent anthropogenic activities.
- (3)
- Comparing the data fitting ability of OLS, GWR, and MGWR models, the MGWR model, which has a better fitting effect, was used to study the influencing factors of UER in Xuzhou City, and the grading of the influencing strengths from the mean absolute values of the coefficients were: population density > nighttime lighting intensity > annual precipitation > distance from water system > distance from highway > FVC > DEM > slope > distance from town. Population density and nighttime lighting intensity are the key influences on the spatial pattern of UER, and each region’s UER is impacted differently by several factors, so local governments should formulate policies according to local conditions.
Author Contributions
T.Z.: Writing—review and editing, Writing—original draft, Visualization, Validation, Supervision, Software, Resources, Methodology, Investigation, Formal analysis, Data curation, Conceptualization. X.W.: Writing—review and editing, Writing—original draft, Visualization, Validation, Supervision, Resources, Project administration, Conceptualization. X.L.: Writing—original draft, Visualization, Investigation. X.Z.: Writing—original draft, Supervision, Conceptualization. L.L.: Writing—original draft, Supervision, Funding acquisition. L.C.: Writing—original draft, Visualization, Supervision, Software. All authors have read and agreed to the published version of the manuscript.
Funding
This research was supported by The National Natural Science Foundation of China Youth Science Fund Program (42001212); Special Fund Project for Geological Exploration Construction and Development in Shanxi Province—Open Fund of Shanxi Geoscience Think Tank (2023-008); The Science and Technology Innovation Project of Jiangsu Provincial Department of Natural Resources (2022008).
Data Availability Statement
Data will be made available on request. The data are not publicly available due to privacy.
Conflicts of Interest
The authors declare no conflicts of interest.
References
- Yuan, Q.; Meng, F.; Li, F.; Liu, G.; Yang, Z. A Conceptual Framework for Enhancing Urban Resilience with Green and Blue Infrastructure from the Perspective of Food-Energy-Water Nexus. Urban Dev. Stud. 2022, 29, 20–27. [Google Scholar]
- Tao, J.; Dong, P.; Lu, Y. Spatial-Temporal Analysis and Influencing Factors of Ecological Resilience in Yangtze River Delta. Resour. Environ. Yangtze Basin 2022, 31, 1975–1987. [Google Scholar]
- Folke, C.; Carpenter, S.; Elmqvist, T.; Gunderson, L.; Holling, C.S.; Walker, B. Resilience and Sustainable Development: Building Adaptive Capacity in a World of Transformations. AMBIO A J. Hum. Environ. 2002, 31, 437–440. [Google Scholar] [CrossRef]
- Wang, Y.; Cai, Y.; Xie, Y.; Zhang, P.; Chen, L. A Quantitative Framework to Evaluate Urban Ecological Resilience: Broadening Understanding through Multi-Attribute Perspectives. Front. Ecol. Evol. 2023, 11, 1144244. [Google Scholar] [CrossRef]
- Suárez, M.; Benayas, J.; Justel, A.; Sisto, R.; Montes, C.; Sanz-Casado, E. A Holistic Index-Based Framework to Assess Urban Resilience: Application to the Madrid Region, Spain. Ecol. Indic. 2024, 166, 112293. [Google Scholar] [CrossRef]
- Meng, Z.; He, M.; Li, X.; Li, H.; Tan, Y.; Li, Z.; Wei, Y. Spatio-temporal Analysis and Driving Forces of Urban Ecosystem Resilience Based on Land Use: A Case Study in the Great Bay Area. Ecol. Indic. 2024, 159, 111769. [Google Scholar] [CrossRef]
- Fan, Y.; Wei, G. Assessment of Ecological Resilience and Its Response Mechanism to Land Spatial Structure Conflicts in China’s Southeast Coastal Areas. Ecol. Indic. 2025, 170, 112980. [Google Scholar] [CrossRef]
- Holling, C.S. Resilience and Stability of Ecological Systems. Annu. Rev. Ecol. Syst. 1973, 4, 1–23. [Google Scholar] [CrossRef]
- Li, J.; Liang, L.; Chao, Y.; Wang, X.; Qiu, M.; Luo, P.; Zhu, Y. Construction of the Ecological Security Pattern of Mu Us Sandy Land on the Basis of the “Source- Resistance- Corridor” Theory. Ecol. Indic. 2025, 171, 113162. [Google Scholar] [CrossRef]
- Wang, S.; Li, Z.; Long, Y.; Yang, L.; Ding, X.; Sun, X.; Chen, T. Impacts of Urbanization on the Spatiotemporal Evolution of Ecological Resilience in the Plateau Lake Area in Central Yunnan, China. Ecol. Indic. 2024, 160, 111836. [Google Scholar] [CrossRef]
- Cai, X.; Song, Y.; Xue, D.; Ma, B.; Liu, X.; Zhang, L. Spatial and Temporal Changes in Ecological Resilience in the Shanxi–Shaanxi–Inner Mongolia Energy Zone with Multi-Scenario Simulation. Land 2024, 13, 425. [Google Scholar] [CrossRef]
- Zhao, R.D.; Fang, C.L.; Liu, H.M. Progress and Prospect of Urban Resilience Research. Prog. Geogr. 2020, 39, 1717–1731. [Google Scholar] [CrossRef]
- Ahern, J. From Fail-Safe to Safe-to-Fail: Sustainability and Resilience in the New Urban World. Landsc. Urban Plan. 2011, 100, 341–343. [Google Scholar] [CrossRef]
- Hosseini, S.; Barker, K.; Ramirez-Marquez, J.E. A Review of Definitions and Measures of System Resilience. Reliab. Eng. Syst. Saf. 2016, 145, 47–61. [Google Scholar] [CrossRef]
- Wang, S.; Niu, J. Dynamic Evolution and Obstacle Factors of Urban Ecological Resilience in Shandong Peninsula Urban Agglomeration. Econ. Geogr. 2022, 42, 51–61. [Google Scholar]
- Wang, S.; Niu, J. Co-Evolution of Tourism Economy and Urban Ecological Resilience in Shandong Province. Acta Geogr. Sin. 2023, 78, 2591–2608. [Google Scholar]
- Zhao, R.; Fang, C.; Liu, H.; Liu, X. Evaluating Urban Ecosystem Resilience Using the DPSIR Framework and the ENA Model: A Case Study of 35 Cities in China. Sustain. Cities Soc. 2021, 72, 102997. [Google Scholar] [CrossRef]
- Zhang, Q.; Huang, T.; Xu, S. Assessment of Urban Ecological Resilience Based on PSR Framework in the Pearl River Delta Urban Agglomeration, China. Land 2023, 12, 1089. [Google Scholar] [CrossRef]
- Zhu, R.; Gan, X.; Li, Z.S. Spatio-Temporal Changes of Ecological Resilience and Ecological Risk and Construction of Ecological Zones in Sichuan Province. Resour. Environ. Yangtze Basin 2024, 33, 175–188. [Google Scholar]
- Zhang, B.; Tang, X.; Cui, J. Temporal and Spatial Relationship Between Ecological Eesilience and Land Use Intensity in Xi’an City. Environ. Sci. 2025, 46, 2463–2474. [Google Scholar]
- Zhao, Z.; Ru, S.; Xue, F. Spatio-temporal pattern and dynamic evolution of ecological resilience in the Yellow River Basin: Based on the analysis of emergy ecological footprint model. China Popul. Resour. Environ. 2024, 34, 136–147. [Google Scholar]
- Xiu, C.; Wei, Y.; Wang, Q. Evaluation of Urban Resilience of Dalian City Based on the Perspective of “Size-Density-Morphology. ” Acta Geogr. Sin. 2018, 73, 2315–2328. [Google Scholar]
- Sun, Y.; Liu, W.; Sheng, Y. Spatiotemporal differences and influencing factors of economic and ecological resilience of water resources in Xinjiang based on the PSR model. Arid Land Geogr. 2023, 46, 2017–2028. [Google Scholar]
- Jiang, W.; Wu, J.; Xu, J. Study on the coupling coordination between urban ecological resilience and economic development level—Taking Jiangsu Province as an example. Resour. Dev. Mark. 2023, 39, 299–308, 318. [Google Scholar]
- Zhang, A.; Miao, C.; Chen, Z. Urban ecological resilience, social networks and its influencing factors in the Yellow River Basin. Arid Land Geogr. 2025, 48, 130–142. [Google Scholar]
- Yuan, X.; Liu, R.; Huang, T. Analyzing Spatial-Temporal Patterns and Driving Mechanisms of Ecological Resilience Using the Driving Force-Pressure-State-Influence-Response and Environment-Economy-Society Model: A Case Study of 280 Cities in China. Systems 2024, 12, 311. [Google Scholar] [CrossRef]
- Xue, X.; Fan, X.; Xie, Q. Spatio-Temporal Evolution And Multi-Scale Barrier Factor Analysis Of Ecological Resilience of Agricultural Water Resources: A Case Study of Nine Provinces in the Yellow River Basin. Chin. J. Agric. Resour. Reg. Plan. 2025, 46, 91–102. [Google Scholar]
- Xia, C.Y.; Dong, Z.; Chen, B. Spatio-Temporal Analysis and Simulation of Urban Ecological Resilience: A Case Study of Hangzhou. Acta Ecol. Sin. 2022, 42, 116–126. [Google Scholar]
- Lyu, T.; Hu, H.; Fu, S.; Kong, A. Spatio-Temporal Differentiation and Influencing Factors of Urban Ecological Resilience in the Yangtze River Delta. Areal Res. Dev. 2023, 42, 54–60. [Google Scholar]
- Peng, W.; Cao, X. Spatiotemporal Differentiation of Ecological Resilience under Urban Renewal and Its Influencing Mechanisms around the Changsha-Zhuzhou-Xiangtan Urban Agglomeration. Econ. Geogr. 2023, 43, 44–52. [Google Scholar]
- Yang, L.; Chen, Y.; Xie, H. Spatio-Temporal Patterns and driving Factors of Ecological Resilience in Urban Agglomerations in the Yellow River Basin. Ecol. Econ. 2024, 40, 99–108. [Google Scholar]
- Wang, S.M.; Niu, J.L. Spatio-Temporal Evolution and Influencing Factors of Urban Ecological Resilience in the Yellow River Basin. Acta Eologica Sin. 2023, 43, 8309–8320. [Google Scholar]
- Wang, W.; Zhong, Y.; Ma, H.; Ou, M.; Feng, X.; Wu, S. Spatio-temporal variations and influencing factors of ecological resilience in the Aquatic-Terrestrial Ecotone of Poyang Lake. Acta Ecol. Sin. 2023, 43, 9514–9526. [Google Scholar] [CrossRef]
- Wang, S.; Cui, Z.; Lin, J.; Xie, J.; Su, K. The Coupling Relationship between Urbanization and Ecological Resilience in the Pearl River Delta. J. Geogr. Sci. 2022, 32, 44–64. [Google Scholar] [CrossRef]
- Huang, J.; Zhong, P.; Zhang, J.; Zhang, L. Spatial-Temporal Differentiation and Driving Factors of Ecological Resilience in the Yellow River Basin, China. Ecol. Indic. 2023, 154, 110763. [Google Scholar] [CrossRef]
- Li, J.; Zhang, Y.; Zhang, H.; Gong, H.; Liu, Y. The research of spatio-temporal characteristics and influence factors of Wenzhou ecological resilience based on the potential-elastic-stability model. Acta Ecol. Sin. 2024, 44, 3253–3267. [Google Scholar] [CrossRef]
- Liao, Z.; Zhang, L. Spatio-Temporal Pattern Evolution and Dynamic Simulation of Urban Ecological Resilience in Guangdong Province, China. Heliyon 2024, 10, e25127. [Google Scholar] [CrossRef]
- Zhang, M.; Ren, Y.; Zhou, L. Spatiotemporal Evolution Characteristics and Influencing Factors of Urban Ecological Resilience in the Yellow River Basin. Arid Land Geogr. 2024, 47, 445–454. [Google Scholar]
- Hu, W.; Cheng, J.; Zheng, M.; Jin, X.; Yao, J.; Guo, F. A Multi-Scenario Simulation and Driving Factor Analysis of Production–Living–Ecological Land in China’s Main Grain Producing Areas: A Case Study of the Huaihe River Eco-Economic Belt. Agriculture 2025, 15, 349. [Google Scholar] [CrossRef]
- Yang, L.; Xu, Y.; Zhu, J.; Sun, K. Spatiotemporal Evolution and Influencing Factors of the Coupling Coordination of Urban Ecological Resilience and New Quality Productivity at the Provincial Scale in China. Land 2024, 13, 1998. [Google Scholar] [CrossRef]
- He, X.; Shi, C.; Peng, K. Spatial-Temporal Adaptation and Interactive Response of New-Type Urbanization and Ecological Resilience in the Middle Reaches of the Yangtze River. Resour. Environ. Yangtze Basin 2024, 33, 699–714. [Google Scholar]
- Huang, X.; Lu, R.; Ye, Z. Economic Development Quality and Ecological Resilience of China’s Land Border Cities Coupling Measure and Interactive Response. Bull. Soil Water Conserv. 2024, 44, 256–268. [Google Scholar]
- Wu, C.; Ren, H. Coupled Coordination and the Spatial Connection Network Analysis of New Urbanization and Ecological Resilience in the Urban Agglomeration of Central Guizhou, China. Land 2024, 13, 1256. [Google Scholar] [CrossRef]
- Chang, Q.; Sha, Y.; Chen, Y. The Coupling Coordination and Influencing Factors of Urbanization and Ecological Resilience in the Yangtze River Delta Urban Agglomeration, China. Land 2024, 13, 111. [Google Scholar] [CrossRef]
- Xu, C.; Huo, X.; Hong, Y.; Yu, C.; de Jong, M.; Cheng, B. How Urban Greening Policy Affects Urban Ecological Resilience: Quasi-Natural Experimental Evidence from Three Megacity Clusters in China. J. Clean. Prod. 2024, 452, 142233. [Google Scholar] [CrossRef]
- Zhan, S.; Zhang, X. Coupled Climate-Environment-Society-Ecosystem Resilience Coordination Analytical Study-A Case Study of Zhejiang Province. Sustainability 2024, 16, 5746. [Google Scholar] [CrossRef]
- Kim, D.; Lim, U. Urban Resilience in Climate Change Adaptation: A Conceptual Framework. Sustainability 2016, 8, 405. [Google Scholar] [CrossRef]
- Vitale, C.; Meijerink, S.; Moccia, F.D.; Ache, P. Urban Flood Resilience, a Discursive-Institutional Analysis of Planning Practices in the Metropolitan City of Milan. Land Use Policy 2020, 95, 104575. [Google Scholar] [CrossRef]
- Xu, W.; Cai, X.; Yu, Q.; Proverbs, D.; Xia, T. Modelling Trends in Urban Flood Resilience towards Improving the Adaptability of Cities. Water 2024, 16, 1614. [Google Scholar] [CrossRef]
- Mccloy, M.W.D.; Andringa, R.K.; Maness, T.J.; Smith, J.A.; Grace, J.K. Promoting Urban Ecological Resilience through the Lens of Avian Biodiversity. Front. Ecol. Evol. 2024, 12, 1302002. [Google Scholar] [CrossRef]
- Zhang, Y.; Chen, L.; Wang, Y.; Chen, L.; Yao, F.; Wu, P.; Wang, B.; Li, Y.; Zhou, T.; Zhang, T. Research on the Contribution of Urban Land Surface Moisture to the Alleviation Effect of Urban Land Surface Heat Based on Landsat 8 Data. Remote Sens. 2015, 7, 10737–10762. [Google Scholar] [CrossRef]
- Lu, F.; Zhang, C.; Cao, H.; Wang, X.; Zheng, T.; Huang, Z. Assessment of Ecological Environment Quality and Their Drivers in Urban Agglomeration Based on a Novel Remote Sensing Ecological Index. Ecol. Indic. 2025, 170, 113104. [Google Scholar] [CrossRef]
- Teng, G.; Chen, L.; Ting, Z.; Long, L.; Jue, X.; Linyu, M. The Spatiotemporal Evolution of Land Use Ecological Efficiency in the Huaihai Economic Zone: Insights from a Multi-Dimensional Framework and Geospatial Modeling. Land 2025, 14, 883. [Google Scholar] [CrossRef]
- Wang, H.; Ge, Q. Ecological Resilience of Three Major Urban Agglomerations in China from the “Environment–Society” Coupling Perspective. Ecol. Indic. 2024, 169, 112944. [Google Scholar] [CrossRef]
- Li, Y.; Shi, Y.; Qureshi, S.; Bruns, A.; Zhu, X. Applying the Concept of Spatial Resilience to Socio-Ecological Systems in the Urban Wetland Interface. Ecol. Indic. 2014, 42, 135–146. [Google Scholar] [CrossRef]
- Huang, Z.; Wang, F.; Cao, W. Dynamic Analysis of an Ecological Security Pattern Relying on the Relationship between Ecosystem Service Supply and Demand: A Case Study on the Xiamen-Zhangzhou-Quanzhou City Cluster. Acta Ecol. Sin. 2018, 38, 4327–4340. [Google Scholar]
- Ma, K.M.; Kong, H.M.; Guan, W.B.; Fu, B.J. Ecosystem Health Assessment: Methods and Directions. Acta Ecol. Sin. 2001, 21, 2106–2116. [Google Scholar]
- Ren, H.; Wu, J.; Peng, S. Concept of Ecosystem Management and Its Essential Elements. Ying Yong Sheng Tai Xue Bao J. Appl. Ecol. 2000, 11, 455–458. [Google Scholar]
- XIE, G.; Zhen, L.; LU, C.; Xiao, Y.; Chen, C. Expert Knowledge Based Valuation Method of Ecosystem Services in China. J. Nat. Resour. 2008, 23, 911–919. [Google Scholar]
- Xie, G.; Xiao, Y.; Zhen, L.; Lu, C.-X. Study on Ecosystem Services Value of Food Production in China. Chin. J. Eco-Agric. 2005, 13, 10–13. [Google Scholar]
- Ding, M.; Pei, F.; Hu, Y.; Dong, S.; Zhang, Z.; Liu, Z. Spatial and Temporal Changes of Ecosystem Service Value in Jiangsu Province Based on LUCC. Acta Ecol. Sin. 2020, 40, 6801–6811. [Google Scholar]
- Bu, R.; Li, X.; Hu, Y.; Chang, Y.; He, H.-S. Scaling Effects on Landscape Pattern Indices. Ying Yong Sheng Tai Xue Bao J. Appl. Ecol. 2003, 14, 2181–2186. [Google Scholar]
- Zhang, M.; Li, J.; Wang, L.; Xu, B.; Nie, W. The Impact of Connectivity in Natural Protected Areas on the Resilience of Urban Ecological Networks: A Research Framework Based on Hierarchical Disturbance Scenario Simulation. Ecol. Indic. 2024, 164, 112144. [Google Scholar] [CrossRef]
- Hu, Y.; Pan, J. The Stability of Landscape Pattern in Lanzhou, Gansu, China. J. Desert Res. 2016, 36, 556. [Google Scholar]
- Zhang, H.; Dilixiati, B.; Zhu, Y.; Zhang, J.; Lei, Y. Stability of Forest Landscape Pattern in Altai Mountains. Bull. Soil Water Conserv. 2018, 38, 189–194. [Google Scholar] [CrossRef]
- Peng, B.F.; Chen, D.L.; Li, W.J.; Wang, Y.L. Stability of Landscape Pattern of Land Use: A Case Study of Changde. Sci. Geogr. Sin 2013, 33, 1484–1488. [Google Scholar]
- Dong, Y.; She, J.; Chen, D.; She, Y.; Deng, J. Landscape pattern analysis of Dongfang city based on the stability evaluation model. J. Cent. South Univ. For. Technol. 2016, 36, 104–108. [Google Scholar] [CrossRef]
- Yu, G.; Yu, Q.; Hu, L.; Zhang, S.; Fu, T.; Zhou, X.; He, X.; Liu, Y.; Wang, S.; Jia, H. Ecosystem Health Assessment Based on Analysis of a Land Use Database. Appl. Geogr. 2013, 44, 154–164. [Google Scholar] [CrossRef]
- Peng, J.; Liu, Y.; Wu, J.; Lv, H.; Hu, X. Linking Ecosystem Services and Landscape Patterns to Assess Urban Ecosystem Health: A Case Study in Shenzhen City, China. Landsc. Urban Plan. 2015, 143, 56–68. [Google Scholar] [CrossRef]
- Peng, H.; Lou, H.; Liu, Y.; He, Q.; Zhang, M.; Yang, Y. Spatial and Temporal Evolution Assessment of Landscape Ecological Resilience Based on Adaptive Cycling in Changsha–Zhuzhou–Xiangtan Urban Agglomeration, China. Land 2025, 14, 709. [Google Scholar] [CrossRef]
- Wang, J.; Du, G. Spatial Disparity and Driving Factors of Green Development Efficiency in Chinese Cities. Res. Econ. Manag. 2020, 41, 11–27. [Google Scholar]
- Ru, S.; Ma, R. Evaluation, Spatial Analysis and Prediction of Ecological Environment Vulnerability of Yellow River Basin. J. Nat. Resour. 2022, 37, 1722. [Google Scholar] [CrossRef]
- Lu, B.; Brunsdon, C.; Charlton, M.; Harris, P. Geographically Weighted Regression with Parameter-Specific Distance Metrics. Int. J. Geogr. Inf. Sci. 2017, 31, 982–998. [Google Scholar] [CrossRef]
- Du, S.; He, C.; Zhang, L.; Zhao, Y.; Chu, L.; Ni, J. Policy Implications for Synergistic Management of PM2.5 and O3 Pollution from a Pattern-Process-Sustainability Perspective in China. Sci. Total Environ. 2024, 916, 170210. [Google Scholar] [CrossRef]
- Chen, Z.; Yu, B.; Yang, C.; Zhou, Y.; Yao, S.; Qian, X.; Wang, C.; Wu, B.; Wu, J. An Extended Time Series (2000–2018) of Global NPP-VIIRS-like Nighttime Light Data from a Cross-Sensor Calibration. Earth Syst. Sci. Data 2021, 13, 889–906. [Google Scholar] [CrossRef]
- Zhu, J.; Shi, X. Analysis of Spatial Autocorrelation Patterns of Land Use and Influence Factors in Loess Hilly Region—A Case Study of Changhe Basin of Jincheng City. Res. Soil Water Conserv. 2018, 25, 234–241. [Google Scholar] [CrossRef]
- Zheng, K.; Li, C.; Wu, Y.M.; Gao, B.; Li, C.; Wu, Y. Temporal and Spatial Variation of Landscape Ecological Risk and Influential Factors in Yunnan Border Mountainous Area. Acta Ecol. Sin. 2022, 42, 7458–7469. [Google Scholar]
- Zhang, H.; Li, J.; Liu, Y. Spatiotemporal evolution of the resilience of the coastal complex ecosystem in the East China Sea from 2001 to 2020. Mar. Sci. Bull. 2024, 43, 127–139. [Google Scholar]
- Li, Y.Y.; You, L.L.; Chen, Y.S.; Huang, J.X. Spatial-Temporal Characteristics of Multi-Pond Landscape Change and Their Driving Factors in the Chaohu Basin, China. Acta Ecol. Sin 2018, 38, 6280–6291. [Google Scholar]
- Zhang, K.; Feng, R.; Zhang, Z.; Deng, C.; Zhang, H.; Liu, K. Exploring the Driving Factors of Remote Sensing Ecological Index Changes from the Perspective of Geospatial Differentiation: A Case Study of the Weihe River Basin, China. Int. J. Environ. Res. Public Health 2022, 19, 10930. [Google Scholar] [CrossRef]
Disclaimer/Publisher’s Note: The statements, opinions and data contained in all publications are solely those of the individual author(s) and contributor(s) and not of MDPI and/or the editor(s). MDPI and/or the editor(s) disclaim responsibility for any injury to people or property resulting from any ideas, methods, instructions or products referred to in the content. |
© 2025 by the authors. Licensee MDPI, Basel, Switzerland. This article is an open access article distributed under the terms and conditions of the Creative Commons Attribution (CC BY) license (https://creativecommons.org/licenses/by/4.0/).