


Machine Learning-Driven Multimodal Feature Extraction and Optimization Strategies for High-Speed Railway Station Area


Abstract
1. Introduction
2. Study Area and Research Framework
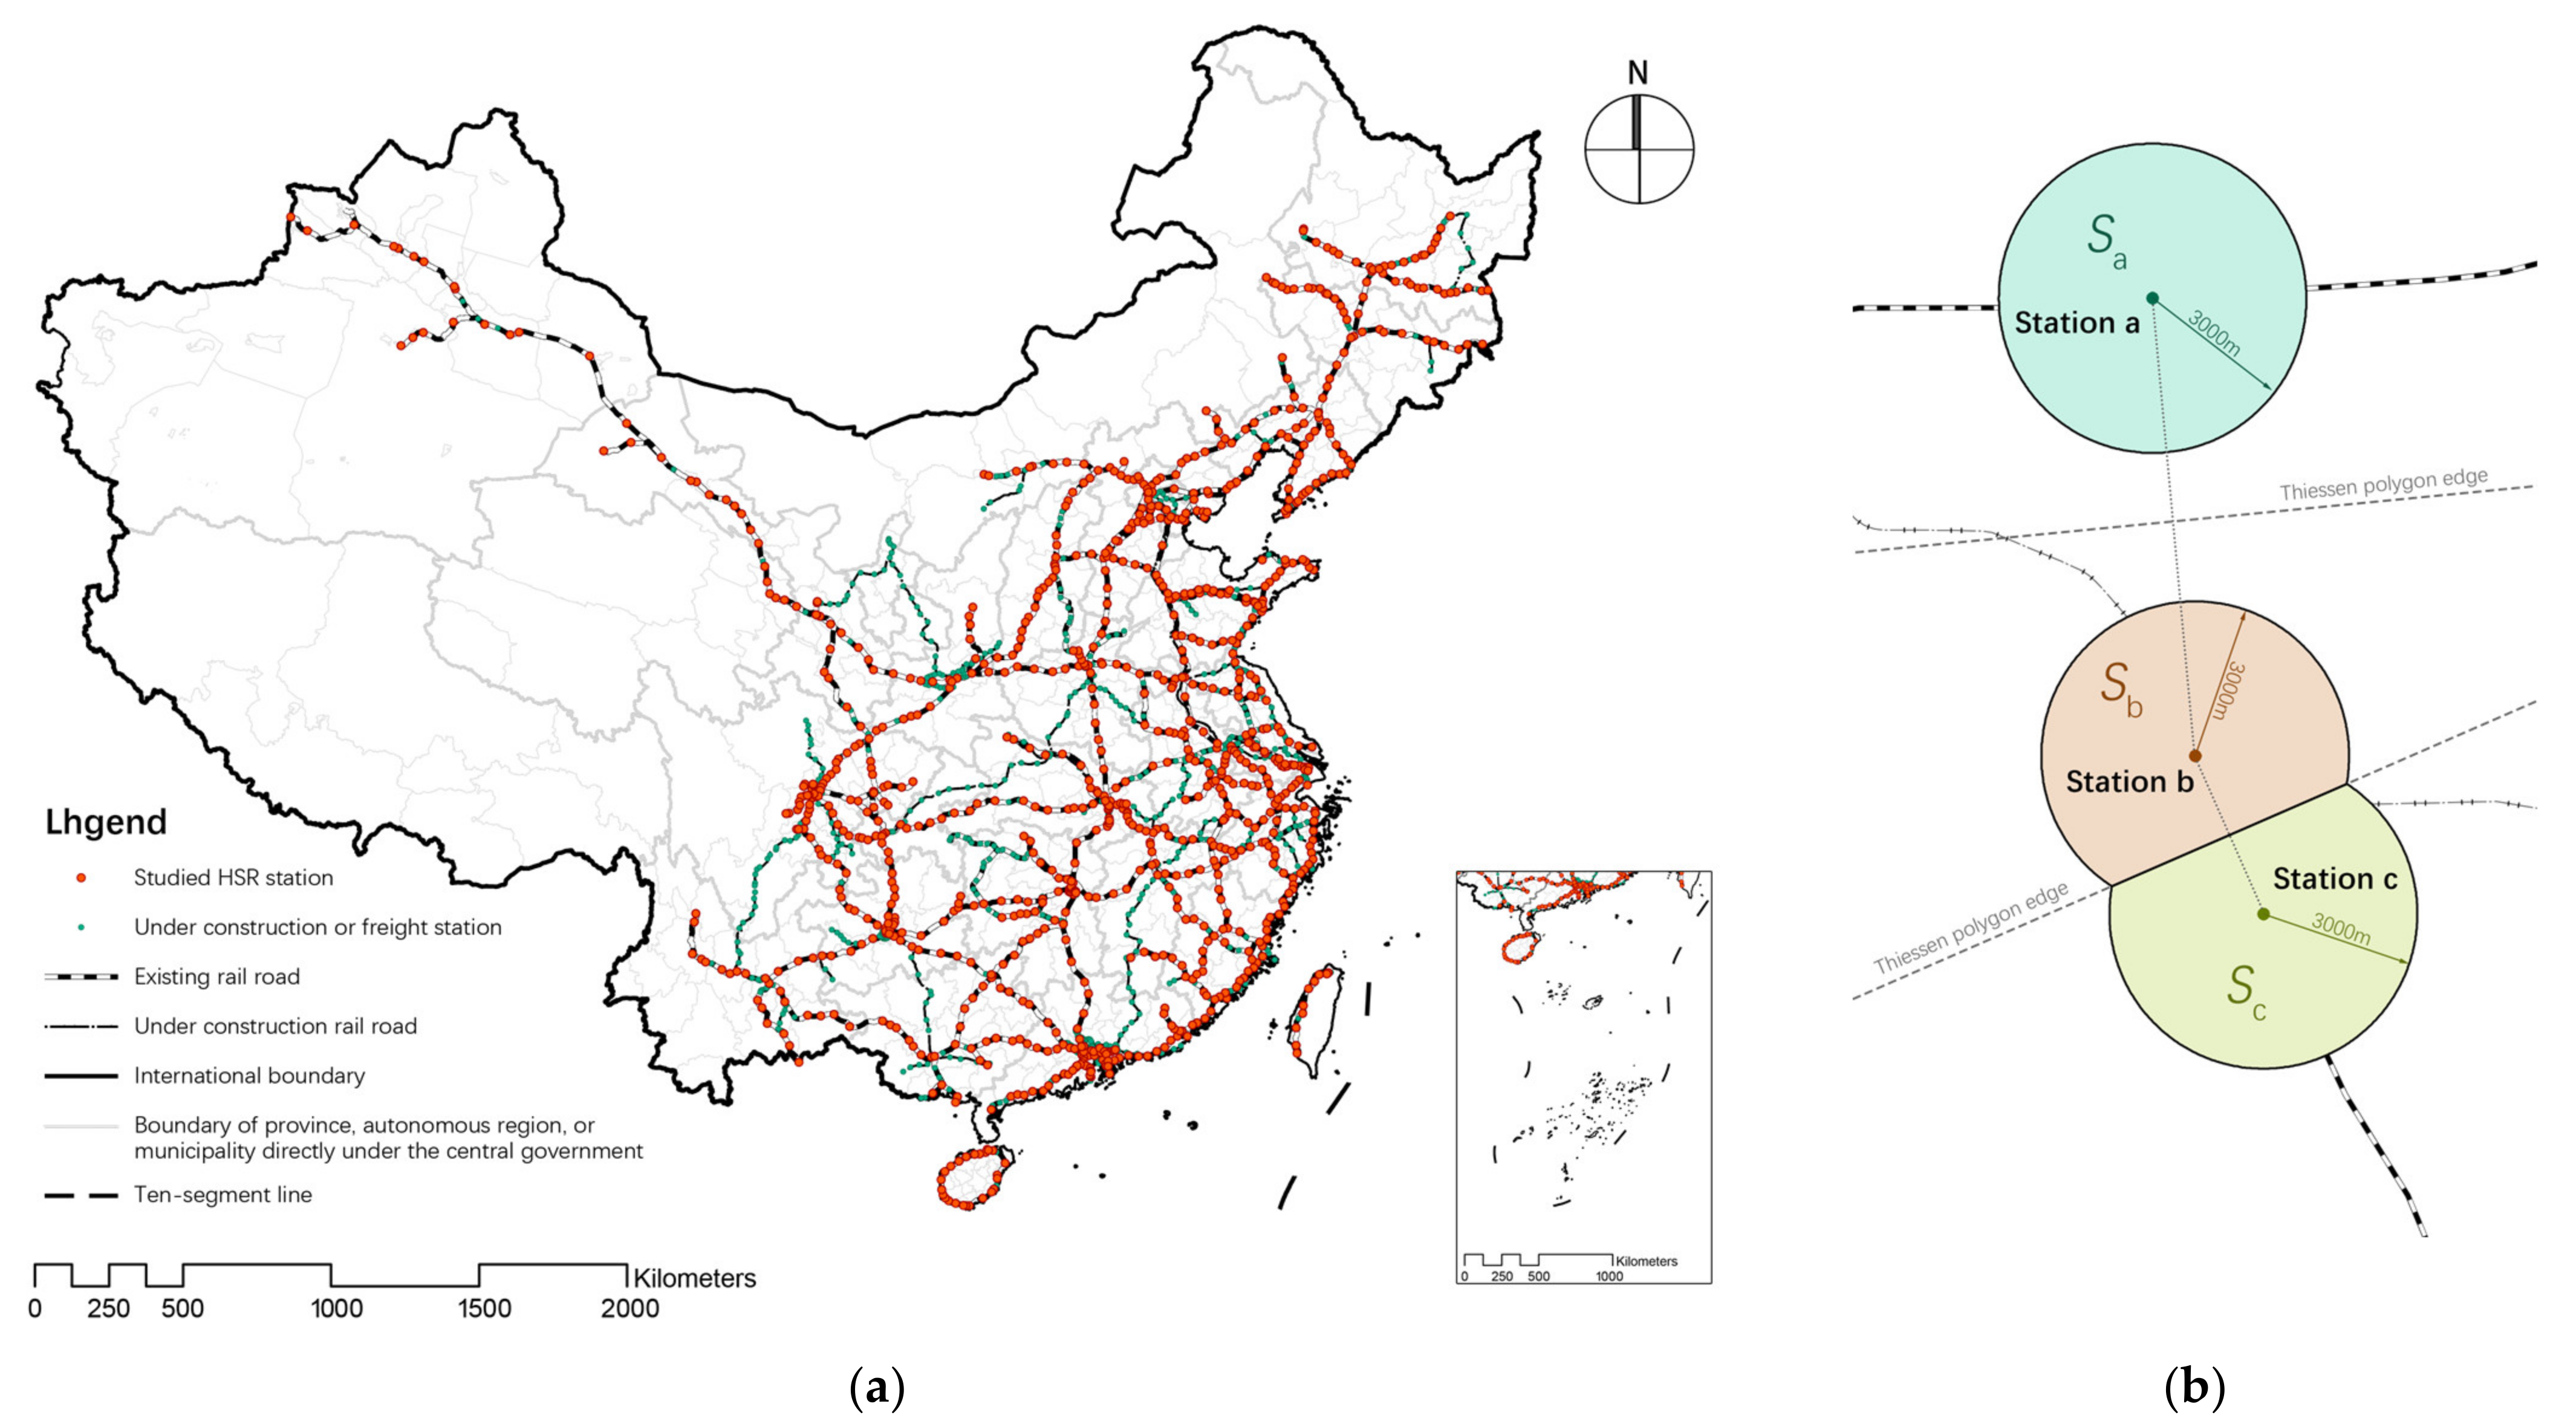
2.1. Study Area
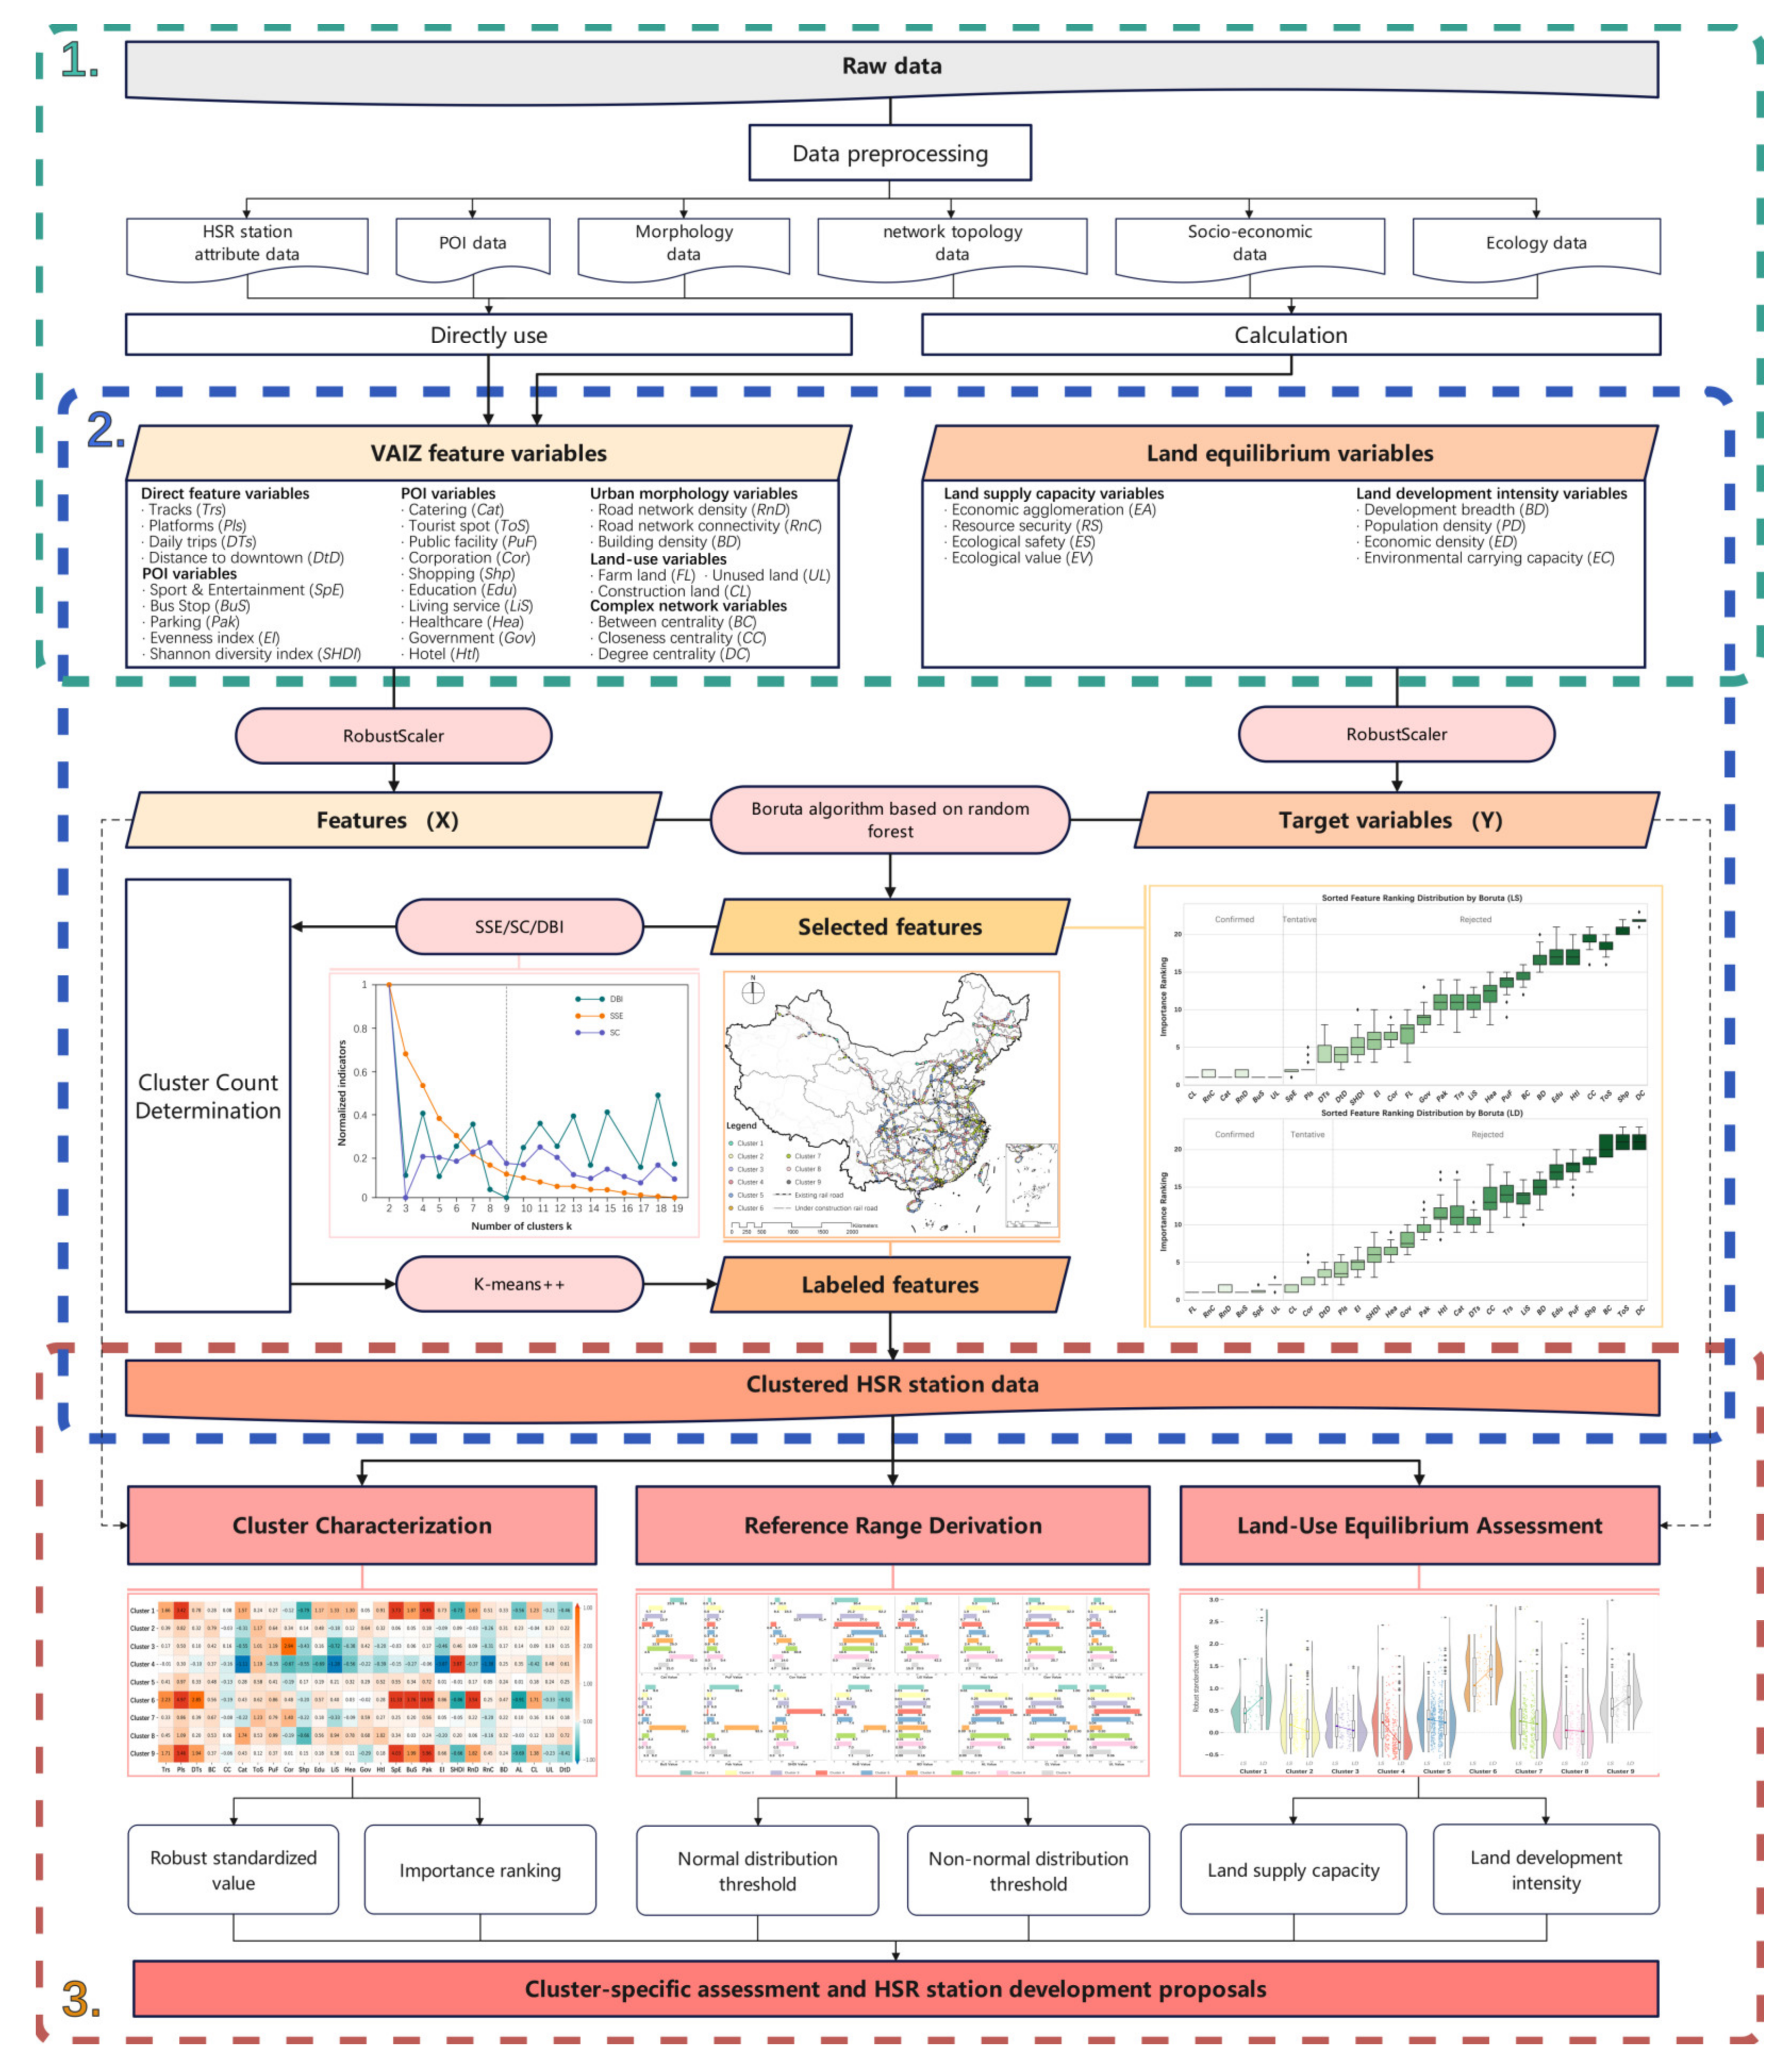
2.2. Research Framework
- Multi-source data integration: This study synthesizes multi-source data collected through literature research, including station attribute data, point-of-interest (POI) data, station-area morphological data, socioeconomic data, and ecological data. Following data preprocessing procedures, the raw datasets were systematically categorized and integrated using ArcGIS 10.6 to establish a geodatabase. Through rigorous indicator calculations, characteristic variables for each HSR station were derived, ensuring methodological transparency and analytical reproducibility.
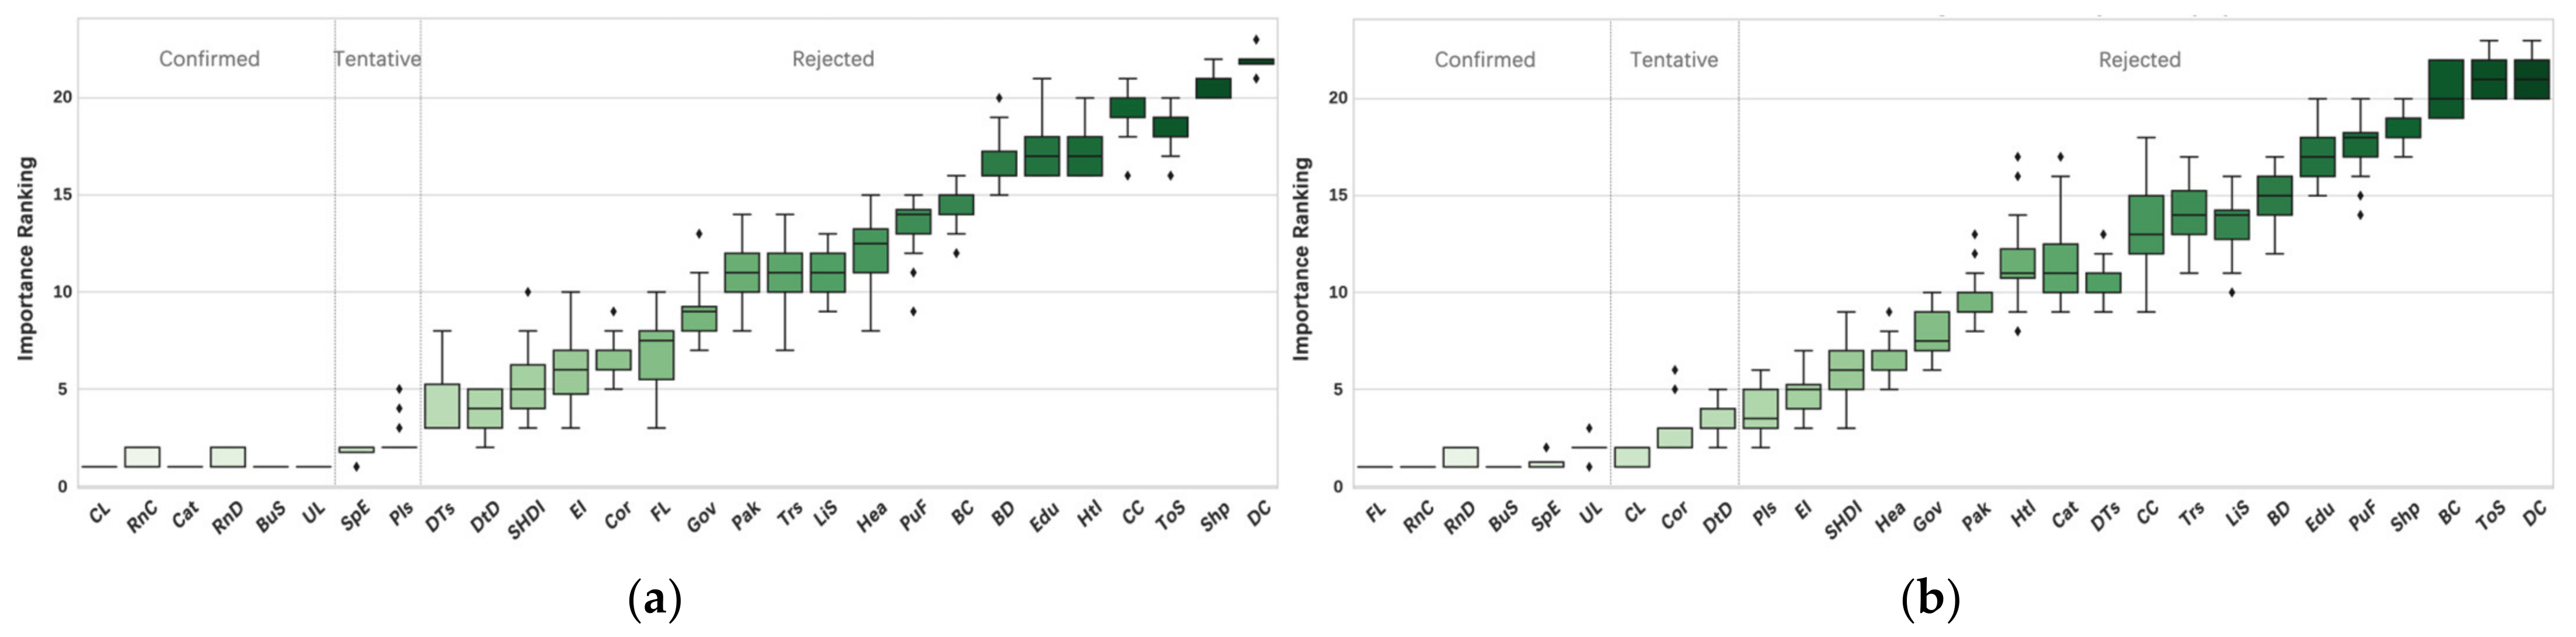
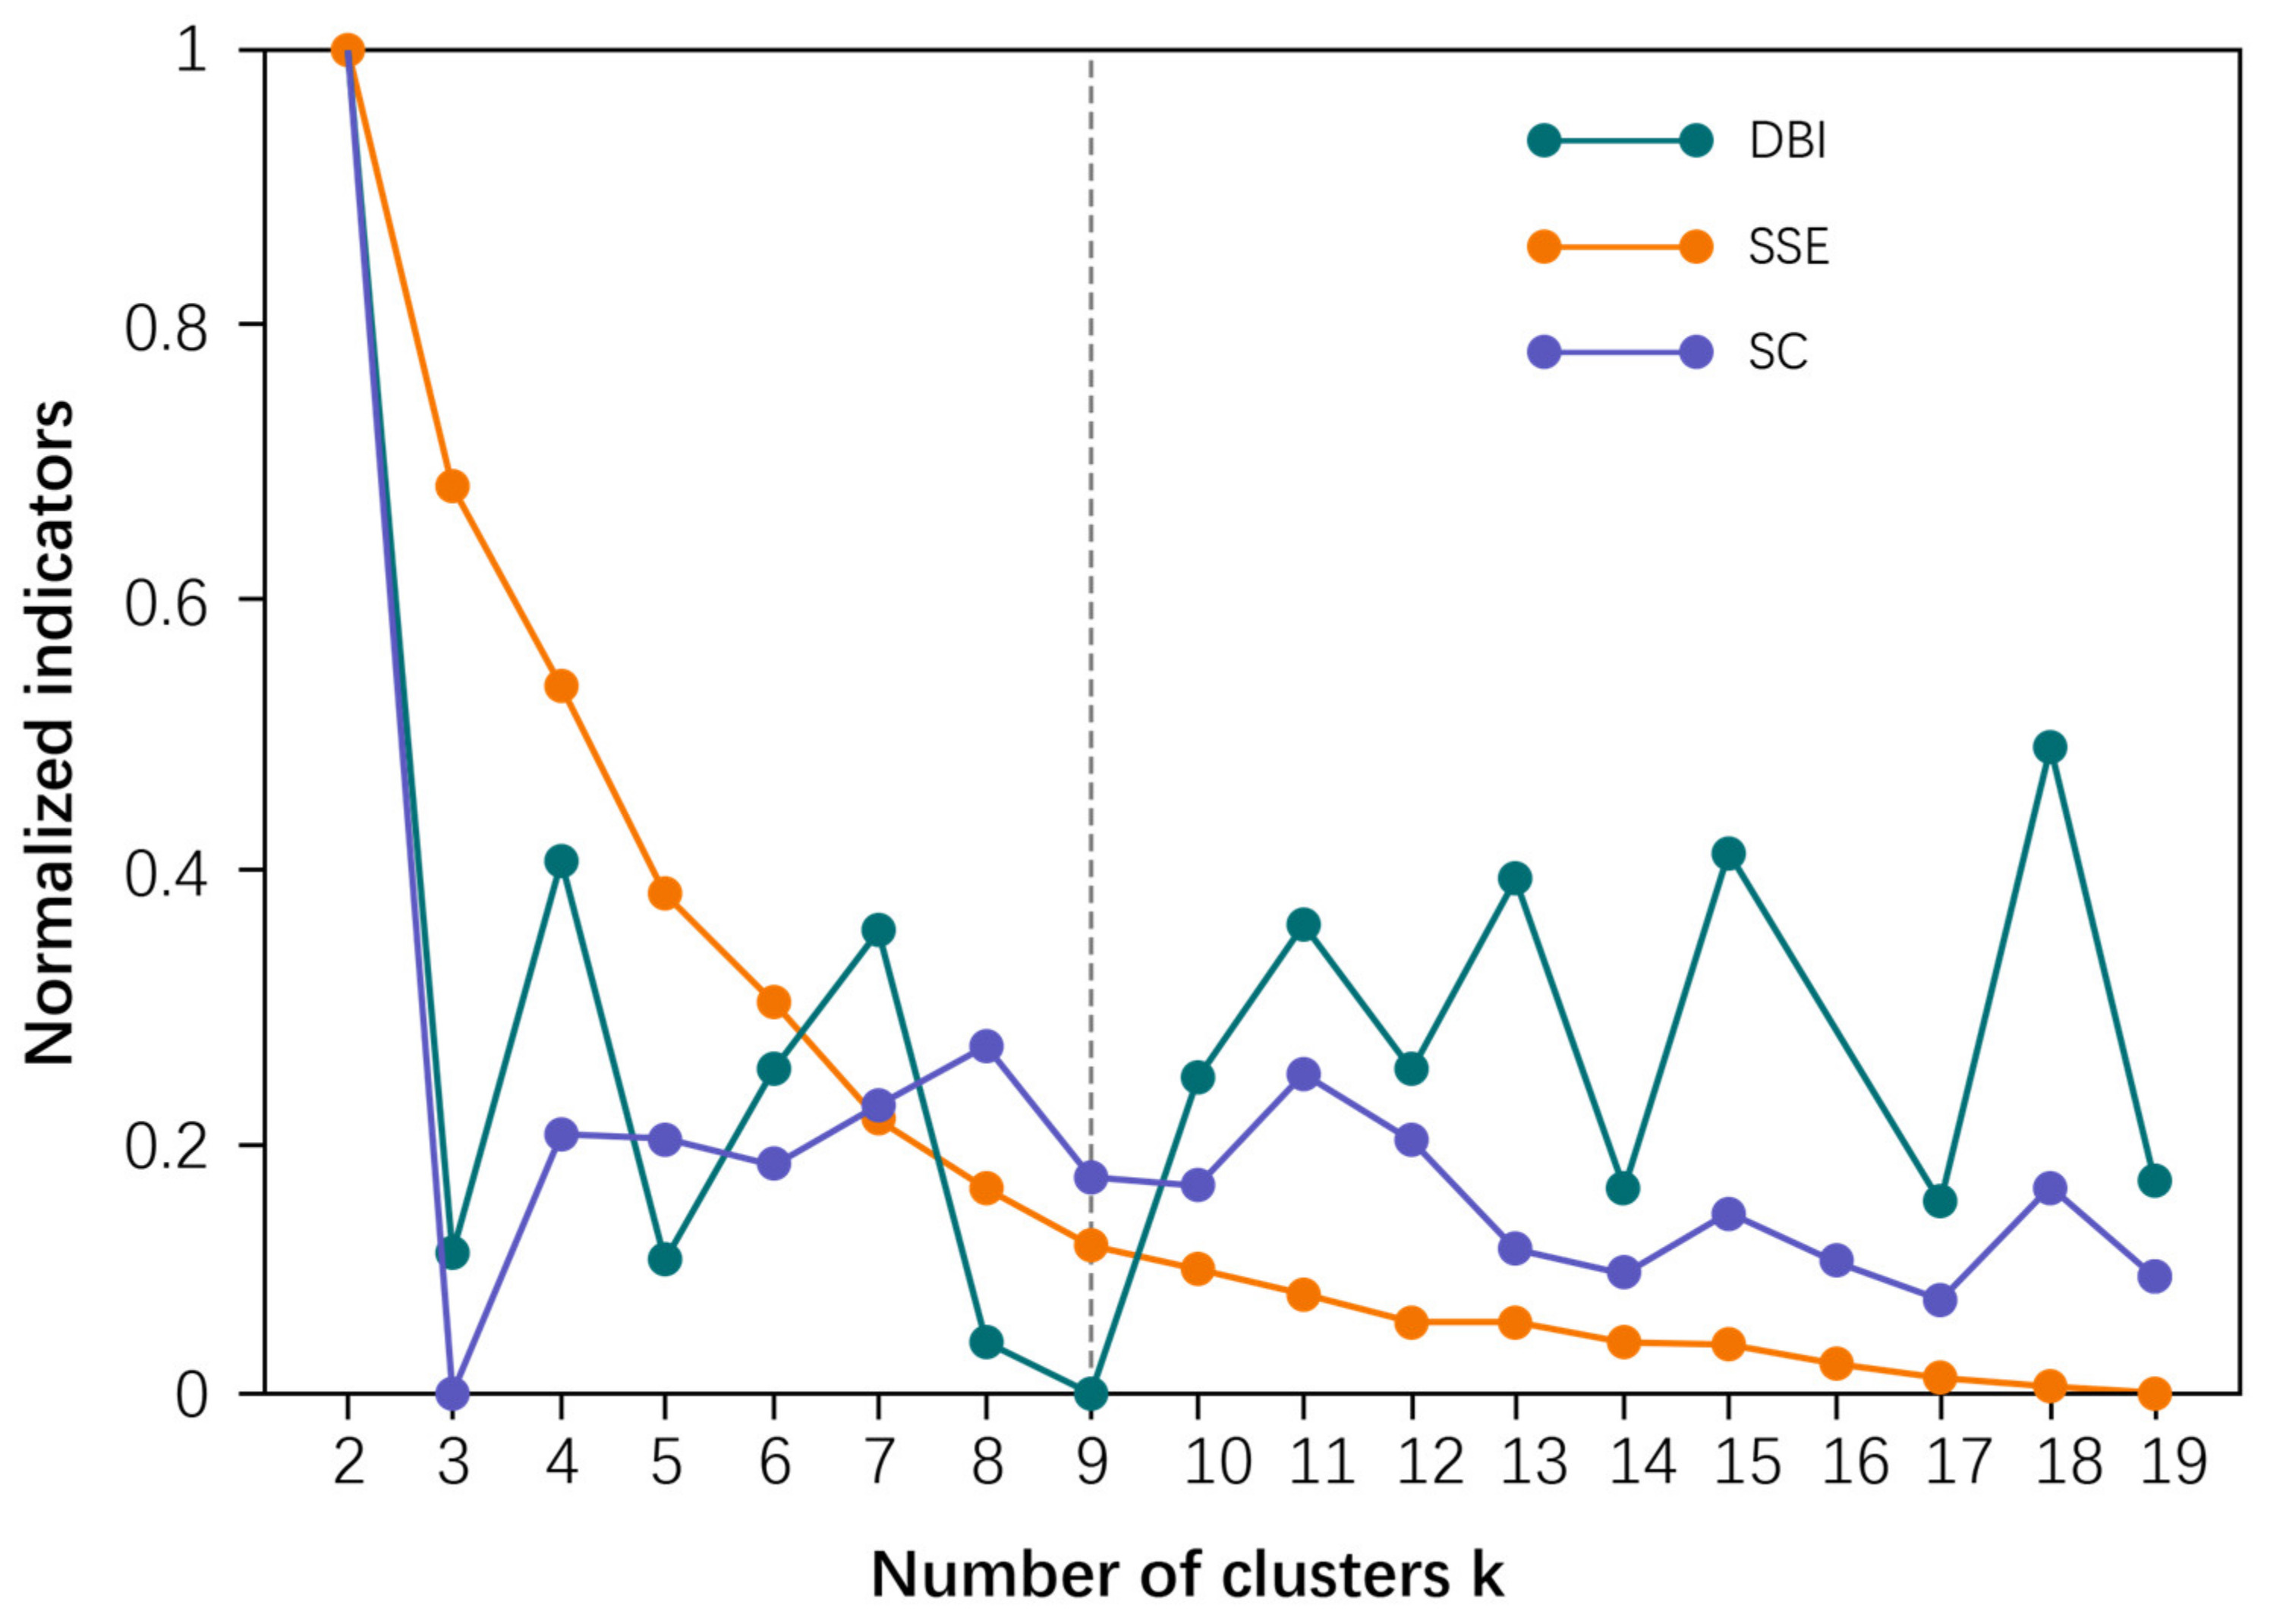
- Dimensionality reduction via BRF-FS: Feature variables underwent robust standardization, with land-use equilibrium indices (land supply capacity and development intensity) serving as target variables. The BRF-FS algorithm compared original features with shadow features to eliminate redundant variables. Cluster optimization analyzed inflection points in within-cluster sum of squares, silhouette coefficients, and Davies–Bouldin index curves. K-means++ clustering was subsequently applied to generate station typology labels using retained features.
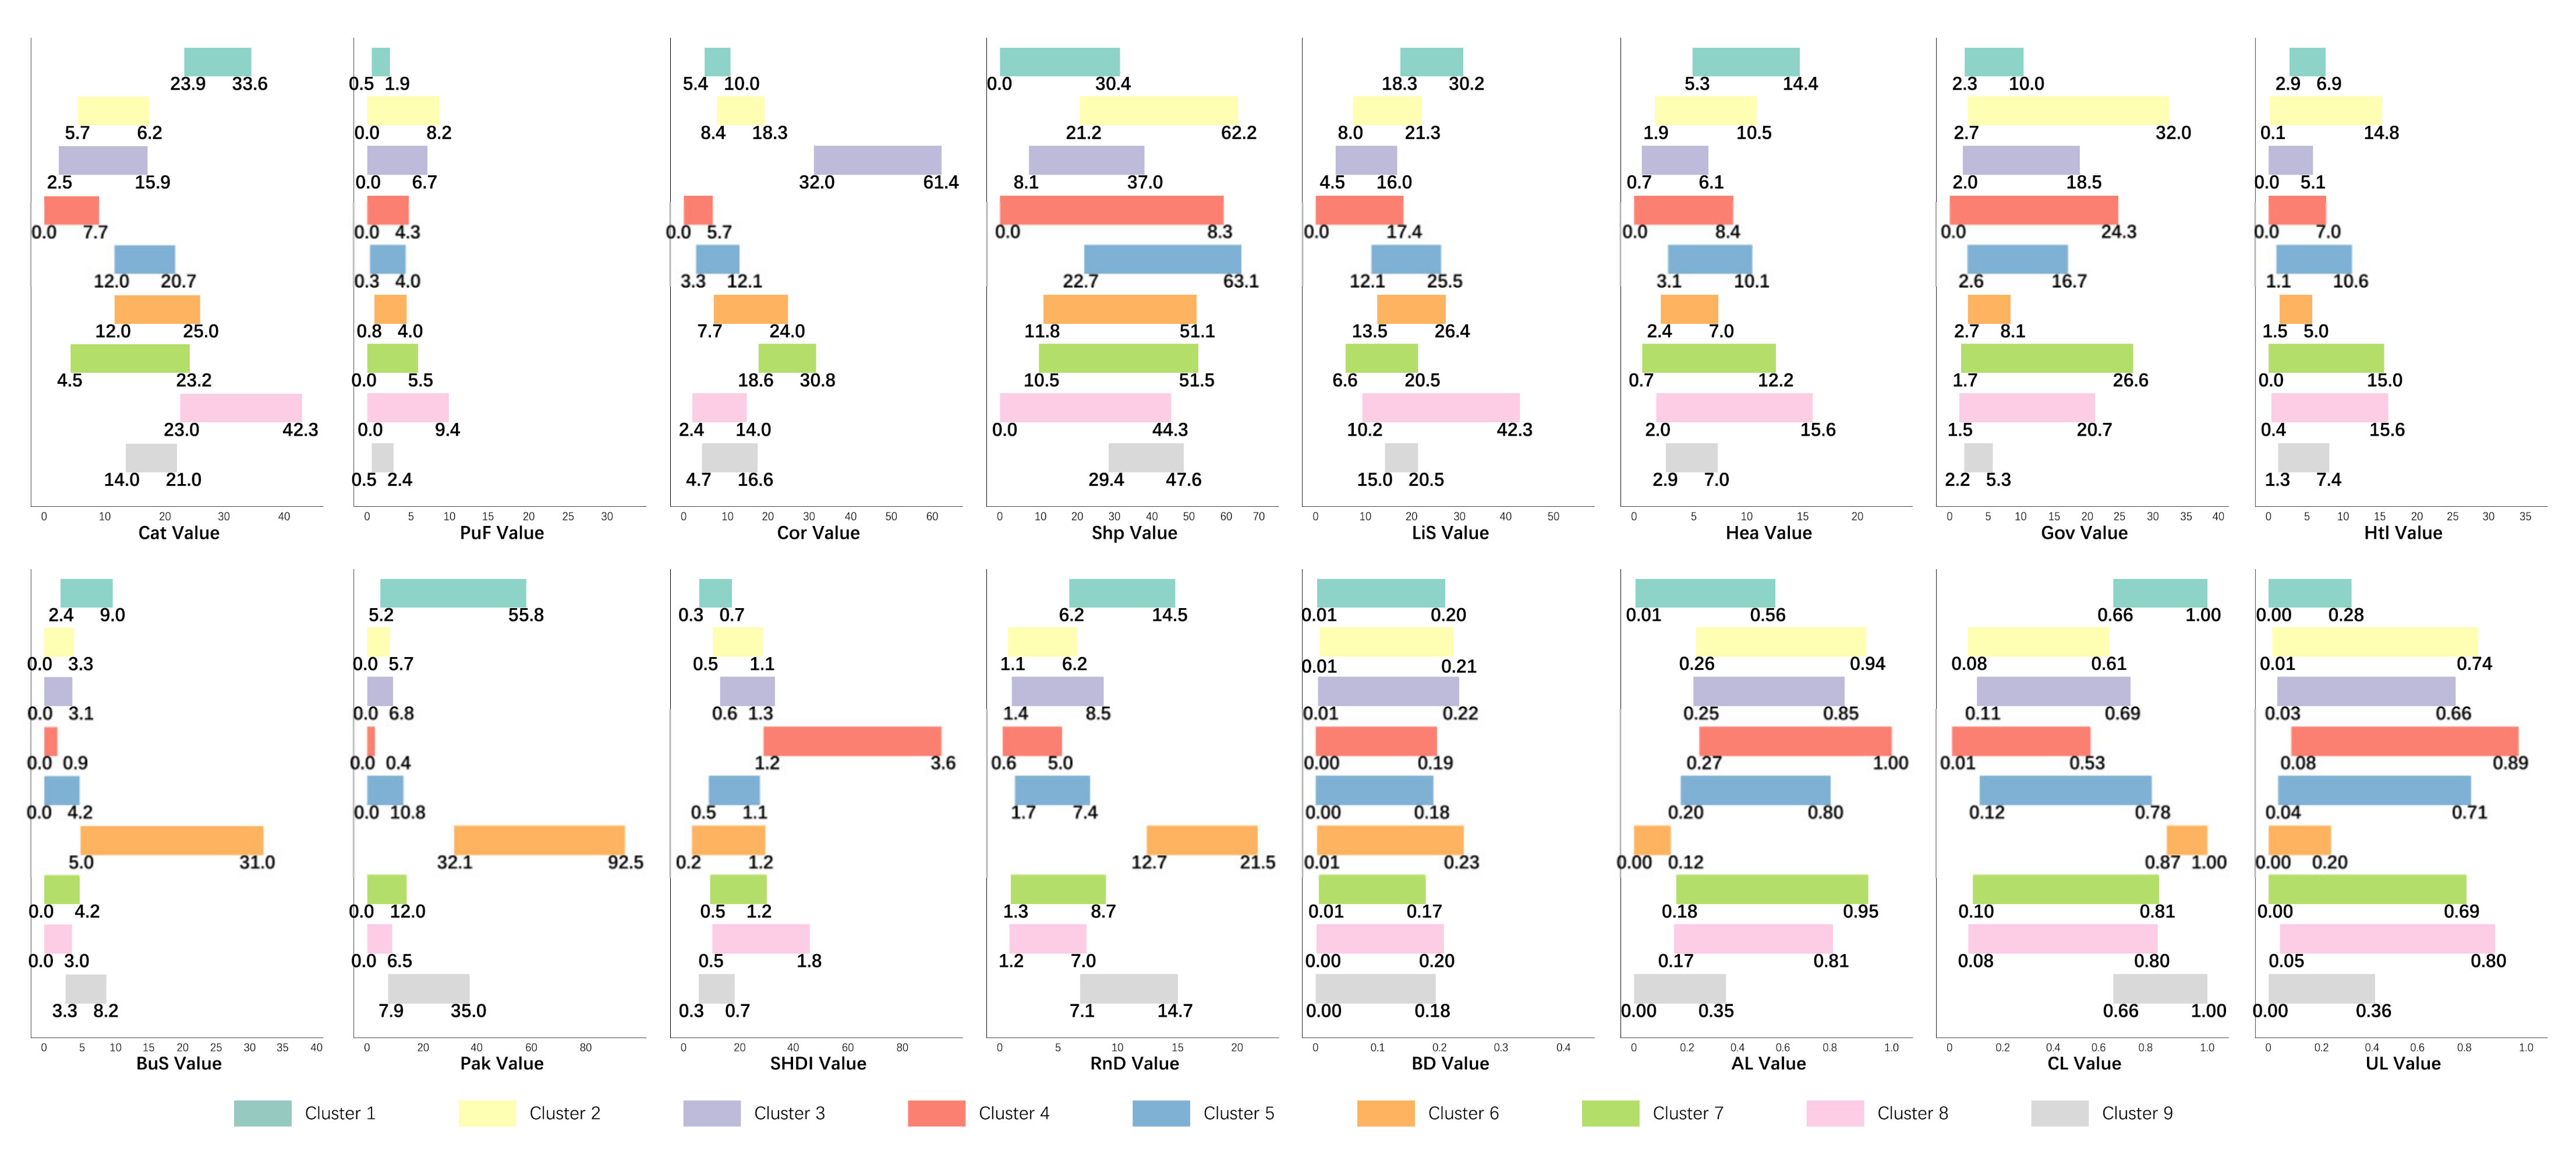
- Typology-driven assessment: Cluster labels were integrated with feature variables to derive comprehensive station-specific profiles. Three sequential analyses were executed: (1) cluster evaluation using robust standardized values and feature importance rankings, (2) land-use equilibrium analysis through supply capacity and development intensity diagnostics, and (3) reference interval establishment via normality testing. These analytical dimensions systematically informed feasible development recommendations for station areas.
3. Data
3.1. Raw Data
3.2. Direct Feature Variable
3.3. Derived Feature Variable
3.3.1. POI Variable
3.3.2. Urban Morphology Variable
3.3.3. Land-Use Variable
3.3.4. Complex Network Variable
3.4. Target Variable
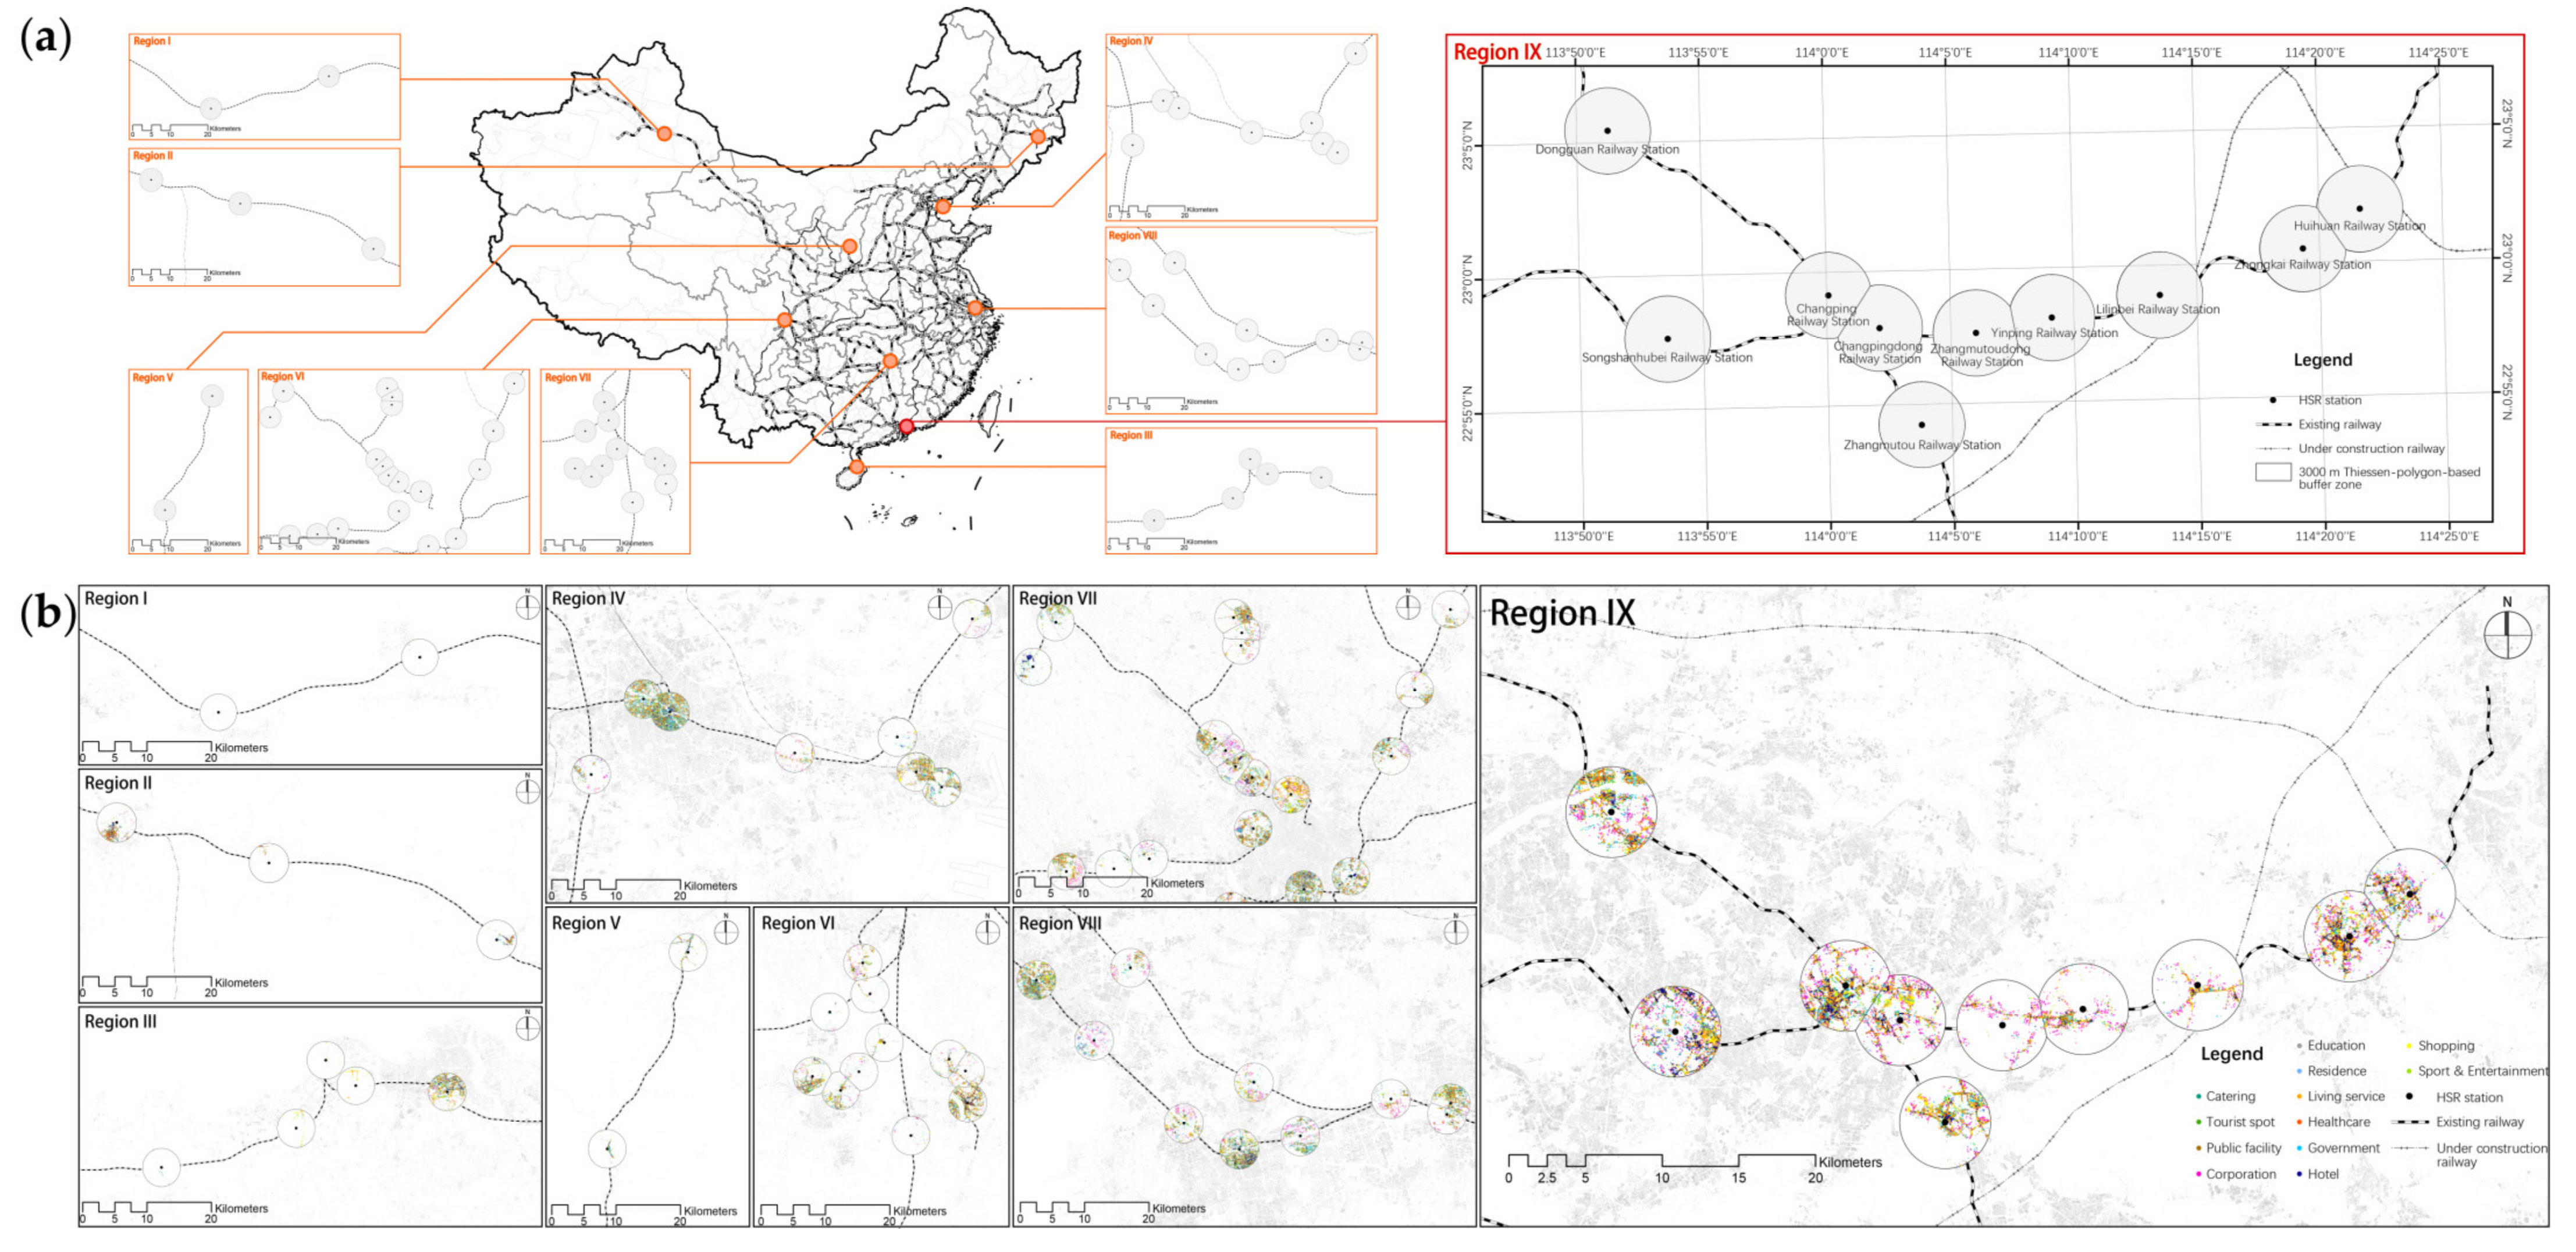
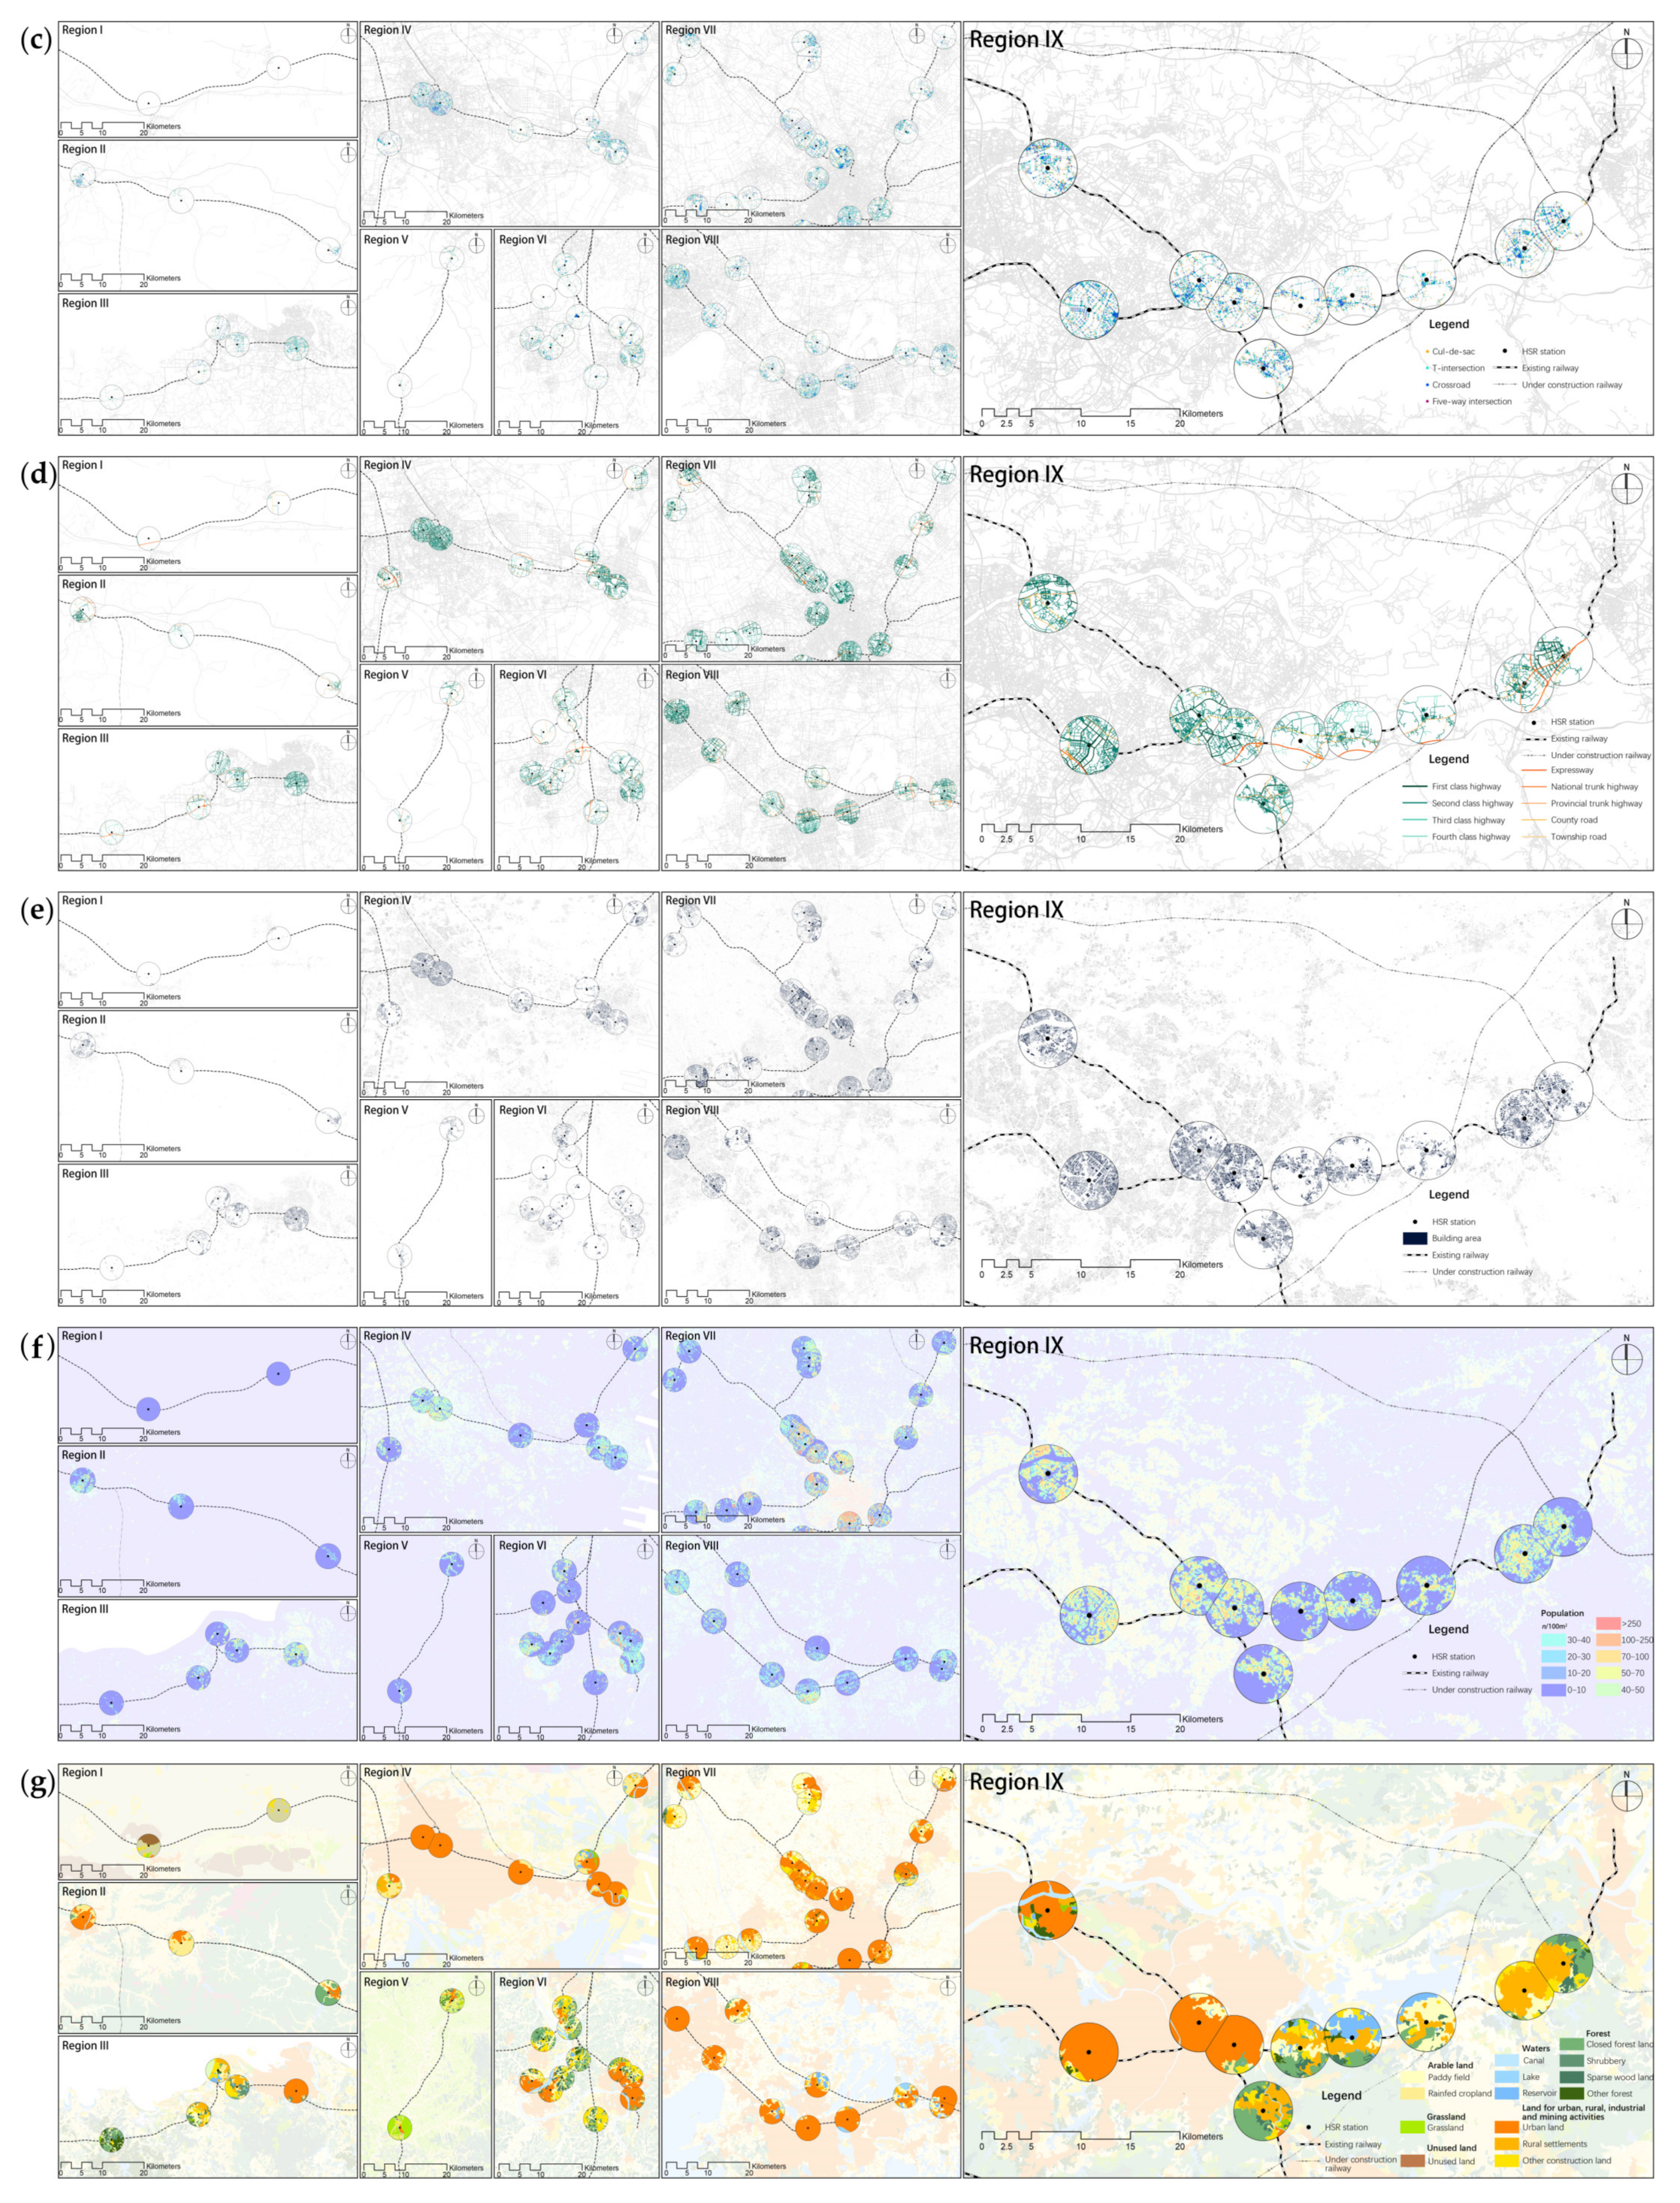
3.5. Data Visualization
4. Methods
4.1. Dimensionality Reduction
4.1.1. Robust Standardization
4.1.2. Random Forest
4.1.3. Boruta Algorithm
4.2. K-Means++ Clustering Algorithm
4.3. Threshold Reference Range Analysis
- For samples exhibiting normal or approximately normal distributions, the parameter settings of the probability interval were determined as (μ − σ, μ + 2σ) to achieve a normal distribution probability of 83.9% [85], considering the specific developmental characteristics and functional requirements of the research subject. This interval design addresses bidirectional control needs in planning indicators, thereby maintaining flexibility for positive development while establishing baseline thresholds. Subject to parameter value ranges, the upper and lower bounds of the reference range may require subsequent adjustments. Specifically, variables with a value range ≥ 0 but exhibiting a fitted lower bound <0 had their reference intervals modified to [0, μ + 2σ) accordingly.
- For samples with non-normally distributed data, the reference ranges of skewed distribution parameters were determined using non-parametric methods (P13.5–P97.5) while maintaining conceptual alignment with the probability intervals established for normal or approximately normal distributions.
5. Results
5.1. BRF-FS Results
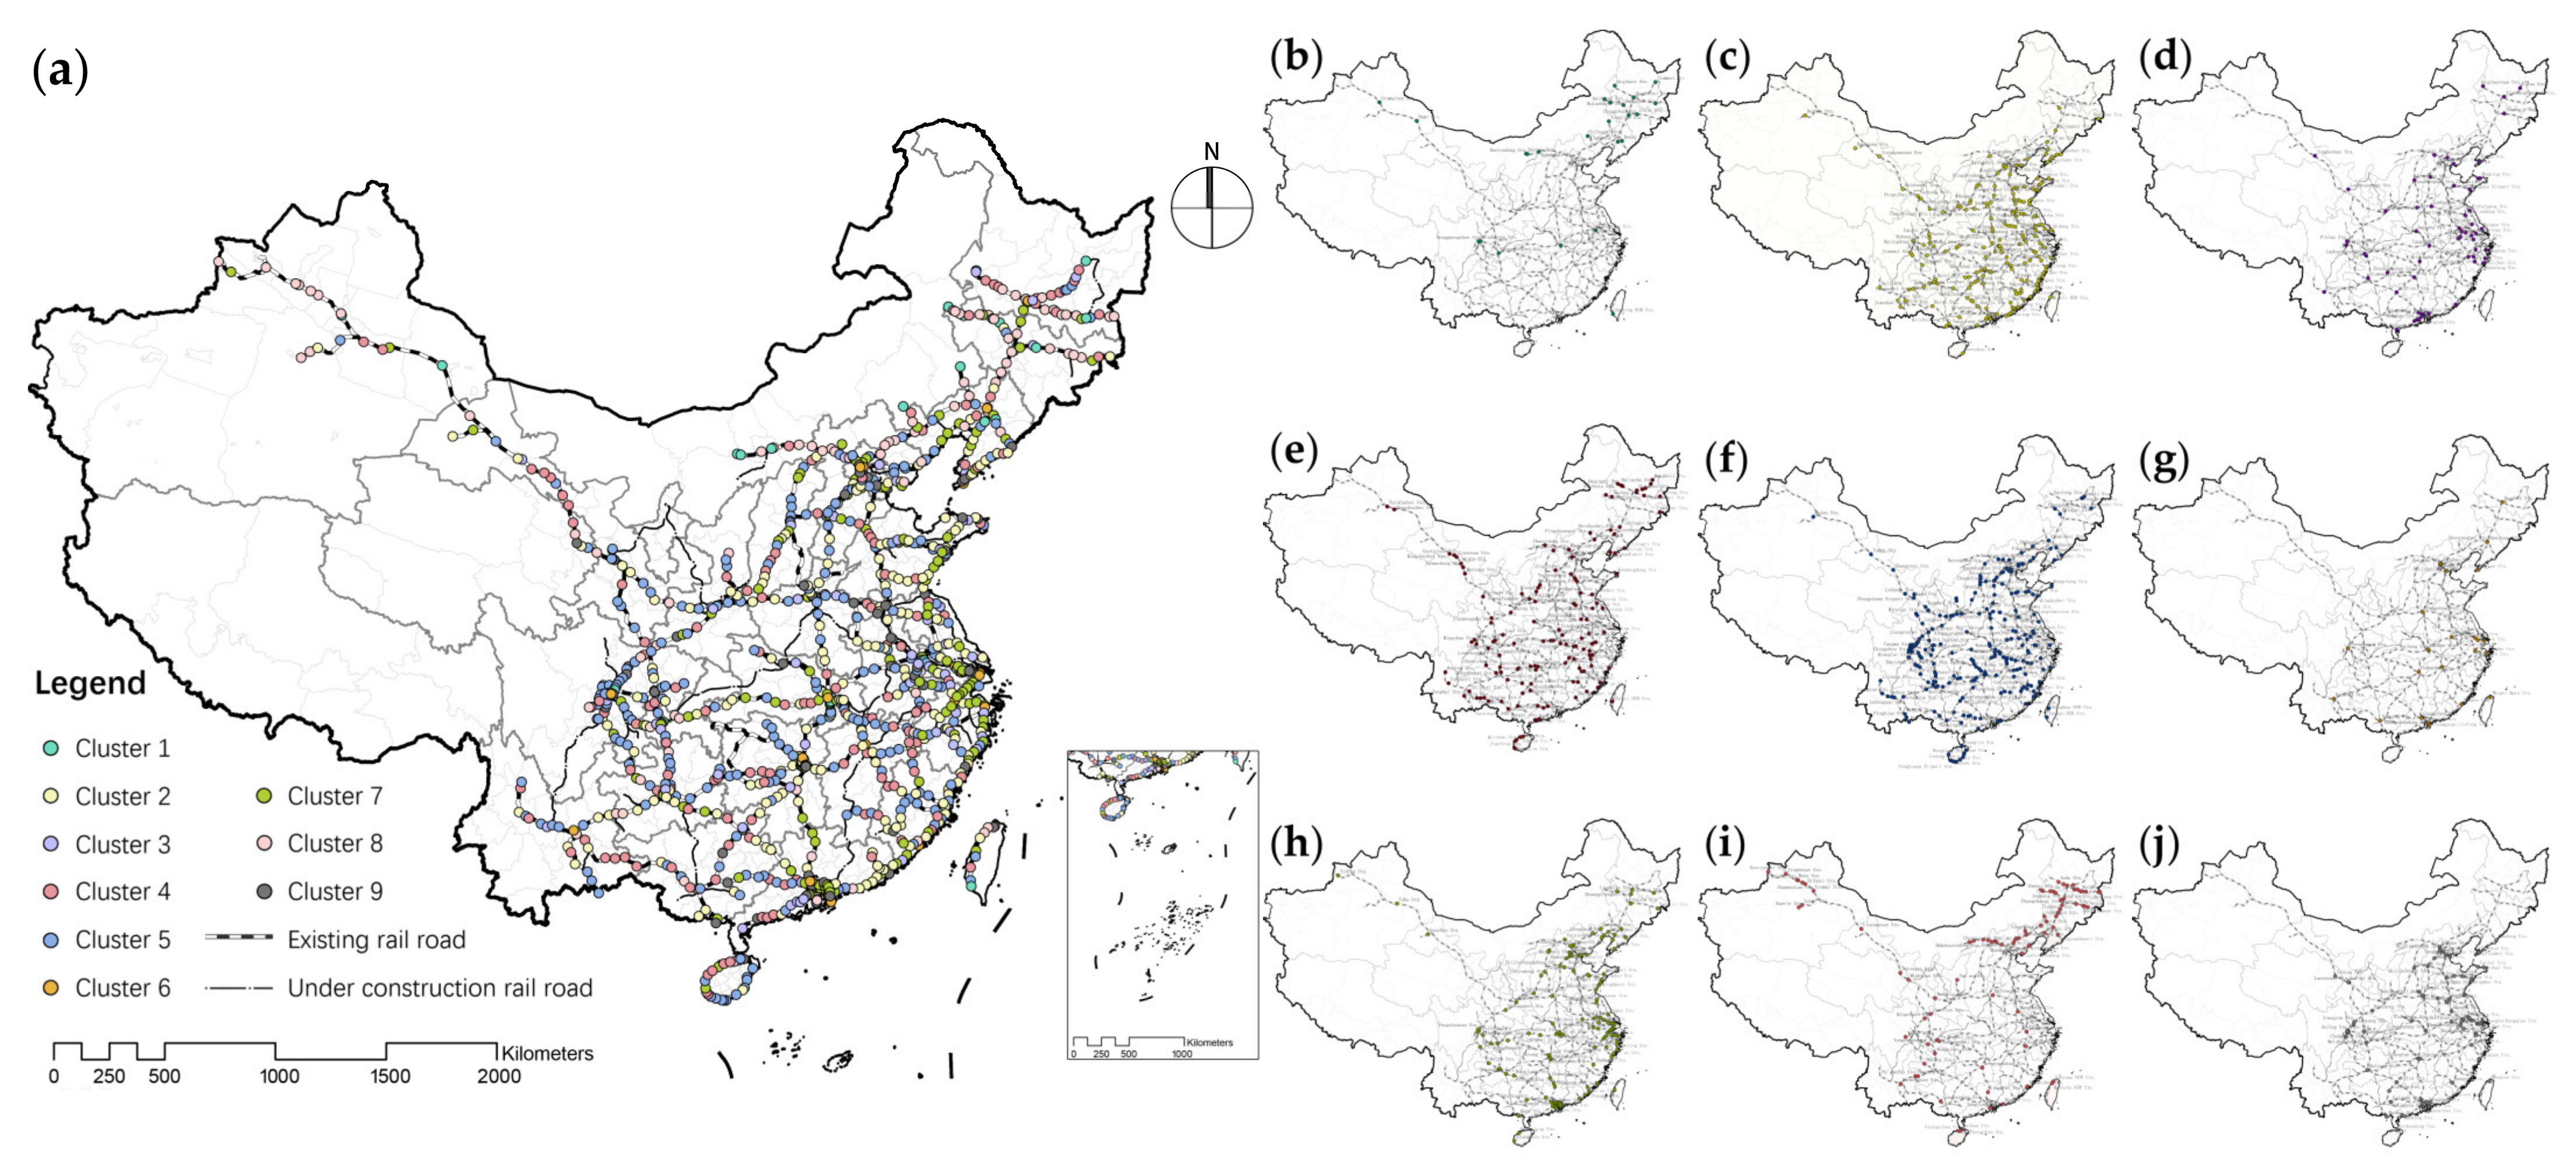
5.2. Clustering Results
6. Discussion
6.1. Cluster Characterization
6.2. Land-Use Equilibrium Assessment
6.3. Cluster-Specific Threshold Reference Ranges
6.4. HSR Station Area Development Strategies
7. Conclusions
Author Contributions
Funding
Data Availability Statement
Conflicts of Interest
Abbreviations
| HSR | High-speed railway | TOD | Transit-oriented development |
| GIS | Geographic information systems | BRF-FS | Boruta–random forest feature selection |
| RF | Random forest | VIF | Variance inflation factor |
| POI | Point of interest | VAIZ | Voronoi-adjusted influence zone |
| UIC | International Union of Railways | DtD | Distance to downtown |
| Pls | Platforms | Trs | Tracks |
| Cat | Catering | ToS | Tourist spot |
| PuF | Public facility | Cor | Corporation |
| Shp | Shopping | Edu | Education |
| LiS | Living service | Hea | Healthcare |
| Gov | Government | Htl | Hotel |
| SpE | Sport and entertainment | BuS | Bus stop |
| Pak | Parking | SHDI | Shannon diversity index |
| EI | Evenness index | BD | Building density |
| RnD | Road network density | RnC | Road network connectivity |
| FL | Farm land | CL | Construction land |
| UL | Unused land | DC | Degree centrality |
| CC | Closeness centrality | BC | Betweenness centrality |
| LS | Land supply capacity | LD | Land demand intensity |
| EA | Economic agglomeration | RS | Resource security |
| ES | Ecological safety | EV | Ecosystem value |
| DB | Development breadth | PD | Population density |
| ED | Economic density | EC | Environmental carrying capacity |
| IQR | Interquartile range | SSE | Sum of squares due to an error |
| SC | Silhouette coefficient | DBI | Davies–Bouldin index |
References
- Ahlfeldt, G.M.; Feddersen, A. From Periphery to Core: Measuring Agglomeration Effects Using High-Speed Rail. J. Econ. Geogr. 2018, 18, 355–390. [Google Scholar] [CrossRef]
- Ke, X.; Chen, H.; Hong, Y.; Hsiao, C. Do China’s High-Speed-Rail Projects Promote Local Economy?—New Evidence from a Panel Data Approach. China Econ. Rev. 2017, 44, 203–226. [Google Scholar] [CrossRef]
- Yang, X.; Zhang, H.; Lin, S.; Zhang, J.; Zeng, J. Does High-Speed Railway Promote Regional Innovation Growth or Innovation Convergence? Technol. Soc. 2021, 64, 101472. [Google Scholar] [CrossRef]
- Wang, C.; Chen, J.; Li, B.; Chen, N.; Wang, W. Impact of High-Speed Railway Construction on Spatial Patterns of Regional Economic Development Along the Route: A Case Study of the Shanghai–Kunming High-Speed Railway. Socio-Econ. Plan. Sci. 2023, 87, 101583. [Google Scholar] [CrossRef]
- Amos, P.; Amos, P.; Bullock, D.; Sondhi, J. High-Speed Rail the Fast Track to Economic Development? World Bank: Washington, DC, USA, 2010. [Google Scholar]
- CGTN China-Built Jakarta-Bandung High-Speed Railway Begins Operation 2023. Available online: https://news.cgtn.com/news/2023-10-18/China-built-Jakarta-Bandung-high-speed-railway-begins-operation-1o0a68je8rm/index.html (accessed on 4 September 2024).
- Shen, Q.; Pan, Y.; Feng, Y. The Impacts of High-Speed Railway on Environmental Sustainability: Quasi-Experimental Evidence from China. Humanit. Soc. Sci. Commun. 2023, 10, 719. [Google Scholar] [CrossRef]
- Dong, L.; Du, R.; Kahn, M.; Ratti, C.; Zheng, S. “Ghost Cities” Versus Boom Towns: Do China’s High-Speed Rail New Towns Thrive? Reg. Sci. Urban Econ. 2021, 89, 103682. [Google Scholar] [CrossRef]
- Zheng, L.; Long, F.; Chang, Z.; Ye, J. Ghost Town or City of Hope? The Spatial Spillover Effects of High-Speed Railway Stations in China. Transp. Policy 2019, 81, 230–241. [Google Scholar] [CrossRef]
- Salvati, L.; Serra, P. Estimating Rapidity of Change in Complex Urban Systems: A Multidimensional, Local-Scale Approach. Geogr. Anal. 2016, 48, 132–156. [Google Scholar] [CrossRef]
- Zhang, G.; Zheng, D.; Wu, H.; Wang, J.; Li, S. Assessing the Role of High-Speed Rail in Shaping the Spatial Patterns of Urban and Rural Development: A Case of the Middle Reaches of the Yangtze River, China. Sci. Total Environ. 2020, 704, 135399. [Google Scholar] [CrossRef]
- Zhang, C.; Xia, H.; Song, Y. Rail Transportation Lead Urban Form Change: A Case Study of Beijing. Urban Rail Transit 2017, 3, 15–22. [Google Scholar] [CrossRef]
- Sun, X.; Yan, S.; Liu, T.; Wu, J. High-Speed Rail Development and Urban Environmental Efficiency in China: A City-Level Examination. Transp. Res. Part D Transp. Environ. 2020, 86, 102456. [Google Scholar] [CrossRef]
- Cheng, J.; Hu, L.; Zhang, J.; Lei, D. Understanding the Synergistic Effects of Walking Accessibility and the Built Environment on Street Vitality in High-Speed Railway Station Areas. Sustainability 2024, 16, 5524. [Google Scholar] [CrossRef]
- Xia, X.; Li, H.; Wang, K.; Liu, Y. Analysis of the Impact of High-Speed Rail on the Spatio-Temporal Distribution of Residential Population and Industrial Structure. Heliyon 2023, 9, e21088. [Google Scholar] [CrossRef]
- Wang, F.; Wei, X.; Liu, J.; He, L.; Gao, M. Impact of High-Speed Rail on Population Mobility and Urbanisation: A Case Study on Yangtze River Delta Urban Agglomeration, China. Transp. Res. Part A Policy Pract. 2019, 127, 99–114. [Google Scholar] [CrossRef]
- Vickerman, R. High-Speed Rail and Regional Development: The Case of Intermediate Stations. J. Transp. Geogr. 2015, 42, 157–165. [Google Scholar] [CrossRef]
- Deng, T.; Gan, C.; Perl, A.; Wang, D. What Caused Differential Impacts on High-Speed Railway Station Area Development? Evidence from Global Nighttime Light Data. Cities 2020, 97, 102568. [Google Scholar] [CrossRef]
- Du, Z.; Wu, W.; Liu, Y.; Zhi, W.; Lu, W. Evaluation of China’s High-Speed Rail Station Development and Nearby Human Activity Based on Nighttime Light Images. Int. J. Environ. Res. Public Health 2021, 18, 557. [Google Scholar] [CrossRef]
- Xu, J.; Li, W. High-Speed Rail and Industrial Agglomeration: Evidence from China’s Urban Agglomerations. Land 2023, 12, 1570. [Google Scholar] [CrossRef]
- Tomaney, J.; Marques, P. Evidence, Policy, and the Politics of Regional Development: The Case of High-Speed Rail in the United Kingdom. Environ. Plan. C Gov. Policy 2013, 31, 414–427. [Google Scholar] [CrossRef]
- Wang, B.; Ersoy, A.; van Bueren, E.; de Jong, M. Rules for the Governance of Transport and Land Use Integration in High-Speed Railway Station Areas in China: The Case of Lanzhou. Urban Policy Res. 2022, 40, 122–141. [Google Scholar] [CrossRef]
- Heeres, N.; Tillema, T.; Arts, J. Dealing with Interrelatedness and Fragmentation in Road Infrastructure Planning: An Analysis of Integrated Approaches Throughout the Planning Process in The Netherlands. Plan. Theory Pract. 2016, 17, 421–443. [Google Scholar] [CrossRef]
- Lee, J.H.; Lim, S. The Selection of Compact City Policy Instruments and Their Effects on Energy Consumption and Greenhouse Gas Emissions in the Transportation Sector: The Case of South Korea. Sustain. Cities Soc. 2018, 37, 116–124. [Google Scholar] [CrossRef]
- Zheng, W.; Wei, S. A ‘Node-Place-Network-City’ Framework to Examine HSR Station Area Development Dynamics: Station Typologies and Development Strategies. J. Transp. Geogr. 2024, 120, 103993. [Google Scholar] [CrossRef]
- Wang, H.-C. Prioritizing Compactness for a Better Quality of Life: The Case of US Cities. Cities 2022, 123, 103566. [Google Scholar] [CrossRef]
- Jama, T.; Tenkanen, H.; Lönnqvist, H.; Joutsiniemi, A. Compact City and Urban Planning: Correlation Between Density and Local Amenities. Environ. Plan. B Urban Anal. City Sci. 2025, 52, 44–58. [Google Scholar] [CrossRef]
- Burton, E. The Compact City: Just or Just Compact? A Preliminary Analysis. Urban Stud. 2000, 37, 1969–2006. [Google Scholar] [CrossRef]
- Gui, W.; Cheng, T. From Station to City: A Study on Integrated Development of Public Space Within the Catchment Area of Large Railway Stations. Archit. J. 2018, 6, 36–39. [Google Scholar]
- Liang, Y.; Song, W.; Dong, X. Evaluating the Space Use of Large Railway Hub Station Areas in Beijing Toward Integrated Station-City Development. Land 2021, 10, 1267. [Google Scholar] [CrossRef]
- Dou, M.; Wang, Y.; Dong, S. Integrating Network Centrality and Node-Place Model to Evaluate and Classify Station Areas in Shanghai. ISPRS Int. J. Geo-Inf. 2021, 10, 414. [Google Scholar] [CrossRef]
- Mu, R.; de Jong, M. Establishing the Conditions for Effective Transit-Oriented Development in China: The Case of Dalian. J. Transp. Geogr. 2012, 24, 234–249. [Google Scholar] [CrossRef]
- Li, K.; Jin, X.; Ma, D.; Jiang, P. Evaluation of Resource and Environmental Carrying Capacity of China’s Rapid-Urbanization Areas—A Case Study of Xinbei District, Changzhou. Land 2019, 8, 69. [Google Scholar] [CrossRef]
- Zhang, H.; Li, X.; Liu, X.; Chen, Y.; Ou, J.; Niu, N.; Jin, Y.; Shi, H. Will the Development of a High-Speed Railway Have Impacts on Land Use Patterns in China? Ann. Am. Assoc. Geogr. 2019, 109, 979–1005. [Google Scholar] [CrossRef] [PubMed]
- Liu, D.; Feng, Z.; Yang, Y.; You, Z. Spatial Patterns of Ecological Carrying Capacity Supply-Demand Balance in China at County Level. J. Geogr. Sci. 2011, 21, 833–844. [Google Scholar] [CrossRef]
- Li, J.; Qian, Y.; Zeng, J.; Yin, F.; Zhu, L.; Guang, X. Research on the Influence of a High-Speed Railway on the Spatial Structure of the Western Urban Agglomeration Based On Fractal Theory—Taking the Chengdu–Chongqing Urban Agglomeration as an Example. Sustainability 2020, 12, 7550. [Google Scholar] [CrossRef]
- Yue, Y.; Chen, J.; Feng, T.; Ma, X.; Wang, W.; Bai, H. Classification and Determinants of High-Speed Rail Stations Using Multi-Source Data: A Case Study in Jiangsu Province, China. Sustain. Cities Soc. 2023, 96, 104640. [Google Scholar] [CrossRef]
- Rahman, M.H.; Islam, M.H.; Neema, M.N. GIS-Based Compactness Measurement of Urban Form at Neighborhood Scale: The Case of Dhaka, Bangladesh. J. Urban Manag. 2022, 11, 6–22. [Google Scholar] [CrossRef]
- Shen, Y.; de Abreu e Silva, J.; Martínez, L.M. Assessing High-Speed Rail’s Impacts on Land Cover Change in Large Urban Areas Based On Spatial Mixed Logit Methods: A Case Study of Madrid Atocha Railway Station from 1990 to 2006. J. Transp. Geogr. 2014, 41, 184–196. [Google Scholar] [CrossRef]
- Yang, D.; Sun, N. Exploring Tran-Scalar and Multi-Factor Impacts of Dalian High-Speed Railway Station on the Surrounding Area Development. Urban Plan. Forum 2014, 5, 86–91. [Google Scholar]
- Xu, W.; Wang, X. A Study on Characteristics of Spatiai Development and Construction of High-Speed Railway Station Areas—An Empirical Analysis Based on the Case of Beijing-Shanghai High-Speed Railway Line. Urban Plan. Forum 2016, 1, 72–79. [Google Scholar] [CrossRef]
- Karimi, F.; Sultana, S.; Babakan, A.S.; Suthaharan, S. Urban Expansion Modeling Using an Enhanced Decision Tree Algorithm. GeoInformatica 2021, 25, 715–731. [Google Scholar] [CrossRef]
- Kursa, M.B.; Rudnicki, W.R. Feature Selection with the Boruta Package. J. Stat. Softw. 2010, 36, 1–13. [Google Scholar] [CrossRef]
- International Union of Railways (UIC). High-Speed Around the World: Historical, Geographical, and Technological Development; Passenger and High Speed Department: Paris, France, 2023. [Google Scholar]
- Zou, S.; Fan, X.; Wang, L.; Cui, Y. High-Speed Rail New Towns and Their Impacts on Urban Sustainable Development: A Spatial Analysis Based on Satellite Remote Sensing Data. Humanit. Soc. Sci. Commun. 2024, 11, 894. [Google Scholar] [CrossRef]
- Wang, X.; Liu, J.; Zhang, W. How Does the Spatial Structure of High-Speed Rail Station Areas Evolve? A Case Study of Zhengzhou East Railway Station, China. Appl. Sci. 2021, 11, 11132. [Google Scholar] [CrossRef]
- Wang, L.; Gu, H.; Wang, L.; Gu, H. Comparative Analysis of Planning and Development of HSR New Towns. In Studies on China’s High-Speed Rail New Town Planning and Development; Springer: Singapore, 2019; pp. 165–243. [Google Scholar]
- Zhu, P. Does High-Speed Rail Stimulate Urban Land Growth? Experience from China. Transp. Res. Part D Transp. Environ. 2021, 98, 102974. [Google Scholar] [CrossRef]
- Duan, J.; Hillerl, B. Spatial Syntax in China; Southeast University Press: Nanjing, China, 2015. [Google Scholar]
- Chen, Z.; Haynes, K.E. Impact of High-Speed Rail on Regional Economic Disparity in China. J. Transp. Geogr. 2017, 65, 80–91. [Google Scholar] [CrossRef]
- Wang, L.; Acheampong, R.A.; He, S. High-Speed Rail Network Development Effects on the Growth and Spatial Dynamics of Knowledge-Intensive Economy in Major Cities of China. Cities 2020, 105, 102772. [Google Scholar] [CrossRef]
- Cervero, R.; Kockelman, K. Travel Demand and the 3Ds: Density, Diversity, and Design. Transp. Res. Part D Transp. Environ. 1997, 2, 199–219. [Google Scholar] [CrossRef]
- Oliveira, V. Urban Morphology; Springer: Cham, Switzerland, 2020. [Google Scholar]
- Shi, Q.; Zhu, J.; Liu, Z.; Guo, H.; Liu, M.; Liu, Z.; Liu, X. A First High-Quality Vector Data of Buildings in East Asian Countries Based On a Comprehensive Large-Scale Mapping Framework. 2023. Available online: https://doi.org/10.5281/zenodo.8174931.
- Jiyuan, L.; Mingliang, L.; Xiangzheng, D.; Dafang, Z.; Zengxiang, Z.; Di, L. The Land Use and Land Cover Change Database and Its Relative Studies in China. J. Geogr. Sci. 2002, 12, 275–282. [Google Scholar] [CrossRef]
- Roy, S.; Maji, A. High-Speed Rail Station Location Optimization Using Customized Utility Functions. IEEE Intell. Transp. Syst. Mag. 2022, 15, 26–35. [Google Scholar] [CrossRef]
- Peek, G.-J.; Bertolini, L.; De Jonge, H. Gaining Insight in the Development Potential of Station Areas: A Decade of Node-Place Modelling in The Netherlands. Plan. Pract. Res. 2006, 21, 443–462. [Google Scholar] [CrossRef]
- Wang, F.; Liu, Z.; Xue, P.; Dang, A. High-Speed Railway Development and Its Impact on Urban Economy and Population: A Case Study of Nine Provinces Along the Yellow River, China. Sustain. Cities Soc. 2022, 87, 104172. [Google Scholar] [CrossRef]
- Spinosa, A. From the “Green Station” to the “Blue Station”: The Role of the Renovation of Railway Stations in the Ecological Transition of Cities. Calculation Model and Possible Measures for Mitigation and Compensation of Impacts. City Territ. Archit. 2023, 10, 21. [Google Scholar] [CrossRef]
- Weber, E.; Bright, E.; McKee, J.; Sims, K.; Moehl, J.; Weaver, J.; Moore, B.; Cheriyadat, A.; Patlolla, D. LandScan HD Taiwan v1.0. 2014. Available online: https://landscan.ornl.gov/ (accessed on 10 October 2024). [CrossRef]
- Moehl, J.; Reith, A.; McKee, J.; Weber, E.; Laverdiere, M.; Swan, B.; Yang, H.; Hauser, T.; Rose, A.; Walters, S.; et al. LandScan HD China v1.0. 2023. Available online: https://landscan.ornl.gov/ (accessed on 10 October 2024). [CrossRef]
- Givoni, M.; Rietveld, P. The Access Journey to the Railway Station and Its Role in Passengers’ Satisfaction with Rail Travel. Transp. Policy 2007, 14, 357–365. [Google Scholar] [CrossRef]
- Li, Z.; Han, Z.; Xin, J.; Luo, X.; Su, S.; Weng, M. Transit Oriented Development Among Metro Station Areas in Shanghai, China: Variations, Typology, Optimization and Implications for Land Use Planning. Land Use Policy 2019, 82, 269–282. [Google Scholar] [CrossRef]
- Yang, L.; Yu, B.; Liang, Y.; Lu, Y.; Li, W. Time-Varying and Non-Linear Associations Between Metro Ridership and the Built Environment. Tunn. Undergr. Space Technol. 2023, 132, 104931. [Google Scholar] [CrossRef]
- Shannon, C.E. A Mathematical Theory of Communication. Bell Syst. Tech. J. 1948, 27, 379–423. [Google Scholar] [CrossRef]
- Moudon, A.V. Urban Morphology as an Emerging Interdisciplinary Field. Urban Morphol. 1997, 1, 3–10. [Google Scholar] [CrossRef]
- Scheer, B.C. The Epistemology of Urban Morphology. Urban Morphol. 2016, 20, 5–17. [Google Scholar] [CrossRef]
- Standing Committee of the National People’s Congress. Land Administration Law of the People’s Republic of China. 2020. Available online: http://www.npc.gov.cn/zgrdw/englishnpc/Law/2007-12/12/content_1383939.htm (accessed on 20 October 2024).
- Watts, D.J.; Strogatz, S.H. Collective Dynamics of ‘Small-World’ Networks. Nature 1998, 393, 440–442. [Google Scholar] [CrossRef] [PubMed]
- Barabási, A.-L.; Albert, R. Emergence of Scaling in Random Networks. Science 1999, 286, 509–512. [Google Scholar] [CrossRef] [PubMed]
- Scheer, B.C. The Evolution of Urban Form: Typology for Planners and Architects; Routledge: London, UK, 2017. [Google Scholar]
- Feng, L.; Hu, X. Construction Rules of Urban Rail Transit Network Based on Complex Network Eigenvalue. In Proceedings of the Sixth International Conference on Transportation Engineering, Chengdu, China, 20–22 September 2019; American Society of Civil Engineers: Reston, VA, USA, 2019; pp. 540–548. [Google Scholar]
- United Nations General Assembly. Transforming Our World: The 2030 Agenda for Sustainable Development; Resolution A/RES/70/1; United Nations: New York, NY, USA, 2015. [Google Scholar]
- Tan, S.; Liu, Q.; Li, Y. Spatial-Temporal Characteristics of Spatial Balance Degrees on Land Use in China. China Land Sci. 2017, 31, 40–46. [Google Scholar]
- Ma, A.; Gao, Y.; Zhao, W. Research on Territorial Spatial Development Non-Equilibrium and Temporal–Spatial Patterns from a Conjugate Perspective: Evidence from Chinese Provincial Panel Data. Land 2024, 13, 797. [Google Scholar] [CrossRef]
- Bian, D.; Yang, X.; Xiang, W.; Sun, B.; Chen, Y.; Babuna, P.; Li, M.; Yuan, Z. A New Model to Evaluate Water Resource Spatial Equilibrium Based on the Game Theory Coupling Weight Method and the Coupling Coordination Degree. J. Clean. Prod. 2022, 366, 132907. [Google Scholar] [CrossRef]
- Breiman, L. Random Forests. Mach. Learn. 2001, 45, 5–32. [Google Scholar] [CrossRef]
- Hastie, T.; Tibshirani, R.; Friedman, J. The Elements of Statistical Learning; Springer: New York, NY, USA, 2009. [Google Scholar]
- Efron, B.; Hastie, T. Computer Age Statistical Inference, Student Edition: Algorithms, Evidence, and Data Science; Cambridge University Press: Cambridge, UK, 2021; Volume 6. [Google Scholar]
- Speiser, J.L.; Miller, M.E.; Tooze, J.; Ip, E. A Comparison of Random Forest Variable Selection Methods for Classification Prediction Modeling. Expert. Syst. Appl. 2019, 134, 93–101. [Google Scholar] [CrossRef]
- Arthur, D.; Vassilvitskii, S. K-Means++: The Advantages of Careful Seeding; Stanford: Redwood City, CA, USA, 2006. [Google Scholar]
- Agarwal, M.; Jaiswal, R.; Pal, A. K-Means++ under Approximation Stability. Theor. Comput. Sci. 2015, 588, 37–51. [Google Scholar] [CrossRef]
- George, D. SPSS for Windows Step by Step: A Simple Study Guide and Reference, 17.0 Update, 10/e; Pearson Education India: Noida, India, 2011. [Google Scholar]
- Horn, P.S.; Pesce, A.J. Reference Intervals: An Update. Clin. Chim. Acta 2003, 334, 5–23. [Google Scholar] [CrossRef]
- Xin, J.; Wang, Z.; Deng, X.; Su, J. Sustainable Development of Strategic Regions in Urban Spaces: A Comparison Study of Rail Transit Central Stations Planning in China. 2024. Available online: https://www.researchgate.net/publication/382933224_Sustainable_Development_of_Strategic_Regions_in_Urban_Spaces_A_Comparison_Study_of_Rail_Transit_Central_Stations_Planning_in_China (accessed on 24 April 2025).
- Kuhn, M.; Johnson, K. Applied Predictive Modeling; Springer: New York, NY, USA, 2013; Volume 26. [Google Scholar]
- James, G.; Witten, D.; Hastie, T.; Tibshirani, R. An Introduction to Statistical Learning; Springer: New York, NY, USA, 2013; Volume 112. [Google Scholar]
- Sun, L.; Behind the Idle 26 High-Speed Railway Stations. China Bus. J. 2024. Available online: https://news.qq.com/rain/a/20240525A00AKA00 (accessed on 4 October 2024).


| Category | Raw Data | Unit | Description | Data Source 1 |
|---|---|---|---|---|
| POI | Catering | - | Number of POI within the 3 km radius VAIZ of HSR stations. | https://ditu.amap.com/ (accessed on 4 April 2025) |
| Tourist spot | ||||
| Public facility | ||||
| Corporation | ||||
| Shopping | ||||
| Education | ||||
| Residence | ||||
| Living service | ||||
| Healthcare | ||||
| Government | ||||
| Hotel | ||||
| Sport and entertainment | ||||
| Bus stop | ||||
| Parking | ||||
| HSR station area morphology | Road length | km | Total length of roads within the 3 km radius VAIZ. | https://ditu.amap.com/ (accessed on 26 April 2025) https://www.mapbox.com/ (accessed on 26 April 2025) |
| Cul-de-sac | - | Number of junctions adjacent to one road. | ||
| T-junction | - | Number of junctions adjacent to three roads. | ||
| Crossroad | - | Number of junctions adjacent to four roads. | ||
| Multi-leg junction | - | Number of junctions adjacent to five or more roads. | ||
| Building area | km2 | The horizontal projection area of land occupied by buildings within the 3 km radius VAIZ. | https://zenodo.org/records/8174931 (accessed on 26 April 2025) | |
| Farm land 2 | km2 | Land directly used for agricultural production within the 3 km radius VAIZ, including cultivated land, wooded land, grassland, land for farmland water conservancy, and water surfaces for breeding. | Resources and Environmental Sciences, Chinese Academy of Sciences (RESDC; http://www.resdc.cn) (accessed on 26 April 2025) | |
| Construction land | km2 | Land on which buildings and structures are put up within the 3 km radius VAIZ, including urban and rural housing and public facilities, industrial and mining use, building communications and water conservancy facilities, tourism, and building military installations. | ||
| Unused land | km2 | Land other than that for agricultural and construction uses within the 3 km radius VAIZ. | ||
| Network topology | Vector-based HSR network data | - | The vector-based HSR network data in shapefile format provide spatially explicit attribute fields including railway line nomenclature and topological connectivity, enabling spatial pattern analysis of station locations and line interdependencies through ArcGIS. | https://gitcode.com/open-source-toolkit/d9fe4 (accessed on 26 April 2025) |
| Socio- economic | Population | 104 | Population within the 3 km radius VAIZ. | https://landscan.ornl.gov/ 3 [60,61] (accessed on 26 April 2025) |
| City area | km2 | The area of the municipal administrative region where the HSR station is located. | Official website of the local government | |
| Secondary and tertiary industry GDP | CNY 18 | The output value of secondary and tertiary industries in the municipal administrative region where the HSR station is located. | ||
| General public budget revenue | CNY 18 | General public budget revenues in the municipal administrative region where the HSR station is located. | ||
| Ecology | Industrial SO2 emission | ton | The total amount of SO2 emitted into the atmosphere from fuel combustion and production processes by enterprises in the municipal administrative region where HSR station is located. | China City Statistical Yearbook 2020 |
| Water resource | 18 m3 | The sum of surface runoff and infiltration recharge of precipitation in the municipal administrative region where the HSR station is located. |
| Variable | Abbr. | Unit | Description | Min | Q1 * | Mid | Q3 * | Max | Data Source |
|---|---|---|---|---|---|---|---|---|---|
| Tracks | Trs | - | Number of HSR station tracks. | 2 | 4 | 5 | 8 | 34 | https://www.chalieche.com/ (accessed on 26 April 2025) https://www.railway.gov.tw/tra-tip-web/tip (accessed on 26 April 2025) |
| Platforms | Pls | - | Number of HSR station platforms. | 1 | 2 | 2 | 3 | 18 | |
| Daily trips | DTs | - | Number of trips stopping at the HSR station. | 1 | 22 | 52 | 114 | 1178 | |
| Distance to downtown | DtD | km | Geographic distance from the HSR station to the city center. | 0.394 | 8.873 | 28.484 | 53.052 | 338.516 | ArcGIS Euclidean distance analysis |
| Category | Variable | Abbr. | Unit | Description | Max | Min | Mean | Std. Dev | References |
|---|---|---|---|---|---|---|---|---|---|
| POI | Catering | Cat | 1/km2 | POI density within the 3 km radius VAIZ. | 59.259 | 0.000 | 12.448 | 8.204 | [63,64] |
| Tourist spot | ToS | 1/km2 | 48.529 | 0.000 | 0.898 | 2.557 | |||
| Public facility | PuF | 1/km2 | 33.333 | 0.000 | 1.220 | 2.303 | |||
| Corporation | Cor | 1/km2 | 62.500 | 0.000 | 11.177 | 10.111 | |||
| Shopping | Shp | 1/km2 | 71.569 | 0.000 | 26.766 | 17.846 | |||
| Education | Edu | 1/km2 | 31.818 | 0.000 | 4.354 | 3.602 | |||
| Living service | LiS | 1/km2 | 56.722 | 0.000 | 13.099 | 7.357 | |||
| Healthcare | Hea | 1/km2 | 24.017 | 0.000 | 4.179 | 3.214 | |||
| Government | Gov | 1/km2 | 40.236 | 0.000 | 6.099 | 5.948 | |||
| Hotel | Htl | 1/km2 | 36.842 | 0.000 | 2.647 | 3.467 | |||
| Sport and entertainment | SpE | 1/km2 | 78.095 | 0.000 | 3.213 | 6.886 | |||
| Bus stop | BuS | 1/km2 | 39.580 | 0.000 | 1.552 | 2.472 | |||
| Parking | Pak | 1/km2 | 93.060 | 0.000 | 4.455 | 11.333 | |||
| Evenness index | EI | - | Degree of uniform distribution of various types of POIs within the 3 km radius VAIZ. | 0.950 | 0.000 | 0.677 | 0.230 | [65] | |
| Shannon diversity index | SHDI | - | Degree of diversity of POIs within the 3 km radius VAIZ. | 2.639 | 0.131 | 0.852 | 0.607 | ||
| Urban morphology | Road network density | RnD | km/km2 | Ratio of the total length of all roads to the total area of the 3 km radius VAIZ. | 22.171 | 0.225 | 4.129 | 3.660 | [53,66,67] |
| Road network connectivity | RnC | - | Ratio of the total number of roads connected to road network nodes to the total number of nodes. | 3.409 | 0.364 | 2.786 | 0.364 | ||
| Building density | BD | % | Percentage of the building’s footprint area to the 3 km radius VAIZ. | 43.018 | 0.001 | 6.510 | 0.062 | ||
| Land-use | Farm land | FL | % | Percentage of the arable land area in the 3 km radius VAIZ. | 98.124 | 0.000 | 40.25 | 0.254 | [68] |
| Construction land | CL | % | Percentage of the construction land area in the 3 km radius VAIZ. | 100.000 | 0.109 | 35.478 | 0.284 | ||
| Unused land | UL | % | Percentage of the unused land area in the 3 km radius VAIZ. | 96.619 | 0.000 | 24.497 | 0.237 | ||
| Complex network | Between centrality | BC | - | Number of shortest paths through a node in a network. | 0.387 | 0.000 | 0.020 | 0.034 | [69,70] |
| Closeness centrality | CC | - | Degree of proximity between a certain node in the network and other nodes. | 0.060 | 0.020 | 0.038 | 0.010 | ||
| Degree centrality | DC | - | Number of edges connected to the node. | 6.000 | 1.000 | 2.177 | 1.382 |
| System | Subsystem | Abbr. | Unit | Description | Max | Min | Mean | Std. Dev |
|---|---|---|---|---|---|---|---|---|
| Land supply capacity (LS) | Economic agglomeration | EA | 106 CNY/km2 | Ratio of general public budget to construction land in the municipal administrative region where the HSR station is located. | 483.949 | 0.015 | 6.916 | 23.551 |
| Resource security | RS | 104 ton | Per capita water resources in the municipal administrative region where the HSR station is located. | 38.141 | 0.006 | 3.056 | 3.390 | |
| Ecological safety | ES | % | Percentage of wetlands, forests, grasslands, and nature reserves area in the 3 km radius VAIZ. | 96.490 | 0.000 | 23.350 | 0.232 | |
| Ecological value | EV | 108 CNY/km2 | Total economic value of all ecosystem services (e.g., climate regulation and landscape recreation) per land area unit. | 280.441 | 1.131 | 15.173 | 30.525 | |
| Land development intensity (LD) | Development breadth | DB | km2 | Construction land area in the 3 km radius VAIZ. | 28.253 | 0.005 | 9.789 | 7.768 |
| Population density | PD | 1/100 m2 | Number of people in the 3 km radius VAIZ. | 227.884 | 0.000 | 21.799 | 24.752 | |
| Economic density | ED | 106 CNY/km2 | Ratio of GDP of secondary and tertiary industries to the construction land area in the municipal administrative region where the HSR station is located | 122.127 | 0.352 | 5.027 | 5.512 | |
| Environmental carrying capacity | EC | ton/km2 | Ratio of SO2 emissions to the construction land area in the municipal administrative region where the HSR station is located | 154.353 | 0.112 | 13.255 | 18.549 |
| Variable | Trs | Pls | DTs | DtD | BC | CC | DC | Cat | ToS | PuF | Cor | Shp | Edu | LiS | Hea | Gov | Htl | SpE | BuS | Pak | EI | SHDI | RnD | RnC | BD | FL | CL | UL | |
|---|---|---|---|---|---|---|---|---|---|---|---|---|---|---|---|---|---|---|---|---|---|---|---|---|---|---|---|---|---|
| Ranking | LS | 17 | 8 | 9 | 10 | 21 | 25 | 28 | 3 | 26 | 20 | 13 | 27 | 23 | 18 | 19 | 15 | 24 | 7 | 5 | 16 | 12 | 11 | 4 | 2 | 22 | 14 | 1 | 6 |
| LD | 20 | 10 | 18 | 9 | 26 | 19 | 28 | 17 | 27 | 24 | 8 | 25 | 23 | 21 | 13 | 14 | 16 | 5 | 4 | 15 | 11 | 12 | 3 | 2 | 22 | 1 | 7 | 6 | |
| Result | LS | R | T | R | R | R | R | R | C | R | R | R | R | R | R | R | R | R | T | C | R | R | R | C | C | R | R | C | C |
| LD | R | R | R | T | R | R | R | R | R | R | T | R | R | R | R | R | R | C | C | R | R | R | C | C | R | C | T | C | |
| Cluster | Cat | ToS | PuF | Cor | Shp | Edu | LiS | Hea | Gov | Htl | SpE | BuS | Pak | SHDI | RnD | RnC | BD | AL | CL | UL | |
|---|---|---|---|---|---|---|---|---|---|---|---|---|---|---|---|---|---|---|---|---|---|
| 1 | DSW | 0.95 | 0.382 | 0.97 | 0.974 | 0.589 | 0.959 | 0.845 | 0.873 | 0.941 | 0.925 | 0.932 | 0.931 | 0.552 | 0.832 | 0.928 | 0.955 | 0.852 | 0.765 | 0.865 | 0.842 |
| p | 0.267 | 0.000 *** | 0.679 | 0.757 | 0.000 *** | 0.410 | 0.002 *** | 0.006 *** | 0.168 | 0.076* | 0.106 | 0.104 | 0.000 *** | 0.001 *** | 0.086 * | 0.344 | 0.002 *** | 0.000 *** | 0.004 *** | 0.002 *** | |
| k | −1.025 | NS | 0.377 | −0.460 | 0.189 | 0.578 | NS | 0.238 | 0.421 | 1.505 | −0.982 | 0.689 | NS | NS | −0.134 | 0.558 | −0.464 | NS | NS | 0.582 | |
| N | 24 | ||||||||||||||||||||
| 2 | DSW | 0.993 | 0.481 | 0.493 | 0.958 | 0.943 | 0.778 | 0.976 | 0.923 | 0.728 | 0.532 | 0.448 | 0.809 | 0.362 | 0.997 | 0.906 | 0.942 | 0.82 | 0.976 | 0.915 | 0.891 |
| p | 0.407 | 0.000 *** | 0.000 *** | 0.000 *** | 0.000 *** | 0.000 *** | 0.000 *** | 0.000 *** | 0.000 *** | 0.000 *** | 0.000 *** | 0.000 *** | 0.000 *** | 0.978 | 0.000 *** | 0.000 *** | 0.000 *** | 0.002 *** | 0.000 *** | 0.000 *** | |
| k | −0.174 | NS | NS | −1.162 | 0.252 | NS | 1.614 | NS | NS | NS | NS | NS | NS | 0.054 | 1.315 | NS | NS | −0.880 | 0.835 | −0.286 | |
| N | 199 | ||||||||||||||||||||
| 3 | DSW | 0.905 | 0.729 | 0.489 | 0.844 | 0.978 | 0.921 | 0.97 | 0.956 | 0.778 | 0.637 | 0.555 | 0.841 | 0.464 | 0.918 | 0.815 | 0.968 | 0.836 | 0.979 | 0.939 | 0.886 |
| p | 0.000 *** | 0.000 *** | 0.000 *** | 0.000 *** | 0.000 *** | 0.001 *** | 0.000 *** | 0.027 ** | 0.000 *** | 0.000 *** | 0.000 *** | 0.000 *** | 0.000 *** | 0.001 *** | 0.000 *** | 0.104 | 0.000 *** | 0.360 | 0.004 *** | 0.000 *** | |
| k | 1.986 | NS | NS | NS | −0.457 | 0.718 | 0.913 | 0.298 | NS | NS | NS | NS | NS | 0.952 | NS | 0.950 | NS | −0.727 | 0.738 | −1.393 | |
| N | 62 | ||||||||||||||||||||
| 4 | DSW | 0.647 | 0.224 | 0.341 | 0.642 | 0.643 | 0.578 | 0.665 | 0.646 | 0.61 | 0.34 | 0.159 | 0.408 | 0.101 | 0.721 | 0.685 | 0.847 | 0.874 | 0.956 | 0.664 | 0.937 |
| p | 0.000 *** | 0.000 *** | 0.000 *** | 0.000 *** | 0.000 *** | 0.000 *** | 0.000 *** | 0.000 *** | 0.000 *** | 0.000 *** | 0.000 *** | 0.000 *** | 0.000 *** | 0.000 *** | 0.000 *** | 0.000 *** | 0.000 *** | 0.000 *** | 0.000 *** | 0.000 *** | |
| k | NS | NS | NS | 1.048 | −0.476 | NS | 1.026 | 0.694 | NS | NS | NS | NS | NS | −1.141 | NS | NS | 0.015 | −1.117 | NS | −1.010 | |
| N | 142 | ||||||||||||||||||||
| 5 | DSW | 0.984 | 0.268 | 0.288 | 0.958 | 0.897 | 0.665 | 0.923 | 0.748 | 0.771 | 0.678 | 0.881 | 0.879 | 0.752 | 0.914 | 0.958 | 0.937 | 0.867 | 0.978 | 0.956 | 0.92 |
| p | 0.007 *** | 0.000 *** | 0.000 *** | 0.000 *** | 0.000 *** | 0.000 *** | 0.000 *** | 0.000 *** | 0.000 *** | 0.000 *** | 0.000 *** | 0.000 *** | 0.000 *** | 0.000 *** | 0.000 *** | 0.000 *** | 0.000 *** | 0.001 *** | 0.000 *** | 0.000 *** | |
| k | −0.552 | NS | NS | 0.864 | 1.610 | NS | NS | NS | NS | NS | 0.266 | 1.129 | NS | NS | −0.275 | 1.867 | 1.800 | −0.736 | −0.151 | −0.627 | |
| N | 249 | ||||||||||||||||||||
| 6 | DSW | 0.834 | 0.869 | 0.883 | 0.895 | 0.804 | 0.893 | 0.892 | 0.87 | 0.899 | 0.917 | 0.694 | 0.504 | 0.98 | 0.654 | 0.862 | 0.325 | 0.845 | 0.408 | 0.653 | 0.559 |
| p | 0.000 *** | 0.001 *** | 0.002 *** | 0.005 *** | 0.000 *** | 0.004 *** | 0.004 *** | 0.001 *** | 0.006 *** | 0.017 ** | 0.000 *** | 0.000 *** | 0.808 | 0.000 *** | 0.001 *** | 0.000 *** | 0.000 *** | 0.000 *** | 0.000 *** | 0.000 *** | |
| k | 1.628 | 0.996 | NS | 0.926 | 0.069 | −0.297 | NS | 0.675 | 1.070 | NS | NS | NS | −0.055 | NS | NS | NS | −0.291 | NS | NS | NS | |
| N | 32 | ||||||||||||||||||||
| 7 | DSW | 0.946 | 0.587 | 0.605 | 0.965 | 0.934 | 0.816 | 0.963 | 0.77 | 0.829 | 0.551 | 0.519 | 0.808 | 0.435 | 0.924 | 0.919 | 0.884 | 0.888 | 0.956 | 0.922 | 0.872 |
| p | 0.000 *** | 0.000 *** | 0.000 *** | 0.001 *** | 0.000 *** | 0.000 *** | 0.000 *** | 0.000 *** | 0.000 *** | 0.000 *** | 0.000 *** | 0.000 *** | 0.000 *** | 0.000 *** | 0.000 *** | 0.000 *** | 0.000 *** | 0.000 *** | 0.000 *** | 0.000 *** | |
| k | NS | NS | NS | −0.201 | −0.598 | NS | NS | NS | NS | NS | NS | NS | NS | NS | 0.341 | NS | 0.129 | −1.136 | 0.039 | −0.095 | |
| N | 137 | ||||||||||||||||||||
| 8 | DSW | 0.808 | 0.51 | 0.506 | 0.957 | 0.677 | 0.917 | 0.971 | 0.959 | 0.899 | 0.869 | 0.822 | 0.729 | 0.627 | 0.742 | 0.917 | 0.898 | 0.841 | 0.968 | 0.936 | 0.913 |
| p | 0.000 *** | 0.000 *** | 0.000 *** | 0.005 *** | 0.000 *** | 0.000 *** | 0.041 ** | 0.006 *** | 0.000 *** | 0.000 *** | 0.000 *** | 0.000 *** | 0.000 *** | 0.000 *** | 0.000 *** | 0.000 *** | 0.000 *** | 0.025 *** | 0.000 *** | 0.000 *** | |
| k | NS | NS | NS | 0.817 | 1.839 | NS | 0.348 | −0.691 | 1.413 | NS | 0.815 | NS | NS | NS | 0.214 | NS | 1.273 | −1.038 | −0.017 | 0.913 | |
| N | 89 | ||||||||||||||||||||
| 9 | DSW | 0.986 | 0.568 | 0.618 | 0.87 | 0.973 | 0.543 | 0.898 | 0.971 | 0.964 | 0.73 | 0.932 | 0.97 | 0.972 | 0.972 | 0.973 | 0.98 | 0.838 | 0.807 | 0.921 | 0.814 |
| p | 0.513 | 0.000 *** | 0.000 *** | 0.000 *** | 0.078* | 0.000 *** | 0.000 *** | 0.055 * | 0.018 ** | 0.000 *** | 0.000 *** | 0.046 ** | 0.080 * | 0.061 * | 0.071 * | 0.208 | 0.000 *** | 0.000 *** | 0.000 *** | 0.000 *** | |
| k | 0.526 | NS | NS | NS | 0.536 | NS | NS | 1.914 | 1.366 | NS | −0.449 | 1.040 | 0.194 | 0.678 | 0.229 | 1.237 | 1.845 | 1.209 | 0.081 | NS | |
| N | 84 | ||||||||||||||||||||
Disclaimer/Publisher’s Note: The statements, opinions and data contained in all publications are solely those of the individual author(s) and contributor(s) and not of MDPI and/or the editor(s). MDPI and/or the editor(s) disclaim responsibility for any injury to people or property resulting from any ideas, methods, instructions or products referred to in the content. |
© 2025 by the authors. Licensee MDPI, Basel, Switzerland. This article is an open access article distributed under the terms and conditions of the Creative Commons Attribution (CC BY) license (https://creativecommons.org/licenses/by/4.0/).
Share and Cite
Li, X.; Zhang, F.; Liu, Z.; Wei, Y.; Dai, R.; Qiu, Z.; Gu, Y.; Yuan, H. Machine Learning-Driven Multimodal Feature Extraction and Optimization Strategies for High-Speed Railway Station Area. Land 2025, 14, 1039. https://doi.org/10.3390/land14051039
Li X, Zhang F, Liu Z, Wei Y, Dai R, Qiu Z, Gu Y, Yuan H. Machine Learning-Driven Multimodal Feature Extraction and Optimization Strategies for High-Speed Railway Station Area. Land. 2025; 14(5):1039. https://doi.org/10.3390/land14051039
Chicago/Turabian StyleLi, Xiang, Fa Zhang, Ziyi Liu, Yao Wei, Runlong Dai, Zhiyue Qiu, Yuxin Gu, and Hong Yuan. 2025. "Machine Learning-Driven Multimodal Feature Extraction and Optimization Strategies for High-Speed Railway Station Area" Land 14, no. 5: 1039. https://doi.org/10.3390/land14051039
APA StyleLi, X., Zhang, F., Liu, Z., Wei, Y., Dai, R., Qiu, Z., Gu, Y., & Yuan, H. (2025). Machine Learning-Driven Multimodal Feature Extraction and Optimization Strategies for High-Speed Railway Station Area. Land, 14(5), 1039. https://doi.org/10.3390/land14051039