Article

Sediment and Nutrient Export After Seasonal Rainfall: Comparing Forests vs. Thinned and Degraded Land

1
Department of Chemistry, Physics and Environmental and Soil Sciences, University of Lleida—Agrotecnio CERCA Center, Av. Rovira Roure 191, 25198 Lleida, Spain
2
Estación Experimental de Aula Dei, Consejo Superior de Investigaciones Científicas (EEAD-CSIC), Avda. Montañana 1005, 50059 Zaragoza, Spain
3
Instituto Pirenaico de Ecología, Consejo Superior de Investigaciones Científicas (IPE-CSIC), Avda. Montañana 1005, 50059 Zaragoza, Spain
*
Authors to whom correspondence should be addressed.
Land 2025, 14(5), 1040; https://doi.org/10.3390/land14051040 (registering DOI)
Submission received: 20 March 2025 / Revised: 2 May 2025 / Accepted: 7 May 2025 / Published: 10 May 2025

Abstract

:
In recent decades, land abandonment due to socioeconomic issues has been a widespread process in different areas of the Mediterranean, altering landscapes and affecting soil properties and erosion processes. The aim of this research was to assess the impact of land use and land cover change on soil properties and sediment composition produced after seasonal rainfall. Mediterranean open forest (OF), pine afforestation (PA), thinned pine (TPA) and barren land (BL) land use/land covers were compared. We analyzed the soil characteristics and sediments that were collected under each form of land use and management across seven seasonal campaigns between July 2016 and September 2017. The relationships between soil particle size, soil organic carbon (SOC) and its fractions, key nutrients (nitrogen, phosphorous, potassium and sulfur) and rainfall characteristics were evaluated. Sediment loads from runoff, collected in trap MATs in monitoring areas under OF and PA, were similar in both quantity and composition. However, the amount of sediment increased after thinning, though it remained significantly lower than in BL. Sediment loads were driven by total rainfall in OF and in TPA, while rainfall erosivity had a clear impact in PA and BL. Afforestation helped to maintain SOC and nutrient levels comparable to those in OF, which were significantly higher than in BL. Nitrogen and phosphorous losses were mainly governed by the total amount of precipitation. However, the effect of rainfall on potassium and sulfur losses was not clearly evident.

1. Introduction

The abandonment of agricultural land due to socio-economic issues has been a widespread process in many European countries, with populations leaving rural areas and settling in large cities. In recent decades, this abandonment has affected different areas in the Mediterranean region, which continues today, and is expected to persist [1,2]. Some of these areas have led to unproductive soils [3], while in other cases, they have been covered with natural vegetation, and in further cases, they have been afforested. An example of these changes can be found in the mountainous areas of Aragón (northeast Spain).
Abandonment implies significant changes to the ecological environment and landscape and promotes soil erosion, which is the main degradation process affecting the sustainability of agro-ecosystems in the Mediterranean area. The role of natural revegetation in soil diversity and its effect on soil erosion has been discussed by various authors [4,5,6,7,8], as well as the impact of afforestation [9,10,11,12]. Soil erosion not only leads to the loss of topsoil but also results in the depletion of soil organic carbon (SOC) and major nutrients, including total nitrogen (N), phosphorus (P), potassium (K), and sulfur (S), as well as other micronutrients. This process reduces soil quality and fertility [13,14]. The amount of eroded soil depends on rainfall amount and distribution, as well as on soil properties. Rainfall intensity is generally considered the main driver of soil loss [15,16]. Among soil properties, particle size distribution and organic matter content are key factors influencing erosion processes. Soils with fine textures and low organic matter contents, such as those existing in the study area, are the most susceptible to erosion. This is supported by previous research in the area, which examined the redistribution of soil particles and organic carbon [7], as well as the associated macro- and micronutrients bound to soil particles [17]. Nutrient losses through erosion can occur either in dissolved form within surface runoff (as is typically the case with most N losses), or bound to fine particles (which is how most of P is lost), especially those of the smallest size [18,19].
Given the current scenario, where less overall rainfall is expected but with an increase in extreme events and rising rainfall erosivity—particularly in Mediterranean regions [20]—soil and nutrient losses due to erosion are becoming an increasingly concerning issue. This is not only due to soil degradation but also because of the impact on the quality of water bodies, streams, and rivers. To further investigate this issue, this study was conducted in a semi-humid area in the Sierra de Santo Domingo at the northern border of the central Ebro valley, where farmland abandonment has led to fragmented landscapes comprising both highly degraded soils and forested areas. The main objectives were as follows: (i) to assess soil properties in afforested areas compared to those in open forests; (ii) to evaluate the benefits of afforestation for soil protection versus the consequences of no intervention, leading to soil degradation, and further activities including thinning in the afforested areas; and (iii) to examine soil and nutrient losses caused by runoff after rainfall events of varying characteristics in forests, afforested areas, and highly degraded soils. To achieve these objectives, soil and nutrient losses in forested areas were compared with those recorded in degraded soils during seven rainfall campaigns between July 2016 and September 2017. The characteristics of the sediments collected in each campaign and under different land uses/land covers are analyzed in relation to soil properties and rainfall event characteristics. We aim to enhance the understanding of sediment and nutrient export patterns in the study area, which represents a mountain belt on the border of the Ebro valley and whose characteristics may facilitate extrapolation of our findings to other Mediterranean mountain environments.

2. Materials and Methods

2.1. Study Area

The study was conducted in an agroforestry landscape located on the edge of the central Ebro Valley in the Sierra de Santo Domingo, at the south of the Pyrenees (Aragón, Spain) (Figure 1). Elevation ranges from 638 m to 964 m a.s.l., with an average slope of 6.5%. The lithology consists of distant alluvial deposits of sandstones and mudstones from the Uncastillo Formation (Upper Oligocene–Lower Miocene) [21,22], along with materials from a glacis and infilled alluvial valleys that developed during the Holocene. The soils are predominantly alkaline, with Cambisols being the most common, followed by Regosols and Calcisols. According to the Köppen classification, the study area has a temperate CSa climate, characterized by cold winters and hot, dry summers. Average temperatures range from −6 °C to 30 °C, while annual rainfall averages approximately 550 mm, primarily concentrated in spring and autumn following dry periods.

2.2. Soil and Sediment Sampling and Analysis

2.2.1. Soil Sampling and Analysis

The study was conducted on representative slopes covered by different land uses: open forest (OF), pine afforestation (PA), and another slope section where thinning activities were carried out in the pine plantation during the study period (TPA), as well as barren, abandoned land (BL) with highly degraded bare soils (Figure 1). Representative samples from each land use were obtained through integrated soil sampling for each category. Open Mediterranean forest and afforested areas with pine were located on sandstones and mudstones, with Cambisols predominating, while most samples from barren land were collected in an area where mudstones and sandstones are the dominant lithology. At each site, surface soil samples (0–2 cm) were collected to characterize the layer contributing to the eroded soil supply. A total of 15 composite samples composed of five subsamples each were collected covering OF, PA, and BL. The amount of sediment collected under each land use was assessed throughout the different sampling campaigns, and the mean values were compared using a t-test and ANOVA.
Soil samples were air-dried at room temperature, weighed, and passed through a 2 mm sieve to separate the coarse (>2 mm) and fine (<2 mm) fractions, and then sieved at 0.063 mm to compare the results with those of the sediments collected during the analyzed campaigns. Total soil organic carbon (SOC), the active soil carbon (ACF), and stable soil carbon (SCF) fractions as well as total nitrogen (N), phosphorus (P), potassium (K), and sulfur (S) were analyzed.
Particle size analysis was conducted using a Beckman Coulter LS 13 320 laser diffraction particle size analyzer, after removing organic matter by pre-treating the soil samples with 10% H2O2, heated to 80 °C [23]. SOC content (%) was measured using the dry combustion method at 550 °C using a LECO RC-612 multiphase carbon analyzer (LECO Corporation, St. Joseph, MI, USA). The active and stable carbon fractions were analyzed using the same equipment, with oxidation temperatures set at 350 °C for active carbon (ACF) and 550 °C for stable carbon (SCF), as described by Quijano et al. [24]. Soil nitrogen (N) was measured using a LECO CN TruSpec nitrogen analyzer, by determining the NOx gas evolved after combustion at 950 °C with a LECO thermal conductivity detector. Total P, K, and S were analyzed by ICP-AES after total acid digestion in two cycles: the first with HF (48%), HNO3, and H2O2, and the second with HNO3, HCl, and Milli-Q water in a microwave oven [25].
Differences in soil C and N accumulation among land uses, as well as the ACF/SOC, ACF/SCF, and SOC/TN ratios in each land use, were evaluated to determine whether changes in SOC also affected the ratio of available and stable carbon fractions, and whether there was any relationship between changes in SOC and N.

2.2.2. Sediment Collection and Analysis

Sediments were collected over seven periods, corresponding to different seasons of the year, between July 2016 and September 2017 in OF, PA, and BL and in TPA in the last five campaigns. Eroded soil particles transported by runoff were trapped using artificial lawn mats (MATs) placed at the bottom of slopes under each land use (Figure 1) at nearby locations, with three replicates for each land use in each of the seasonal periods. The trapped sediments were dried, weighed (TSW), and sieved to <0.063 mm. The same parameters as in the soils, particle size distribution, SOC and its fractions (ACF and SCF), N, P, K, and S, were assessed in each sample.

2.3. Rainfall Characteristics

Rainfall characteristics were analyzed using data recorded at 1 min intervals in the study area with a tipping-bucket rain gauge. The total rainfall accumulated over each time period, as well as the intensity of each rainfall event and its erosivity, were assessed. Rainfall events accumulating ≥ 12 mm were considered erosive [26], and their erosivity (R) was estimated as the product of kinetic energy (KE) and the maximum intensity over 30 min (Imax30). Kinetic energy was calculated for each time interval using the equation proposed by Brown and Foster [27], considering separate storms when there was a 6 h break without rain. Values were expressed in MJ ha−1 mm h−1. For each campaign, maximum and total rainfall, total erosivity, and maximum erosivity per event were recorded.

2.4. Statistical Analysis

The mean characteristics of soil and sediments collected from each land use were evaluated and compared using a test of means and ANOVA, and significant differences between land uses, as well as between soil and sediment, were also assessed. The relationships between SOC, N, P, K, and S and soil particle size in the soils were analyzed with a correlation matrix and in the sediments using Principal Component Analysis (PCA), in which the influence of rainfall characteristics, including total rainfall amount (Prec) and erosivity (R), on sediment quantity and nutrient content was additionally considered. Statistical analyses were performed using JMPro18.

3. Results

3.1. Properties of Soils and Sediments Collected in Different Land Uses

Table 1 summarizes the characteristics of the surface soil under the study land uses. Soil under OF and PA lands had similar textures, with clay content between 14.2 and 16.6%, silt around 71%, and sand around 13%. In BL, soils had a slightly higher silt content (>73%) and a lower clay content (around 11%), but without significant differences. SOC was higher in open forest than in afforested areas (3.0% vs. 2.60%), while maintaining a similar ACF/SOC ratio (0.639–0.649). In BL, however, SOC was significantly lower (0.21%), with the ACF/SOC ratio also being lower (0.567). Total N was not significantly different in OF than in PA areas (0.30% vs. 0.25%), but much higher than in BL, whereas P showed higher values in PA than in OF (296 vs. 253 mg/kg). Potassium and sulfur, however, had the highest values in BL and the lowest in OF (average range from 656 to 849 mg/kg).

3.2. Characteristics of Rainfall Events and Sediments Recorded in Each Campaign

3.2.1. Rainfall Events

The seven pluviometric campaigns analyzed exhibited different characteristics in terms of total precipitation and erosivity (Table 2). Campaign C4, with only two erosive events, had the highest rainfall erosivity, while campaign C6 had the lowest rainfall and the lowest erosivity. In the remaining campaigns, rainfall amounts ranged from 52.6 to 230 mm, with total erosivities ranging from 27.3 to 206 MJ/ha·mm/h.

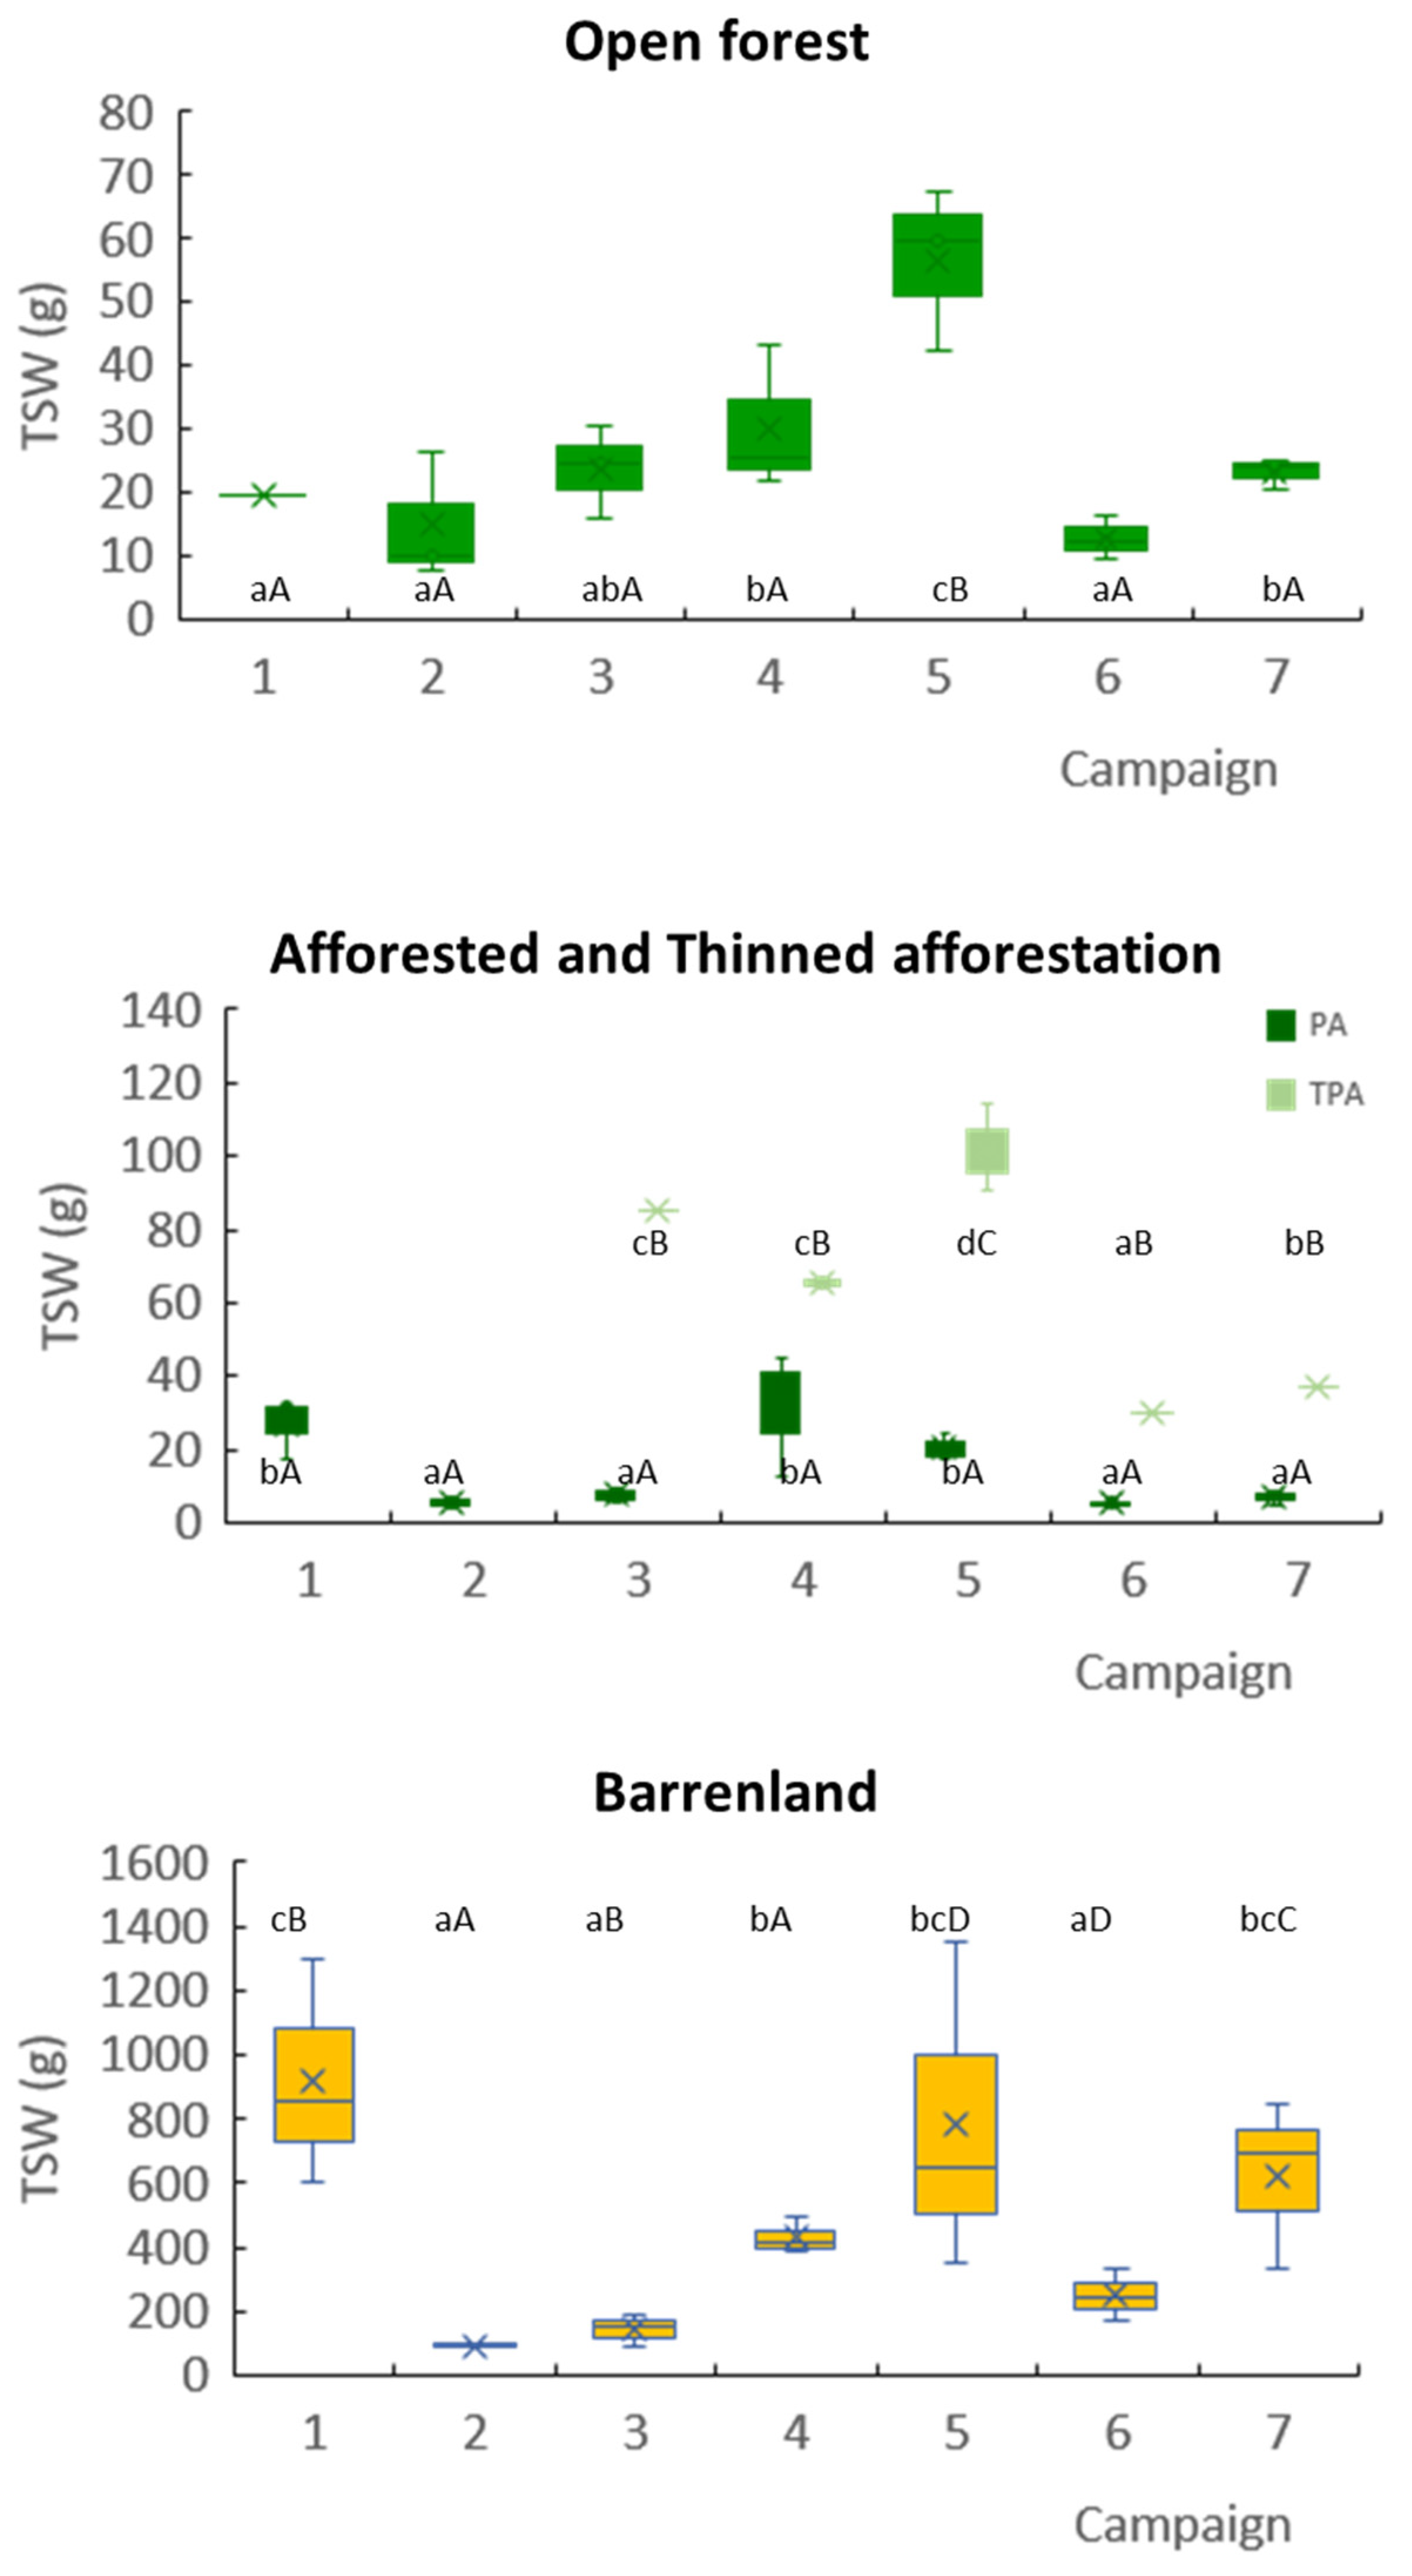
3.2.2. Sediment Characteristics

Figure 2 shows the average amount of sediment recorded in the MATs for each land use in the analyzed campaigns. In OF, the highest sediment amount was recorded in campaign C5, which had the highest rainfall erosivity, followed by campaigns C4 and C7. In BL, sediment loads were much higher than in forested areas, with the highest values also recorded in campaigns C5 and C7, followed by campaigns C1 and C4. However, in PA, the highest sediment loads were recorded in campaign C4, while in the areas where tinning activities were applied (TPA), the highest values were recorded in campaign C3. Campaign C4 was the one with the highest total rainfall, while campaign C5 recorded events with high rainfall intensity.
In terms of sediment composition, sediments recorded in both OF and PA land had lower clay contents than soils (11.43% vs. 14.29% and 11.21% vs. 16.60%, respectively) (Table 1). However, while sediments in OF had slightly higher silt contents than soils (74.2% vs. 71.9%), in PA the sediments had a higher sand content (and 22.99% vs. 13.30%), and in TPA the sand content was slightly lower (19.37%). A higher sand content was also observed in the sediment in BL (18.84% vs. 15.77% in soil). Additionally, SOC content in sediments from OF was lower than in soils, whereas in PA, the opposite was observed. However, the ACF/SOC ratio was slightly higher in PA than in OF, but with no significant differences.
The nitrogen content in sediments was lower than in soils in OF but similar to that in PA, both in thinned and non-thinned areas, and was higher than in BL in all cases. For P, there were no significant differences between sediments and soils in OF and in BL, but lower P contents were observed in sediments from PA than in soils (56.8 and 195 vs. 296 mg/kg, respectively, in PA and TPA). For K, no significant differences were found between sediments and soils, whereas enrichment in S was observed in sediments compared to soils in all land uses, being higher in BL.

3.3. Relationships Between Soil Particle Distribution and Nutrient Content in Soils and Sediments

3.3.1. Relationships in the Soils

The correlations between SOC, nutrient content, and soil particle size distribution in soils under different land uses are shown in Figure 3. A significant correlation was observed between clay and K (positive) and between N and SOC and its fractions (ACF and SCF) in all land uses. In OF, there was also a correlation between P and SOC and ACF, which did not appear in PA and BL. In addition, in OF and in PA there was a positive correlation between P and K, while in BL, P correlated with S.

3.3.2. Relationships in the Sediments

Table 3 presents the PCA results, including rainfall characteristics and the weight and contents of the sediments recorded in each campaign under each land use. Four components were retained in PA and TPA, explaining 83.85 and 81.67% of the variance, respectively, in PA and TPA, and in BL (explaining 87.4% of the variance), while in OF, three components were retained, which explained 76.80% of the variance. The percentage of the variance explained for each component is also indicated in Table 3. The relationships between SOC and its fractions with N was maintained in all land uses (PC1), as well as the relationships between clay and K and between K and P (in PC1 in all land uses), as indicated by the higher loadings in the components ((PC1 in OF, PC2 in PA, PC3 in TPA and PC4 in BL for clay–K and in PC1 for K–P in all land uses). Additionally, phosphorus and TSW also showed high loadings in PC1 for barren land.
Furthermore, the effect of total precipitation and rainfall erosivity on sediments can be observed in the PCA results. In OF and TPA areas, the effect of total precipitation in TSW was indicated by the loadings of both variables in PC1, while in PA and BL, TSW was correlated with rainfall erosivity (PC2 in both cases). It was also observed that P was correlated with the TSW in TPA (PC1), while no clear relationship was found for the other land uses analyzed.

4. Discussion

4.1. Soil Properties in Forest and Afforested Areas vs. Barren Land

Soils in PA sites had textures like those in OF, while degraded soils in BL had a significantly lower clay content and slightly higher silt content. The differences can be attributed to the differences in the parent material mentioned before, as the analyzed degraded soils are located in an area with predominance of mudstones, while the OF and OA are in areas dominated by sandstones. This high silt content made the soils highly susceptible to erosion, which was consistent with the greater sediment yield recorded in BL compared to forest areas (OF and PA) during a given rainfall period (Figure 2). Afforestation helped to maintain relatively high SOC levels in the soil, whereas SOC was very low in BL (Table 1). The ACF and SCF fractions were lower in PA areas than in OF, but the ACF/SOC ratio did not differ significantly from that of OF soils. The lower SOC levels in PA sites could result from decreased carbon levels due to excessive soil moisture consumption by the developing root systems and rapid plant growth [28]. Dynarski et al. [29] indicated that soil carbon sequestered through afforestation is often stored in an unstable form and could be easily lost due to altered soil properties and environmental conditions. The positive correlation between SOC and sand content, although significant only in degraded soils of barren land, suggests that organic carbon is bound to larger particles. In OF and PA, a similar but non-significant relationship was observed, along with a negative correlation with the silt fraction. Qiu et al. [30] found that afforestation increased OC in both macroaggregates and microaggregates to a greater extent than in particles smaller than 0.053 mm. Moreover, the total increase in OC stocks within macroaggregates accounted for more than 80% of the overall increase in total OC in soil.
Nitrogen content in PA sites was also lower than in OF and the C/N ratio in PA was also slightly lower than in OF. The observed C/N ratios align with other studies in afforested areas. Tang et al. [31] reported an increase in the C/N ratio up to 16 in a black pine afforestation when SOC was below 6%. In contrast, BL had very low SOC and N contents, and a C/N ratio below 6. This suggests that afforestation helps maintain soil quality, similar to that of open forests, while the absence of intervention on abandoned land led to severely degraded and infertile soils. The correlation between N and SOC indicates that most of the N in these soils is organic. Similarly, the positive correlation between P and SOC observed in OF suggests that P is bound to organic matter. However, the relationship was not significant in PA.

4.2. Sediment Production and Composition Produced Under Different Land Use

When impacted by rainfall, soil detachment and transport were similar between OF and PAF sites but significantly higher after thinning in the afforested areas and in BL. This could be attributed to increased runoff in uncovered areas after thinning, which is consistent with the findings by Farahnak et al. [32]. In forests, the highest sediment yield occurred during the most erosive campaigns (C4, C1 and C7), but after thinning the maximum sediment loads were recorded in campaigns C3, C4 and C5. The higher values in campaigns C4 and C5 agreed with the observed in OF and in PA, but the results observed for campaign C3 were quite anomalous, as it grouped events that accumulated low amount of rainfall and rainfall erosivity was also low. This campaign may have coincided with certain operations carried out in the thinned area, which could have resulted in looser materials on the soil surface.
Differences in soil properties influenced sediment composition. In PA, SOC was not only lower than in OF, but the SOC in the sediments was higher in PA than in OF, with an increase in the sand fraction in PA compared to the soils. This result could indicate that SOC is linked to a specific particle size, aligning with the relationship between SOC and particle size found in the soils (Figure 2). The amount of sediment in afforested areas was, on average, 1.5-fold lower than in OF. However, in thinned areas, sediment loads were more than four times higher than in non-thinned sites, which also implies a potentially higher amount of nutrients transported by runoff, posing a risk to water bodies during erosion events. SOC, N and P content in the sediments from thinned areas were slightly lower than in the non-thinned ones (Table 1), although the differences were only significant for P. However, the difference in content was smaller than the increase ratio in sediments. Thus, the higher amount of sediment transported by runoff implies higher organic carbon, N, and P losses. Sulfur content, however, was lower in the thinned areas.

4.3. Nutrient Losses Under Different Land Use in Seasonal Campaigns

The effect of rainfall on total nutrient losses depends on both soil composition and rainfall characteristics. It was also observed that P correlated with TSW in TPA (PC1), while no clear relationship was found in the other land uses analyzed. The higher loadings for N and SOC, together with precipitation found in the PCA results, confirmed that the losses of both elements (C and N) were mainly driven by rainfall amount, which agrees with that found by Liu et al. [33]. Nitrogen is soluble and can be transported as dissolved N in runoff, but in this study, its correlation with SOC suggests that most N was transported as organic nitrogen. In addition, N was not correlated with fine particles, as observed in other studies [34], but was instead associated with sand-sized particles. This could explain the increase in trapped sediments instead of being transported as dissolved or suspended matter bound to small particles.
On the other hand, the P content in sediments from PA and BL showed a positive relationship with total rainfall, but not in those from OF, and was also negatively affected by rainfall erosivity. This contradicts expectations, as P is typically adsorbed onto soil particles and lost through erosion [35,36,37,38]. Higher erosivity usually increases sediment detachment and, consequently, soil and P losses. The relationship between TSW and total rainfall erosivity was confirmed in BL and TPA, where higher sediment loads were produced. However, this relationship was not confirmed in OF and PA. On the contrary, a negative correlation was found between P and total erosivity. This negative correlation suggests that intense rainfall eroded deeper soil layers with lower P content, affecting the overall relationship. Campaign C4 had the highest total erosivity, and, on average, recorded the lowest P content in sediments, despite the amount of sediment being among the highest. In addition, rainfall intensity, varied along the rainstorm, and the time when the peak is recorded may also influence TP losses. Soil losses may increase throughout the storm but P enrichment in sediments vary along the storm, as indicated by Yang et al. [39]. Another potential reason for the lack of impact of erosivity on P losses could be that P was mainly associated with the finest particles that had been transported in suspension and were not trapped by the MATs. This agrees with the findings of Deng et al. [40], who found that P partitioning onto particle size resulted in higher bioavailable P adsorbed by the finest particles, and a decrease in P concentration as particle size increased. Nevertheless, the study should be complemented with other type of collectors, such as Gerlach troughs that allow the collection of runoff containing sediments of all transported particle sizes. In addition, P may exist in multiple soil-bound forms, with some being more evenly distributed throughout the soil profile. Turrion et al. [41] found that vegetation cover influenced inorganic P more than organic P, which could explain the observed patterns. As indicated before, differences were observed in the link of P to soil properties: P correlated with clay in OF, and with SOC in PA and BL. Phosphorous content in sediment from OF was lower than in the soils. However, no significant differences were observed between sediments from OF and BL. Bertol et al. [42] found enrichment of P, K, and SOC in sediments under different tillage practices, while Yang et al. [39] reported that rainfall intensity influenced P enrichment, though this fluctuated throughout the rainfall, nearing a value of 1 by the end. In this study, the potential impact of rainfall characteristics on P may have been obscured since samples were collected after multiple events. Thus, a direct relationship between rainfall erosivity and P loss was not clearly established.
Regarding K, its correlation with clay content and the association with the finer particles in the soils are in concordance with that indicated by Goulding et al. [43], and could be due to its origin in the parent material, which agrees with previous findings in the area [8]. A stronger relationship was observed in OF and PA sediments, as indicated by the loadings in the PCA, compared to TPA and BL, which were the land uses with higher erosion. There was no enrichment of K in the sediments compared to the soil, which had been previously observed in suspended sediments [8]. In addition, in this study, clay content was lower in the sediment than in soils in OF and PA, likely because clay-sized particles were not retained in the MATs collectors. In this respect, Durán Zuazo et al. [44] indicated that a greater proportion of K was transported in runoff than in sediments, and Rocha Junior et al. [45] reported organic carbon and potassium losses in coarse sediments compared to fine sediments in pastures. In addition, K exhibited a negative relationship with rainfall in OF, PA, and BL. However, in TPA, this relationship was not evident, and no clear correlation with total precipitation was found, probably because the sediment trapped lost part of the clay particles. In contrast, Xue et al. [46] found that K losses in runoff from pine forests depended mainly on runoff volume. Nevertheless, this loss might be mainly as dissolved or suspended material. The case analyzed does not include agricultural land, where soil K contents can be higher due to fertilization practices. In such cases, K losses in runoff may represent a more significant problem [47,48].
As for sulfur, the slightly higher values in BL compared to OF and PA could be attributed to differences in the parent material. Sulfur can exist in the soil in a variety of organic and inorganic compounds [49]. However, in this study, the lack of correlation with SOC, and the fact that S content was higher in barren land where SOC levels were very low, suggests that most S is in an inorganic form. Sulfates of Fe, Al, and Ca are likely to occur under oxidizing soil conditions [50]. However, the alkaline conditions in the area could limit the presence of these minerals. Nevertheless, Reimann and Caritat [51] indicated that although in low proportion, S can be present in lutites and sandstones, which could explain the presence of S in the study area. In the degraded soils of BL, there was a significant correlation between S and P, and this correlation was also observed in the sediments from all land uses. Both elements are nutrients commonly used in agriculture, and their presence could remain from the previous land use. Nevertheless, the consistent relationship observed in the sediments from all land uses suggests a common origin for S and P in all study sites.
While there was a relationship between S and TSW in OF and TPA, with moderate loads in the components for S, the result was opposite in the other land uses and the effect of rainfall, was not uniform across all land uses. A relationship was found between S and total precipitation in BL and TPA, which were the land uses that generated the highest sediment loads, but no positive correlation was observed with rainfall erosivity. These results may contradict those of Zacari et al. [52], who found slightly higher total S losses in the runoff of weed agrosystems than in the no-weed agrosystems. However, in the study, S was enriched in the sediments in a higher proportion in BL than in OF and PA. This slight S enrichment in sediments across land uses, except in TPA, aligns with previous findings, where enrichment was observed under various rainfall conditions [8]. On the contrary, S was negatively correlated with rainfall erosivity in OF, PA, and BL, but not in TPA, which is consistent with previous findings at the catchment scale, where agricultural and forested lands coexist [8].

5. Conclusions

Afforestation helps maintain soil organic carbon and nutrient levels similar to those found in open forest (OF), which were significantly higher than in barren land (BL). Although there are small differences in SOC content between soils from open forests and pine afforested areas (PA), the ratios ACF/SCF and ACS/SOC remain constant. Both land uses show similar P and K contents, with slightly lower N content in the afforested areas compared to open forests.
The correlation between SOC and N indicates that N was mainly in organic form. Phosphorus was only significantly correlated with SOC in the open forest, which, together with the correlation between K and P with clay content suggests that these elements primarily originate from the parent material and are mainly in inorganic form. Nevertheless, some of these relationships do not appear in the sediments from OF.
Sediment loads and nutrient content were mainly driven by the total amount of rainfall recorded during the seasonal campaigns. However, the effect of rainfall erosivity was not clearly observed across all land uses. The loads and composition of sediments transported by runoff are similar in open forest and afforested areas. However, thinning activity leads to significantly higher sediments loads (more than four times higher on average), which results in increased nutrient loss. This can negatively affect the quality of water bodies, adding or amplifying an adverse effect on water quality downstream of the study area.
Thus, to preserve the positive effects of afforestation, thinning activities should be carefully planned and accompanied by additional practices to protect the soil before thinning, in order to minimize soil disturbance and prevent excessive soil and nutrient losses. Once abandoned areas have reached advanced levels of degradation, recovery becomes particularly challenging. Therefore, to prevent further expansion of degraded land, strategic plans for the reintroduction of native vegetation should be considered.

Author Contributions

M.C.R.: Conceptualization, Methodology, Formal analysis, Investigation, Writing—Original draft preparation, writing—reviewing and editing. L.G.: Data curation, Formal analysis, Investigation, Visualization, Funding acquisition; Project administration, Writing—Reviewing and Editing, I.L.: Data curation, Formal analysis, Investigation, Writing—reviewing and editing, A.N.: Conceptualization, Methodology, Funding acquisition; Project administration; Investigation; Writing—reviewing and editing. All authors have read and agreed to the published version of the manuscript.

Funding

This research is part of project I+D+i PID2023-147193OB-I00 and PID2019-104857RB-I00, funded by the MCIN/AEI/10.13039/501100011033/. This research article received aid of a pre-doctoral contract BES-2015-071780 of the project CGL2014-52986-R.

Data Availability Statement

The raw data supporting the conclusions of this article will be made available by the authors on request.

Conflicts of Interest

The authors declare no conflicts of interest.

References

  1. Levers, C.; Schneider, M.; Prishchepov, A.V.; Estel, S.; Kuemmerle, T. Spatial Variation in Determinants of Agricultural Land Abandonment in Europe. Sci. Total Environ. 2018, 644, 95–111. [Google Scholar] [CrossRef] [PubMed]
  2. Perpiña Castillo, C.; Kavalov, B.; Diogo, V.; Jacobs-Crisioni, C.; Batista e Silva, F.; Lavalle, C. Agricultural Land Abandonment in the EU Within 2015-2030. JRC113718, European Commission 2018. Available online: https://ec.europa.eu/jrc/en/luisa (accessed on 1 July 2024).
  3. García-Ruiz, J.M.; Lasanta, T.; Ruiz-Flano, P.; Ortigosa, L.; White, S.; González, C.; Martí, C. Land-Use Changes and Sustainable Development in Mountain Areas: A Case Study in the Spanish Pyrenees. Landsc. Ecol. 1996, 11, 267–277. [Google Scholar] [CrossRef]
  4. Navarro, L.M.; Pereira, H.M. Rewilding Abandoned Landscapes in Europe. In Rewilding European Landscapes; Springer: Cham, Switzerland, 2015; pp. 3–23. [Google Scholar] [CrossRef]
  5. Navas, A.; Quine, T.A.; Walling, D.E.; Gaspar, L.; Quijano, L.; Lizaga, I. Relating Intensity of Soil Redistribution to Land Use Changes in Abandoned Pyrenean Fields Using Fallout Caesium-137. Land Degrad. Dev. 2017, 28, 2017–2029. [Google Scholar] [CrossRef]
  6. García-Llamas, P.; Geijzendorffer, I.R.; García-Nieto, A.P.; Calvo, L.; Suárez-Seoane, S.; Cramer, W. Impact of Land Cover Change on Ecosystem Service Supply in Mountain Systems: A Case Study in the Cantabrian Mountains (NW of Spain). Reg. Environ. Chang. 2019, 19, 529–542. [Google Scholar] [CrossRef]
  7. Lizaga, I.; Gaspar, L.; Latorre, B.; Navas, A. Variations in Transport of Suspended Sediment and Associated Elements Induced by Rainfall and Agricultural Cycle in a Mediterranean Agroforestry Catchment. J. Environ. Manag. 2020, 272, 111020. [Google Scholar] [CrossRef] [PubMed]
  8. Ramos, M.C.; Lizaga, I.; Gaspar, L.; Catalá, A.; Navas, A. Assessment of Nutrient Differences in Detached Soil Particles between Cropland and Revegetated Abandoned Land. Land Degrad. Dev. 2024, 35, 5029–5042. [Google Scholar] [CrossRef]
  9. Aide, T.M.; Clark, M.L.; Grau, H.R.; López-Carr, D.; Levy, M.A.; Redo, D.; Bonilla-Moheno, M.; Riner, G.; Andrade-Núñez, M.J.; Muñiz, M. Deforestation and Reforestation of Latin America and the Caribbean (2001–2010). Biotropica 2013, 45, 262–271. [Google Scholar] [CrossRef]
  10. Khorchani, M.; Gaspar, L.; Nadal-Romero, E.; Arnaez, J.; Lasanta, T.; Navas, A. Effects of Cropland Abandonment and Afforestation on Soil Redistribution in a Small Mediterranean Mountain Catchment. Int. Soil Water Conserv. Res. 2023, 11, 339–352. [Google Scholar] [CrossRef]
  11. Nadal-Romero, E.; Cammeraat, E.; Pérez-Cardiel, E.; Lasanta, T. Effects of Secondary Succession and Afforestation Practices on Soil Properties after Cropland Abandonment in Humid Mediterranean Mountain Areas. Agric. Ecosyst. Environ. 2016, 228, 91–100. [Google Scholar] [CrossRef]
  12. Tomaz, C.; Alegria, C.; Monteiro, J.M.; Teixeira, M.C. Land Cover Change and Afforestation of Marginal and Abandoned Agricultural Land: A 10year Analysis in a Mediterranean Region. For. Ecol. Manag. 2013, 308, 40–49. [Google Scholar] [CrossRef]
  13. Liu, Y.; Van Nieuwenhuizen, N.; Elliott, J.; Shrestha, R.R.; Yerubandi, R. Runoff, Sediment, Organic Carbon, and Nutrient Loads from a Canadian Prairie Micro-Watershed under Climate Variability and Land Management Practices. Environ. Monit. Assess. 2023, 195, 1285. [Google Scholar] [CrossRef] [PubMed]
  14. Yang, X.; Leys, J.; Zhang, M.; Gray, J.M. Estimating Nutrient Transport Associated with Water and Wind Erosion across New South Wales, Australia. Geoderma 2023, 430, 116345. [Google Scholar] [CrossRef]
  15. Mohamadi, M.A.; Kavian, A. Effects of Rainfall Patterns on Runoff and Soil Erosion in Field Plots. Int. Soil Water Conserv. Res. 2015, 3, 273–281. [Google Scholar] [CrossRef]
  16. Quijano, L.; Kuhn, N.J.; Navas, A. Soil Particle Size Distribution and Induced Soil Carbon Transport by Ephemeral Gully Erosion in Mediterranean Mountain Arable Land. Earth Surf. Process. Landf. 2019, 44, 2741–2751. [Google Scholar] [CrossRef]
  17. Gaspar, L.; Lizaga, I.; Navas, A. Elemental Mobilisation by Sheet Erosion Affected by Soil Organic Carbon and Water Fluxes along a Radiotraced Soil Catena with Two Contrasting Parent Materials. Geomorphology 2020, 370, 107387. [Google Scholar] [CrossRef]
  18. Quinton, J.N.; Catt, J.A.; Hess, T.M. The Selective Removal of Phosphorus from Soil: Is Event Size Important? J. Environ. Qual. 2001, 30, 538–545. [Google Scholar] [CrossRef]
  19. Ordóñez-Fernández, R.; Rodríguez-Lizana, A.; Espejo-Pérez, A.J.; González-Fernández, P.; Saavedra, M.M. Soil and Available Phosphorus Losses in Ecological Olive Groves. Eur. J. Agron. 2007, 27, 144–153. [Google Scholar] [CrossRef]
  20. Kostopoulou, E.; Giannakopoulos, C. Projected Changes in Extreme Wet and Dry Conditions in Greece. Climate 2023, 11, 49. [Google Scholar] [CrossRef]
  21. Solé, J.; Del Valle, J.; Ramírez, J. Mapa Geológico de España escala 1:50.000. Mapa geológico y Memoria de la Hoja MAGNA 207 26-10 (Sos del Rey Católico); Segunda Serie (MAGNA)—Primera Edición; Instituto Geológico y Minero de España (IGME): Madrid, Spain, 1972; 16p. [Google Scholar]
  22. Teixel, A.; Montes, M.J.; Arenas, C.; Garrido, E.A. Mapa Geológico de España E.1:50.000. Mapa geológico y Memoria de la Hoja MAGNA nº 208 27-10 (Uncastillo); Segunda Serie. Primera Edición; Instituto Geológico y Minero de España (IGME): Madrid, Spain, 2012; 47p. [Google Scholar]
  23. Gee, G.W.; Bauder, J.W. Particle Size Analysis. In Methods of Soil Analysis. Part I—Physical and Mineralogical Methods, 2nd ed.; Klute, A., Ed.; American Society of Agronomy/Soil Science Society of America: Madiosn, WI, USA, 1986; pp. 383–412. [Google Scholar]
  24. Quijano, L.; Gaspar, L.; Navas, A. Spatial Patterns of SOC, SON, 137Cs and Soil Properties as Affected by Redistribution Processes in a Mediterranean Cultivated Field (Central Ebro Basin). Soil Tillage Res. 2016, 155, 318–328. [Google Scholar] [CrossRef]
  25. Navas, A.; Machín, J. Spatial distribution of heavy metals and arsenic in soils of Aragón (northeast Spain): Controlling factors and environmental implications. Appl. Geochem. 2002, 17, 961–973. [Google Scholar] [CrossRef]
  26. Xie, Y.; Liu, B.; Nearing, M.A. Practical Thresholds for Separating Erosive and Non-Erosive Storms. Trans. Am. Soc. Agric. Eng. 2002, 45, 1843–1847. [Google Scholar]
  27. Brown, C.L.; Foster, G.R. Storm Erosivity Using Idealized Intensity Distributions. Trans. ASAE 1987, 30, 379–686. [Google Scholar] [CrossRef]
  28. Chai, Q.; Ma, Z.; An, Q.; Wu, G.-L.; Chang, X.; Zheng, J.; Wang, G. Does Caragana Korshinskii Plantation Increase Soil Carbon Continuously in a Water-Limited Landscape on the Loess Plateau, China? Land Degrad. Dev. 2019, 30, 1691–1698. [Google Scholar] [CrossRef]
  29. Dynarski, K.A.; Bossio, D.A.; Scow, K.M. Dynamic Stability of Soil Carbon: Reassessing the “Permanence” of Soil Carbon Sequestration. Front. Environ. Sci. 2020, 8, 514701. [Google Scholar] [CrossRef]
  30. Qiu, L.; Wei, X.; Gao, J.; Zhang, X. Dynamics of Soil Aggregate-Associated Organic Carbon along an Afforestation Chronosequence. Plant Soil 2015, 391, 237–251. [Google Scholar] [CrossRef]
  31. Tang, S.; Liu, T.; Hu, R.; Xu, X.; Wu, Y.; Meng, L.; Hattori, S.; Tawaraya, K.; Cheng, W. Twelve-Year Conversion of Rice Paddy to Wetland Does Not Alter SOC Content but Decreases C Decomposition and N Mineralization in Japan. J. Environ. Manag. 2024, 354, 120319. [Google Scholar] [CrossRef] [PubMed]
  32. Farahnak, M.; Sato, T.; Tanaka, N.; Nainar, A.; Mohd Ghaus, I.; Kuraji, K. Impact of Thinning and Contour-Felled Logs on Overland Flow, Soil Erosion, and Litter Erosion in a Monoculture Japanese Cypress Forest Plantation. Water 2024, 16, 2874. [Google Scholar] [CrossRef]
  33. Ramos, M.C.; Lizaga, I.; Gaspar, L.; Catalá, A.; Navas, A. Factors Affecting Mobility/Export of Particle-Bound Stable Elements after Erosive Rainfalls in Agroforestry Mediterranean Catchments of Aragón (Spain). Geomorphology 2024, 451, 109099. [Google Scholar] [CrossRef]
  34. Yang, Y.; Ye, Z.; Liu, B.; Zeng, X.; Fu, S.; Lu, B. Nitrogen Enrichment in Runoff Sediments as Affected by Soil Texture in Beijing Mountain Area. Environ. Monit. Assess. 2014, 186, 971–978. [Google Scholar] [CrossRef]
  35. Berretta, C.; Sansalone, J. Speciation and Transport of Phosphorus in Source Area Rainfall–Runoff. Water Air Soil Pollut. 2011, 222, 351–365. [Google Scholar] [CrossRef]
  36. Ramos, M.C.; Lizaga, I.; Gaspar, L.; Quijano, L.; Navas, A. Effects of Rainfall Intensity and Slope on Sediment, Nitrogen and Phosphorous Losses in Soils with Different Use and Soil Hydrological Properties. Agric. Water Manag. 2019, 226, 105789. [Google Scholar] [CrossRef]
  37. Yang, X.; Chen, X.; Yang, X. Effect of Organic Matter on Phosphorus Adsorption and Desorption in a Black Soil from Northeast China. Soil Tillage Res. 2019, 187, 85–91. [Google Scholar] [CrossRef]
  38. Yao, Q.-Z.; Du, J.-T.; Chen, H.-T.; Yu, Z.-G. Particle-Size Distribution and Phosphorus Forms as a Function of Hydrological Forcing in the Yellow River. Environ. Sci. Pollut. Res. 2016, 23, 3385–3398. [Google Scholar] [CrossRef]
  39. Yang, L.; Yang, G.; Li, H.; Yuan, S. Effects of Rainfall Intensities on Sediment Loss and Phosphorus Enrichment Ratio from Typical Land Use Type in Taihu Basin, China. Environ. Sci. Pollut. Res. 2020, 27, 12866–12873. [Google Scholar] [CrossRef]
  40. Deng, P.; Yi, Q.; Zhang, J.; Wang, C.; Chen, Y.; Zhang, T.; Shi, W. Phosphorous Partitioning in Sediments by Particle Size Distribution in Shallow Lakes: From Its Mechanisms and Patterns to Its Ecological Implications. Sci. Total Environ. 2022, 814, 152753. [Google Scholar] [CrossRef] [PubMed]
  41. Turrión, M.-B.; López, O.; Lafuente, F.; Mulas, R.; Ruipérez, C.; Puyo, A. Soil Phosphorus Forms as Quality Indicators of Soils under Different Vegetation Covers. Sci. Total Environ. 2007, 378, 195–198. [Google Scholar] [CrossRef]
  42. Bertol, I.; Luciano, R.V.; Bertol, C.; Bagio, B. Nutrient and Organic Carbon Losses, Enrichment Rate, and Cost of Water Erosion. Rev. Bras. Cienc. do Solo 2017, 41, e0160150. [Google Scholar] [CrossRef]
  43. Goulding, K.; Murrell, T.S.; Mikkelsen, R.L.; Rosolem, C.; Johnston, J.; Wang, H.; Alfaro, M.A. Outputs: Potassium Losses from Agricultural Systems. In Improving Potassium Recommendations for Agricultural Crops; Springer: Cham, Switzerland, 2020; pp. 75–97. [Google Scholar] [CrossRef]
  44. Durán Zuazo, V.H.; Martínez Raya, A.; Aguilar Ruiz, J. Nutrient Losses by Runoff and Sediment from the Taluses of Orchard Terraces. Water. Air. Soil Pollut. 2004, 153, 355–373. [Google Scholar] [CrossRef]
  45. Rocha Junior, P.R.D.; Andrade, F.V.; Mendonça, E.D.S.; Donagemma, G.K.; Fernandes, R.B.A.; Bhattharai, R.; Kalita, P.K. Soil, Water, and Nutrient Losses from Management Alternatives for Degraded Pasture in Brazilian Atlantic Rainforest Biome. Sci. Total Environ. 2017, 583, 53–63. [Google Scholar] [CrossRef]
  46. Xue, L.; Fu, J.-D.; Zheng, W.-G.; Zhao, H.-J.; Tan, J.-D.; Zhang, X.-P. Effect of Litterfall Cover on Runoff and Potassium Loss in Pinus Caribaea Stands. For. Res. 2010, 23, 510–514. [Google Scholar]
  47. Pisani, O.; Liebert, D.; Bosch, D.D.; Coffin, A.W.; Endale, D.M.; Potter, T.L.; Strickland, T.C. Element Losses from Fields in Conventional and Conservation Tillage in the Atlantic Coastal Plain, Georgia, United States. J. Soil Water Conserv. 2020, 75, 376–386. [Google Scholar] [CrossRef]
  48. Daniels, M.B.; Fryer, M.S.; Fernandes, S.B.; Slaton, N.A.; Sharpley, A.N.; Webb, P.; Riley, L.; Burke, J.; Berry, L.G.; Roberts, T.; et al. Potassium Losses in Runoff from Cotton Production Fields. Agron. J. 2023, 115, 1666–1677. [Google Scholar] [CrossRef]
  49. Tate, R.L. Fundamentals of the Sulfur, Phosphorus, and Mineral Cycles. In Soil Microbiology; John Wiley & Sons: Hoboken, NJ, USA, 2020; pp. 477–510. [Google Scholar] [CrossRef]
  50. Kabata Pendias, A. Trace Elements in Soils and Plants, 4th ed.; CRC Press: Boca Raton, FL, USA, 2011. [Google Scholar]
  51. Reimann, C.; de Caritat, P. Chemical Elements in the Environment. Factsheets for the Geochemist and Environmental Scientist; Springer: Berlin/Heidelberg, Germany, 1998; pp. ix+397p. [Google Scholar]
  52. Zakari, S.; Liu, W.; Wu, J.; Singh, A.K.; Jiang, X.; Yang, B.; Chen, C.; Zhu, X. Decay and Erosion-Related Transport of Sulfur Compounds in Soils of Rubber Based Agroforestry. J. Environ. Manag. 2020, 274, 111200. [Google Scholar] [CrossRef] [PubMed]
Figure 1. Location of the study area and sampling areas.
Land 14 01040 g001
Figure 2. The amount of sediment recorded (TSW) in each campaign for each type of land use (open forest (OF), pine afforestation (PA), pine afforestation with thinning (TPA), and barren land (BL) (× represents the mean value and the lower and upper box limits represent the first and third quartiles, respectively). A different lowercase letter means significant differences at the 95% level between campaigns, and a different capital letter means significant differences between land uses.
Land 14 01040 g002
Figure 3. Correlation matrix between soil particle size and nutrient content (total nitrogen (N), phosphorous (P), potassium (K), and sulfur (S)) in soils under open forest (OF), pine afforestation (PA), and barren lands (BL).
Land 14 01040 g003
Table 1. Average characteristics (and standard deviation) of the soil surface (0–2 cm) in the <0.063 mm fraction in open forest and (OF) and pine afforested areas (PA), in thinned afforested areas (TPA) and in barren lands with degraded soils (BL), and of the sediments collected in each land use/land cover (SOC: soil organic carbon; ACF: active carbon fraction; SCF: stable carbon fraction; N: total nitrogen; P: phosphorus; K: potassium and S: sulfur).
Land Use Clay
(%)
Silt
(%)
Sand
(%)
SOC
(%)
ACF
(%)
SCF
(%)
Ratio
ACF/SOC
Ratio
ACF/SCF
N
(%)
C/N
ratio
P
(mg/kg)
K
(mg/kg)
S
(mg/kg)
OF
Soil
<0.063 mmmean14.24 abB71.90 aA13.85 aA3.00 bB2.25 cB1.24 bB0.639 aA1.82 bA0.30 bB11.62 cA253.2 aA9629 aA656 aA
std2.193.531.780.750.370.090.020.160.040.1626.81108120
Sedimentmean11.43 A74.20 A14.37 A1.83 A1.17 A0.66 A0.63 A1.86 A0.17 A11.0 A251.7 A11,138 B857 A
(n = 36)std2.584.484.940.480.320.180.090.20.030.527.51885230
PA
Soil
<0.063 mmmean16.60 bB70.10 aA13.30 aA2.60 bA1.69 bA0.91 bA0.649 aA1.86 bA0.25 bA10.34 bA296.0 aB12,236 bB703 aB
std3.323.661.620.50.340.180.030.190.040.5620118458
Sediment PAmean11.21 A65.81 A22.99 B3.08 A2.02 A1.06 A0.665 A1.91 A0.21 A14.7 B256.8 B9679 A906 C
(n = 36)std1.324.435.070.970.670.320.0230.20.040.540.21585 C342
Sediment TPAmean14.26 B66.37 A19.3 bB2.62 A1.75 A0.87 A0.667 A2.01 A0.17 A15.4 dB195.0 A10,941 A4211
C (n = 15)std1.092.73.160.460.310.170.020.240.031.320.190454
BL
Soil
<0.063 mmmean11.9 aA72.86 aA15.75 aA0.21 aB0.12 aB0.10 aB0.567 aB1.41 aB0.06 aA3.57 aB288.0 aA14,797 bB849 bA
std1.848.898.670.130.090.050.10.160.010.1616.83139130
Sedimentmean10.54 A70.62 A18.84 B0.007 A0.002 A0.005 A0.286 A0.50 A0.05 A1.40 A267.8 A10,568 A1509 B
(n = 15)std2.572.544.380.00200.0010.0020.010.010.0426.21468222
A different lowercase letter means significant differences at 95% level between land uses, and a different capital letter means significant differences between soils and sediments.
Table 2. Characteristics of the rainfall recorded in the study campaigns.
CampaignTotal Rainfall (mm)Number of Erosive EventsPmax Event (mm)Ihmax (mm/h)Total Erosivity (MJ/ha·mm/h)Max Event Erosivity (MJ/ha·mm/h)
1230.41075.613.0206.0107.0
279.0436.46.235.524.1
369.8253.83.627.315.0
479.2251.021.8313.5298.8
552.6316.814.876.967.7
629.0121.86.031.321.4
790.4264.211.8123.097.0
Table 3. Loading matrix of retained components and variance explained by each of them obtained in the PCA of sediments recorded in each land use (OF: open forest; PA: pine afforestation; TPA: pine afforestation with thinning; BL: barren lands). (Bold number indicates loadings > 0.4).
OF TPA
PC1PC2PC3 PC1PC2PC3PC4
Clay0.5300.688−0.284 −0.7000.193−0.3100.342
Silt−0.6590.329−0.505 −0.8170.0830.1260.024
Sand0.327−0.6500.622 0.901−0.123−0.019−0.123
SOC0.950−0.119−0.031 0.8750.196v0.344−0.049
ACF0.952−0.086−0.021 0.8230.220−0.416−0.159
SCF0.838−0.164−0.041 0.834−0.0070.0960.360
N0.9460.139−0.068 0.8550.172−0.193−0.071
K0.3670.8390.197 −0.3260.542−0.2230.696
P0.2840.5670.610 0.5060.7030.1530.380
S−0.744−0.1990.380 0.1660.4140.807−0.084
TSW−0.494−0.1820.075 0.159−0.792−0.1760.393
Prec0.570−0.495−0.044 0.696−0.1510.4680.280
R0.262−0.607−0.527 0.258−0.7610.1950.368
Variance (%)43.3321.3912.08 44.6118.1711.259.99
PA BL
PC1PC2PC3PC4PC1PC2PC3PC4
Clay−0.6630.1840.481−0.2350.108−0.8100.3530.044
Silt−0.8220.094−0.0110.1120.704−0.325−0.164−0.447
Sand0.904−0.132−0.113−0.010−0.6590.5770.0180.378
SOC0.8820.174−0.021−0.3310.9660.0070.0100.152
ACF0.8400.193-0.088−0.4010.948−0.056−0.0700.160
SCF0.814−0.0030.2340.1220.8800.1250.1610.117
N0.8650.155−0.055−0.1770.854−0.207−0.0510.406
K−0.3010.5360.722−0.1160.1220.5280.450−0.087
P0.5230.7040.3360.2100.6970.4290.0530.312
S0.1650.438−0.2070.8170.7500.052−0.1610.244
TSW0.183−0.8060.430−0.0150.4350.303−0.589−0.384
Prec0.768−0.0860.3660.3560.6390.4000.138−0.552
R0.257−0.7550.3000.3060.2890.0700.840−0.205
Variance (%)45.1017.9510.6510.1546.3114.4611.449.46
Disclaimer/Publisher’s Note: The statements, opinions and data contained in all publications are solely those of the individual author(s) and contributor(s) and not of MDPI and/or the editor(s). MDPI and/or the editor(s) disclaim responsibility for any injury to people or property resulting from any ideas, methods, instructions or products referred to in the content.

